production practices affecting yield and sugar content of
TRANSCRIPT

.,
Production Practices Affecting Yield and Sugar Content of Sugar Beets Grown in Ontario, Canada
1961 and 1962 1
C. S. BALDWIN, C. E. BROADWELL AND .J. F. DAvIs 2
Received for publica/ion Sep lembel' 8, 19°4
This study is a cooDerative project involvin~ personnel of the Farmers and Manufacturers Beet Sugar Association, Saginalll, Vfichigan, Michigan State University, East Lansing, Michigan, Canada and Dominion Sugar Company, I.td., Chatham, Ontario, and the 'Western Ontario Agricultural School , Ridgetown, Ontario.
The objective is to investigate the production practices currently in use by Ontario sugar beet growers and correlate these practices wi th the resul tant yield o[ roots, gross pounds of sugar per acre and the percent sugar. Data on percent sug'ar were available because the Canada and Dominion Sugar Company sample each load of beets delivered by the farmers for sugar content.
Data were collected from approximately 1700 farmers representing some 20,000 acres of beets. The data were coded and punched on IBM cards and then analyzed through the facilities of the Michigan State Cniversity and under direction of personnel of the Soil Science Department.
Various comparisons are possible with these data and particular import can be placed on the percent sugar and gTosS pounds of sugar per acre as affected by the various production practices .
Procedure
Standard lBY! cards were used and the following ilems coded on the cards:
1. District. Th ree dis tricts. 2. Year. 1961 to 1963. 3. Fieldman. Nine in total. 4. Soil texture. Clay and clay loams, sand anel sandy Ioams. combinations. 5. Tile drained. Yes, no. partly. 6. Pounds seed per acre. (monogerm:: 0.0.5, 0.6·0.9, 1.0·1.4, 1.5·1.9, 2.0·2.4. 2.5·2.9,
3.0·3.4 , 3.5-3.9 , over 3.9. 7. Pounds seed per acre ( processed). Same breakdown as monogerm.
1 Contribution of the Soil Science Department of MiChigan State UniverSity, the Western Ontario AgriCUltural School, and the Canada and Dominion Sugar Company, Ltd. Authori zed for publicatio n by the Director as Journal Articl e No. 3390 of the MiChigan Agr. Expt. Sta., E. Lansing, Mich. Partial requirement of the senior author for tulfillm,nt of the Ph.D. degree.
2 Graduate student in Soi l Science, MiChigan State Universit y and Chief Instructor and Extension Specialist , \Vestern Ontario Agricultural School; and Research Superviso r, Canada and Dominion Sugar Company; and Professor of Soil Science, Michigan Stale University , rcspecti"ely.

510 JOUR NAL OF THE A. S. S. B. T.
8. Pounus seed per acrr (whol e). 0·0.9, 1.0· 1.9, 2.0·2.9, 3.0 ·3.9, 4.0·4.9, 5.0·5.9, 6.0·6.9, 7.0·7.9, mer 7.9.
9. Pounds seed per acre. Combina l ion (whole·processed·monogenn). 0·0.5, 0.6-0.9, 1.0-1.4, 1.5·1.9, 2.0·2.4, 2.5 ·2.9, 3.0-3.4, 3.5·3.9, 4.0·4.5, over 4.5.
10. Prev ious crop (1st year). Corn, vegctables, beans, wheat, spring- grain, clover, alfalfa, sweet c1over, grass sod, tobacco , beets, potatoes. others.
II . Legumes preceding' years. 1st year, ~nd year . 3r d year, none. 12. Manure application (tons per acre). J ·4, 5 ·9, 10·14, 15·19, over 19, none. 13. Manure and yea r of application. 1963, 1962, 1961, 1960, 1959, 1958, 1957, none. 14. Plowing' practice. lall, spring, none. 15. Depth of plowing (inches). L ess than 3.9, 4.0·5.9, 6.0·,.9, 8.0-9.9, 10.0·11.9, OI'Cr
12.0, not plowed. 16. So il test. Yes, no . 17. So il test recommendat ion followed. Yes , no , part ly. 18. Tim,·s worked between plowing and planting. I, 2, 3, 4, 5. 6, 7, 8. 9, over 9. 19. Fertilizer a ppli ca t ion method. Plo" down , broadcast, drill, cOl'nb inat ion. 20. Po und s fertilizer with dril l (pounds per acre). None, 1-99 , 100·199, 200·299, 300·
399, 400·499, 500·599, 600·699, 700 and over. 21. Total pounds fert ili zer u sed (po und s per acre). None, I 199, 200·399, 400·599,
600-799 , 800·999, 1000-1199, 1200· 1399 , 1400 and over. 22. Fertilizer ratio used with dri ll. O·x·x, 1-1· 1, 1·2-3, J· 3· J , J ·4·2, 1-4-4, 1·6·5,
1·6·3, others. 23. Ni trogen rnaterial used. '\mmonium n itrate, urea, anhydrous ammonia , nitrate
urea, aqua ammoni a, cyanamid, others , none, combinCltioll . 24. Nitrogen application method. Pre·plant, side·dress, combination, none. 25. Time of side·dressing nitrogen. Before June I. June 1·]4, June 15·30, July 1· 1-1.
July 15·31, Aug ust J .]4, August 15 and later, no side·dressing·. 26. Total pounds per acre nitrogen used. 0·19, 20·39, 40·49, 50·59, 60·69. 70·79, 80·
89, 90-99, 100-119, 120 OT more. 27. Total pounds per acre phosphate (P,O, ) used. 0·49, 50·74, 75·99, 100· 124, 125 ·
149, 150.174, 175·199, 200 ·224, 225·249, 250 or more. 28. Total pounds per acre potash (KzO) used. 0·24, 25·49, 50·74, 75·99 , 100· 124, 125·
149, 150·174, 175·199, 200 ·224. 225 Or more. 29. Date of planting, actual planting date or average planting date, e.g. Mar. 1·31,
Apr. 1·30, M ay 1·31, June 1·30. 30. R ow width (inches). Less than 22, 22, 24, 26, 28, 30, 32. 34, 36, 38 anel over. 3!. Date of harvest. Before Oc t. 1. Oct. 1·7, Oct. 8·14, Oct. 15·21, Oct. 22·28 , Oct .
29·)lov. 4, Nov. 5·11 , Nov. 12·IM, after Nov. 18. 32. M ino r elelnents. No minor elements , boron, manganese, sodium, magnesium, zi nc ,
others, combi nation. 33. Acres harvested. 34. Total tons beets. 35. Percent sugar. 36. Tota I tons sugar. 37. County. Ei ght counties. 38. T ownShi ps. Eighty tow nShips. 39. T ons per acre beets. 40. Date planten. llefore Ma r. 21 , Mar. 21·30, Apr. 1·10, Apr. 11 ·20, Apr. 21·30, Mav
1·1 0, May 11·20, Ma y 21·30, May SJ·June 9, after June 9.
This coding required 60 spaces on the standard IBM card. Prior to the card codi ng the data were recorded on stClndard tabulation sheets, then submitted to the Statistical Laboratory where the card punching and the analyses were made.
Following is a list of comparisons made: 1. CoaTSe-texlured versus fine-tex tured soils. 2. Tile drainage. S. The effect of pTevious crops on yields. 4. The effect of legu mes in preceding years. 5. Manure application- amount. 6. Manure, year of application.
511 VOL. 13, ;\10. 6, JULY 1965
7. Fall plowing versus spring plowing. 8. Depth o[ plowing. 9. Soil test taken.
10. Number of times field was worked prior to planting. II. Method oE fertilizer application. 12. Pounds of fertilizer applied with the drill. 13. Total pounds of fertilizer applied. 14. Fertilizer Tatio used with the drill. 15. Nitrogen material used. 16. \fethod of applying additional nitrogen. 17. Time of side-dressing additional nitrogen. 18. Total pounds of nitrogen applied. 19. Amounts of phosphate applied. ~O. Amounts of potash applied. 21. Date of planting. 22. Row width. 23. Date of harvest. 24. Relationship of planting elate and han est date. 25. Relationship of nitrogen materials and time of side-dressing of nitrogen. 26. Relationship of tile drainage and total pounds of fertilizer used. 27. R elationship oE plowing practice anel number of times field worked. 28. Relationship of plowing practice anel depth of plowing. 29. Relationship of plowing practice and dat.e of planting.
Results and Discussion
Data for 1% 1 and 1962 are presented together with the 'weighted averages for the two years. Unless otherwise stated, the discussion accompanying each table pertains to the weighted averages. Approximately 80 percent of the acreage of beets is grown on fine-textured soils. Therefore, possibly more confidence can be placed on results from these soils. Ilowever, where results from coarse-textured soils are presented sufficient acreage exists so that reasonable confidence is assured.
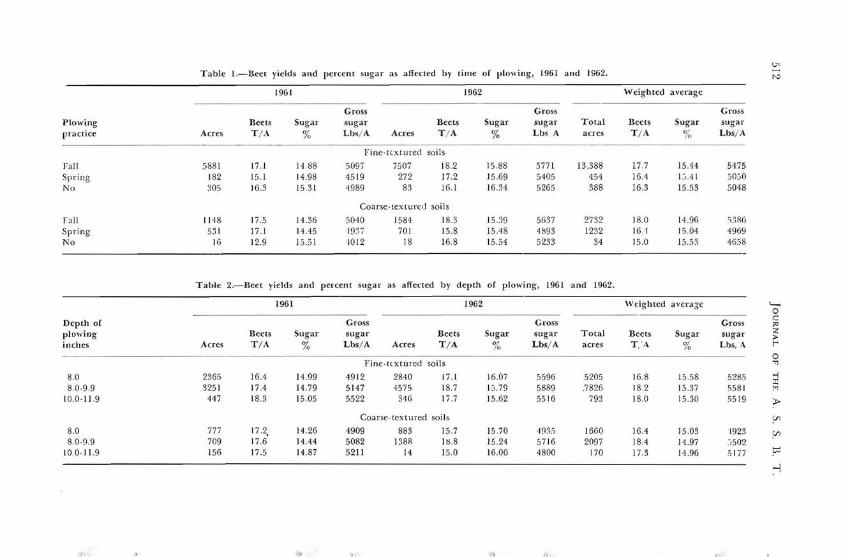
In Ontario, fall plowing is the accepted practice on the finetextured soils. Results from this survey Crable I) tend to su bstantiate this. However, such a practice is not the case with coarse-textured soils where spring plowing is the recommended practice . The results, however, indicate a similar tr"end as on the fine-textured soil, that fall plowing is superior to spring plowing insofar as the yield of beets and gross sugar are concerned.
The comparison of the depth of plowing in Table 2 indicates that on both the coarse- and the fine-textured soils there is a tendency for the yield of beets and gross sugar to increase as depth of plowing increases to 8 inches in depth . On the finetextured soil this influence continues to the 8 to 10 inch depth. The depth of plowing did not affect the percent sugar of roots produced on the coarse-textured soils but on the fine-textured soils there was a trend for the percent sugar to decrease with increasing- depths of plowing.
<.J<
Table I.-Beet yields and percent sugar as affected by time of plowing, 1961 and 1962. tv
1961 1962 \Veighted average
Plowing practice Acres
Beets T / A
Sugar
%
Gross sugar Lbs/ A Acres
Beets T / A
Sugar
%
Gross sugar Lbs A
Total acres
Beets T / A
Sugar
%
Gross sugar Lbs/ A
Fine -((xtured soils
Fall 5881 17.1 1488 5097 7507 18.2 15.88 5771 13,388 17.7 15 .44 5475 Spring 182 15.1 14.98 45 19 272 17.2 15.69 5405 454 16.4 I j.4 1 }O50
No 305 16.3 1531 4989 83 16.1 16.34 5265 388 16.3 15.53 5048
Coarse- textured soils
Fall 11 48 17.5 14.36 5040 1584 18.3 15.39 5637 2732 18.0 14.96 :') :)86
Spring' 53 1 17.1 14.45 ' 19 ~ 7 701 15.8 15 .48 4~93 1232 16.1 15.04 1969 No 16 12.9 15.51 1012 18 16.8 15.54 5233 34 15.0 15.53 4658
Table 2.-Be« yi.eJds and percent sugar as affected by depth of plowing, 1961 and 1962.
Depth of plowing inches Acres
1961
Beets Sugar T / A %
Gross sugar Lbs/ A Acres
1962
Beets Sugar T / A %
Gross sugar Lbs/ A
Total acres
'""righted averaJe
Beets Sugar T ,'A %
Gross sugar Lbs, A
'---< 0 C ?' Z ;>t"'
Fine-textured soils 0 .."
8.0 8.0-9.9
2365 325 1
16.4 17.4
14.99 14.79
4912 5147
2840 4575
17.1 18.7
16.07 10.79
5596 5889
5205 _7826
16.8 18.2
15.58 15.37
5285 558 1
-I :I: M
10.0 -11.9 447 18.3 15.05 5522 346 17.7 15.62 55 16 793 18.0 15.30 5519 );>
Coarse-tex tured soils (J)
8.0 8.0-0.9
10.0-11.9
777 709 156
17.2, 17.6 17.5
14.26 14.44 14 .87
4909 5082 521J
883 1388
14
15.7 IM.8 15.0
15.70 15 .24 16.00
·1035 57 16 4800
1660 2097
170
16.4 18.4 17.3
15 .03 14.97 14.96
1923 :,502 5177
(J)
tc
-l
t ,
VOL. 13, No.6, JULY 1965 513
The beneficial effect of mtnlmum tillage is demonstrated in Table 3. The times worked refer to the number of times a fidd was tilled after plowing and prior to planting. Minimum tillage is defined as the least amount of tillage required to produce a satisfactory seedbed. Yields are maintained at a high level where fields are worked only 2 or 3 times prior to planting. The highest yield of beets and gross sugar per acre occurred on fields that were worked twice. An additional advantage of minimum tillage is the reduction in expense involved in seedbed preparation.
With few exceptions, beet planting in Ontario occurs during the months of April and May. For this survey, ten day planting intervals were recorded Cfable 4). Beets planted on coarsetextured soils during the month of April produced a higher yield of roots and gross sugar than where beets were planted at a later date. The April II th-20th period had the highest percent sugar content.
On fine-textured soils, the effect of date of planting, Table 4 shows a somewhat different trend than that for the coarsetextured soils. The average yields of beets and gross sugar decreased from the earliest planting date to the latest planting date. A marked decline in yield occurred at the end of April , similar to the coarse-textured soils. The percent sugar increased up to the end of April and then decreased sharply after this date. This undoubtedly accounts for the lower yield of gross sugar which occurred at this date. In Ontario, the results of this survey tend to substantiate the recommended practice of planting beets at an early date.
In the Eastern United States and Ontario, there have been considerable data obtained during the past years on the influence of row width on the yield of beets. In Ontario, the recommendation is to plant beets in a 24-inch row width. Table 5 illustrates for fine-textured soils a rather marked advantage of l)arrow row width plantings, i.e. insofar as the yield o[ beets and gross sugar is concerned. Beyond the 26-inch row width, there is a rather definite reduction occurring in the yield of beets and gross sugar. For the ccarse-textured soils the same general trend occurs, but there seems to be possibly even a more distinct reduction in yield beyond the 26-inch row width. The influence on the yield of gross sugar arises from beet tonnage differences rather than from an influence on the percent sugar.
On fine-textured soils (Table 6), the gTeatest response to method of fertilizer application occurred where a combination of drill and broadcast methods were used. The drill method of fertilizer application refers to fertilizer that was applied at planting time, in a band to one side and below the seed or directly

<.].
>l'
Table 3.-Beet yields and percent sugar as affected by the number of limes a field was worked prior to planting, 1961 and 1962. (Fine lextured soils)
1961 1962 \Veiglued average
Gross Gross Gross Times Beets Sugar sugar Beels Sugar sugar TOla l Beels Sugar sugar worked Acres T /A % Lbs/A Acres T / A % Lbs/ A acres T / A / 0 Lbs/ A o ·
2 154 19.4 14.43 5605 89 19.2 15.1 6 6202 243 19.3 15. 06 5824
3 386 16.6 14.60 4845 732 18.7 16M 5996 1100 18.0 15.56 5611
4 1498 16.7 15.02 5007 1472 17.4 16.Q7 5595 2970 17.1 15.54 5298
5
6
7
8
1534
1329
864
366
16.8
17.5
17.2
16.3
14.79
15.01
14.90
14.66
4976
5243
5121
4791
1734
2255
1106
265
18. 0
18.3
18.6
17.4
15.80
15.83
15.78
15.7 1
5696
5780
5854
5458
3268
3584
1970
631
17 .1
18.0
18.0
16.8
15.33
15.53
15.39
15.10
5358
5581
5533
5071
'-< 0 c "Z > t"'
0 "l
-l:r: M
» en
en
~
:J
"

~
Table 4.-Beet yields and percent sugar as affected by date of planting, 1961 and 1962. <0 r-
1961 1962 W eighted average 5'"
Cross Gros.Ii Gross ~ Date of Beets Sugar Bugar Beets Sugar sugar Total BeeLs Sugar sugar 0
planting Acres T / A % Lbs/ A Acres T I A % Lbs/ A acres T / A % Lbs/ A ?
Coarse-lex lured soils '--<
c:: r ><:
Apr. 1·10 133 20.2 13.77 5569 52 19.8 16.64 6584 185 20.1 14.58 5854 ~
<.D April 11·20 56 20.4 14.15 5796 702 18.8 1567 5903 758 18.9 15.56 5895 cr>
<..y,
April 21 ·30 56 18.9 15.1 2 5707 79 1 19.6 15.G3 5905 847 19.6 15.04 5892
May 1·10 361 17.9 11. 15 5062 320 13.3 15.59 4146 681 1".7 14.83 4632
Ma:. 11 ·20 758 16.6 14.68 4885 110 15.8 1576 4965 868 16.5 11. 82 4895
Ma y 21·3 0 174 16.7 14. 17 4724 G8 12.4 1586 3938 242 15.5 14 .64 4503
After ]lIay 30 157 16.3 14. 38 467" 260 14.5 15.33 4443 417 15.2 14.97 4530
Fine·tex tured soils
Apr. 1·10 641 20.0 14 .65 5871 66G 19.5 15.65 6092 1307 19.8 15.16 5981
Apr . 11·20 218 19.7 13.73 5416 33 13 18.6 15.82 5872 356 1 18.9 15.69 5844
Apr. 21·30 \:, I 19.1 14.77 5633 2289 18.0 1599 5765 2440 18.1 15.9 1 575 7
Ma) 1·10 1068 17 .5' 14 .94 52 16 769 16.1 16.06 5173 1837 16.9 15.41 5198
May JI ·20 2801 16.4 14.90 4892 344 15.9 15.86 504 1 3 145 16.4 15. 00 4908
May 21·30 1076 15.3 15. 32 4676 62 13.4 16.27 4367 11 38 15.2 15.37 4659
(J",
(J",
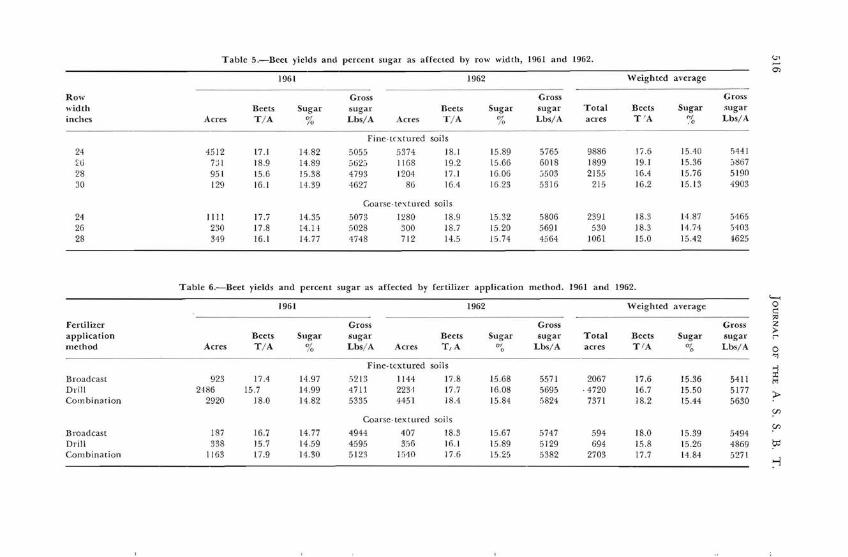
Table 5.-Beet yields and percent sugar as affected by row width, 1961 and 1962.
1961 1962 Weighted a\'erage
<.J'
0)
Row width inches Acres
Beets T / A
Sugar
%
Gross sugar Lbs/ A Acres
Beets T / A
Sugar
%
Gross sugar Lbs/A
Total acres
Beets T'A
Sugar 01 .0
Gross sugar Lbs/A
Fine·tex tured soils
24 4512 17.1 14.82 5055 5374 18. 1 1589 5765 9886 17.6 15.40 ,,441
~ti 7JI 18.9 14.89 :;li2:; 1168 19.2 15.66 6018 1899 19. 1 15.36 ~867
28 95 1 15.6 15.38 4793 1204 17.1 16.06 :;503 2155 16.4 15.76 5 190 30 129 16.1 )4.39 4627 86 16.4 1623 53 16 215 16.2 15. 13 4903
Coarse-textured soils
24 1I1I 17.7 14.35 5073 1280 18.9 15.32 5806 2391 18.3 14.87 5165 26 230 17.8 14.11 5028 300 18.7 15.20 5691 530 18.3 14.74 5403 28 319 16.1 14.77 1748 712 14.5 15.74 4564 1061 15.0 15.42 t625
Table 6.-Beet yields and percent sugar as affect<:d by fenilizer application method. ]961 and 1962. '-<
1961 1962 Weighted average 0 C ;<J
Fertilizer application Beets Sugar
Gross sugar Beets Sugar
Gross sugar Total Beets Sugar
Gross sugar
Z )r
method Acres T / A % Lbs/ A Acres T /A 01 0 Lbs/A acres T /A 01
0 Lbs/ A 0 "'1
Broadcast 923 17.4 14.97
Fine-textured soils
:;2 13 1144 17.8 15.68 5571 2067 17.6 15.36 5411 >-l:x: to
Drill Combination
2486 2920
15.7 18.0
14.99 14.82
4711 5335
2231 4451
17.7 18.4
16.08 15.84
5695 5824
·4720 7371
16.7 18.2
15.50 15.44
5177 5630 >
Coarse-textured soils '!'
Broadcast 187 16.7 14.77 4944 407 18.3 15.67 5747 594 18.0 15.39 5494 en
Drill 338 15.7 14.59 4595 356 111.1 15.89 5J29 694 15 .8 15.26 4869 ?= Combination 1163 17.9 14.30 5 123 1">10 17.6 1525 5382 2703 17.7 14. 84 0271
:l
VOL. 13, No. 6, JULY 1965 517
below the seed. The broadcast method seemed to have an advantage over the drill method insofar as the yield of beets and gross sugar are concerned. However, the percent sugar vvas not influenced by the method of fertilizer application. On coarse-textured soils the grea test yield response occurred when the fertili zer was broadcast. Broadcasting the fertilizer showed a pronounced increase in the yie ld of beets and gross sugar over the drill method and a lesser response over the combination method. On the coarse-textured soils the percent sugar appeared to be influenced by the method of fertilizer app lication, with the broadcast method showing the highest percent sugar.
The effect of total pounds of potash per acre applied on fine-textured soils on yields of roots and gross sugar is indica ted in Table 7. Varying the rates of potash had virtually no influence on the percent sugar. However, the yield of beets and gross sugar increased as the amount of potash increased over the entire range of potash application . In Ontario, it is generally accepted that most cf the fine-textured soils in the beet area are fairly well supplied with potassium; therefore, little response to potash fertilization is anticipated .
·With the coarse-textured soils, Table 7, as with the finetextured soils, there seems to be approximately the same genera l trend occurring with the exception being that possibly minor fluctuations exist in the percent sugar.
An interesting compa rison was obtained on the fine-textured soils concerning the method of applying the nitrogen fertilizer. There seemed to be little, if any, ll1fluence on the percent sugar due to the various methods of applying the nitrogen.
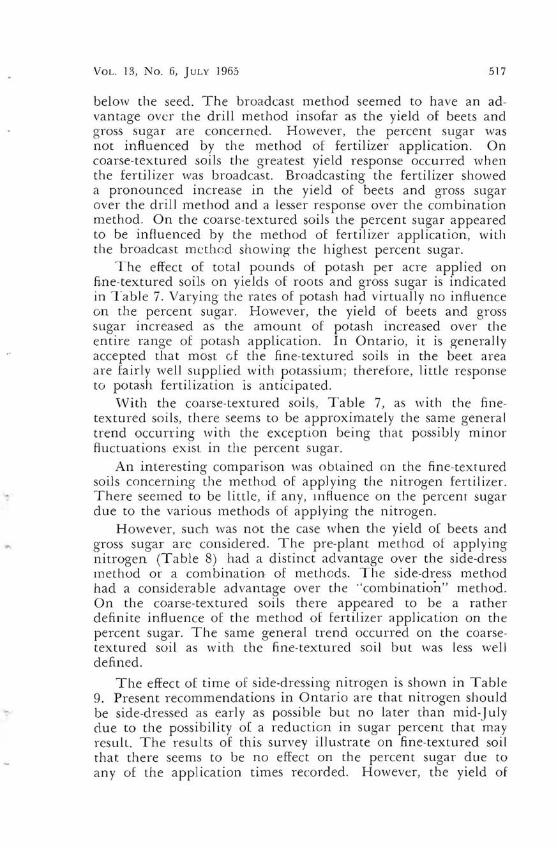
However, such was not the case when the yield of beets and gross sugar are considered. The pre-plant method of app lying nitrogen (Table 8) had a distinct advantage over the side-dress method or a combination of methods. The side-dress method had a considerable advantage over the "'combination" method. On the coarse-textured soils there appeared to be a rather definite influence of the method of fertilizer application on the percent sugar. The same general trend occurred on the coarsetextured soil as with the fine-textured soil but was less well defined.
The effect of time of side-dressing nitrogen is shown in Table 9. Present recommendations in Ontario are that nitrogen should be side-dressed as early as possible but no later than mid-July due to the possibility of a reduction in sugar percent that may result. The results of this survey illustrate on fine-textured soil that there seems to be no effect on the percent sugar due to any of the application times recorded. However, the yield of

<J\
CXJ
Table 7.-Beet yields and percent sugar as affected by total pounds K,O / acre, 1961 and 1962.
1961 1962 \-\' eigh ted average
Total K~>O
Lbs/A Acres Beets T / A
Sugar 0
0
Gross sugar Lbs/ A Acres
Beets T ' A
Sugar c' 10
Gross sugar Lb"A
Total acres
Beets T / A
Sugar
%
Gross sugar Lbs/ A
Fine·tex tured soil s
0 24 545 J5.5 14.84 46 15 486 18.6 16.32 6075 1031 17.0 15.54 5303
25 49 1657 15.7 1.0.11 4740 J5 71 17.0 16.00 543 1 3228 16.3 15.54 5076
50 74 1432 16.8 14.96 5022 1900 18.1 15.9 1 ~)758 3332 17.5 1550 5442
75 99 1238 18.0 14.85 5343 1375 18. 1 15.77 59 12 26 13 18 . 1 15.33 5642
100 . 124 955 18. 3 14.82 5433 1769 17 .8 15.8 1 5632 2724 18.0 15.46 .562
125 . 149 221 17.6 14.99 5279 357 19.9 15.62 6227 578 19. 0 15.38 c·865
150 . 174 147 17.6 15.11 5312 162 20.0 15. 76 6291 309 18.9 15.45 5825
17 5 or more 173 21.2 13.81 5815 242 19.4 15. 73 608U 415 20.2 14.93 ')97 0
Coarse-textured soils
'-< 0 c:: " Z
o - 24 73 14.9 14 .39 4290 30 18.0 15.80 5700 103 15.8 14 .80 470 1 :> r
25 ·19 357 16.2 14 .7 1 4768 247 18.5 13.60 5025 604 17.1 14.26 487 3 0 50 74 583 17.0 14 .63 4983 299 16.9 l j.82 5347 882 17.0 15.0" 5106 "1
75 99 139 17.9 14.60 5230 40~ 17.6 16.0 1 564 1 548 17.7 15.72 :>;"):37 -l :I:
100 124 315 18.6 13. 76 5 114 567 17 .2 15.58 5360 . 882 17.7 14.93 5272 r-l
125 149 136 20.0 14.45 5785 395 16.5 15.37 5086 531 17.4 15. 13 5265 >150 174 31 18. 1 13 79 5000 188 18.3 15.65 5728 219 18.3 15.39 5625 en
175 or more 61 16.3 13.64 1453 95 19.8 15.33 6048 156 18.4 14 .67 5424 en
~ H
•
Table S.-Beet yields and percent sugar as affected by nitrogen application method, 1961 and 1962. <0,.
1961 1962 Weighted average
C'litrogen Gross Gross Gross "" application Beets Sugar sugar Beets Sugar sugar Total Beets Sugar sugar Z method Acres T/A % Lbs/ A Acres T / A % Lbs/ A acres T I A % Lbs/,\ 0
Fine-Lcxtured soils .0">
Pre· plant Side·dress ,COInbination
980 3820
85
19.1 16.8 17.0
14.77 14.97 15.26
5638 5041 5178
1168 5199
19.3 18.4 16.1
15.7 15.9 16.1
6045 .,863 5200
2148 9019
93
19.2 17.7 16.9
15.28 15.51 L'.33
5859 5515 5180
c...... C t'" >< ~
Pre-plant Side-dress
365 902
18.4 17.4
11.35 14.28
Coarse-textured soils 5285 589 18.5 4970 1333 17.5
14.7 156
:AS I 5480
954 2235
18.5 17.5
14.57 15.07
5387 5274
<D 0">
'"' -Combination 62 16.0 14.64 4683 365 16.0 15.8 504:) 427 16.0 15.63 4992
Table 9.-Beet yields and percent sugar as affected by time of side-drpssing of nitrogen. 1961 and 1962.
1961 1962 Weighted average
Gross Gross Gross Time of Beets Sugar sugar J:)eets Sugar sugar Total Beets Sugar sugar side-dressing Acres T / A % Lbs/ A Acres T IA % Lbs/ A acres T I A % Lbs/ A
Fine-textured soils Prior to June 1st II 19.1 14.90 r,690 304 17.7 15.58 5515 315 17.S 15.56 5556
June 1 - 14 735 IS.4 14.81 5462 2101 ]8.9 16.03 6072 2836 IS.8 15.71 5914 June IS . 30 2315 16.8 14.91 5005 2745 IS.I 15.88 5758 5060 17.5 15.44 5413 July I - 14 802 15.6 15.34 4773 106 16.4 15.86 5190 908 15.7 15.40 4822 After July 14 18 14.8 15.75 4666 18 14.8 15.75 4666
Coarse-textured soils Prior to June 1st 43 19.9 13.36 5306 152 19.9 15.37 6107 195 19.9 14.93 5930
June I - 14 272 19.1 13.99 5337 395 IS.6 15.87 5897 667 18.8 15.10 5669 June 15 - 30 588 16.5 14.51 1802 745 16.2 15.55 5027 1333 16.3 15.09 4928 July I - 14 51 14.7 14.37 4239 10 16.3 16.38 5340 61 15.0 14.70 4419 '"'
<D

v · I':)
o
Table 10.-Beet yields and percent su ga r as affec ted by total pounds o f nitro gen per acre, 1961 and 1962. (Fine·textured soils)
1961 1962 '''eighted avera]e
Gross Gross Gross T o tal N Beets Sugar sugar Beets Sugar sugar T o ta l Bee ts Sugar sugar Lbs/ A Acres T / A Lbs/A Acr es T / A Lbs/A acres T ,A ". Lbs/ A % % 10
20 or less 310 14.0 15 .3 1 4276 307 14.9 16.00 4770 653 14.4 1.5.6 3 4508
20 :19 8~0 15.5 15.0 1 4fil>" 1026 15.9 11; .01 J086 I S46 15.7 10.74 4899
40 49 687 1:;.9 15.2 1 484 1 554 17 .4 16. 14 ;,603 124 1 16.6 1.'\.63 5 18 1
50 59 1230 17.2 15.06 5177 S(i5 17.7 16.07 5676 2095 17.4 15.48 5~~~
60
70
80
90
100
120
09
79
89
99
11 9
o r more
668
8 14
7GS
357
365
313
17.1
17.6
18.5
17.4
18.0
19.4
14 91
15.08
14 .4 1
14.67
11 .72
14.14
5 107
5299
53 17
5111
5292
5602
8-,3
1280
809
670
8 12
680
18.7
188
18.2
20 .6
19.1
18.3
16.03
1:;85
1.,.67
1.-, .69
15.77
15.70
6006
597:)
5fiq5
6449
00 14
5756
1'>2 1
2 100
):'77
1027
J 177
993
18.0
18.3
18.4
19 . 1
18.7
18 .6
1:1 ..14
15.55
15.06
15.34
15.44
15 .30
56 11
571 3
0.', 11
.')984
5790
5707
'--< 0c:: "z ;> r
0 "l
>-l :t 1"1
>(j)
~
?= >-j
"
< 0,
Table II.-Beet yields and percent sugar as affected by the total pound of fertilizer used on tile-drained land, 196 1 and 1962. '-Xl
196 1 1962 \Veighled average Z 0
Total fertilizer used Lbs.
200 - 399
Acres
635
neets T / A
14.4
Sugar
%
15.11
Gross sugar Lbs/A Acres
Fine- tex tured
4337 53 1
Beets T / A
soi ls
16.9
Sugar M
'0
16.20
Gross sugar Lbs/ A
5482
Total acres
11 66
Beets T / A
15,5
Sugar
%
15,60
Gross sugar Lbs/A
4858
?" '---<
c:: r ><
<D a>"',
400 - 599 2227 16,7 14.98 4992 225 1 16.9 16,00 54 10 4478 16.8 15.49 5202
600 - 799 1963 17.7 14.87 5264 3343 18.6 15.78 5864 5306 18,3 15.44 5642
800 999 685 J8 .9 14.83 5616 1275 20. 1 1578 6343 1960 19,7 15.45 60S9
1000 1199 188 19.3 14.67 5670 134 18.2 16.34 5940 322 18,8 15.36 5782
Coarse-textured soils
200 399 129 16,5 14,90 4916 47 13 ,9 lii.05 44 16 176 15,8 15.2 1 4790
400 599 341 16,3 14.52 4739 578 16.9 1587 5358 . 919 16.7 15.37 r, 128
600 799 481 18.3 14.54 5326 977 17.8 15, 56 5538 1458 18.0 15.22 5468
800 999 405 19.4 , 13.67 5295 505 l R. 1 14,62 5306 9 10 IS.7 14.20 5301
1000 11 99 39 17 .6 13.80 4856 105 18.0 15,27 6489 114 17.9 14.87 "316
"" ""

522 ]OCRNJ\L OF THE A. S. S. B. T.
beets and gross sugar was affected by the time of application of the nitrogen. When nitrogen was applied later than June 15, there was a marked reduction in the yield of beets and gross sugar. In the case of the coarse-textured soils, a lower percent sugar in beet roots was produced than on the fine-textured soils but there was no apparent effect on the percent sugar due to time of application of nitrogen. Here, as with the finetextured soils, there was a sharp decline in yield of beets and gTOSS sugar when nitrogen was applied later than mid-June.
An interesting comp~rison was obtained with the total pounds of nitrogen per acre Cfable 10). According to these data there was a definite trend of increased tonnage of beets and gross sugar up to the level where 70-80 pounds of nitrogen were applied per acre. Eeyond this point levelling off o[ yields occurred. The data indicate that the maximum point of beet and sugar yield occurs some'where in the range of a nitrogen application between 70-100 pounds per acre. There was a slight reduction in the percent sugar up to the level where 70-80 pounds of nitrogen vvere applied per acre. Beyond this level of nitrogen the reduction in percent sugar was definitely lower.
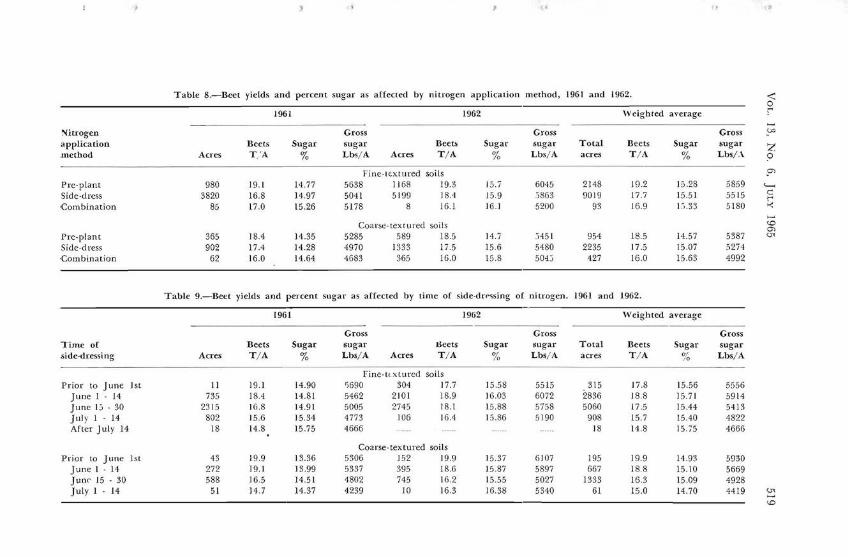
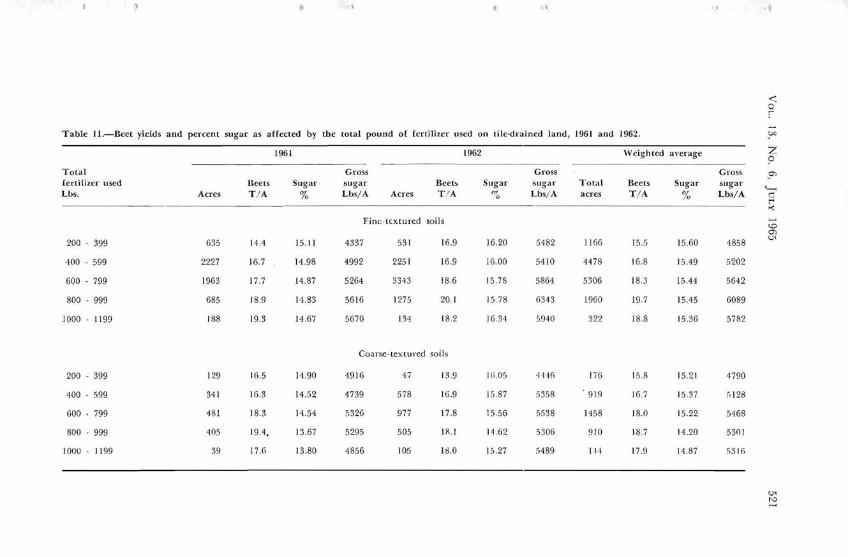
Table II illustrates the effect of total pounds of fertilizer on tiled, fine-textured soil. The effect on the percent sugar due to the pounds of fertilizer applied appears insignificant.
The yield of beets and gross sugar increased as the pounds of fertilizer us::d increased up to the 800-1 000 p~unds per acre level. The rate of fertilizer application (Table I I) influenced the percent sugar on tile-drained, coarse-textured soils. A reduction in percent sucrose occurred beyond the 600-800 pound per acre level. The yield of beets and gross sugar follows a similar trend as for the fine-textured soils with maximums apparently at the 600-800 pound per acre level.
Summary
Several sugar beet production practices for 1961 and 1962 have been correlated with the yield of roots and gross sugar per acre and percent sucrose. The yield data on the coarsetextured soils are very similar to the yields obtained on the fine-textured soils. In general, the production practices on both soils had marked effects on the yield of roots and gross sugar with a somewhat lesser effect on the percent sucrose.
In interpreting results from a survey such as this, there are many confounding factors to be considered. However, these data provide some useful information and trends. Caution should be used in assessing the various factors where the acreage is small.