cross-sectional patterns of mortgage debt during … · cross-sectional patterns of mortgage debt...
TRANSCRIPT

Introduct ion Empincal Strategy Evidence I m pltcations eooo 0 000000000 0000
Cross-Sectional Patterns of Mortgage Debt
During the Housing Boom: Evidence and Implications
Chris Foote, Lara Loewenstein and Paul Willen FRB Boston
FDIC Consumer Credit Symposium
Washington , DC October 28, 2016
0 - .(!)<;('-
Foote , Loewenstein & W illen (F RB Boston) Cross Section of De bt September 19, 2016 1 1 18

Introduction Empincal Strategy Evidence I m pltcations oeoo 0 000000000 0000
Disclaimer
0 - .(!)<;('-
Foote , Loewenstein & W il len (F RB Boston) Cross Section of Debt September 19, 2016 2 1 18

Introduct ion Empincal Strategy Evidence I m pltcations oeoo 0 000000000 0000
Disclaimer
• I am speaking today as a researcher and as a concerned citizen
0 - .(!)<;('-
Foote , Loewenstein & W illen (F RB Boston) Cross Section of Debt September 19, 2016 2 1 18

Introduct ion Empincal Strategy Evidence I m pltcations oeoo 0 000000000 0000
Disclaimer
• I am speaking today as a researcher and as a concerned citizen
• not as a representative of:
0 - .(!)<;('-
Foote , Loewenstein & W illen (F RB Boston) Cross Section of Debt September 19, 2016 2 1 18

Introduct ion Empincal Strategy Evidence I m pltcations oeoo 0 000000000 0000
Disclaimer
• I am speaking today as a researcher and as a concerned citizen
• not as a representative of:
• The Boston Fed
0 - .(!)<;('-
Foote , Loewenstein & W illen (F RB Boston) Cross Section of Debt September 19, 2016 2 1 18

Introduct ion Empincal Strategy Evidence I m pltcations oeoo 0 000000000 0000
Disclaimer
• I am speaking today as a researcher and as a concerned citizen
• not as a representative of:
• The Boston Fed • or the Federal Reserve System
• When I say "we" , I don't mean Janet and me. 0 - .(!)<;('-
Foote , Loewenstein & W illen (F RB Boston) Cross Section of Debt September 19, 2016 2 1 18

Introduction Empincal Strategy Evidence I m pltcations ooeo 0 000000000 0000
Growth in Debt
10
8
Vl c .Q ·;: 6.....-c
4
Household Mortgage Debt
(~left scale) "\t
2 ~---------------~------·----------~------~--~~ 91 93 95 97 99 01 03 05 07 09 11 13 15
0 - .(!)<;('-
Foote , Loewenstein & W illen (F RB Boston) Cross Section of Debt September 19, 2016 3 1 1s

Introduction Empincal Strategy Evidence I m pltcations ooeo 0 000000000 0000
Growth in Debt
Household Mortgage Debt
(~left scale) "\t
~-------------~----------------~------~--~~ 91 93 95 97 99 01 03 05 07 09 11 13 15
10
8
• Explosion 1n debtVl c .Q ·;:: 6 .....-c
4
2
0 - .(!)<;('-
Foote , Loewenstein & W illen (F RB Boston) Cross Section of Debt September 19, 2016 3 1 1s

c
Introduction Empincal Strategy Evidence I m pltcations ooeo 0 000000000 0000
Growth in Debt
• Ex plosion in debt
·;:: 6 12Vl • Not incom e ..... c ~ .Q
·;:: ..... ~
4 8 ·= "" Persona l income (right sca le---7 )
10
8
Vl c 0
Household Mortgage Debt
(~l eft scale) ')I
- 16
2 4
91 93 95 97 99 01 03 05 07 09 11 13 15
0 - .(!)<;('-
Foote , Loewenstein & W illen (F RB Boston) Cross Section of De bt September 19, 2016 3 1 1s

c
Introduction Empincal Strategy Evidence I m pltcations ooeo 0 000000000 0000
Growth in Debt
• Ex plosion in debt
·;:: 6 12Vl • Not incom e ..... c ~ .Q
2 4
91 93 95 97 99 01 03 05 07 09 11 13 15
0 - .(!)<;('-
10
8
Vl c 0
Household Mortgage Debt
(~l eft scale) ')I
- 16
4
• Why?· ;:: ..... ~
8 ·= "" Persona l income (right sca le---7 )
Foote , Loewenstein & W illen (F RB Boston) Cross Section of De bt September 19, 2016 3 1 1s

Introduct ion Empincal Strategy Evidence I m pltcations oooe 0 000000000 0000
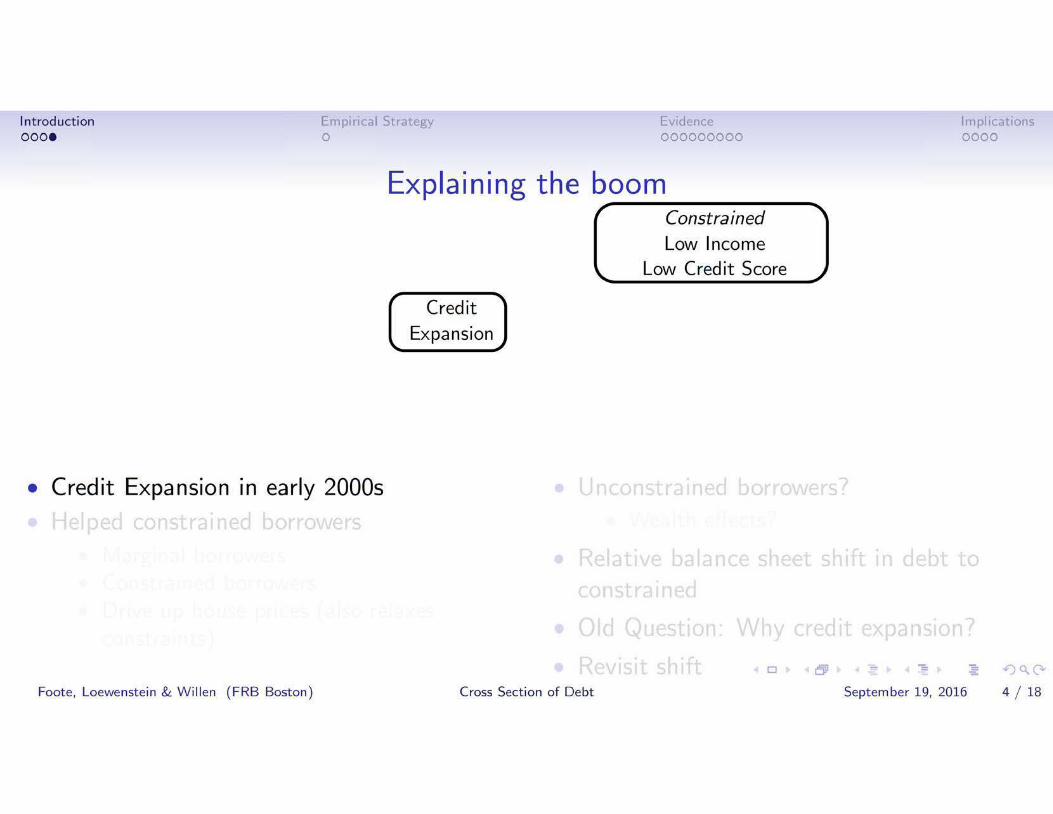
Explaining the boom
Credit Ex pansion
• Credit Expansion in early 2000s
0 - .(!)<;('.... Foote , Loewenstein & W illen (F RB Boston) Cross Section of Debt September 19, 2016 4 1 1s
Introduct ion Empincal Strategy Evidence I m pltcations oooe 0 000000000 0000
Explaining the boom r,---------------------,~
Constrained Low Inco me
Low Credit Score \..
Credit
Ex pansion
• Credit Expansion in early 2000s
0 - .(!)<;('.... Foote , Loewenstein & W illen (F RB Boston) Cross Section of Debt September 19, 2016 4 1 1s

Introduct ion Empincal Strategy Evidence I m pltcations oooe 0 000000000 0000
Explaining the boom r~------------------~~Constrained
Low Inco me Low Credit Score \..
Credit
Ex pansion
Unconstrained High Income
Hig h Credit Score
• Credit Expansion in early 2000s
0 - .(!)<;('.... Foote , Loewenstein & W illen (F RB Boston) Cross Section of Debt September 19, 2016 4 1 18

Introduct ion Empincal Strategy Evidence I m pltcations oooe 0 000000000 0000
Explaining the boom r~------------------~~Constrained
Low Inco me Low Credit Score \..
Credit
Ex pansion
Unconstrained High Income
Hig h Credit Score
• Credit Expansion in early 2000s
• He I ped constrained borrowers
0 - .(!)<;('.... Foote , Loewenstein & W illen (F RB Boston) Cross Section of Debt September 19, 2016 4 1 18

Introduct ion Empincal Strategy Evidence I m pltcations oooe 0 000000000 0000
Explaining the boom r~------------------,~
Constrained Low Income
Low Credit Score \..
Credit
Expansion
Unconstrained High Income
High Credit Score
• Credit Expansion in early 2000s
• He I ped constrained borrowers
• M argina I borrowers
0 - .(!)<;('.... Foote , Loewenstein & W illen (F RB Boston) Cross Section of Debt September 19, 2016 4 1 18

Introduct ion Empincal Strategy Evidence I m pltcations oooe 0 000000000 0000
Explaining the boom r~------------------,~
Constrained
M argina I borrowers Constrained borrowers
Low Income Low Credit Score \..
Credit
Expansion
Unconstrained High Income
High Credit Score
• Credit Expansion in early 2000s
• He I ped constrained borrowers
• •
0 - .(!)<;('.... Foote , Loewenstein & W illen (F RB Boston) Cross Section of Debt September 19, 2016 4 1 18

Introduct ion Empincal Strategy Evidence I m pltcations oooe 0 000000000 0000
Explaining the boom r~------------------,~
Constrained Low Income
Low Credit Score \..
Credit
Expansion
Unconstrained High Income
High Credit Score
• Credit Expansion in early 2000s
• He I ped constrained borrowers
• M argina I borrowers • Constrained borrowers • Drive up house prices (also relaxes
constraints) 0 - .(!)<;('....
Foote , Loewenstein & W illen (F RB Boston) Cross Section of Debt September 19, 2016 4 1 18

Introduct ion Empincal Strategy Evidence I m pltcations oooe 0 000000000 0000
Explaining the boom r~------------------,~
Constrained Low Income
Low Credit Score \..
Credit
Expansion
Unconstrained High Income
High Credit Score
• Credit Expansion in early 2000s • Unconstrained borrowers?
• He I ped constrained borrowers • Wealth effects?
• M argina I borrowers • Constrained borrowers • Drive up house prices (also relaxes
constraints) 0 - .... .(!)<;('
Foote , Loewenstein & W illen (F RB Boston) Cross Section of Debt September 19, 2016 4 1 18

Introduct ion Empincal Strategy Evidence I m pltcations oooe 0 000000000 0000
Explaining the boom r,-----------------~~
Constrained Low Income
Low Credit Score \..
tCredit Relati+e ShiftExpansion
I
• Credit Expansion in early 2000s
• He I ped constrained borrowers
• M argina I borrowers • Constrained borrowers • Drive up house prices (also relaxes
constraints)
Unconstrained High Income
High Credit Score
• Unconstrained borrowers?
• Wealth effects?
• Relative balance sheet shift in debt to constrained
.(!)<;('0 - .... Foote , Loewenstein & W illen (F RB Boston) Cross Section of Debt September 19, 2016 4 1 1s
Introduction Empincal Strategy Evidence I m pltcations oooe 0 000000000 0000
Explaining the boom I ~-----------------,\
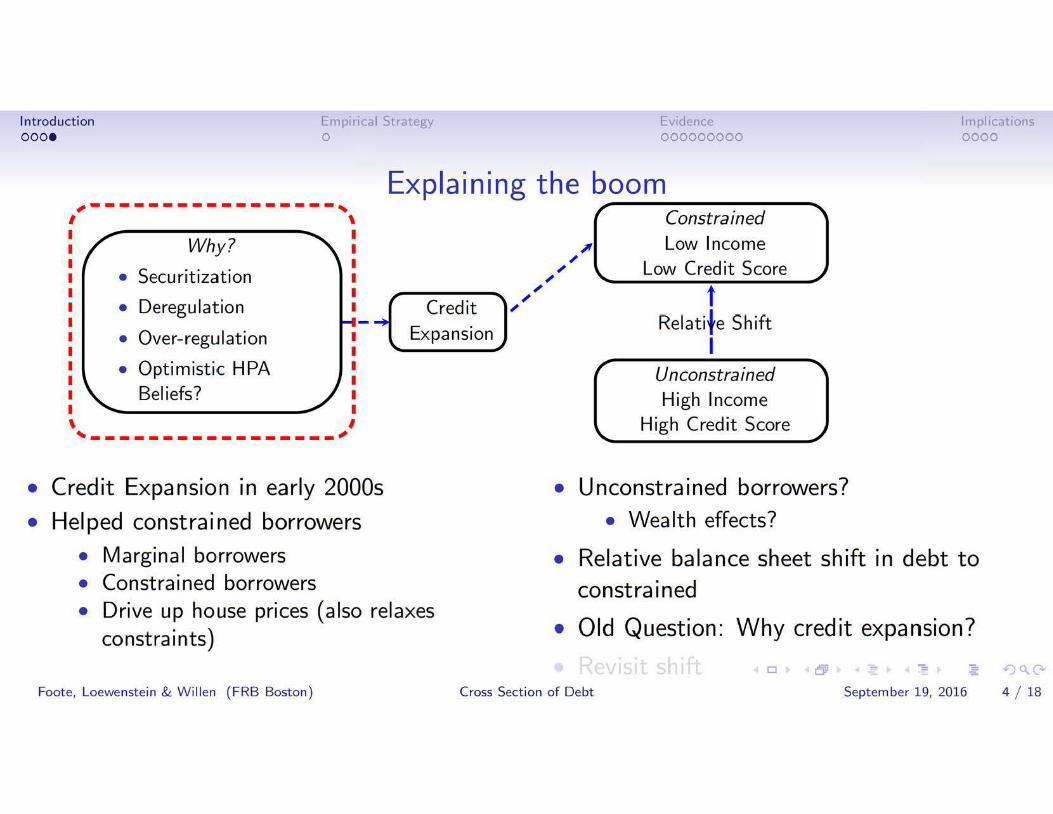
Why?
• Securitization
• Deregulation
I I I I I I
I I I I I I
Credit -~
Expansion• Over-regulation
• Optimistic HPA Beliefs?
\ I
~-----------------'
r,-----------------~~Constrained Low Income
Low Credit Score \..
t Relati+e Shift
I Unconstrained High Income
High Credit Score
• Credit Expansion in early 2000s • Unconstrained borrowers?
• He I ped constrained borrowers • Wealth effects?
• M argina I borrowers • Relative balance sheet shift in debt to • Constrained borrowers constrained • Drive up house prices (also relaxes
• Old Question: Why credit expansion? constraints) 0 - .(!)<;('....
Foote , Loewenstein & W illen (F RB Boston) Cross Section of De bt September 19, 2016 4 1 1s

Introduction Empincal Strategy Evidence I m pltcations oooe 0 000000000 0000
Explaining the ,Beem ---- -------~ I \
I ~-----------------,\ 1 r Constrained "
Why? I I I
P' Low Income I ~
~~ ~ Low Credit Score ~• Securitization I ~ '---------t~-------' I
Credit ~~• Deregulation I
Relati+e ShiftExpansion• Over-regulation I -~
I I • Optimistic HPA I UnconstrainedI
Beliefs? I High Income I
\ I High Credit Score ~-----------------'
'~---------------' • Credit Expansion in early 2000s • Unconstrained borrowers?
• He I ped constrained borrowers • Wealth effects?
• M argina I borrowers • Relative balance sheet shift in debt to • Constrained borrowers constrained • Drive up house prices (also relaxes
• Old Question: Why credit expansion? constraints)
• Revisit shift 0 - .... .(!)<;('
Foote , Loewenstein & W illen (F RB Boston) Cross Section of De bt September 19, 2016 4 1 1s

Introduction Empirical Strategy Evidence I m pltcations 0000 000000000 0000•
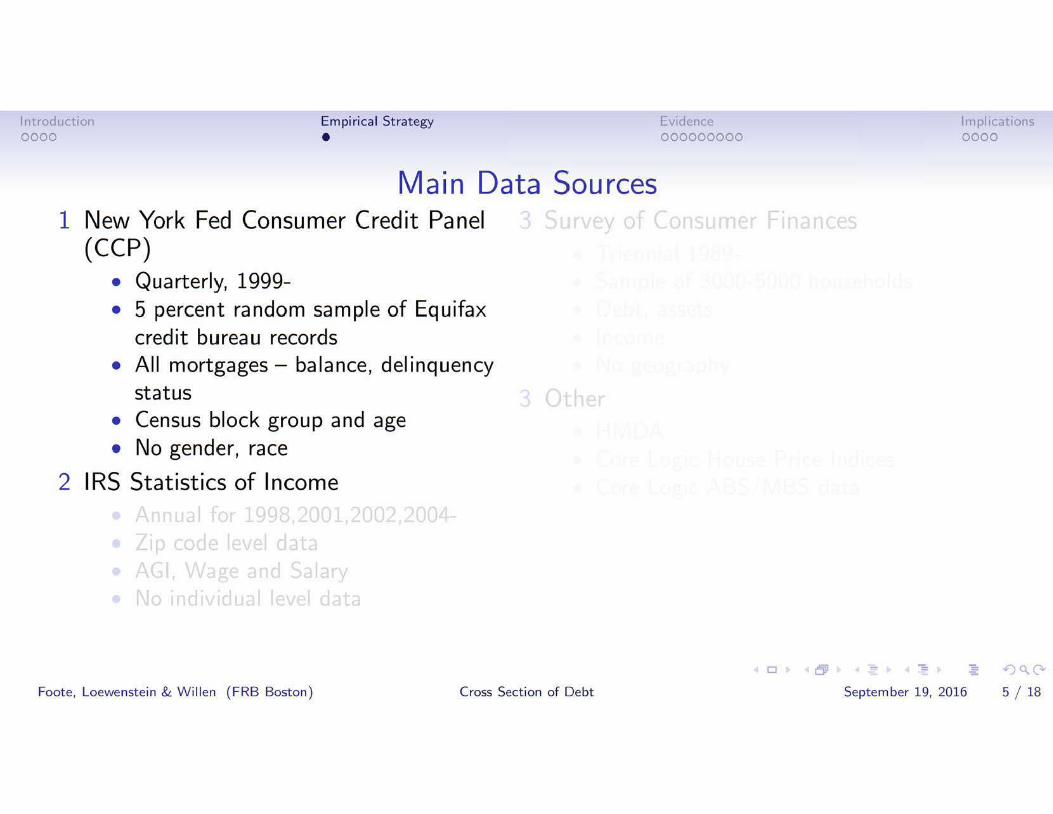
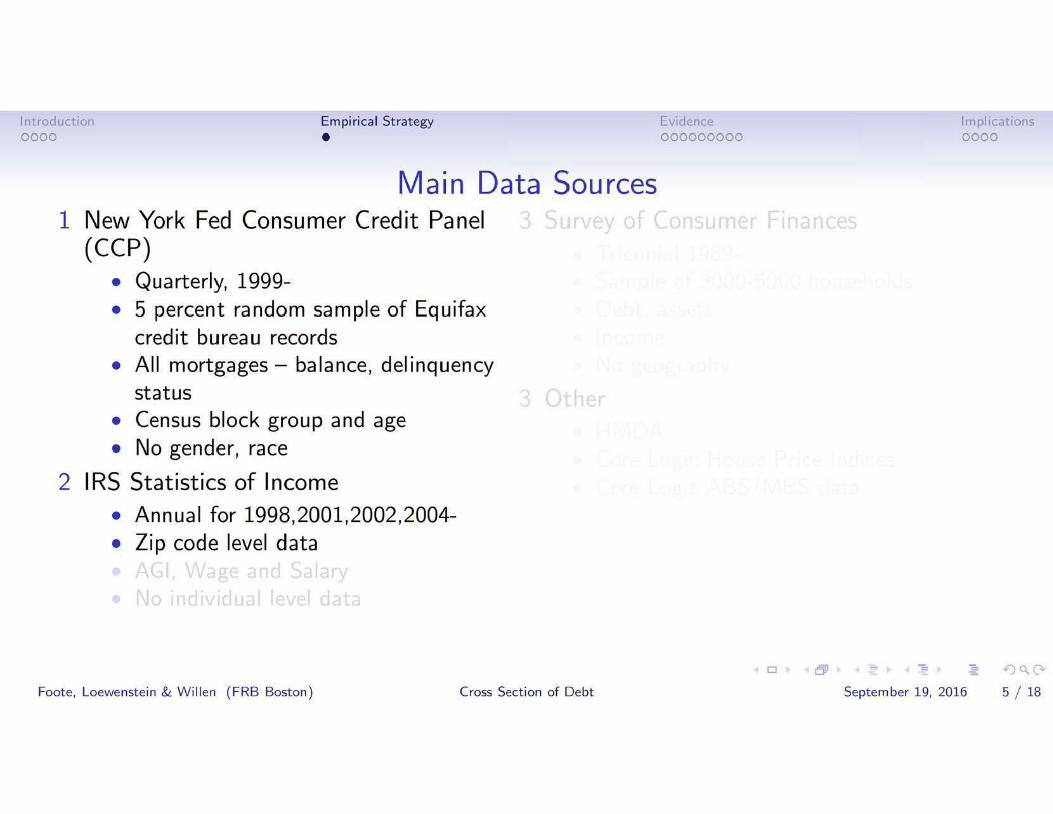
Main Data Sources 1 New York Fed Consumer Credit Panel
(CCP)
0 - .(!)<;('.... Foote, Loewenstein & Willen (F RB Boston) Cross Section of Debt September 19, 2016 s 1 18

Introduction Empirical Strategy Evidence I m pltcations 0000 000000000 0000•
Main Data Sources 1 New York Fed Consumer Credit Panel
(CCP) • Quarterly, 1999
0 - .(!)<;('.... Foote, Loewenstein & Willen (F RB Boston) Cross Section of Debt September 19, 2016 s 1 18

Introduction Empirical Strategy Evidence I m pltcations 0000 000000000 0000•
Main Data Sources 1 New York Fed Consumer Credit Panel
(CCP) • Quarterly, 1999• 5 percent random sample of Equifax
credit bureau records
0 - .(!)<;('.... Foote, Loewenstein & Willen (F RB Boston) Cross Section of Debt September 19, 2016 s 1 18

Introduction Empirical Strategy Evidence I m pltcations 0000 000000000 0000•
Main Data Sources 1 New York Fed Consumer Credit Panel
(CCP) • Quarterly, 1999• 5 percent random sample of Equifax
credit bureau records • All mortgages- balance, delinquency
status
0 - .(!)<;('.... Foote, Loewenstein & Willen (F RB Boston) Cross Section of Debt September 19, 2016 s 1 18

Introduction Empirical Strategy Evidence I m pltcations 0000 000000000 0000•
Main Data Sources 1 New York Fed Consumer Credit Panel
(CCP) • Quarterly, 1999• 5 percent random sample of Equifax
credit bureau records • All mortgages- balance, delinquency
status • Census block group and age
0 - .(!)<;('.... Foote, Loewenstein & Willen (FRB Boston) Cross Section of Debt September 19, 2016 s 1 18

Introduction Empirical Strategy Evidence I m pltcations 0000 000000000 0000•
Main Data Sources 1 New York Fed Consumer Credit Panel
(CCP) • Quarterly, 1999• 5 percent random sample of Equifax
credit bureau records • All mortgages- balance, delinquency
status • Census block group and age • No gender, race
0 - .(!)<;('.... Foote, Loewenstein & Willen (FRB Boston) Cross Section of Debt September 19, 2016 s 1 18
Introduction Empirical Strategy Evidence I m pltcations 0000 000000000 0000•
Main Data Sources 1 New York Fed Consumer Credit Panel
(CCP) • Quarterly, 1999• 5 percent random sample of Equifax
credit bureau records • All mortgages- balance, delinquency
status • Census block group and age • No gender, race
2 IRS Statistics of I nco me
0 - .(!)<;('.... Foote , Loewenstein & W illen (F RB Boston) Cross Section of Debt September 19, 2016 s 1 18

Introduction Empirical Strategy Evidence I m pltcations 0000 000000000 0000•
Main Data Sources 1 New York Fed Consumer Credit Panel
(CCP) • Quarterly, 1999• 5 percent random sample of Equifax
credit bureau records • All mortgages- balance, delinquency
status • Census block group and age • No gender, race
2 IRS Statistics of I nco me • Annual for 1998,2001,2002,2004
0 - .(!)<;('.... Foote , Loewe nstein & W illen ( F RB Boston) Cross Section of Debt September 19, 2016 s 1 18
Introduction Empirical Strategy Evidence I m pltcations 0000 000000000 0000•
Main Data Sources 1 New York Fed Consumer Credit Panel
(CCP) • Quarterly, 1999• 5 percent random sample of Equifax
credit bureau records • All mortgages- balance, delinquency
status • Census block group and age • No gender, race
2 IRS Statistics of I nco me • Annual for 1998,2001,2002,2004• Zip code level data
0 - .(!)<;('.... Foote , Loewe nstein & W illen ( F RB Boston) Cross Section of Debt September 19, 2016 s 1 18

Introduction Empirical Strategy Evidence I m pltcations 0000 000000000 0000•
Main Data Sources 1 New York Fed Consumer Credit Panel
(CCP) • Quarterly, 1999• 5 percent random sample of Equifax
credit bureau records • All mortgages- balance, delinquency
status • Census block group and age • No gender, race
2 IRS Statistics of I nco me • Annual for 1998,2001,2002,2004• Zip code level data • AGI, Wage and Salary
0 - .(!)<;('.... Foote , Loewe nstein & W illen ( F RB Boston) Cross Section of Debt September 19, 2016 s 1 18

Introduction Empirical Strategy Evidence I m pltcations 0000 000000000 0000•
Main Data Sources 1 New York Fed Consumer Credit Panel
(CCP) • Quarterly, 1999• 5 percent random sample of Equifax
credit bureau records • All mortgages- balance, delinquency
status • Census block group and age • No gender, race
2 IRS Statistics of I nco me • Annual for 1998,2001,2002,2004• Zip code level data • AGI, Wage and Salary • No individual level data
.(!)<;('0 - .... Foote , Loewe nstein & W illen ( F RB Boston) Cross Section of Debt September 19, 2016 s 1 18

Introduction Empirical Strategy Evidence I m pltcations 0000 000000000 0000•
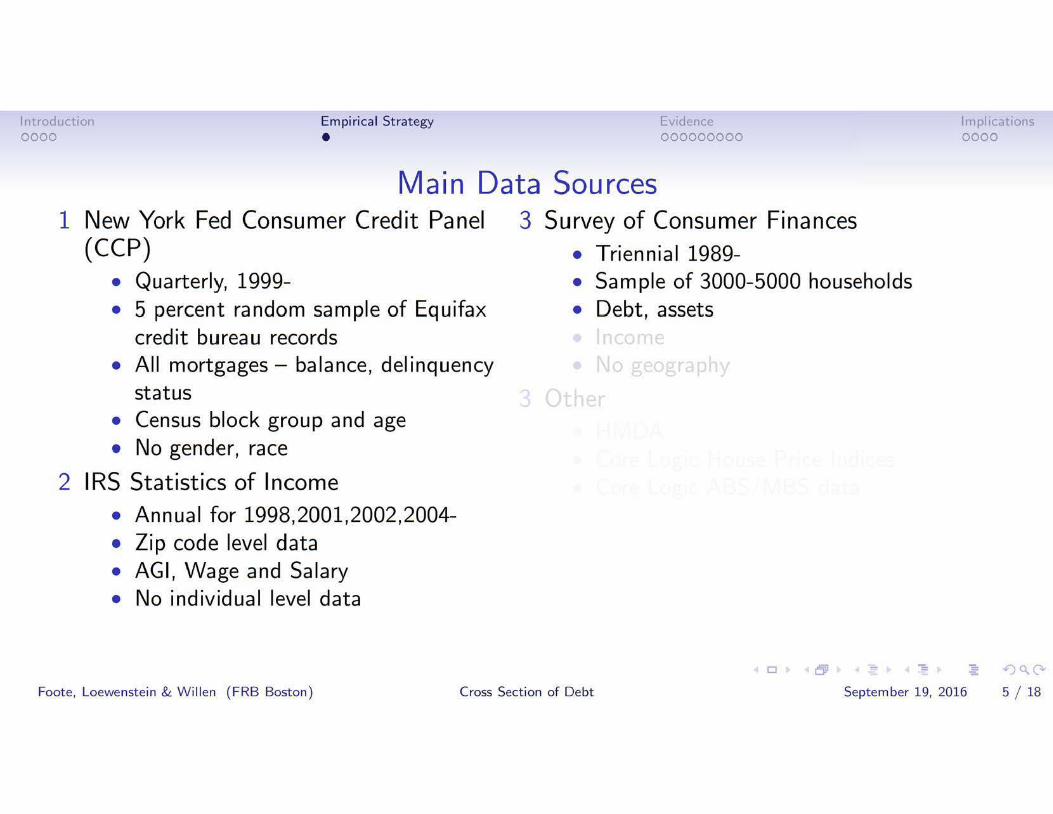
Main Data Sources 1 New York Fed Consumer Credit Panel 3 Survey of Consumer Finances
(CCP) • Quarterly, 1999• 5 percent random sample of Equifax
credit bureau records • All mortgages- balance, delinquency
status • Census block group and age • No gender, race
2 IRS Statistics of I nco me • Annual for 1998,2001,2002,2004• Zip code level data • AGI, Wage and Salary • No individual level data
0 - .(!)<;('.... Foote , Loewenstein & W illen (F RB Boston) Cross Section of Debt September 19, 2016 s 1 18

• Triennial 1989
Introduction Empirical Strategy Evidence I m pltcations 0000 000000000 0000•
Main Data Sources 1 New York Fed Consumer Credit Panel 3 Survey of Consumer Finances
(CCP) • Quarterly, 1999• 5 percent random sample of Equifax
credit bureau records • All mortgages- balance, delinquency
status • Census block group and age • No gender, race
2 IRS Statistics of I nco me • Annual for 1998,2001,2002,2004• Zip code level data • AGI, Wage and Salary • No individual level data
.(!)<;('0 - .... Foote , Loewenstein & W illen (F RB Boston) Cross Section of Debt September 19, 2016 s 1 18

Introduction Empirical Strategy Evidence I m pltcations 0000 000000000 0000•
Main Data Sources 1 New York Fed Consumer Credit Panel 3 Survey of Consumer Finances
(CCP) • Triennial 1989• Quarterly, 1999- • Sample of 3000-5000 households • 5 percent random sample of Equifax
credit bureau records • All mortgages- balance, delinquency
status • Census block group and age • No gender, race
2 IRS Statistics of I nco me • Annual for 1998,2001,2002,2004• Zip code level data • AGI, Wage and Salary • No individual level data
0 - .(!)<;('.... Foote , Loewenstein & W illen (F RB Boston) Cross Section of Debt September 19, 2016 s 1 18
Introduction Empirical Strategy Evidence I m pltcations 0000 000000000 0000•
Main Data Sources 1 New York Fed Consumer Credit Panel
(CCP) • Quarterly, 1999• 5 percent random sample of Equifax
credit bureau records • All mortgages- balance, delinquency
status • Census block group and age • No gender, race
2 IRS Statistics of I nco me • Annual for 1998,2001,2002,2004• Zip code level data • AGI, Wage and Salary • No individual level data
3 Survey of Consumer Finances
• Triennial 1989• Sample of 3000-5000 households • Debt, assets
0 - .(!)<;('.... Foote , Loewenstein & W illen (F RB Boston) Cross Section of Debt September 19, 2016 s 1 18

Introduction Empirical Strategy Evidence I m pltcations 0000 000000000 0000•
Main Data Sources 1 New York Fed Consumer Credit Panel
(CCP) • Quarterly, 1999• 5 percent random sample of Equifax
credit bureau records • All mortgages- balance, delinquency
status • Census block group and age • No gender, race
2 IRS Statistics of I nco me • Annual for 1998,2001,2002,2004• Zip code level data • AGI, Wage and Salary • No individual level data
3 Survey of Consumer Finances
• Triennial 1989• Sample of 3000-5000 households • Debt, assets • Income
0 - .(!)<;('.... Foote , Loewenstein & W illen (F RB Boston) Cross Section of Debt September 19, 2016 s 1 18

Introduction Empirical Strategy Evidence I m pltcations 0000 000000000 0000•
Main Data Sources 1 New York Fed Consumer Credit Panel
(CCP) • Quarterly, 1999• 5 percent random sample of Equifax
credit bureau records • All mortgages- balance, delinquency
status • Census block group and age • No gender, race
2 IRS Statistics of I nco me • Annual for 1998,2001,2002,2004• Zip code level data • AGI, Wage and Salary • No individual level data
3 Survey of Consumer Finances
• Triennial 1989• Sample of 3000-5000 households • Debt, assets • Income • No geography
.(!)<;('0 - .... Foote , Loewenstein & W illen (F RB Boston) Cross Section of Debt September 19, 2016 s 1 18

Introduction Empirical Strategy Evidence I m pltcations 0000 000000000 0000•
Main Data Sources 1 New York Fed Consumer Credit Panel
(CCP) • Quarterly, 1999• 5 percent random sample of Equifax
credit bureau records • All mortgages- balance, delinquency
status • Census block group and age • No gender, race
2 IRS Statistics of I nco me • Annual for 1998,2001,2002,2004• Zip code level data • AGI, Wage and Salary • No individual level data
3 Survey of Consumer Finances
• Triennial 1989• Sample of 3000-5000 households • Debt, assets • Income • No geography
3 Other
0 - .(!)<;('.... Foote , Loewenstein & W illen (F RB Boston) Cross Section of Debt September 19, 2016 s 1 18

Introduction Empirical Strategy Evidence I m pltcations 0000 000000000 0000•
Main Data Sources 1 New York Fed Consumer Credit Panel
(CCP) • Quarterly, 1999• 5 percent random sample of Equifax
credit bureau records • All mortgages- balance, delinquency
status • Census block group and age • No gender, race
2 IRS Statistics of I nco me • Annual for 1998,2001,2002,2004• Zip code level data • AGI, Wage and Salary • No individual level data
3 Survey of Consumer Finances
• Triennial 1989• Sample of 3000-5000 households • Debt, assets • Income • No geography
3 Other • HMDA
0 - .(!)<;('.... Foot e , Loewenstein & Willen (FRB Boston ) Cross Section of Debt September 19, 2016 s 1 18

Introduction Empirical Strategy Evidence I m pltcations 0000 000000000 0000•
Main Data Sources 1 New York Fed Consumer Credit Panel
(CCP) • Quarterly, 1999• 5 percent random sample of Equifax
credit bureau records • All mortgages- balance, delinquency
status • Census block group and age • No gender, race
2 IRS Statistics of I nco me • Annual for 1998,2001,2002,2004• Zip code level data • AGI, Wage and Salary • No individual level data
3 Survey of Consumer Finances
• Triennial 1989• Sample of 3000-5000 households • Debt, assets • Income • No geography
3 Other • HMDA • Core Logic House Price Indices
.(!)<;('0 - .... Foote , Loewenstein & W illen (F RB Boston) Cross Section of De bt September 19, 2016 s 1 18

Introduction Empirical Strategy Evidence I m pltcations 0000 000000000 0000•
Main Data Sources 1 New York Fed Consumer Credit Panel
(CCP) • Quarterly, 1999• 5 percent random sample of Equifax
credit bureau records • All mortgages- balance, delinquency
status • Census block group and age • No gender, race
2 IRS Statistics of I nco me
• Annual for 1998,2001,2002,2004• Zip code level data • AGI, Wage and Salary • No individual level data
3 Survey of Consumer Finances
• Triennial 1989• Sample of 3000-5000 households • Debt, assets • Income • No geography
3 Other • HMDA • Core Logic House Price Indices • Core Logic ABS / MBS data
.(!)<;('0 - .... Foote , Loewenstein & W illen (F RB Boston) Cross Section of De bt September 19, 2016 s 1 18
Introduction Empincal Strategy Evidence I m pltcations 0000 0 e oooooooo 0000
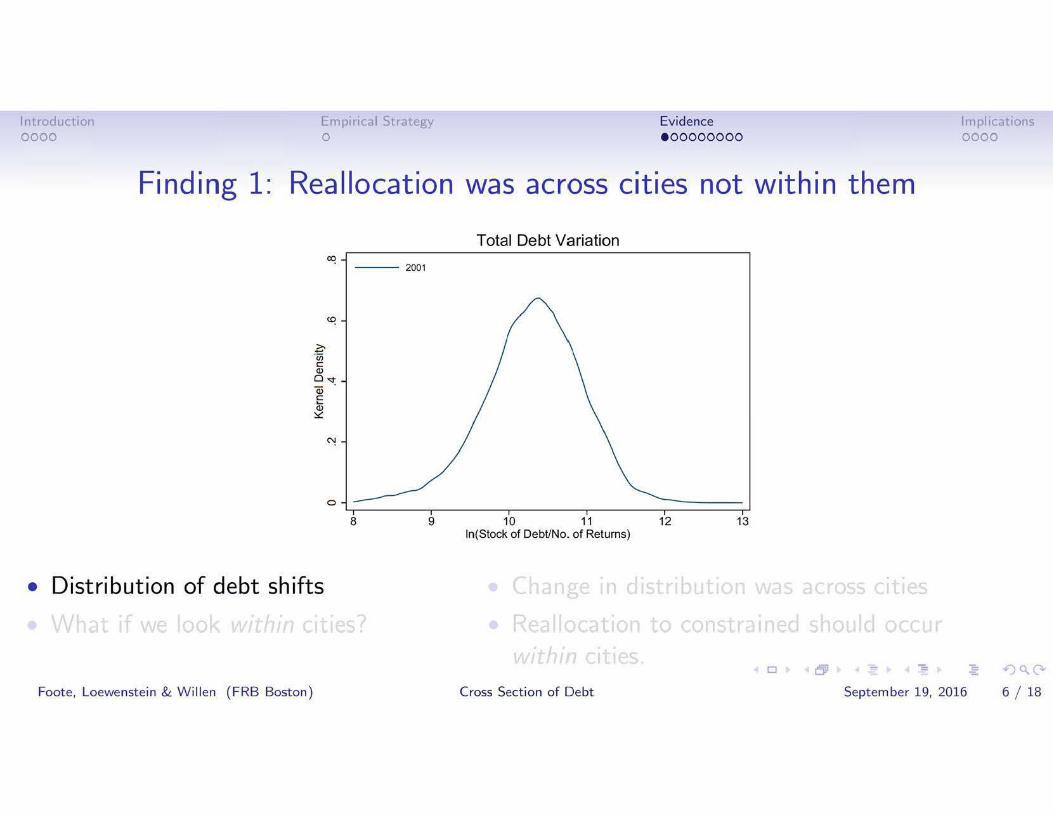
Finding 1 : Reallocation was across cities not within them
Total Debt Variation
-- 2001
0
8 9 10 11 12 13 ln(Stock of Debt/No. of Returns)
• Distribution of debt shifts
0 - .(!)<;('-
Foote , Loewenstein & W illen (F RB Boston) Cross Section of De bt September 19, 2016 6 1 1s

--
Introduction Empincal Strategy Evidence I m pltcations 0000 0 e oooooooo 0000
Finding 1 : Reallocation was across cities not within them
Total Debt Variation
--- 2001
---- - 2006
I
I I
I /
I /
I I
/ ---/ .....
' \ \ \ \ I
I \ I \
I ' \ \
\ \
/ / ' \/
' '/ /
' .... -0
8 9 10 11 12 13 ln(Stock of Debt/No. of Returns)
• Distribution of debt shifts
0 - .(!)<;('-
Foote , Loewenstein & W illen (F RB Boston) Cross Section of De bt September 19, 2016 6 1 1s

0
Introduction Empincal Strategy Evidence I m pltcations 0000 0 e oooooooo 0000
Finding 1: Reallocation was across cities not within them
Within-CBSA Debt Variation
- 2001
- 2 -1 0 In(Stock of DebUNo. of Returns)
2
• Distribution of debt shifts
• What if we look within cities?
0 - .(!)<;('-
Foote , Loewenstein & W il len (F RB Boston) Cross Section of Debt September 19, 2016 6 1 1s

Introduction Empincal Strategy Evidence I m pltcations 0000 0 e oooooooo 0000
Finding 1: Reallocation was across cities not within them
Within-CBSA Debt Variation
--2001
----- 2006
0
- 2 -1 0 In(Stock of DebUNo. of Returns)
• Distribution of debt shifts
• What if we look within cities?
Foote , Loewenstein & W il len (F RB Boston)
2
0
Cross Section of Debt
-September 19, 2016
- .(!)<;('
6 1 1s

Introduction Empincal Strategy Evidence I m pltcations 0000 0 e oooooooo 0000
Finding 1: Reallocation was across cities not within them
Within-CBSA Debt Variation Between- CBSA Debt Variation
- 2001
----- 2006
0
- 2 -1 0 In(Stock of DebUNo. of Returns)
• Distribution of debt shifts
• What if we look within cities?
Foote , Loewenstein & W illen (F RB Boston)
-- 2001
<X:!
~ ·u; CD c . Q)
0 Qi c.... a> "<I: ~
~
0
2 8 9 10 11 12 In( Stock of DebUNo. of Returns)
• Change 1n distribution was across cities
0 - .(!)<;('-Cross Section of De bt September 19, 2016 6 1 1s

Introduction Empincal Strategy Evidence I m pltcations 0000 0 e oooooooo 0000
Finding 1: Reallocation was across cities not within them
Within-CBSA Debt Variation Between-CBSA Debt Variation
- 2001
----- 2006
0
~ ·ii3~ Q)
0 Qi E Q)"<t ~ -
0
- 2001
--- - 2006
/\
'\ \ /V'\1 I
I \ \ I \ I \ \ I \
\ \ \
\ \
' ' - 2 -1 0 2 8 9 10 11
In( Stock of DebUNo. of Returns) In( Stock of DebUNo. of Returns)
• Distribution of debt shifts • Change 1n distribution was across cities
• What if we look within cities?
0 - .(!)<;('-Foote , Loewenstein & W illen (F RB Boston) Cross Section of De bt September 19, 2016 6 1 1s
12

Introduction Empincal Strategy Evidence I m pltcations 0000 0 e oooooooo 0000
Finding 1: Reallocation was across cities not within them
Within-CBSA Debt Variation Between-CBSA Debt Variation
- 2001
----- 2006
- 2 -1 0 In( Stock of DebUNo. of Returns)
• Distribution of debt shifts
• What if we look within cities?
Foote , Loewenstein & W illen (F RB Boston)
-- 2001
---- - 2006
~ ·ii3~ Q)
0 Qi E Q)"<t ~ -
/\
'\ \ /V'\1 I
I \ \ I \ I \ \ I \
\ \ \
\ \
0 0 ' ' 2 8 9 10 11 12
In( Stock of DebUNo. of Returns)
• Change in distribution was across cities
• Reallocation to constrained should occur within cities.
0 - .(!)<;('-Cross Section of De bt September 19, 2016 6 1 1s

--
Introduction Empincal Strategy Evidence I m pltcations 0000 0 oe ooooooo 0000
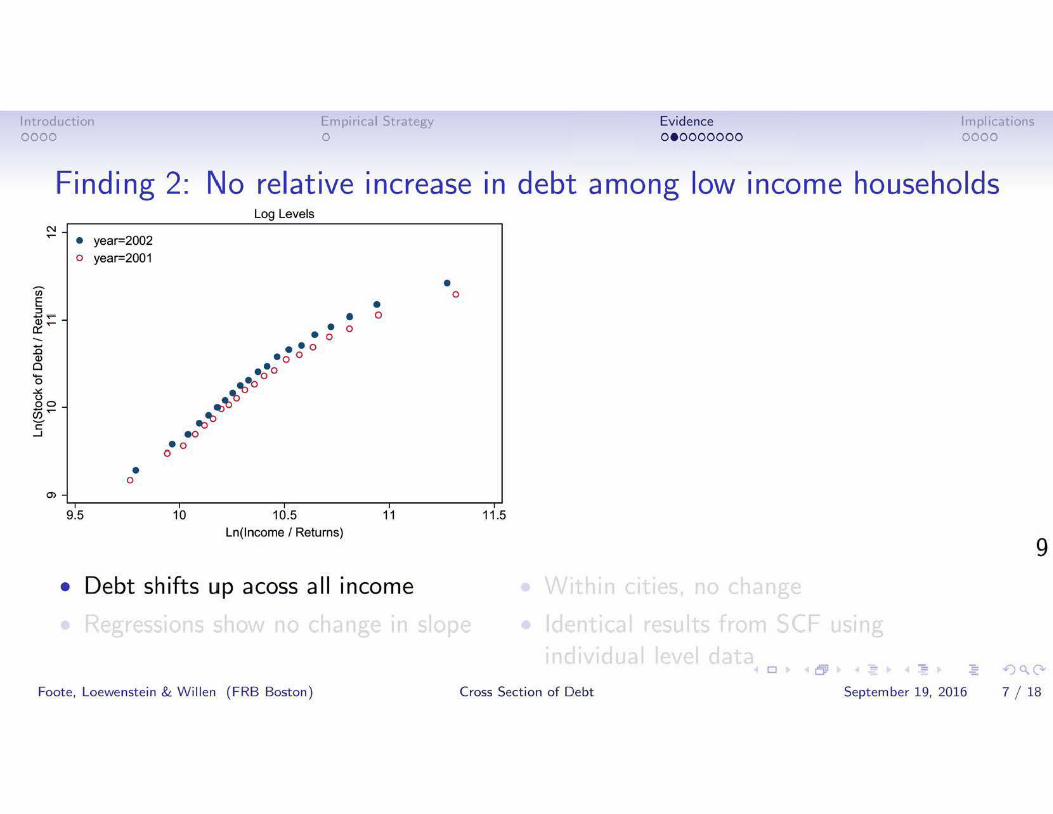
Finding 2: No relative increase in debt among low income households N..-
o year=2001
Log Levels
0
0
0 0
E Q)
0 0 ..ll:: (.)
U500
..c ...J
0 0
0
9.5 10 10.5 11 11 .5 Ln(lncome I Returns)
9
• Debt shifts up acoss all income
0 - .~!)<;('-
Foote , Loewenstein & W illen ( F RB Boston) Cross Section of Debt September 19, 2016 7 1 1s
--
Introduction Empincal Strategy Evidence I m pltcations 0000 0 oe ooooooo 0000
Finding 2: No relative increase in debt among low income households Log Levels
N..-
E Q)
0 0 ..ll:: (.)
U500
..c ...J
Ln(lncome I Returns)
9
• Debt shifts up acoss all income
• year=2002 o year=2001
•0
10 10.5 11
•0
11 .5 9 .5
0 - .~!)<;('-
Foote , Loewenstein & W illen ( F RB Boston) Cross Section of Debt September 19, 2016 7 1 1s

--
Introduction Empincal Strategy Evidence I m pltcations 0000 0 oe ooooooo 0000
Finding 2: No relative increase in debt among low income households Log Levels
N..-• year=2004 o year=2001 •
•• • • 0
0
0 0
E Q)
0 0 ..ll:: (.)
U500
..c ...J
• 0 0
0
9 .5 10 10.5 11 11 .5 Ln(lncome I Returns)
9
• Debt shifts up acoss all income
0 - .~!)<;('-
Foote , Loewenstein & W illen ( F RB Boston) Cross Section of Debt September 19, 2016 7 1 1s

•• •
• •
Introduction Empincal Strategy Evidence I m pltcations 0000 0 oe ooooooo 0000
Finding 2: No relative increase in debt among low income households Log Levels
N..-• year=2005 o year=2001 •
• • 0
0
0 - •• 0 E •• 0 0 Q) • 00 • 0
• 00 • 00..ll::
(.) •• 0 oOU5
00 .. • 0
0c ...J 0
• 0 0
0
9 .5 10 10.5 11 11 .5 Ln(lncome I Returns)
9
• Debt shifts up acoss all income
0 - .~!)<;('-
Foote , Loewenstein & W illen ( F RB Boston) Cross Section of Debt September 19, 2016 7 1 1s

• • • ••
Introduction Empincal Strategy Evidence I m pltcations 0000 0 oe ooooooo 0000
Finding 2: No relative increase in debt among low income households Log Levels
N
• year=2006 • o year=2001 •
0
• 0 • 0
- ••• 0 0E Q) •• 0 0 0 • 000 •• 00..ll:: (.) • 0
• oOU500
..00c
...J • 0 0
0
0
9 .5 10 10.5 11 11 .5 Ln(lncome I Returns)
9
• Debt shifts up acoss all 1ncome
0 - .~!)<;('-
Foote , Loewenstein & W illen ( F RB Boston) Cross Section of Debt September 19, 2016 7 1 1s

--
Introduction Empincal Strategy Evidence I m pltcations 0000 0 oe ooooooo 0000
Finding 2: No relative increase in debt among low income households Log Levels Deviated from CBSA-Year Means
N
(i) c .... ::3 ...... ,.. ~ .....
E Q)
0 0 ..ll:: (.)
U500 ..... c ...J
• o
year=2006 year=2001
• • •• •
• • 0
0
• 0
•
••• •• 0 0
0 0
• 00
• 0
0
•• 00 • 0
• oO 00
0
0
o year=2001 0
0(i)ll)c . 0.... ::3 ...... 0Q)
00:: 0
:i5 L~o ~ 0 ~~-------------!-+------------*""0 0
0
..ll:: 00 (.) 0B oCl)cLO o ...J , ·
0
0 or'
9 .5 10 10.5 11 11.5 -1 -.5 0 .5 1 Ln(lncome I Returns) Ln(lncome I Returns)
9
• Debt shifts up acoss all 1ncome • Within cities, no change
0 - .~!)<;('-Foote , Loewenstein & W illen (F RB Boston) Cross Section of De bt September 19, 2016 7 1 1s

--•• ••
Introduction Empincal Strategy Evidence I m pltcations 0000 0 oe ooooooo 0000
Finding 2: No relative increase in debt among low income households Log Levels Deviated from CBSA-Year Means
N
(i) c .... ::3 ...... ,.. ~ .....
E Q)
0 0 ..ll:: (.)
U500 ..... c ...J
• o
year=2006 year=2001
• • •• •
• • 0
0
• 0
•
••• •• 0 0
0 0
• 00
• 0
0
•• 00 • 0
• oO 00
0
0
(i)ll)c . .... ::3 ...... Q)
0::
• year=2002 0 year==2001 e o
• ~
•• ,. ~·
•
• ~ •
~ -r
1
9 .5 10 10.5 11 11.5 -1 -.5 0 .5 1 Ln(lncome I Returns) Ln(lncome I Returns)
9
• Debt shifts up acoss all 1ncome • With in citi es, no change
0 - .~!)<;('-Foote , Loewenstein & W illen (F RB Boston) Cross Section of De bt September 19, 2016 7 1 1s

--
Introduction Empincal Strategy Evidence I m pltcations 0000 0 oe ooooooo 0000
Finding 2: No relative increase in debt among low income households Log Levels Deviated from CBSA-Year Means
N
(i) c .... ::3 ...... ,.. ~ .....
E Q)
0 0 ..ll:: (.)
U500 ..... c ...J
• o
year=2006 year=2001
• • •• •
• • 0
0
• 0
•
••• •• 0 0
0 0
• 00
• 0
0
•• 00 • 0
• oO 00
0
0
(i)ll)c . .... ::3 ...... Q)
0::
• o
year=2004 year==2001
8 8
8 •
• • •
~·
•••••• ~
i
i-r 1
9 .5 10 10.5 11 11.5 -1 -.5 0 .5 1 Ln(lncome I Returns) Ln (lncome I Returns)
9
• Debt shifts up acoss all 1ncome • Within cities, no change
0 - .~!)<;('-Foote , Loewenstein & W illen (F RB Boston) Cross Section of De bt September 19, 2016 7 1 1s

--
Introduction Empincal Strategy Evidence I m pltcations 0000 0 oe ooooooo 0000
Finding 2: No relative increase in debt among low income households Log Levels Deviated from CBSA-Year Means
N
(i) c .... ::3 ...... ,.. ~ .....
E Q)
0 0 ..ll:: (.)
U500 ..... c ...J
• o
year=2006 year=2001
• • •• •
• • 0
0
• 0
•
••• •• 0 0
0 0
• 00
• 0
0
•• 00 • 0
• oO 00
0
0
(i)ll)c . .... ::3 ...... Q)
0::
• o
year=2005 year==2001 ~
~
~
• @.
•• •
"'.~· ~
8 • ~
0•-r 1
9 .5 10 10.5 11 11.5 -1 -.5 0 .5 1 Ln(lncome I Returns) Ln (lncome I Returns)
9
• Debt shifts up acoss all 1ncome • Within cities, no change
0 - .~!)<;('-Foote , Loewenstein & W illen (F RB Boston) Cross Section of De bt September 19, 2016 7 1 1s

--
• • • ••
•• •• ••
Introduction Empincal Strategy Evidence I m pltcations 0000 0 oe ooooooo 0000
Finding 2: No relative increase in debt among low income households Log Levels Deviated from CBSA-Year Means
• year=2006 0 year==2001 o•
~
~
~
e• ~
t•
• ., ~
~
•0
-1 -.5
• Debt shifts up acoss all 1ncome • With in citi es, no change
N
• year=2006 • o year=2001 •
(i) (i)ll)0c c . .... .... ::3 ::3...... ,.. ......• 0 Q)~ ..... • 0 0::
••• 0 0E Q) •• 0 0 0 • 000 •• 00..ll:: (.) • 0
• oOU500 ..... 00c
...J • 0 0
0
0 -r
1
9 .5 10 10.5 11 11.5 Ln(lncome I Returns)
0 .5 1 Ln(lncome I Returns)
9
0 - .~!)<;('-Foote , Loewenstein & W illen (F RB Boston) Cross Section of De bt September 19, 2016 7 1 1s

•• •• ••
Introduction Empincal Strategy Evidence I m pltcations 0000 0 oe ooooooo 0000
Finding 2: No relative increase in debt among low income households N .....
(i) c .... ::3 ...... ,.. ~ ..... --.c Q)
0-0 ..ll:: (.) 00U5..c ...J
• year=2006 0 year=2001
• 0
Log Levels
• • •••• 0• 0• 0• 00••• 00•• 00 • 0
• oO 00
0 0
• 0
• 0
•
(i)ll)c . .... ::3 ...... Q)
0::
15 ~0-0 ..ll:: (.)
.8 Cl)cLO ...J ,·
Ol
0 or'
9.5 10 10.5 Ln(lncome I Returns)
11 11.5
Deviated from CBSA-Year Means
• year=2006 0 year==2001 o•
~
~
~
e• ~
t•
• ., ~
~
•0
-1 -.5 0 .5 1 Ln (lncome I Returns)
9
• Debt shifts up acoss all income • Within cities, no change
• Regressions show no change in slope
0 - - .(!)<;('
Foote , Loewenstein & W illen ( F RB Boston) Cross Section of D ebt September 19, 2016 7 1 1s

•• •• ••
Introduction Empincal Strategy Evidence I m pltcations 0000 0 oe ooooooo 0000
Finding 2: No relative increase in debt among low income households N .....
(i) c .... ::3 ...... ,.. ~ ..... --.c Q)
0-0 ..ll:: (.) 00U5..c ...J
• year=2006 0 year=2001
• 0
Log Levels
• • •••• 0• 0• 0• 00••• 00•• 00 • 0
• oO 00
0 0
• 0
• 0
•
(i)ll)c . .... ::3 ...... Q)
0::
15 ~0-0 ..ll:: (.)
.8 Cl)cLO ...J ,·
Ol
0 or'
9.5 10 10.5 Ln(lncome I Returns)
11 11.5
Deviated from CBSA-Year Means
• year=2006 0 year==2001 o•
~
~
~
e• ~
t•
• ., ~
~
•0
-1 -.5 0 .5 1 Ln(lncome I Returns)
9
• Debt shifts up acoss all income • Within cities, no change
• Regressions show no change in slope • Identical results f rom SCF using individual level data
.(!)<;('
Foote , Loewenstein & W illen ( F RB Boston) Cross Section of D ebt September 19, 2016 7 1 1s
Introduction Empincal Strategy Evidence I m pltcations 0000 0 ooeoooooo 0000
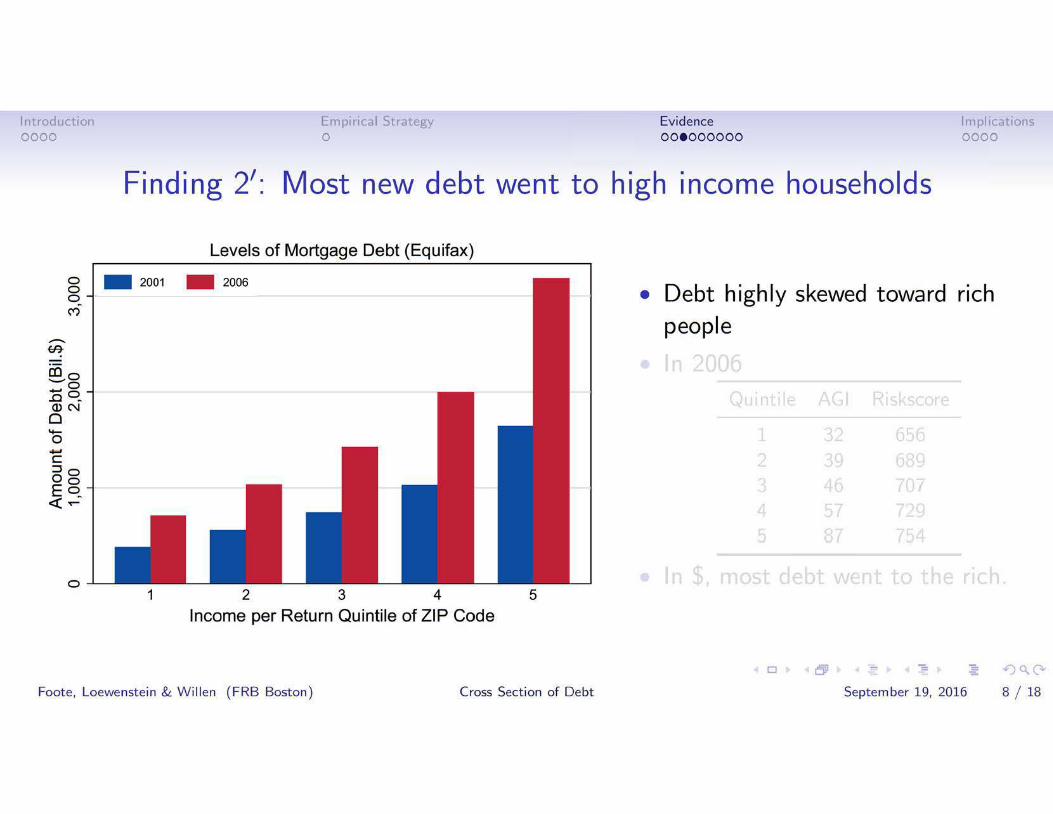
Finding 2': Most new debt went to high income households
Levels of Mortgage Debt (Equifax)
g0 ('()
0 -..,_, c :::JoOoEo <( ~-
0
- 2001 - 2006
1 2 3 4 Income per Return Quintile of ZIP Code
• Debt highly skewed toward rich people
5
0 .(!)<;('
Foote , Loewenstein & W il len (F RB Boston) Cross Section of Debt September 19, 2016 8 1 18

Introduction Empincal Strategy Evidence I m pltcations 0000
0 0 0 ('()
fflCO o..._...o ..... o.0 ~ <l>N 0
0 -..,_, c :::JoOo E o <( ~~
0
0 ooeoooooo 0000
Finding 2': Most new debt went to high income households
Levels of Mortgage Debt (Equifax)
- 2001 - 2006
1 2 3 4 5 Income per Return Quintile of ZIP Code
Foote , Loewe nstein & W il len ( F RB Boston) Cross Section of Debt
• Debt highly skewed toward rich people
• In 2006
Q ui ntile AGI Riskscore
1 32 656 2 39 689 3 46 707 4 57 729 5 87 754
0 Oil - .... .(!)<;('
September 19, 2016 8 1 18

Introduction Empincal Strategy Evidence I m pltcations 0000
0 0 0 ('()
fflCO o..._...o .0..... o <l>N
~
0
0 -..,_, c :::JoOo E o <( ~~
0
0 ooeoooooo 0000
Finding 2': Most new debt went to high income households
Levels of Mortgage Debt (Equifax)
- 2001 - 2006
1 2 3 4 5 Income per Return Quintile of ZIP Code
Foote , Loewenstein & W il len (F RB Boston) Cross Section of Debt
• D ebt highly skewed toward rich peopl e
• In 2006
Q ui ntile AGI Riskscore
1 32 656 2 39 689 3 46 707 4 57 729 5 87 754
• In $, most debt went t o the rich.
0 - .(!)<;('= September 19, 2016 8 1 18

Introduction Empincal Strategy Evidence I m pltcations 0000 0 oooeooooo 0000
Finding 3: Relative changes in originations offset by terminations
0
Binned Scatterplot: Originations
o year=2002 •
-1 -.5 0 .5
Ln(lncome I Returns)
1
• Growth in stock of debt is
l:l. Stock' ,V'
Net flow
== Purchases + Cash-Out
Gross flow in
Curtailment Amortization
Gross flow out
Sales
Foote , Loewenstein & W illen (F RB Boston) Cross Section of De bt
0 -
September 19, 2016 - .(!)<;('
9 1 1s

Introduction Empincal Strategy Evidence I m pltcations 0000 0 oooeooooo 0000
Finding 3: Relative changes in originations offset by terminations
Binned Scatterplot: Originations Binned Scatterplot: Terminations -Vl
o
-1 -.5 0 .5 1 -1 -.5 0 .5 1 Ln(lncome I Returns) Ln(lncome I Returns)
• Growth in stock of debt is
l:l. Stock == Purchases + Cash-Out - Curtailment - Amortization - Sales
Net flow Gross flow in Gross flow out 0 - .(!)<;('-
Foote , Loewenstein & W illen (F RB Boston) Cross Section of De bt September 19, 2016 9 1 1s
c '-rl0 :l ...... (])
CX:LI) ........... year=2002 Vl c 0 0 +---------~ ~ ro -~ Ll)E ,·,_ (])
1-ri •
-c· ....J
o year=2002 • 0 •0. 0
•

Introduction Empincal Strategy Evidence I m pltcations 0000 0 oooeooooo 0000
Finding 3: Relative changes in originations offset by terminations
-Vl Binned Scatterplot: Originations Binned Scatterplot: Terminations
o o year=2002 • c '-...-40 ::::l ...... (])
a:::IJ"l .......... . year=2002 Vl c 0 0 +---------~ ~ ro -~ IJ"lE ~· •.... (J)
1-...-t -c~ .....J
0 •0. 0
•
-1 -.5 0 .5 1 -1 -.5 0 .5 1 Ln(lncome I Returns) Ln(lncome I Returns)
• Growth in stock of debt is
Binned Scatterplot: Stock of Debt-V)
c '-...-4 ::::l.... (J)
a:::IJ"l .......... .... ..0 <1Jo0
0 -~Lf") v I
0.... ~...-t c I
.....J
-1 -.5 0 .5 1
Ln(lncome I Returns)
l:l. Stock == Purchases + Cash-Out - Curtailment - Amortization - Sales
Net fl ow Gross f low in Gross flow out 0 - .(!)<;('-
Foote , Loewenstein & W illen (F RB Boston) Cross Section of De bt September 19, 2016 9 1 1s

Introduction Empincal Strategy Evidence I m pltcations 0000 0 ooooeoooo 0000
Finding 4: Relative increase in churn New Purchase Mortgages/ Al l l st mortgages
- 2001
- 2006
• In marginal areas, there was an increase in transactions (Adelino, et al. (2016) , Mian and Sufi (2009, 2016)).
1 2 3 4 5 Income Quintile
0 Oil - .(!)<;('
Foote , Loewenstein & W illen (F RB Boston) Cross Section of Debt September 19 , 2016 10 1 1s

Introduction Empincal Strategy Evidence I m pltcations 0000 0 ooooeoooo 0000
Finding 4: Relative increase in churn New Purchase Mortgages/ Al l l st mortgages
- 2001
- 2006
• In marginal areas, there was an increase in transactions (Adelino, et al. (2016) , Mian and Sufi (2009, 2016)).
1 2 3 4 5 Income Quintile
• People bought more homes
0 Oil - .(!)<;('
Foote , Loewenstein & W illen (F RB Boston) Cross Section of Debt September 19 , 2016 10 1 1s

Introduction Empincal Strategy Evidence I m pltcations 0000 0 ooooeoooo 0000
Finding 4: Relative increase in churn New Purchase Mortgages/ Al l l st mortgages
- 2001
- 2006
• In marginal areas, there was an increase in transactions (Adelino, et al. (2016) , Mian and Sufi (2009, 2016)).
Income Quintile • People bought more homes
• People a I so sold more homes
1 2 3 4 5
0 Oil - .(!)<;('
Foote , Loewenstein & W illen (F RB Boston) Cross Section of Debt September 19 , 2016 10 1 1s

Introduction Emprncal Strategy Evide nce lmpltcattons 0000 0 ooooeoooo 0000
Finding 4: Relative increase in churn New Purchase Mortgages/All 1st mortgages
- 2001
- 2006
• In marginal areas, there was an increase in transactions (Adeline, et al. (2016) , Mian and Sufi (2009 , 2016)).
1 2 3 4 5 Income Ouintile
• People bought more homes Owner Occupied, Within CBSA
• People a I so sold more homes
• Role of investors
Income per Return Qulntile
- 2001 - 2006
0 1 2 3 4 5
Foote , Loewenst ei n&. Will en (FRB Boston) Cross Section of Debt September 19, 2016 10 / 18

---
Introduction Empincal Strategy Evidence I m pltcations 0000 0 oooooeooo 0000
Finding 5: No influx of "margina l" borrowers
N 0
0
Probability of Acquiring First Mortgage by Within CBSA Credit Score Quintile
t--1 I..... ---- ... -- • Ql
ON COlli ..... . a. 0 0)
...... ... ... ... ... .... ·-·-·-·-·-·- -·-·-·-· ..... .'
- - - · - · - · - · - 0
------------- ... ... ... I'V
-. .. . ... . ... .... . ... . ... . ... ....------------------ 0
2002 2004 2006 2008 2010 2012
---- l - · -- - · - · - 2 - · - · - · 3 -------· 4 -- S (HighestCredit Scores)
• "Ex tensive margin"
0 L5il - .~!)<;('
Foote , Loewenstein & W il len (F RB Boston) Cross Section of Debt September 19 , 2016 11 1 18

Introduction Empincal Strategy Evidence I m pltcations 0000 0 oooooeooo 0000
Finding 5: No influx of "marginal" borrowers Probability of Acquiring First Mortgage by Within CBSA Credit Score Quintile
rl
-e rocx:> NOro • :c \0
0
·-.
-
..... --- ... ·-t-1
:c • Ql ON COlli ..... . a. 0 0)
N 0
0
... ... ... ... .... ·-·-·-·-·-·- ·-· ·-· ' .
------------
...... ..... .
- - - · - · - · ·
----------------- ... ... ... -. .. . ... . ... .... . ... . ... . ... ....
0 I'V
0
2002 2004 2006 2008 2010 2012
---- l - · - · - · - · - 2 - · - · - · 3 -------- 4 -- S(HighestCredit Scores)
• "Extensive margin"
• As documented by Bhutta {2015),
probability of first-time homebuying
(mortgageship), actually went down. 0 .(!)<;('
Foote , Loewenstein & W il len (F RB Boston) Cross Section of Debt September 19 , 2016 11 1 18

--------
lntroductcon Empincal Strategy Evidence Implications 0000 0 oooooe ooo 0000
Finding 5: No influx of "marginal" borrowers
Within CBSA ~ • 2001 • 2006
, .. ••
,..••• I ·' •
c;o Q) ,. u .... ,Q) c.. ~N c . -I ~ '
I
• ~ . ~~----------~----------~------------~
-.5 0 .5 1 ln(lncome Per Return)
• Fraction of mortgaged households (not
homeownership rate) by income
0
...-l
N ...-l
...-l
"0 ..... roco NO ro • :I: ~
0
'=t o
N 0
0
Probability of Acquiring First Mortgage by Within CBSA Credit Score Quintile
~ ~------~----------------------------~
1-' :I:
• Ql ON (X)QI..., , Q. 0
-
0\
0
... ----- 0
~
----------------- -- --............. - -·- ..... -N
----------- 0
..................
---·-·-·-···... __ _
L---~----~----~----~------~----~~ 2002 2004 2006 2008 2010 2012
--- - 1 - · - · - · - · - 2 - · - · - · 3 - ------- 4 --- 5 (Highest Credit S<ores)
• ,.Extensive margin"
• As documented by Bhutta {2015),
probability of first- time homebuying
(mortgageship) , actually went down . Foote, Loewenstein & Willen ( FRB Boston) Cross Section of Debt September 19, 2016 11 / 18

--------
lntroductcon Empincal Strategy Evidence Implications 0000 0 oooooe ooo 0000
Finding 5: No influx of "marginal" borrowers
Within CBSA ~ • 2001 • 2006
, .. ••
,..••• I ·' •
c;o Q) ,. u .... ,Q) c.. ~N c . -I ~ '
I
• ~ . ~~----------~----------~----------~
-.5 0 .5 1 ln(lncome Per Return)
• Fraction of mortgaged households (not
homeownership rate) by income
• No change 0
...-l
N ...-l
...-l
"0 ..... roco NO ro • :I: ~
0
'=t o
N 0
0
Probability of Acquiring First Mortgage by Within CBSA Credit Score Quintile
~ ~------~----------------------------~
1-' :I:
• Ql ON (X)QI..., , Q. 0
-
0\
0
... - ---- 0
~
----------------- -- --............. - -·- ..... -N
----------- 0
..................
---·-·-·-···... __ _
L---~----~----~----~----~----~--~ 2002 2004 2006 2008 2010 2012
--- - 1 - · - · - · - · - 2 - · - · - · 3 - ------- 4 -- 5 (Highest Credit S<ores)
• ,.Extensive margin"
• As documented by Bhutta {2015),
probability of first- time homebuying
(mortgageship) , actually went down . Foote, Loewenstein & Willen ( FRB Boston) Cross Section of Debt September 19, 2016 11 / 18

0000 Introduction Empincal Strategy Evidence I m pltcations
o750 0 rl
II 500 ("'' rl 0 ("'1250 ~
~ ro ~ 0
0 ooooooeoo 0000
Finding 5': Rea Iity Check
I I
• Credit availability- all time high
MBA Mortgage Credit Availabi lity Index').
96 97 98 99 00 01 02 03 04 05 06 07 08 09 10 11 12 13 14
0 Oil - .(!)<;('
Foote , Loewenstein & W il len (F RB Boston) Cross Section of Debt September 19, 2016 12 1 1s

Introduction Empincal Strategy Evidence I m pltcations 0000 0 ooooooeoo 0000
Finding 5': Rea Iity Check
o750 0 ~
II 500 01
0 ~
01 250J:: v 'ro ~ 0
I I
MBA Mortgage Credit Availabi lity Index').
NAR First-T ime Homebuyer Qua lifying
Income
96 97 98 99 00 01 02 03 04 05 06 07 08 09 10 11 12 13 14
• Credit availability- all time high
• Income needed for mortgage all time high
50 ~ 4-0
40~ 0 0 c:
30
0 Oil - .(!)<;('
Foote , Loewenstein & W il len (F RB Boston) Cross Section of Debt September 19 , 2016 12 1 1s

Introduction Empincal Strategy Evidence I m pltcations 0000 0 ooooooeoo 0000
Finding 5': Rea Iity Check
o750 0 ~
II 500 01
0 ~
01 250J:: v ' ro ~ 0
I I
MBA Mortgage Credit Availabi lity Index').
NAR First-T ime Homebuyer Qua lifying
Income
96 97 98 99 00 01 02 03 04 05 06 07 08 09 10 11 12 13 14
• Credit availability- all time high
• Income needed for mortgage all time high
50 ~ • Affordability - all tim e low 4-0
40~ 0 0 c:
30
0 Oil - .(!)<;('
Foote , Loewenstein & W il len (F RB Boston) Cross Section of Debt September 19 , 2016 12 1 1s

Introduction Empincal Strategy Evidence I m pltcations 0000 0 oooooooe o 0000
Finding 6 : No change in distribution of defaults
• In 2009, disproportionate share of default were low income areas.
0 Oil - .(!)<;('
Foote , Loewenstein & W illen (F RB Boston) Cross Section of Debt September 19, 2016 13 1 18

• •
Introduction Empincal Strategy Evidence I m pltcations 0000 0 oooooooe o 0000
Finding 6: No change in distribution of defaults
• In 2009, disproportionate share of default were low income areas.
• Low income areas always have higher defaults!
Across All Zip Cod es ~
0 2001 • 2009• •
1.1"'1 •
~
('f)
• • • • • • I 0
...... 0 •IU'<t 0a:: • •0
.:!::: •0:I 0
0 •IU
..... 1.1"'1Q) • e. or 0 0
0 c 0
01.1"'1 0 ' 0
0
II)
~ ~~----------~----------~----------~ 3 3.5 4 4.5
ln( lncome Per Return) 0 Oil - .(!)<;('
Foote , Loewenstein & W il len ( F RB Boston) Cross Section of Debt September 19 , 2016 13 1 1s

• • • • • • • • • •
Introduction Empincal Strategy Evidence I m pltcations 0000 0 ooooooo e o 0000
Finding 6: No change in distribution of defaults
• In 2009, disproport ionat e share of default were low income areas.
• Low income areas always have higher defaults!
• With CBSA fixed effects
Across All Zip Cod es Dev iated from CBSA-Year Means
0 2001 • 2009•
0
•0 •
0 0
• 30
•0 ~ <II
0 0 eo 0
c 0
0If\ 0 ' 0
0 If\
' ~ ~ ~~----------~------------~----------~
0 200 1 • 2 0 0 9
0
• 0
••0
0 0
•• 0 -·------------------------ ! _.,_i ___________________________ _ ~ ~
•0
•0
3 3.5 4 4.5 -. 5 0 .5 ln( lncome Per Return) ln(lncome Per Return) .(!)<;('
Foote , Loewenstein & W illen ( F RB Boston) Cross Section of D ebt September 19 , 2016 13 1 1s

Introduction Empincal Strategy Evidence I m pltcations 0000 0 ooooooooe 0000
Finding 7: Subprime didn't cause a reallocation, it prevented one
Contributions of Mortgage Types to Total Z IP-Level Debt Growth, by Initial Income Group of ZIP Code: 2001-2006
- Subprime - Alt-A - Prime coco0 . 0N • Subprime was skewed t o low...-'"-. 0 0 1ncome areas. Nco ;..:... c,_ ::II{)Q) • 0:::: "-'O:tQ) • a. .OM-Q)
0-.EC\! 0 -..c...~ 0,_ (.90
· G)co..., 0
. ~ -....j =r
0-<:n:r 0
. CD <.ncr-
1 3 5 7 9 11 13 15 17 19 Income per Return Group of ZIP Code in 2001
0 L5il - .(!)<;('
Foote , Loewenstein & Willen (F RB Boston) Cross Section of Debt September 19, 2016 14 1 1s

Introduction Empincal Strategy Evidence I m pltcations 0000 0 ooooooooe 0000
Finding 7: Subprime didn't cause a reallocation, it prevented one
Contributions of Mortgage Types to Total Z IP-Level Debt Growth, by Initial Income Group of ZIP Code: 2001-2006
- Subprime - Alt-A - Prime coco0 . 0N • Subprime was skewed t o low...-'"-. 0 0 1nco me areas. Nco ;..:... c,_ ::II{) • Offset a little by Alt-A Q) •
0:::: "-'O:tQ) • a. .OM-Q)
0-.EC\! 0 -..c...~ 0,_ (.90
· G)co..., 0
. ~ -....j =r
0-<:n:r 0
. CD <.ncr-
1 3 5 7 9 11 13 15 17 19 Income per Return Group of ZIP Code in 2001
0 Oil - .(!)<;('
Foote , Loewenstein & W il len (F RB Boston) Cross Section of Debt September 19, 2016 14 1 1s

Introduction Empincal Strategy Evidence I m pltcations 0000 0 ooooooooe 0000
Finding 7: Subprime didn't cause a reallocation, it prevented one
Contributions of Mortgage Types to Total ZIP-Level Debt Growth, by Initial Income Group of ZIP Code: 2001-2006
- Subprime - Alt-A - Prime coco0 . 0N • Subprime was skewed to low...-'"-. 0 0 1ncome areas. Nco ;..:... c,_ ::II{) • Offset a little by Alt-AQ) •
0:::: "-'O:tQ) • • If we only had prime, boom a. .OM-Q) would have resulted in big shift0-.EC\! in debt to high income areas . 0 -..c...~ 0,_ (.90
· G)co..., 0
. ~ -....j =r
0-<:n:r 0
. CD <.ncr-
1 3 5 7 9 11 13 15 17 19 Income per Return Group of ZIP Code in 2001
0 Oil - .(!)<;('
Foote , Loewenstein & W il len (F RB Boston) Cross Section of Debt September 19 , 2016 14 1 1s
___ ___________
Introduction Empincal Strategy Evidence Impl ications 0000 0 000000000 eooo
Explaining the ,Beem---- ------ -~ I \ 1 r Constrained " I
Low Income Why? P' ~
Low Credit Score ~ ~ \..• Securitization
~ t~ ~• Deregulation Credit
Relati+e ShiftExpansion• Over-regulation I • Optimistic HPA
,
Unconstrained Beliefs? High Income
\ High Credit Score ~----------------- '
__,
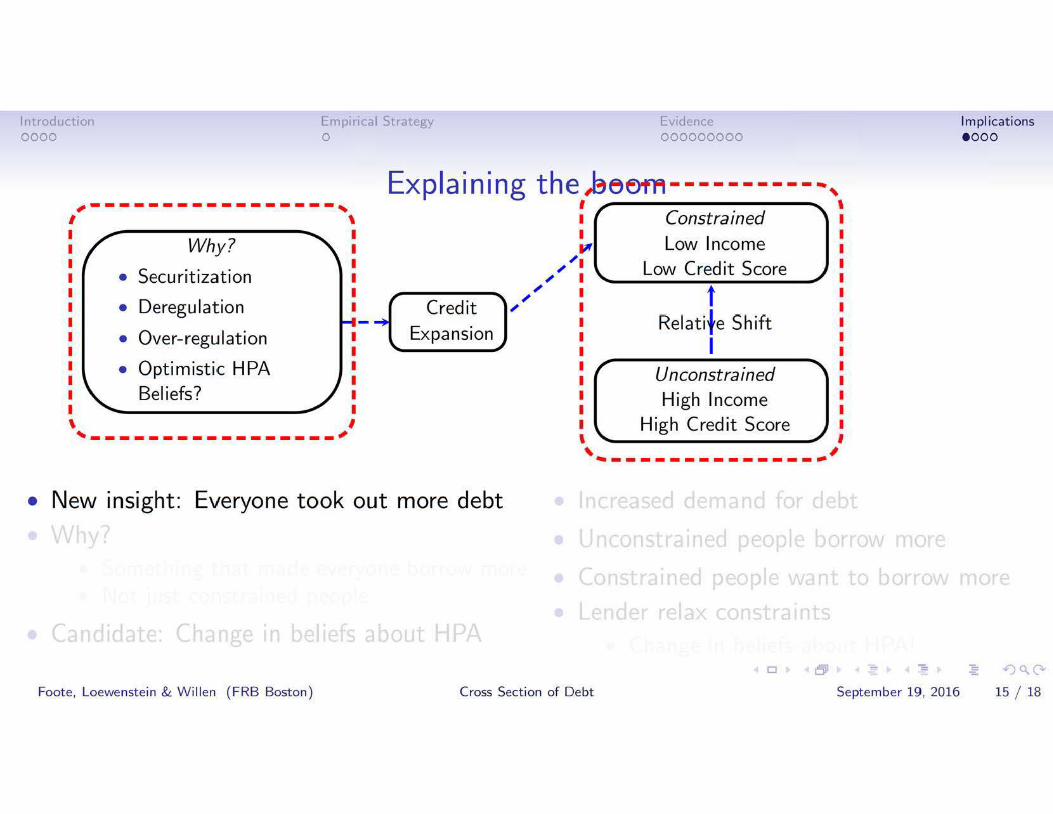
• New insight: Everyone took out more debt
0 L5il - .(!)<;('
Foote , Loewenstein & W illen (F RB Boston) Cross Section of Debt September 19 , 2016 1s 1 18

___ ___________
Introduction Empincal Strategy Evidence Impl ications 0000 0 000000000 eooo
Explaining the ,Beem---- ------ -~
Why?
• Securitization
• Deregulation
,
Credit
Expansion• Over-regulation
• Optimistic HPA Beliefs?
\
~----------------- '
• New insight: Everyone took out more debt
• Why?
I \ 1 r Constrained " I
Low Income P' ~
Low Credit Score ~ ~ \..
~ t~ ~
No Rela~ive Shift
Unconstrained"' High Income
High Credit Score __,
0 L5il - .(!)<;('
Foote , Loewenstein & W illen (F RB Boston) Cross Section of Debt September 19 , 2016 1s 1 18

Introduction Empincal Strategy Evidence Impl ications 0000 0
I ~-----------------,
\
Why?
• Securitization
• Deregulation
• Over-regulation
• Optimistic HPA Beliefs?
~-----------------'
• New insight: Everyone took out more debt
• Why? • Something that made everyone borrow more
I I I I I I
I I I I I I
000000000 eooo
---- -------~ \
~~ ~~
~Credit -~
Expansion
I
Explaining the ,Beem I 1 r Constrained " I
Low Income P' ~
~ Low Credit Score ~ '-------~t--------~
No Rela~ive Shift
Unconstrained"' High Income
High Credit Score ,________________,
\
0 L5il - .(!)<;('
Foote , Loewenstein & W illen (F RB Boston) Cross Section of Debt September 19 , 2016 1s 1 18

Introduction Empincal Strategy Evidence Impl ications 0000 0 000000000 eooo
Explaining the ,Beem---- -------~ I \
I ~-----------------,\ 1 r Constrained " I I I I I I
I I I I I I
,
I Low Income Why? P'
~~ ~
~ Low Credit Score ~• Securitization ~~ '-------~t--------~ ~• Deregulation Credit
-~ No Rela~ive ShiftExpansion• Over-regulation
• Optimistic HPA Unconstrained"' Beliefs? High Income
High Credit Score \ I ________________,~-----------------'
• New insight: Everyone took out more debt
• Why? • Something that made everyone borrow more • Not just constrained people
0 L5il - .(!)<;('
Foote , Loewenstein & W illen (F RB Boston) Cross Section of Debt September 19 , 2016 1s 1 18

Introduction Empincal Strategy Evidence Impl ications 0000 0 000000000 eooo
Explaining the ,Beem ---- -------~ I \
I ~-----------------,\ 1 r Constrained " I I I I I I
I I I I I I
_______________,_
I Low Income Why? P'
~~ ~
~ Low Credit Score ~• Securitization ~~ '-------~t--------~
~• Deregulation Credit -~ No Rela~ive ShiftExpansion• Over-regulation
• Optimistic HPA Unconstrained"' Beliefs? High Income
High Credit Score \ I ,~-----------------'
• New insight: Everyone took out more debt
• Why? • Something that made everyone borrow more • Not just constrained people
• Candidate: Change in beliefs about HPA 0 L5il - .(!)<;('
Foote , Loewenstein & W illen (F RB Boston) Cross Section of Debt September 19 , 2016 1s 1 18

Introduction Empincal Strategy Evidence Impl ications 0000 0 000000000 e ooo
Explaining the ,Beem ---- -------~ I \
I ~-----------------,\ 1 r Constrained " I I I I I I
I I I I I I
I Low Income Why? P'
~~ ~
~ Low Credit Score ~• Securitization ~~ '-------~t--------~
~• Deregulation Credit -~ No Rela~ive ShiftExpansion• Over-regulation
• Optimistic HPA Unconstrained"' Beliefs? High Income
\ I High Credit Score ~-----------------'
'~---------------' • New insight: Everyone took out more debt • Increased demand for debt
• Why? • Something that made everyone borrow more • Not just constrained people
• Candidate: Change in beliefs about HPA 0 Oil - .(!)<;('
Foote , Loewenstein & W il len ( F RB Boston) Cross Section of Debt September 19 , 20 16 1s 1 18

Introduction Empincal Strategy Evidence Impl ications 0000 0 000000000 eooo
Explaining the ,Beem ---- -------~ I \
I ~-----------------,\ 1 r Constrained " I I I I I I
I I I I I I
I Low Income Why? P'
~~ ~
~ Low Credit Score ~• Securitization ~~ '-------~t--------~
~• Deregulation Credit -~ No Rela~ive ShiftExpansion• Over-regulation
• Optimistic HPA Unconstrained"' Beliefs? High Income
\ I High Credit Score ~-----------------'
'~---------------' • New insight: Everyone took out more debt • Increased demand for debt
• Why? • Unconstrained people borrow more • Something that made everyone borrow more • Not just constrained people
• Candidate: Change in beliefs about HPA 0 Oil - .(!)<;('
Foote , Loewenstein & W il len (F RB Boston) Cross Section of Debt September 19 , 2016 1s 1 18

Introduction Empincal Strategy Evidence Impl ications 0000 0 000000000 eooo
Explaining the ,Beem ---- -------~ I \
I ~-----------------,\ 1 r Constrained " I I I I I I
I I I I I I
I Low Income Why? P'
~~ ~
~ Low Credit Score ~• Securitization ~ '---------t~-------'
Credit ~~• Deregulation -~ No Rela~ive ShiftExpansion• Over-regulation
• Optimistic HPA Unconstrained"' Beliefs? High Income
\ I High Credit Score ~-----------------'
'~---------------' • New insight: Everyone took out more debt • Increased demand for debt
• Why? • Unconstrained people borrow more
• Something that made everyone borrow more • Constrained people want to borrow more • Not just constrained people
• Candidate: Change in beliefs about HPA 0 Oil - .(!)<;('
Foote , Loewenstein & W illen (F RB Boston) Cross Section of De bt September 19 , 2016 1s 1 18

Introduction Empincal Strategy Evidence Impl ications 0000 0 000000000 eooo
Explaining the ,Beem ---- -------~ I \
I ~-----------------,\ 1 r Constrained " I I I I I I
I I I I I I
I Low Income Why? P'
~~ ~
~ Low Credit Score ~• Securitization ~ '---------t~-------'
Credit ~~• Deregulation -~ No Rela~ive ShiftExpansion• Over-regulation
• Optimistic HPA Unconstrained"' Beliefs? High Income
\ I High Credit Score ~-----------------'
'~---------------' • New insight: Everyone took out more debt • Increased demand for debt
• Why? • Unconstrained people borrow more • Something that made everyone borrow more • Constrained people want to borrow more • Not just constrained people
• Lender relax constraints • Candidate: Change in beliefs about HPA
0 Oil - .(!)<;('
Foote , Loewenstein & W illen (F RB Boston) Cross Section of De bt September 19 , 2016 1s 1 18

-----------------
Introduction Empincal Strategy Evidence Impl ications 0000 0
I ~-----------------,\
Why?
• Securitization
• Deregulation
• Over-regulation
• Optimistic HPA Beliefs?
\
000000000 eooo
Explaining the ,Beem ---- -------~
I I I I I I
I I I I I I
-~ Expansion
I
Credit ~~
~-----------------'
• New insight: Everyone took out more debt
• Why? • Something that made everyone borrow more • Not just constrained people
• Candidate: Change in beliefs about HPA
: r Constrained "" I
Low Income P'
~~ ~
~ Low Credit Score ~ ~ '---------t~-------'
No Rela~ive Shift
Unconstrained"' High Income
High Credit Score
'
'
, • Increased demand for debt
• Unconstrained people borrow more
• Constrained people want to borrow more
• Lender relax constraints
• Change in beliefs about HPA! 0 Oil - .(!)<;('
Foote , Loewenstein & W illen (F RB Boston) Cross Section of De bt September 19 , 2016 1s 1 18

Introduction Empincal Strategy Evidence Impl ications 0000 0 000000000 oeoo
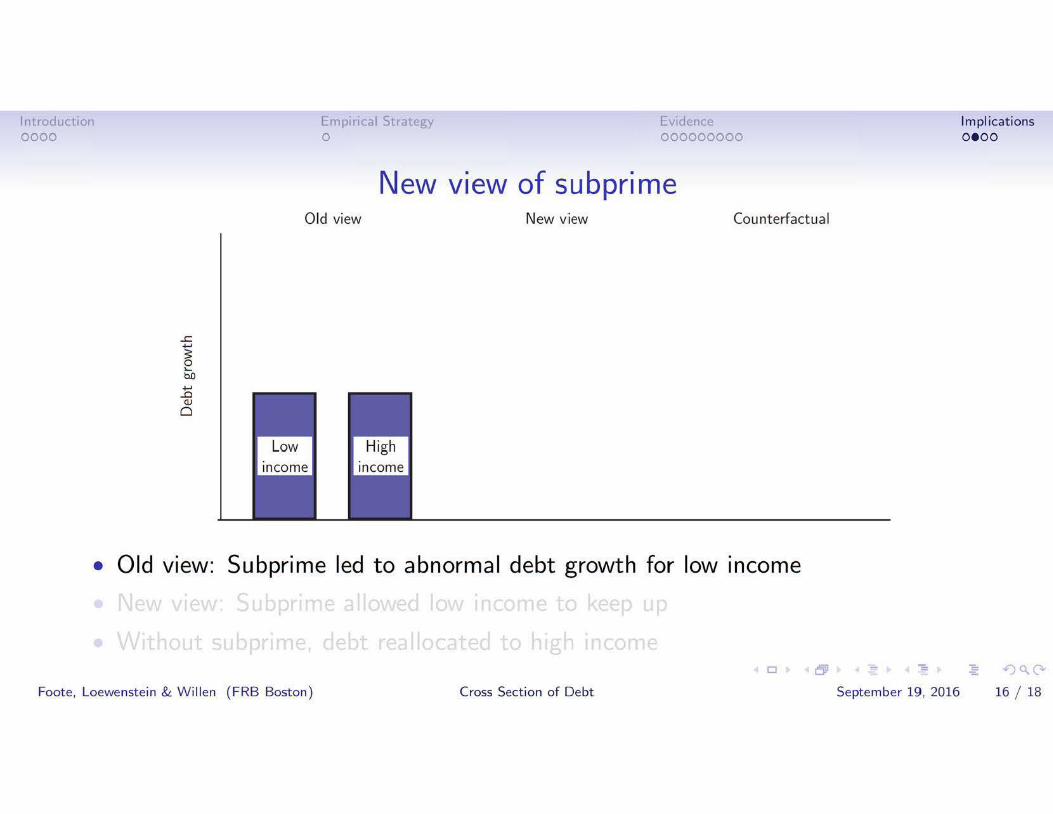
New view of subprime Old view New view Counterfactual
....c ...... g "bD
...... ....0 Q)
0
• Old view: Subprime led to abnormal debt growth for low income
0 Oil - .(!)<;('
Foote , Loewenstein & W il len (F RB Boston) Cross Section of Debt September 19 , 2016 16 1 1s
Introduction Empincal Strategy Evidence Impl ications 0000 0 000000000 oeoo
New view of subprime Old view New view Counterfactual
....c ...... g "bD
...... ....0 Q)
0
• Old view: Subprime led to abnormal debt growth for low income
0 Oil - .(!)<;('
Foote , Loewenstein & W il len (F RB Boston) Cross Section of Debt September 19 , 2016 16 1 1s

Introduction Empincal Strategy Evidence Impl ications 0000 0 000000000 oeoo
New view of subprime Old view New view Counterfactual
....c ...... g "bD
...... ....0 Q)
0
• Old view: Subprime led to abnormal debt growth for low income
0 Oil - .(!)<;('
Foote , Loewenstein & W illen (F RB Boston) Cross Section of Debt September 19 , 2016 16 1 18

Introduction Empincal Strategy Evidence Impl ications 0000 0 000000000 oeoo
New view of subprime Old view New view Counterfactual
....c ...... g "bD
...... ....0 Q)
0
• Old view: Subprime led to abnormal debt growth for low income
• New view: Subprime allowed low income to keep up
• Without subprime, debt reallocated to high income 0 Oil - .(!)<;('
Foote , Loewenstein & W illen (F RB Boston) Cross Section of Debt September 19 , 2016 16 1 18

Introduction Empincal Strategy Evidence Impl ications 0000 0 000000000 ooe o
Contribution of Non-Prime PLS Lending
Total Debt~
99 00 01 02 03 04 05 06 07 08 09 10 11
• T ota I debt rose a bout 6
trillion
0 Oil - .(!)<;('
Foote , Loewenstein & W illen (F RB Boston) Cross Section of Debt September 19 , 2016 17 1 1s

Introduction Empincal Strategy Evidence Impl ications 0000 0 000000000 ooe o
Contribution of Non-Prime PLS Lending
~------------
10 I
Total Debt~
---------------------·
• T ota I debt rose a bout 6~:I trillion ~ I fl • Suppose all that had
happened in the boom061
was securitized subpri me
and Alt-A541 --- I ""2001 Debt
99 00 01 02 03 04 05 06 07 08 09 10 11
0 Oil - .(!)<;('
Foote , Loewenstein & W illen (F RB Boston) Cross Section of Debt September 19 , 2016 17 1 1s

Introduction Empincal Strategy Evidence Implications 0000 0 000000000 ooe o
Contribution of Non-Prime PLS Lending
Total Debt~
99 00 01 02 03 04 05 06 07 08 09 10 11
• T ota I debt rose a bout 6
trillion
• Suppose all that had
happened in the boom
was securitized subpri me
and Alt-A
0 Oil - .(!)<;('
Foot e , Loewenstein & Willen (F RB Boston) Cross Section of Debt September 19, 2016 17 1 1s

Introduction Empincal Strategy Evidence Implications 0000 0 000000000 ooe o
Contribution of Non-Prime PLS Lending
Total Debt '\t
2001 Debt+Subprime /+Alt-A
99 00 01 02 03 04 05 06 07 08 09 10 11
• T ota I debt rose a bout 6
trillion
• Suppose all that had
happened in the boom
was securitized subpri me
and Alt-A
0 Oil - .(!)<;('
Foot e , Loewenstein & Willen (F RB Boston) Cross Section of Debt September 19, 2016 17 1 1s

Introduction Empincal Strategy Evidence Impl ications 0000 0 000000000 oooe
The slide you've all been waiting for.. .
0 Oil - .(!)<;('
Foote , Loewenstein & W illen (F RB Boston) Cross Section of Debt September 19 , 2016 18 1 18

Introduction Empincal Strategy Evidence Implications 0000 0 000000000 oooe
The slide you've all been waiting for.. .
• The end .
0 Oil - .(!)<;('
Foot e , Loewenstein & Willen (F RB Boston) Cross Section of Debt September 19, 2016 18 1 18