crowdsourcing, benchmarking & other cool things
TRANSCRIPT

crowdsourcing, benchmarking & other cool things
Fei-Fei Li(publish under L. Fei-Fei)
Computer Science Dept. Psychology Dept.
Stanford University

is team work!
Other contributors• Princeton graduate students
– Wei Dong– Zhe Wang
• Stanford graduate students– John Le– Pao Siangliulue
• AMT partner– Dolores Lab
WordNet friends
Christiane FellbaumPrinceton U.
Dan OshersonPrinceton U.
co-PI
Kai LiPrinceton U.
Research collaborator;ImageNet Challenge boss
Alex BergColumbia U.
Graduate students
Jia DengPrinceton/Stanford
Hao SuStanford U.


outline• Goal of ImageNet:
– A dataset– A knowledge ontology
• Construction of ImageNet– 2-step process– Crowdsourcing: Amazon Mechanical Turk (AMT)– Properties of ImageNet
• Benchmarking: what does classifying 10k+ image categories tell us?– Computation matters– Size matters– Density matters– Hierarchy matters
• Human vision: Rosch revisited and quantified– Quantifying basic-, subordinate- and superordinate-level concepts
• In the horizon: ImageNet Spring 2010 release– The upcoming ImageNet Challenge (in partnership with PASCAL VOC)– Visualizing ImageNet– Etc.
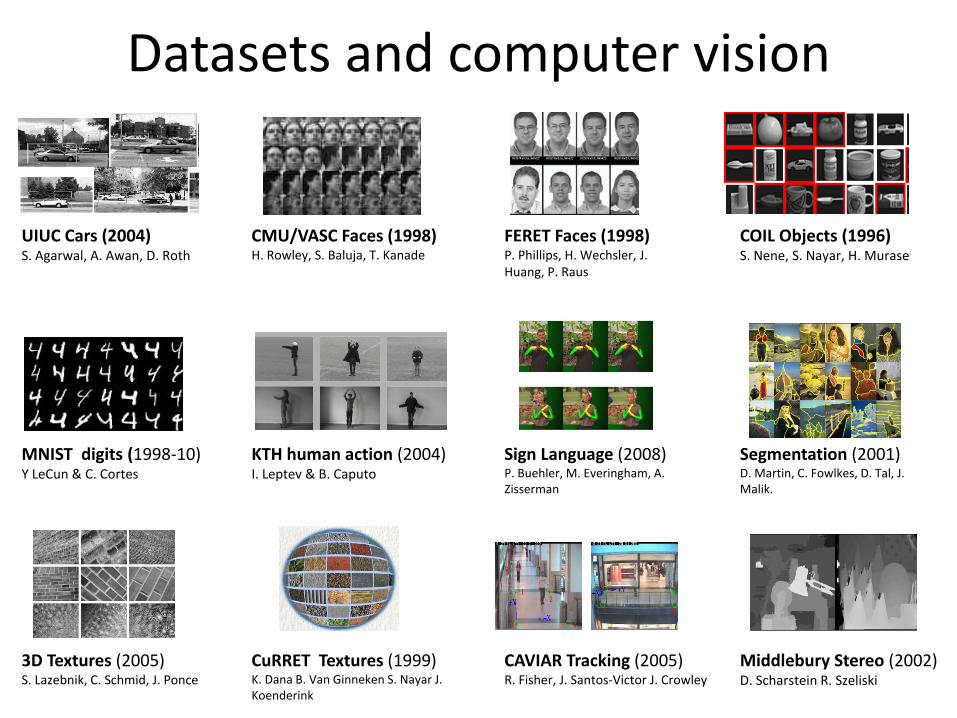
Datasets and computer vision
UIUC Cars (2004)S. Agarwal, A. Awan, D. Roth
3D Textures (2005)S. Lazebnik, C. Schmid, J. Ponce
CuRRET Textures (1999)K. Dana B. Van Ginneken S. Nayar J. Koenderink
CAVIAR Tracking (2005)R. Fisher, J. Santos-Victor J. Crowley
FERET Faces (1998)P. Phillips, H. Wechsler, J. Huang, P. Raus
CMU/VASC Faces (1998)H. Rowley, S. Baluja, T. Kanade
MNIST digits (1998-10)Y LeCun & C. Cortes
KTH human action (2004)I. Leptev & B. Caputo
Sign Language (2008)P. Buehler, M. Everingham, A. Zisserman
Segmentation (2001)D. Martin, C. Fowlkes, D. Tal, J. Malik.
Middlebury Stereo (2002)D. Scharstein R. Szeliski
COIL Objects (1996)S. Nene, S. Nayar, H. Murase

Motorbike
Things
Fergus, Perona, Zisserman, CVPR 2003
ObjectRecognition

Fergus, Perona, Zisserman, CVPR 2003
Motorbike Face
LeopardAirplane
Holub, et al. ICCV 2005; Sivic et al. ICCV 2005
ObjectRecognition

MotorbikeCaltech101
Fergus, Perona, Zisserman, CVPR 2003
Holub, et al. ICCV 2005; Sivic et al. ICCV 2005
ObjectRecognition
PASCAL[Everingham et al,2009]
MSRC[Shotton et al. 2006]
Fei-Fei et al. CVPR 2004; Grauman et al. ICCV 2005; Lazebnik et al. CVPR 2006Zhang & Malik, 2006; Varma & Sizzerman 2008; Wang et al. 2006; [….]

Fei-Fei et al. CVPR 2004; Grauman et al. ICCV 2005; Lazebnik et al. CVPR 2006Zhang & Malik, 2006; Varma & Sizzerman 2008; Wang et al. 2006; [….]
Fergus, Perona, Zisserman, CVPR 2003
Holub, et al. ICCV 2005; Sivic et al. ICCV 2005
Trail Bike
Motorbike
Moped
Go-cart
HelicopterCar, auto
Bicycle
Back
grou
nd im
age
cour
tesy
: Ant
onio
Torr
alba
Biederman 1987
ObjectRecognition
ESP[Ahn et al, 2006]
LabelMe[ Russell et al, 2005]
TinyImageTorralba et al. 2007
Lotus Hill[ Yao et al, 2007]

is a knowledge ontology
• Taxonomy • Partonomy• The “social
network” of visual concepts– Hidden knowledge
and structure among visual concepts
– Prior knowledge– Context

is a knowledge ontology
• Taxonomy • Partonomy• The “social
network” of visual concepts– Hidden knowledge
and structure among visual concepts
– Prior knowledge– Context

is a knowledge ontology
• Taxonomy • Partonomy• The “social
network” of visual concepts– Prior knowledge– Context– Hidden knowledge
and structure among visual concepts

outline• Goal of ImageNet:
– A dataset– A knowledge ontology
• Construction of ImageNet– 2-step process– Crowdsourcing: Amazon Mechanical Turk (AMT)– Properties of ImageNet
• Benchmarking: what does classifying 10k+ image categories tell us?– Computation matters– Size matters– Density matters– Hierarchy matters
• Human vision: Rosch revisited and quantified– Quantifying basic-, subordinate- and superordinate-level concepts
• In the horizon: ImageNet Spring 2010 release– The upcoming ImageNet Challenge (in partnership with PASCAL VOC)– Visualizing ImageNet– Etc.

Constructing
Step 1:Collect candidate images
via the Internet
Step 2:Clean up the candidate
Images by humans
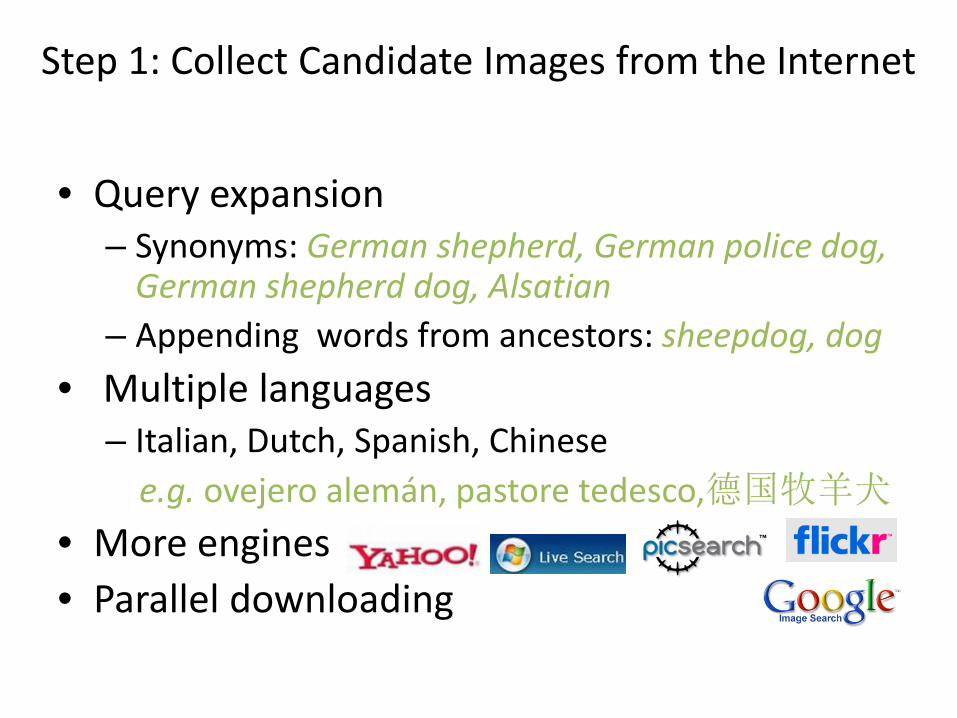
• Query expansion– Synonyms: German shepherd, German police dog,
German shepherd dog, Alsatian– Appending words from ancestors: sheepdog, dog
• Multiple languages– Italian, Dutch, Spanish, Chinese
e.g. ovejero alemán, pastore tedesco,德国牧羊犬
• More engines• Parallel downloading
Step 1: Collect Candidate Images from the Internet

• “Mammal” subtree ( 1180 synsets )– Average # of images per synset: 10.5K
0 1 2 3 4 5 6 7 8
x 104
0
20
40
60
80
100
120
140
160
180
200
# of images
# of
syn
sets
Histogram of synset size Most populated Least populated
Humankind (118.5k) Algeripithecus minutus (90)
Kitty, kitty-cat ( 69k) Striped muishond (107)
Cattle, cows ( 65k) Mylodonitid (127)
Pooch, doggie ( 62k) Greater pichiciego (128)
Cougar, puma ( 57k) Damaraland mole rat (188)
Frog, toad ( 53k ) Western pipistrel (196)
Hack, jade, nag (50k) Muishond (215)
Step 1: Collect Candidate Images from the Internet

• “Mammal” subtree (1180 synsets )– Average accuracy per synset: 26%
0 0.1 0.2 0.3 0.4 0.5 0.6 0.7 0.8 0.9 10
0.05
0.1
0.15
0.2
0.25
percentage of positive images
perc
enta
ge o
f syn
sets
Histogram of synset precisionMost accurate Least accurate
Bottlenose dolpin (80%) Fanaloka (1%)
Meerkat (74%) Pallid bat (3%)
Burmese cat (74%) Vaquita (3%)
Humpback whale (69%) Fisher cat (3%)
African elephant (63%) Walrus (4%)
Squirrel (60%) Grison (4%)
Domestic cat (59%) Pika, Mouse hare (4%)
Step 1: Collect Candidate Images from the Internet

Step 2: verifying the images by humans
• # of synsets: 40,000 (subject to: imageability analysis)
• # of candidate images to label per synset: 10,000 • # of people needed to verify: 2-5• Speed of human labeling: 2 images/sec (one fixation: ~200msec)
Moral of the story: no graduate students would want to do this project!
000,40 000,10× 3× 2/ sec000,000,600= years19≈

In summer 2008, we discovered crowdsourcing


• # of synsets: 40,000 (subject to: imageability analysis)
• # of candidate images to label per synset: 10,000 • # of people needed to verify: 2-5• Speed of human labeling: 2 images/sec (one fixation: ~200msec)
• Massive parallelism (N ~ 10^2-3)
000,40 000,10× 3× 2/ sec000,000,600= years19≈
N
Step 2: verifying the images by humans
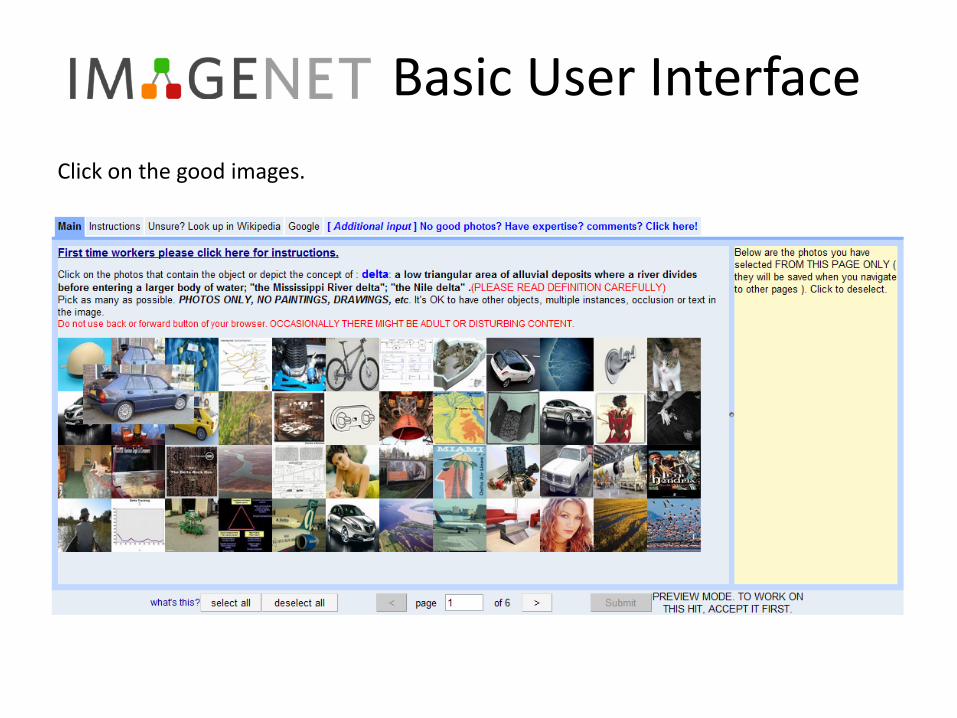
Basic User InterfaceClick on the good images.

Basic User Interface

Enhancement 1
• Provide wiki and google links
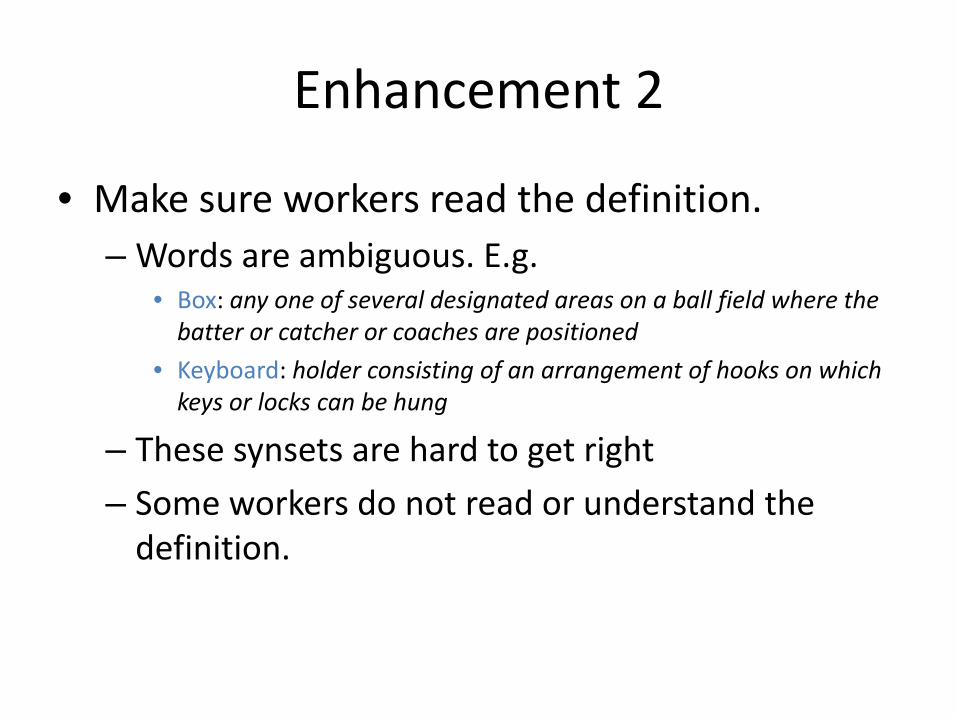
Enhancement 2
• Make sure workers read the definition.– Words are ambiguous. E.g.
• Box: any one of several designated areas on a ball field where the batter or catcher or coaches are positioned
• Keyboard: holder consisting of an arrangement of hooks on which keys or locks can be hung
– These synsets are hard to get right– Some workers do not read or understand the
definition.

Definition quiz

Definition quiz

Enhancement 3• Allow more feedback. E.g. “unimagable synsets”
expert opinion

is built by crowdsourcing
• July 2008: 0 images
• Dec 2008: 3 million images, 6000+ synsets
• April 2010: 11 million images, 15,000+ synsets

So are we exploiting chained prisoners?

Demography of AMT workers
Panos Ipeirotis, NYU, Feb, 2010
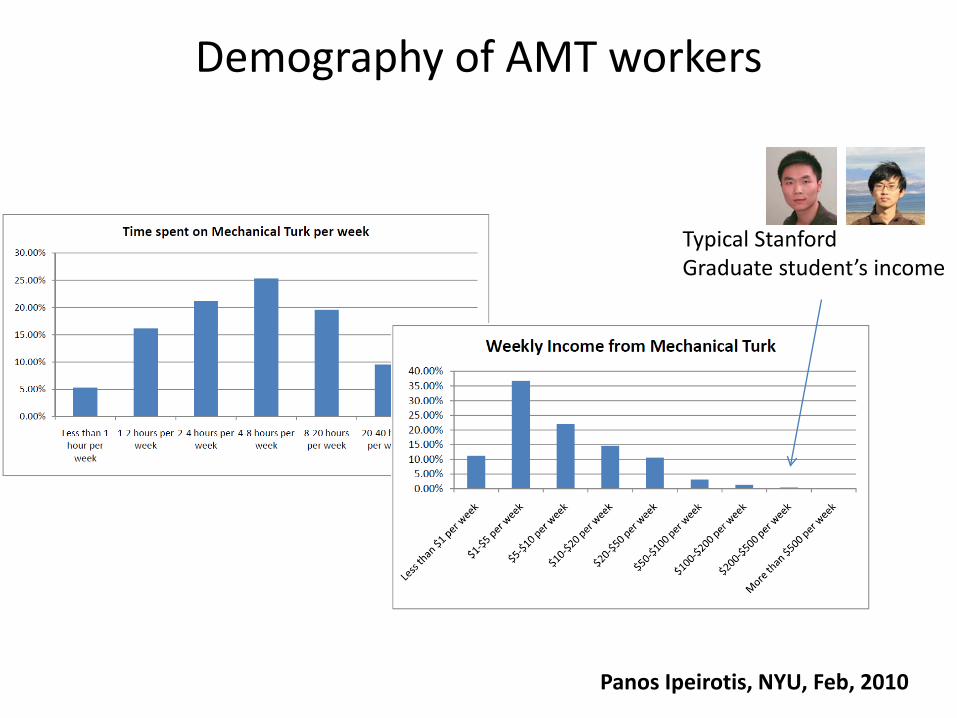
Typical StanfordGraduate student’s income
Demography of AMT workers
Panos Ipeirotis, NYU, Feb, 2010

Demography of AMT workers
Panos Ipeirotis, NYU, Feb, 2010

U.S. economy 2008 - 2009
hired more than 25,000 AMT workers in this period of time!!

Accuracy
e.g. German Shepherde.g. doge.g. mammal
Deng, Dong, Socher, Li, Li, & Fei-Fei, CVPR, 2009

Diversity
e.g. German Shepherde.g. doge.g. mammal
Deng, Dong, Socher, Li, Li, & Fei-Fei, CVPR, 2009ESP: Ahn et al. 2006

diversity
Calte
ch10
1
Diversity

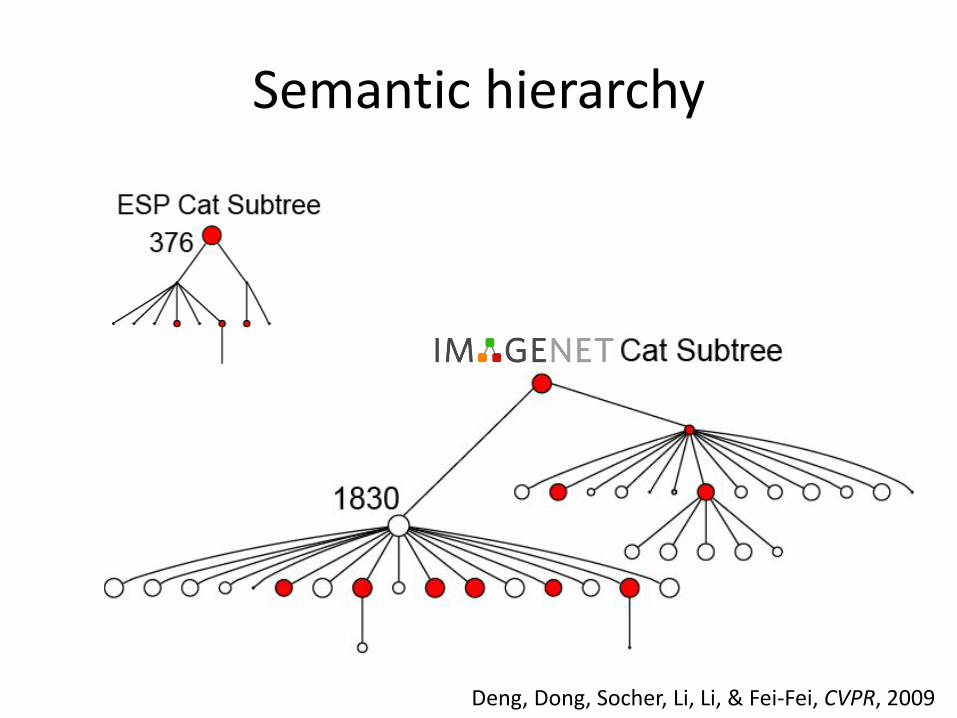
Semantic hierarchy
Deng, Dong, Socher, Li, Li, & Fei-Fei, CVPR, 2009
Semantic hierarchy
Deng, Dong, Socher, Li, Li, & Fei-Fei, CVPR, 2009

Scale
Deng, Dong, Socher, Li, Li, & Fei-Fei, CVPR, 2009

Scale
LabelMe
85 classes of object: >500 im/class211 classes of object: >100 im/class
6570 classes of object: >500 im/class9836 classes of object: >100 im/class
Russell et al. 2005; statistics obtained in 2009

1 2 3 4 5
1
2
3
4
Caltech101/256MRSC
PASCAL1 LabelMe
Tiny Images2
# of visual concept categories (log_10)
# of
cle
an im
ages
per
cat
egor
y (lo
g_10
)
1. Excluding the Caltech101 datasets from PASCAL2. No image in this dataset is human annotated. The # of clean images per category is a rough estimation
Comparison among free datasets

outline• Goal of ImageNet:
– A dataset– A knowledge ontology
• Construction of ImageNet– 2-step process– Crowdsourcing: Amazon Mechanical Turk (AMT)– Properties of ImageNet
• Benchmarking: what does classifying 10k+ image categories tell us?– Computation matters– Size matters– Density matters– Hierarchy matters
• Human vision: Rosch revisited and quantified– Quantifying basic-, subordinate- and superordinate-level concepts
• In the horizon: ImageNet Spring 2010 release– The upcoming ImageNet Challenge (in partnership with PASCAL VOC)– Visualizing ImageNet– Etc.

Trail Bike
Motorbike
Moped
Go-cart
HelicopterCar, auto
Bicycle
Back
grou
nd im
age
cour
tesy
: Ant
onio
Torr
alba
What does classifying more than 10,000 image categories tell us?

Basic evaluation setup
•– 10,000 categories– 9 million images– 50%-50% train test split
• Multi-class classification in 1-vs-all framework– GIST+NN: filter banks; nearest neighbor (Oliva & Torralba, 2001)
– BOW+NN: SIFT, 1000 codewords, BOW; nearest neighbor
– BOW+SVM: SIFT, 1000 codewords, BOW; linear SVM
– SPM+SVM: SIFT, 1000 codewords, Spatial Pyramid; intersection kernel SVM (Lazebnik et al. 2006)
Deng, Berg, Li, & Fei-Fei, ECCV2010

Computation issues first
Deng, Berg, Li, & Fei-Fei, ECCV2010
• BOW+SVM– Train one 1-vs-all with LIBLINEAR 1 CPU hour– 10,000 categories 1 CPU year
• SPM + SVM– Maji & Berg 2009, LIBLINEAR with piece-wise linear
encoding– Memory bottleneck. Modification required.– 10,000 categories 6 CPU year
• Parallelized on a cluster– Weeks for a single run of experiments

Size matters• 6.4% for 10K categories• Better than we expected
(instead of dropping at the rate of 10x; it’s roughly at about 2x)
• An ordering switch between SVM and NN methods when the # of categories becomes large
Deng, Berg, Li, & Fei-Fei, ECCV2010

• 6.4% for 10K categories• Better than we expected
(instead of dropping at the rate of 10x; it’s roughly at about 2x)
• An ordering switch between SVM and NN methods when the # of categories becomes large
• When dataset size varies, conclusion we can draw about different categories varies
Size matters
Deng, Berg, Li, & Fei-Fei, ECCV2010

• 6.4% for 10K categories• Better than we expected
(instead of dropping at the rate of 10x; it’s roughly at about 2x)
• An ordering switch between SVM and NN methods when the # of categories becomes large
• When dataset size varies, conclusion we can draw about different categories varies
• Purely semantic organization of concepts (by WordNet) exhibits meaningful visual structure (ordered by DFS)
Size matters
Deng, Berg, Li, & Fei-Fei, ECCV2010

Size matters• 6.5% for 10K categories• Better than we expected
(instead of dropping at the rate of 10x; it’s roughly at about 2x)
• An ordering switch between SVM and NN methods when the # of categories becomes large
• When dataset size varies, conclusion we can draw about different categories varies
• Purely semantic organization of concepts (by WordNet) exhibits meaningful visual structure (ordered by DFS) Deng, Berg, Li, & Fei-Fei, ECCV2010

Density matters• Datasets have very different “density” or “sparsity”
Deng, Berg, Li, & Fei-Fei, ECCV2010

Density matters• Datasets have very different “density” or “sparsity”• there is a significant difference in difficulty between different
datasets, independent of feature and classifier choice.
Deng, Berg, Li, & Fei-Fei, ECCV2010
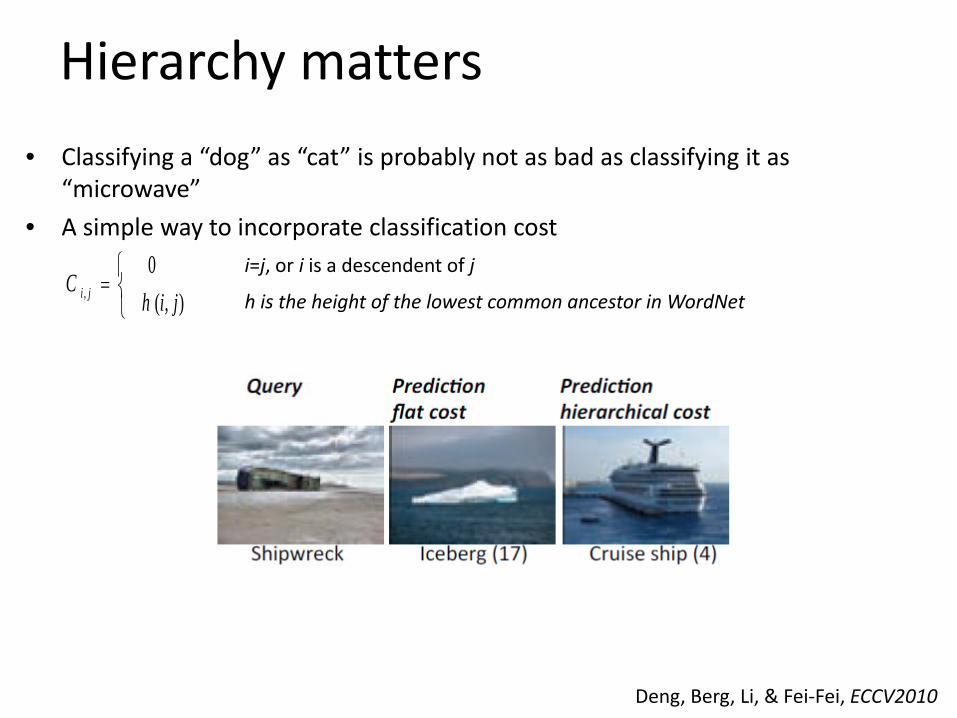
Hierarchy matters• Classifying a “dog” as “cat” is probably not as bad as classifying it as
“microwave”• A simple way to incorporate classification cost
=),(
0, jih
C ji
i=j, or i is a descendent of j
h is the height of the lowest common ancestor in WordNet
Deng, Berg, Li, & Fei-Fei, ECCV2010
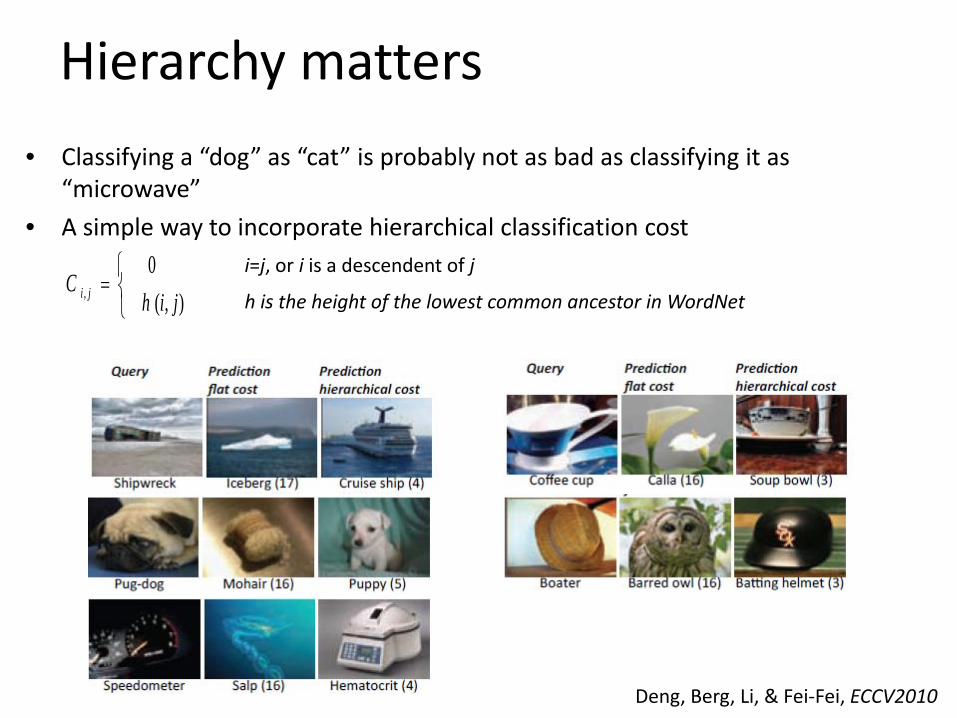
Hierarchy matters• Classifying a “dog” as “cat” is probably not as bad as classifying it as
“microwave”• A simple way to incorporate hierarchical classification cost
=),(
0, jih
C ji
i=j, or i is a descendent of j
h is the height of the lowest common ancestor in WordNet
Deng, Berg, Li, & Fei-Fei, ECCV2010

outline• Goal of ImageNet:
– A dataset– A knowledge ontology
• Construction of ImageNet– 2-step process– Crowdsourcing: Amazon Mechanical Turk (AMT)– Properties of ImageNet
• Benchmarking: what does classifying 10k+ image categories tell us?– Computation matters– Size matters– Density matters– Hierarchy matters
• Human vision: Rosch revisited and quantified– Quantifying basic-, subordinate- and superordinate-level concepts
• In the horizon: ImageNet Spring 2010 release– The upcoming ImageNet Challenge (in partnership with PASCAL VOC)– Visualizing ImageNet– Etc.

Eleanor Rosch re-visited and quantified
BirdCanadian gray jay
Vertebrate
PenguinBirdVertebrate
Rosch et al. 1976
Basic-level
Super-ordinate
sub-ordinate

more “discriminable” synsets less “discriminable” synsets
Eleanor Rosch re-visited and quantified
Fei-Fei, Deng, Su, & Li, VSS, 2009

more “discriminable” synsets less “discriminable” synsets“Basic-Level” “Subordinate-” or “Superordinate-” Level

“Basic-Level”“Basic-Level”
“Basic-Level”
Fei-Fei, Deng, Su, & Li, VSS, 2009

Summary
• ImageNet is intended to serve as– A dataset– A knowledge ontology
• Construction of large-scale image dataset is a new research area– Crowdsourcing might be the future of many such tasks
• Benchmarking: what does classifying 10k+ image categories tell us?– Computation matters– Size matters– Density matters– Hierarchy matters
• Human vision: Rosch revisited and quantified– Quantifying basic-, subordinate- and superordinate-level concepts
• In the horizon: ImageNet Spring 2010 release– The upcoming ImageNet Challenge (in partnership with PASCAL VOC)

Thank you!
co-PI
Kai LiPrinceton U.
Research collaborator;ImageNet Challenge boss
Alex BergColumbia U.
Graduate students
Jia DengPrinceton/Stanford U.
Hao SuStanford U.
Tomorrow 4pm: Intelligence Seminar
Story Telling in Images: modeling visual hierarchies
within and across images