crystal reports - apr18 · monthly report april 2018 iseq overall index cumulative % change...
TRANSCRIPT

ISEQ Equity Index%Change
2018Absolute Chg 2018
%ChangeAPR-18
Absolute ChgAPR-18
Value29-MAR-18
Value30-APR-18
Value29-DEC-17
ISEQ IndexISEQ Overall 6,805.19 6,593.65 %-3.31-233.09%3.21211.547,038.28ISEQ Financial 307.52 300.22 %-1.51-4.73%2.437.30312.25ISEQ General 9,671.98 9,361.68 %-3.55-356.20%3.31310.3010,028.18ISEQ Small Cap 2,293.79 2,301.67 %6.50140.08%-0.34-7.882,153.71ISEQ ESM 2,488.88 2,464.67 %-4.32-112.24%0.9824.212,601.12ISEQ 20 1,121.41 1,087.36 %-3.54-41.20%3.1334.051,162.61ISEQ20 Leveraged 6,385.97 6,008.53 %-7.31-503.81%6.28377.446,889.78ISEQ20 Capped 1,461.26 1,422.36 %-3.43-51.95%2.7338.901,513.21
ISEQ Return IndexISEQ Overall 14,707.47 14,180.38 %-2.17-326.36%3.72527.0915,033.83ISEQ Financial 766.53 741.06 %0.332.50%3.4425.47764.03ISEQ General 17,626.26 16,988.19 %-2.50-452.73%3.76638.0718,078.99ISEQ Small Cap 3,299.23 3,310.51 %6.73208.12%-0.34-11.283,091.11ISEQ ESM 2,895.23 2,863.71 %-4.03-121.45%1.1031.523,016.68ISEQ 20 1,512.31 1,458.36 %-2.41-37.38%3.7053.951,549.69ISEQ20 Capped 1,936.19 1,874.70 %-2.35-46.67%3.2861.491,982.86
ISEQ Bond IndexValue
30-APR-18%Change
2018Absolute Chg 2018
%ChangeAPR-18
Absolute ChgAPR-18
Value29-DEC-17
Value29-MAR-18
ISEQ Bond Index115.82114.55 %-0.58 -1.27All Bond %-1.09115.21 -0.6685.3683.90 %-0.47 -1.46Under 3 %-1.7184.30 -0.4098.6897.31 %-0.44 -1.37Under 5 %-1.3997.74 -0.43
110.64109.22 %-0.45 -1.42Under 10 %-1.28109.71 -0.49131.47130.39 %-0.69 -1.085 Plus %-0.82131.30 -0.91141.56140.90 %-0.94 -0.6710 Plus %-0.47142.23 -1.33
ISEQ Return Bond Index204.13203.60 %-0.28 -0.53All Bond %-0.26204.18 -0.58143.10142.75 %-0.08 -0.36Under 3 %-0.25142.87 -0.12168.75168.42 %-0.12 -0.34Under 5 %-0.20168.63 -0.21191.00190.10 %-0.16 -0.90Under 10 %-0.47190.41 -0.31232.82232.11 %-0.42 -0.715 Plus %-0.30233.08 -0.98260.36261.40 %-0.64 1.0510 Plus %0.40263.07 -1.67
28 Anglesea StreetDublin 2, IrelandT +353 1 617 4200
F +353 1 677 6045
www.ise.ie
April 2018
Monthly Report
Trading Days Information
2018
April 20 Days
82 Days
Page 1 of 23
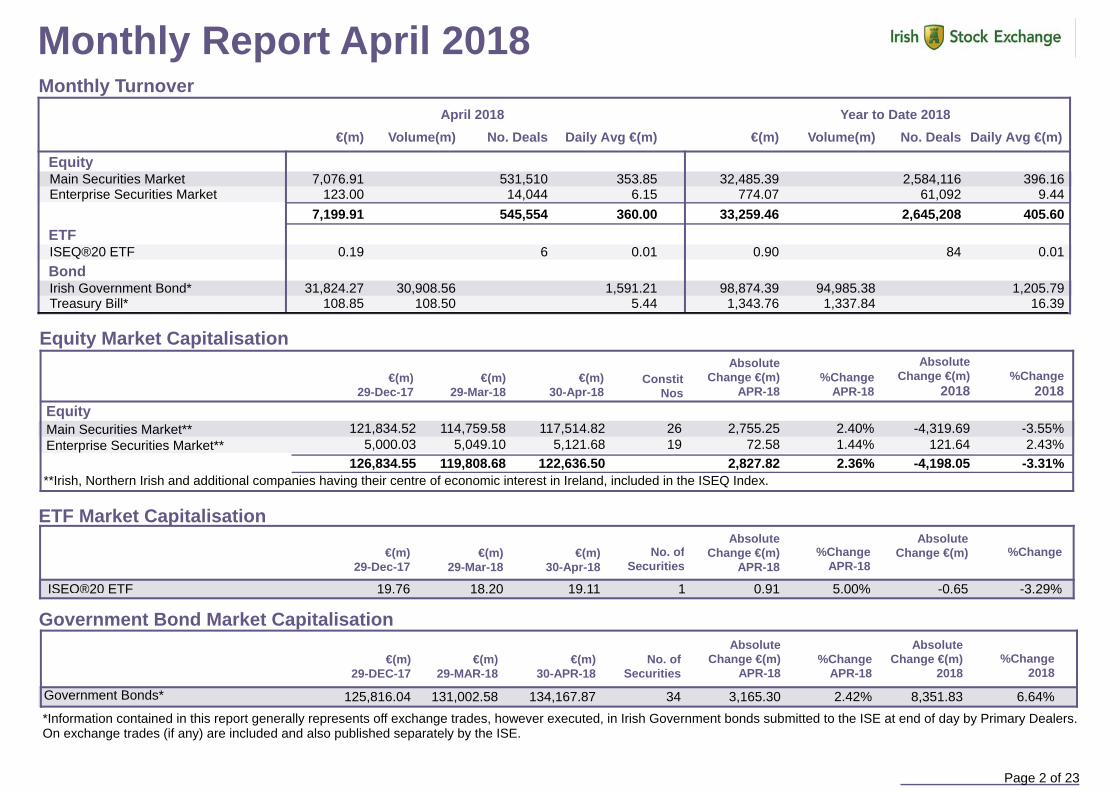
Monthly Report April 2018Monthly Turnover
Daily Avg €(m)Volume(m)€(m)Daily Avg €(m)Volume(m)€(m) No. Deals No. DealsYear to Date 2018April 2018
Equity32,485.39 396.16Main Securities Market 2,584,1167,076.91 531,510 353.85
774.07 9.44Enterprise Securities Market 61,092123.00 14,044 6.157,199.91 360.00 33,259.46 405.60545,554 2,645,208
ETF0.90 0.01ISEQ®20 ETF 840.19 6 0.01
Bond98,874.39 1,205.7994,985.38Irish Government Bond* 31,824.27 30,908.56 1,591.21
1,343.76 16.391,337.84Treasury Bill* 108.85 108.50 5.44
Equity Market Capitalisation
%Change2018
AbsoluteChange €(m)
2018%Change
APR-18
AbsoluteChange €(m)
APR-18Constit
Nos€(m)
30-Apr-18€(m)
29-Mar-18€(m)
29-Dec-17Equity
121,834.52 114,759.58 117,514.82 26 2,755.25 %2.40 -4,319.69 %-3.55Main Securities Market**5,000.03 5,049.10 5,121.68 19 72.58 %1.44 121.64 %2.43Enterprise Securities Market**
126,834.55 122,636.50 2,827.82 -4,198.05119,808.68 %2.36 %-3.31**Irish, Northern Irish and additional companies having their centre of economic interest in Ireland, included in the ISEQ Index.
ETF Market Capitalisation
%ChangeAbsolute
Change €(m)%ChangeAPR-18
AbsoluteChange €(m)
APR-18No. of
Securities€(m)
30-Apr-18€(m)
29-Mar-18€(m)
29-Dec-17
19.76 18.20 19.11 1 0.91 %5.00 -0.65 %-3.29ISEQ®20 ETF
€(m)29-DEC-17
%Change2018
AbsoluteChange €(m)
2018%Change
APR-18
AbsoluteChange €(m)
APR-18No. of
Securities€(m)
30-APR-18€(m)
29-MAR-18
Government Bond Market Capitalisation
125,816.04 131,002.58 134,167.87 34 3,165.30 %2.42 8,351.83 %6.64Government Bonds*
*Information contained in this report generally represents off exchange trades, however executed, in Irish Government bonds submitted to the ISE at end of day by Primary Dealers. On exchange trades (if any) are included and also published separately by the ISE.
Page 2 of 23
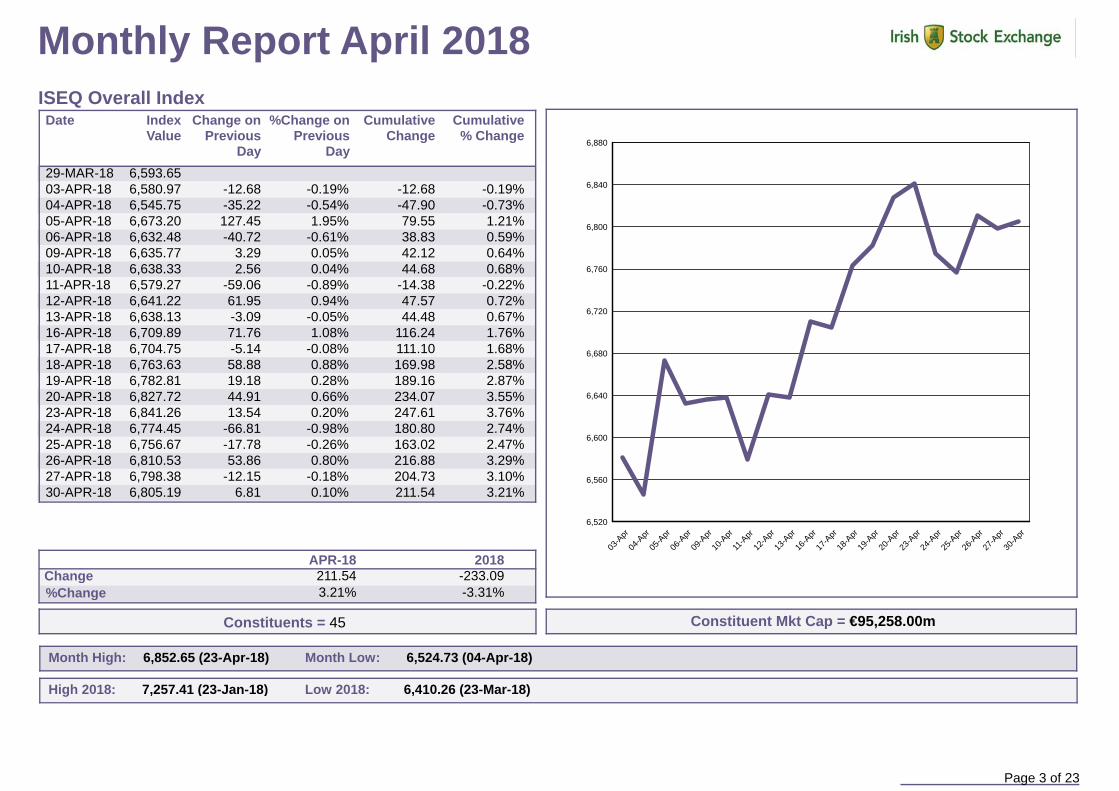
Monthly Report April 2018ISEQ Overall Index
Cumulative% Change
CumulativeChange
%Change on Previous
Day
Change on Previous
Day
Index Value
Date
29-MAR-18 6,593.6503-APR-18 -12.68 -0.19% -12.68 -0.19%6,580.9704-APR-18 -35.22 -0.54% -47.90 -0.73%6,545.7505-APR-18 127.45 1.95% 79.55 1.21%6,673.2006-APR-18 -40.72 -0.61% 38.83 0.59%6,632.4809-APR-18 3.29 0.05% 42.12 0.64%6,635.7710-APR-18 2.56 0.04% 44.68 0.68%6,638.3311-APR-18 -59.06 -0.89% -14.38 -0.22%6,579.2712-APR-18 61.95 0.94% 47.57 0.72%6,641.2213-APR-18 -3.09 -0.05% 44.48 0.67%6,638.1316-APR-18 71.76 1.08% 116.24 1.76%6,709.8917-APR-18 -5.14 -0.08% 111.10 1.68%6,704.7518-APR-18 58.88 0.88% 169.98 2.58%6,763.6319-APR-18 19.18 0.28% 189.16 2.87%6,782.8120-APR-18 44.91 0.66% 234.07 3.55%6,827.7223-APR-18 13.54 0.20% 247.61 3.76%6,841.2624-APR-18 -66.81 -0.98% 180.80 2.74%6,774.4525-APR-18 -17.78 -0.26% 163.02 2.47%6,756.6726-APR-18 53.86 0.80% 216.88 3.29%6,810.5327-APR-18 -12.15 -0.18% 204.73 3.10%6,798.3830-APR-18 6.81 0.10% 211.54 3.21%6,805.19
2018Change%Change
APR-18211.54
%3.21-233.09
%-3.31
6,520
6,560
6,600
6,640
6,680
6,720
6,760
6,800
6,840
6,880
03-A
pr04
-Apr
05-A
pr06
-Apr
09-A
pr10
-Apr
11-A
pr12
-Apr
13-A
pr16
-Apr
17-A
pr18
-Apr
19-A
pr20
-Apr
23-A
pr24
-Apr
25-A
pr26
-Apr
27-A
pr30
-Apr
6,852.65 (23-Apr-18) 6,524.73 (04-Apr-18)Month High: Month Low:
7,257.41 (23-Jan-18)High 2018: Low 2018: 6,410.26 (23-Mar-18)
Constituents = 45 Constituent Mkt Cap = €95,258.00m
Page 3 of 23

Monthly Report April 2018ISEQ Financial Index
312.25
300.22307.52
Index Value (29-Dec-17)
Index Value (29-Mar-18)Index Value (30-Apr-18)
2018
Change%Change %2.43 %-1.51
-4.737.30
APR-18
292.00
296.00
300.00
304.00
308.00
312.00
316.00
320.00
03-A
pr04
-Apr
05-A
pr06
-Apr
09-A
pr10
-Apr
11-A
pr12
-Apr
13-A
pr16
-Apr
17-A
pr18
-Apr
19-A
pr20
-Apr
23-A
pr24
-Apr
25-A
pr26
-Apr
27-A
pr30
-Apr
319.21 (18-Apr-18) 291.16 (04-Apr-18)Month High: Month Low:
345.46 (29-Jan-18) Low 2018: 282.01 (23-Mar-18)High 2018:
Constituents = 5
Constituent Mkt. Cap = €11,420.33m
ISEQ Small Cap Index
2,270
2,280
2,290
2,300
2,310
2,320
2,330
2,340
2,350
03-A
pr04
-Apr
05-A
pr06
-Apr
09-A
pr10
-Apr
11-A
pr12
-Apr
13-A
pr16
-Apr
17-A
pr18
-Apr
19-A
pr20
-Apr
23-A
pr24
-Apr
25-A
pr26
-Apr
27-A
pr30
-Apr
Constituent Mkt Cap = €693.75m
Constituents = 15
2,456.43 (05-Feb-18)High 2018: Low 2018: 2,148.47 (02-Jan-18)
2,364.17 (24-Apr-18) 2,253.20 (11-Apr-18)Month High: Month Low:
2,153.71
2,301.672,293.79
Index Value (29-Dec-17)Index Value (29-Mar-18)Index Value (30-Apr-18)
2018Change
%Change %-0.34 %6.50140.08-7.88
APR-18
Page 4 of 23

Monthly Report April 2018ISEQ General Index
10,028.18
9,361.68
9,671.98
Index Value (29-Dec-17)
Index Value (29-Mar-18)
Index Value (30-Apr-18)
2018
Change
%Change %3.31 %-3.55
-356.20310.30
APR-18
Constituents = 40
Constituent Mkt. Cap = €83,837.68m
9,733.83 (23-Apr-18) 9,264.01 (03-Apr-18)Month High: Month Low:
10,247.46 (23-Jan-18)High 2018: Low 2018: 9,127.71 (05-Mar-18)
9,300
9,350
9,400
9,450
9,500
9,550
9,600
9,650
9,700
03-A
pr04
-Apr
05-A
pr06
-Apr
09-A
pr10
-Apr
11-A
pr12
-Apr
13-A
pr16
-Apr
17-A
pr18
-Apr
19-A
pr20
-Apr
23-A
pr24
-Apr
25-A
pr26
-Apr
27-A
pr30
-Apr
ISEQ ESM Index
2,430
2,440
2,450
2,460
2,470
2,480
2,490
2,500
03-A
pr04
-Apr
05-A
pr06
-Apr
09-A
pr10
-Apr
11-A
pr12
-Apr
13-A
pr16
-Apr
17-A
pr18
-Apr
19-A
pr20
-Apr
23-A
pr24
-Apr
25-A
pr26
-Apr
27-A
pr30
-Apr
Constituent Mkt Cap = €3,595.69m
Constituents = 19
2,677.12 (03-Jan-18)High 2018: Low 2018: 2,417.33 (20-Mar-18)
2,503.86 (18-Apr-18) 2,427.95 (05-Apr-18)Month High: Month Low:
2,601.12
2,464.67
2,488.88
Index Value (29-Dec-17)
Index Value (29-Mar-18)
Index Value (30-Apr-18)
2018
Change
%Change %0.98 %-4.32
-112.2424.21
APR-18
Page 5 of 23

Monthly Report April 2018ISEQ 20 Index
Constituent Mkt Cap = € m84,822.52
1,162.61
1,087.36
1,121.41
Index Value (29-Dec-17)
Index Value (29-Mar-18)
Index Value (30-Apr-18)
2018
Change
%Change %3.13 %-3.54
-41.2034.05
APR-18
1,056.04 (23-Mar-18)1,196.27 (23-Jan-18)High 2018: Low 2018:
1,080.00
1,090.00
1,100.00
1,110.00
1,120.00
1,130.00
03-A
pr04
-Apr
05-A
pr06
-Apr
09-A
pr10
-Apr
11-A
pr12
-Apr
13-A
pr16
-Apr
17-A
pr18
-Apr
19-A
pr20
-Apr
23-A
pr24
-Apr
25-A
pr26
-Apr
27-A
pr30
-Apr
1,131.92 (23-Apr-18) 1,076.10 (03-Apr-18)Month High: Month Low:
Constituents = 20
ISEQ 20 Leveraged Index6,889.78
6,008.53
6,385.97
Index Value (29-Dec-17)
Index Value (29-Mar-18)
Index Value (30-Apr-18)
2018
Change
%Change %6.28 %-7.31
-503.81377.44
APR-18
Constituents = 20
Constituent Mkt Cap = €84,822.52m
6,506.93 (23-Apr-18) 5,884.38 (03-Apr-18)Month High: Month Low:
5,667.14 (23-Mar-18)7,290.14 (23-Jan-18)High 2018: Low 2018:
5,900.00
6,000.00
6,100.00
6,200.00
6,300.00
6,400.00
6,500.00
03-A
pr04
-Apr
05-A
pr06
-Apr
09-A
pr10
-Apr
11-A
pr12
-Apr
13-A
pr16
-Apr
17-A
pr18
-Apr
19-A
pr20
-Apr
23-A
pr24
-Apr
25-A
pr26
-Apr
27-A
pr30
-Apr
Page 6 of 23

Monthly Report April 2018ISEQ 20 Capped Index
1,513.21
1,422.36
1,461.26
Index Value (29-Dec-17)
Index Value (29-Mar-18)
Index Value (30-Apr-18)
2018
Change
%Change %2.73 %-3.43
-51.9538.90
APR-18
Constituents = 20
Constituent Mkt Cap = €47,573.79m
1,479.47 (23-Apr-18) 1,407.32 (04-Apr-18)Month High: Month Low:
1,380.58 (23-Mar-18)1,557.73 (23-Jan-18)High 2018 : Low 2018:
1,410.00
1,420.00
1,430.00
1,440.00
1,450.00
1,460.00
1,470.00
1,480.00
03-A
pr04
-Apr
05-A
pr06
-Apr
09-A
pr10
-Apr
11-A
pr12
-Apr
13-A
pr16
-Apr
17-A
pr18
-Apr
19-A
pr20
-Apr
23-A
pr24
-Apr
25-A
pr26
-Apr
27-A
pr30
-Apr
Page 7 of 23
Monthly Report April 2018
0
2,000
4,000
6,000
8,000
10,000
12,000
30/04
/2015
31/07
/2015
30/10
/2015
29/01
/2016
29/04
/2016
29/07
/2016
31/10
/2016
31/01
/2017
28/04
/2017
31/07
/2017
31/10
/2017
31/01
/2018
30/04
/2018
OVERALL FINANCIAL GENERAL
0
2,000
4,000
6,000
8,000
10,000
12,000
28/04
/2017
31/05
/2017
30/06
/2017
31/07
/2017
31/08
/2017
29/09
/2017
31/10
/2017
30/11
/2017
29/12
/2017
31/01
/2018
28/02
/2018
29/03
/2018
30/04
/2018
OVERALL FINANCIAL GENERAL
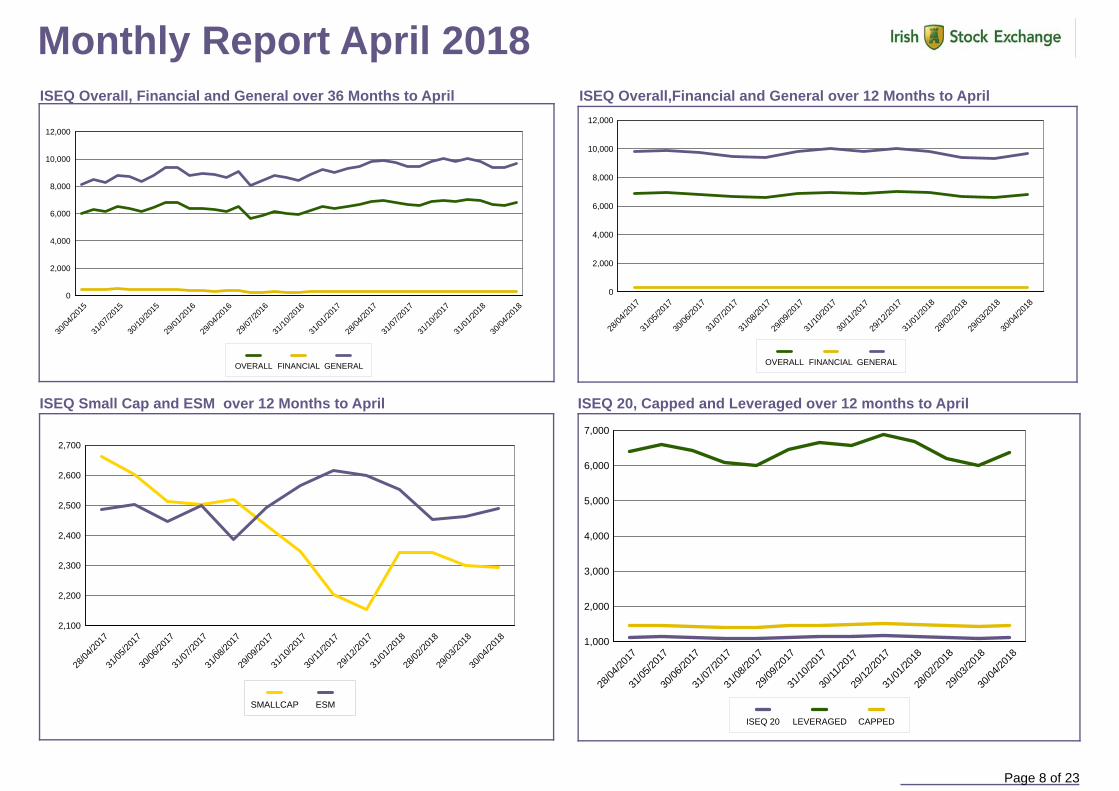
ISEQ Overall,Financial and General over 12 Months to AprilISEQ Overall, Financial and General over 36 Months to April
ISEQ Small Cap and ESM over 12 Months to April ISEQ 20, Capped and Leveraged over 12 months to April
1,000
2,000
3,000
4,000
5,000
6,000
7,000
28/04
/2017
31/05
/2017
30/06
/2017
31/07
/2017
31/08
/2017
29/09
/2017
31/10
/2017
30/11
/2017
29/12
/2017
31/01
/2018
28/02
/2018
29/03
/2018
30/04
/2018
ISEQ 20 LEVERAGED CAPPED
2,100
2,200
2,300
2,400
2,500
2,600
2,700
28/04
/2017
31/05
/2017
30/06
/2017
31/07
/2017
31/08
/2017
29/09
/2017
31/10
/2017
30/11
/2017
29/12
/2017
31/01
/2018
28/02
/2018
29/03
/2018
30/04
/2018
SMALLCAP ESM
Page 8 of 23

Monthly Report April 2018Market Capitalisation Overall, Financial and General Indices (€m)
0K
20K
40K
60K
80K
100K
120K
140K
28/04/2017 31/05/2017 30/06/2017 31/07/2017 31/08/2017 29/09/2017 31/10/2017 30/11/2017 29/12/2017 31/01/2018 28/02/2018 29/03/2018 30/04/2018
Overall Financial General
0K
4K
8K
12K
16K
20K
24K
28/04/2017 31/05/2017 30/06/2017 31/07/2017 31/08/2017 29/09/2017 31/10/2017 30/11/2017 29/12/2017 31/01/2018 28/02/2018 29/03/2018 30/04/2018
SmallCap ESM
Market Capitalisation Small Cap and ESM Indices (€m)
0K
20K
40K
60K
80K
100K
28/04/2017 31/05/2017 30/06/2017 31/07/2017 31/08/2017 29/09/2017 31/10/2017 30/11/2017 29/12/2017 31/01/2018 28/02/2018 29/03/2018 30/04/2018
ISEQ20 Capped Leveraged
Market Capitalisation ISEQ 20, Capped and Leveraged Indices (€m)
Page 9 of 23
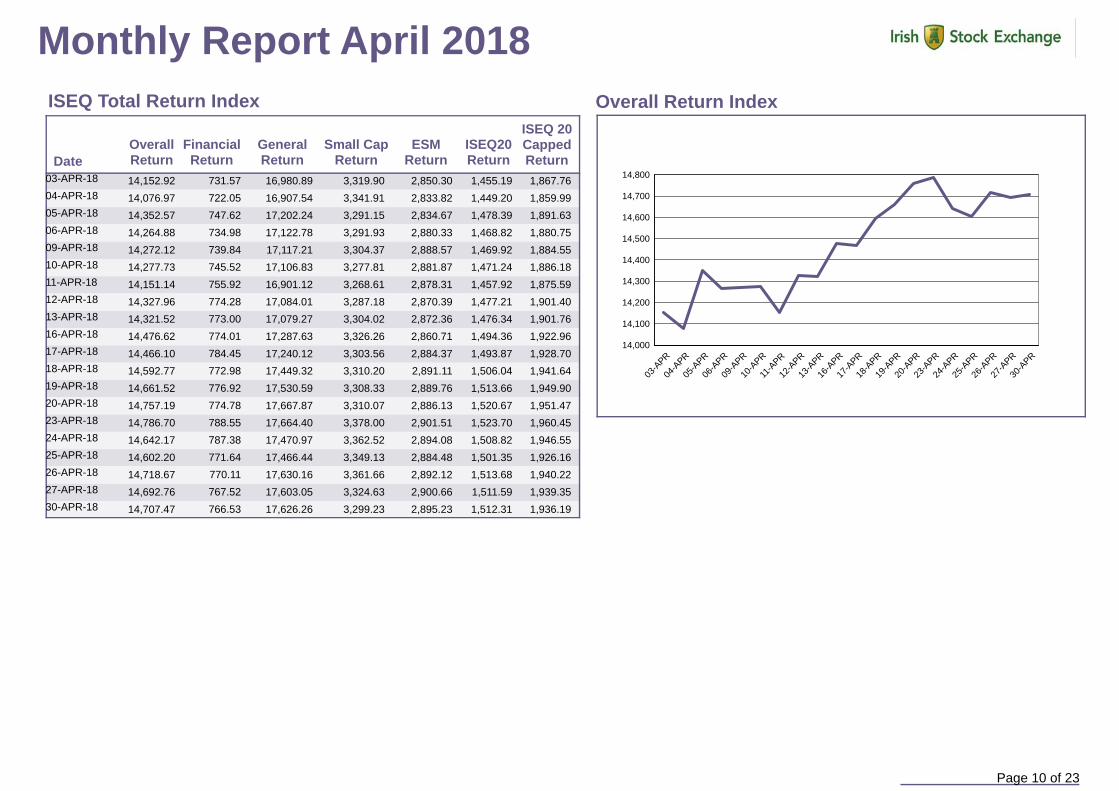
Monthly Report April 2018ISEQ Total Return Index Overall Return Index
FinancialReturnDate
Overall Return
GeneralReturn
Small CapReturn
ESMReturn
ISEQ20Return
ISEQ 20CappedReturn
14,152.92 731.57 16,980.89 3,319.90 2,850.30 1,455.19 1,867.7603-APR-18
14,076.97 722.05 16,907.54 3,341.91 2,833.82 1,449.20 1,859.9904-APR-18
14,352.57 747.62 17,202.24 3,291.15 2,834.67 1,478.39 1,891.6305-APR-18
14,264.88 734.98 17,122.78 3,291.93 2,880.33 1,468.82 1,880.7506-APR-18
14,272.12 739.84 17,117.21 3,304.37 2,888.57 1,469.92 1,884.5509-APR-18
14,277.73 745.52 17,106.83 3,277.81 2,881.87 1,471.24 1,886.1810-APR-18
14,151.14 755.92 16,901.12 3,268.61 2,878.31 1,457.92 1,875.5911-APR-18
14,327.96 774.28 17,084.01 3,287.18 2,870.39 1,477.21 1,901.4012-APR-18
14,321.52 773.00 17,079.27 3,304.02 2,872.36 1,476.34 1,901.7613-APR-18
14,476.62 774.01 17,287.63 3,326.26 2,860.71 1,494.36 1,922.9616-APR-18
14,466.10 784.45 17,240.12 3,303.56 2,884.37 1,493.87 1,928.7017-APR-18
14,592.77 772.98 17,449.32 3,310.20 2,891.11 1,506.04 1,941.6418-APR-18
14,661.52 776.92 17,530.59 3,308.33 2,889.76 1,513.66 1,949.9019-APR-18
14,757.19 774.78 17,667.87 3,310.07 2,886.13 1,520.67 1,951.4720-APR-18
14,786.70 788.55 17,664.40 3,378.00 2,901.51 1,523.70 1,960.4523-APR-18
14,642.17 787.38 17,470.97 3,362.52 2,894.08 1,508.82 1,946.5524-APR-18
14,602.20 771.64 17,466.44 3,349.13 2,884.48 1,501.35 1,926.1625-APR-18
14,718.67 770.11 17,630.16 3,361.66 2,892.12 1,513.68 1,940.2226-APR-18
14,692.76 767.52 17,603.05 3,324.63 2,900.66 1,511.59 1,939.3527-APR-18
14,707.47 766.53 17,626.26 3,299.23 2,895.23 1,512.31 1,936.1930-APR-18
14,000
14,100
14,200
14,300
14,400
14,500
14,600
14,700
14,800
03-A
PR04
-APR
05-A
PR06
-APR
09-A
PR10
-APR
11-A
PR12
-APR
13-A
PR16
-APR
17-A
PR18
-APR
19-A
PR20
-APR
23-A
PR24
-APR
25-A
PR26
-APR
27-A
PR30
-APR
Page 10 of 23

Monthly Report April 2018Financial Return Index General Return Index
720.00
730.00
740.00
750.00
760.00
770.00
780.00
790.00
03-A
PR04
-APR
05-A
PR06
-APR
09-A
PR10
-APR
11-A
PR12
-APR
13-A
PR16
-APR
17-A
PR18
-APR
19-A
PR20
-APR
23-A
PR24
-APR
25-A
PR26
-APR
27-A
PR30
-APR 16,900
17,000
17,100
17,200
17,300
17,400
17,500
17,600
17,700
03-A
PR04
-APR
05-A
PR06
-APR
09-A
PR10
-APR
11-A
PR12
-APR
13-A
PR16
-APR
17-A
PR18
-APR
19-A
PR20
-APR
23-A
PR24
-APR
25-A
PR26
-APR
27-A
PR30
-APR
ESM Return IndexSmall Cap Return Index
3,260
3,280
3,300
3,320
3,340
3,360
3,380
03-A
PR04
-APR
05-A
PR06
-APR
09-A
PR10
-APR
11-A
PR12
-APR
13-A
PR16
-APR
17-A
PR18
-APR
19-A
PR20
-APR
23-A
PR24
-APR
25-A
PR26
-APR
27-A
PR30
-APR 2,830
2,840
2,850
2,860
2,870
2,880
2,890
2,900
2,91003
-APR
04-A
PR05
-APR
06-A
PR09
-APR
10-A
PR11
-APR
12-A
PR13
-APR
16-A
PR17
-APR
18-A
PR19
-APR
20-A
PR23
-APR
24-A
PR25
-APR
26-A
PR27
-APR
30-A
PR
Page 11 of 23

Monthly Report April 2018ISEQ 20 Return Index
1,440.00
1,450.00
1,460.00
1,470.00
1,480.00
1,490.00
1,500.00
1,510.00
1,520.00
1,530.00
03-A
PR04
-APR
05-A
PR06
-APR
09-A
PR10
-APR
11-A
PR12
-APR
13-A
PR16
-APR
17-A
PR18
-APR
19-A
PR20
-APR
23-A
PR24
-APR
25-A
PR26
-APR
27-A
PR30
-APR
ISEQ 20 Capped Return Index
1,840.00
1,860.00
1,880.00
1,900.00
1,920.00
1,940.00
1,960.00
1,980.00
03-A
PR04
-APR
05-A
PR06
-APR
09-A
PR10
-APR
11-A
PR12
-APR
13-A
PR16
-APR
17-A
PR18
-APR
19-A
PR20
-APR
23-A
PR24
-APR
25-A
PR26
-APR
27-A
PR30
-APR
Page 12 of 23
Monthly Report April 2018
114.20
114.40
114.60
114.80
115.00
115.20
115.40
03-A
PR
05-A
PR
09-A
PR
11-A
PR
13-A
PR
17-A
PR
19-A
PR
23-A
PR
25-A
PR
27-A
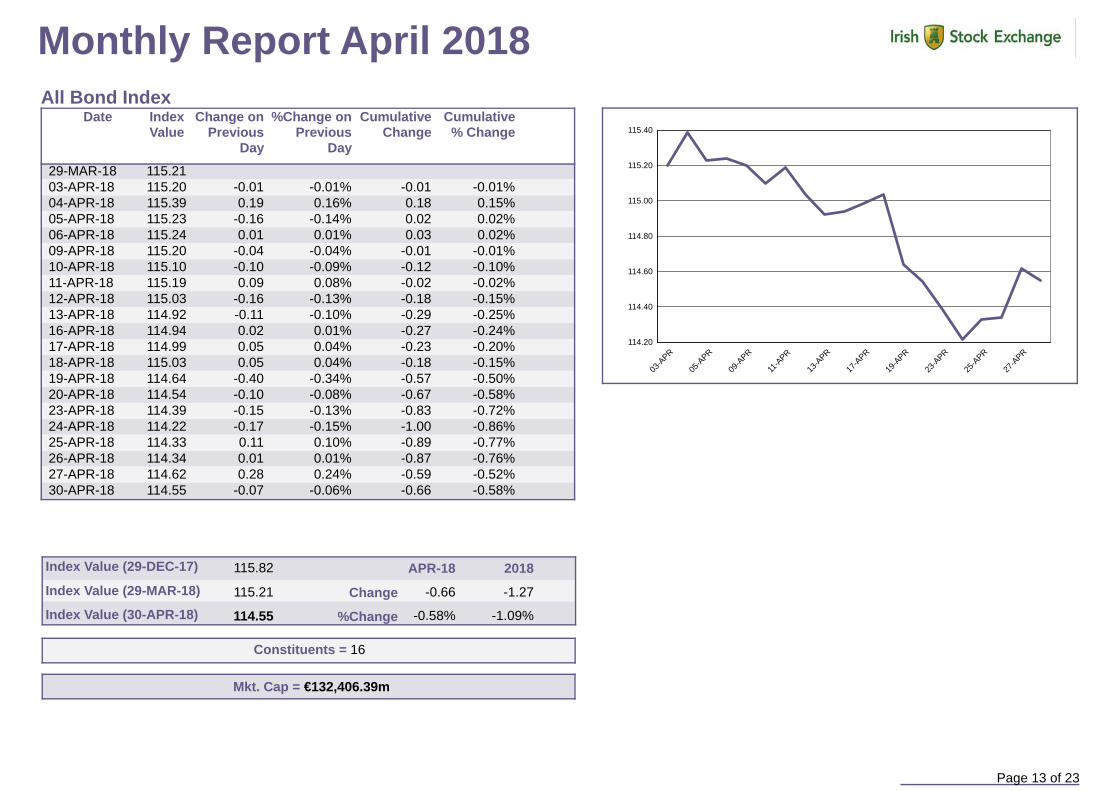
PRAll Bond Index
Cumulative % Change
CumulativeChange
%Change on Previous
Day
Change on Previous
Day
Index Value
Date
29-MAR-18 115.2103-APR-18 -0.01 -0.01% -0.01 -0.01% 115.2004-APR-18 0.19 0.16% 0.18 0.15% 115.3905-APR-18 -0.16 -0.14% 0.02 0.02% 115.2306-APR-18 0.01 0.01% 0.03 0.02% 115.2409-APR-18 -0.04 -0.04% -0.01 -0.01% 115.2010-APR-18 -0.10 -0.09% -0.12 -0.10% 115.1011-APR-18 0.09 0.08% -0.02 -0.02% 115.1912-APR-18 -0.16 -0.13% -0.18 -0.15% 115.0313-APR-18 -0.11 -0.10% -0.29 -0.25% 114.9216-APR-18 0.02 0.01% -0.27 -0.24% 114.9417-APR-18 0.05 0.04% -0.23 -0.20% 114.9918-APR-18 0.05 0.04% -0.18 -0.15% 115.0319-APR-18 -0.40 -0.34% -0.57 -0.50% 114.6420-APR-18 -0.10 -0.08% -0.67 -0.58% 114.5423-APR-18 -0.15 -0.13% -0.83 -0.72% 114.3924-APR-18 -0.17 -0.15% -1.00 -0.86% 114.2225-APR-18 0.11 0.10% -0.89 -0.77% 114.3326-APR-18 0.01 0.01% -0.87 -0.76% 114.3427-APR-18 0.28 0.24% -0.59 -0.52% 114.6230-APR-18 -0.07 -0.06% -0.66 -0.58% 114.55
Mkt. Cap = €132,406.39m
Constituents = 16
115.82
115.21
114.55
Index Value (29-DEC-17)
Index Value (29-MAR-18)
Index Value (30-APR-18)
2018
Change
%Change %-0.58 %-1.09
-1.27-0.66
APR-18
Page 13 of 23

Monthly Report April 2018All Bond Index Return
202.80
203.00
203.20
203.40
203.60
203.80
204.00
204.20
204.40
204.60
03-A
PR
05-A
PR
09-A
PR
11-A
PR
13-A
PR
17-A
PR
19-A
PR
23-A
PR
25-A
PR
27-A
PR
Cumulative % Change
CumulativeChange
%Change on Previous
Day
Change on Previous
Day
Index Value
Date
29-MAR-18 204.1803-APR-18 0.06 0.05% 0.06 0.03% 204.2404-APR-18 0.34 0.30% 0.40 0.20% 204.5805-APR-18 -0.26 -0.22% 0.14 0.07% 204.3206-APR-18 0.03 0.03% 0.18 0.09% 204.3609-APR-18 -0.03 -0.02% 0.15 0.07% 204.3310-APR-18 -0.16 -0.14% -0.01 -0.01% 204.1711-APR-18 0.18 0.16% 0.17 0.08% 204.3512-APR-18 -0.26 -0.22% -0.09 -0.04% 204.0913-APR-18 -0.18 -0.15% -0.26 -0.13% 203.9116-APR-18 0.08 0.07% -0.19 -0.09% 203.9917-APR-18 0.18 0.15% -0.01 -0.01% 204.1718-APR-18 0.10 0.09% 0.09 0.04% 204.2719-APR-18 -0.68 -0.59% -0.59 -0.29% 203.5920-APR-18 -0.16 -0.14% -0.75 -0.37% 203.4323-APR-18 -0.22 -0.19% -0.97 -0.48% 203.2124-APR-18 -0.28 -0.25% -1.26 -0.61% 202.9225-APR-18 0.21 0.18% -1.05 -0.51% 203.1326-APR-18 0.04 0.03% -1.01 -0.49% 203.1727-APR-18 0.51 0.44% -0.50 -0.25% 203.6830-APR-18 -0.08 -0.07% -0.58 -0.28% 203.60
204.13
204.18
203.60
Index Value (29-DEC-17)
Index Value (29-MAR-18)
Index Value (30-APR-18)
2018Change
%Change %-0.28 %-0.26
-0.53-0.58APR-18
Constituents = 16
Mkt. Cap = €133,885.70m
Page 14 of 23

Monthly Report April 2018
83.90
83.95
84.00
84.05
84.10
84.15
84.20
84.25
84.30
03-A
PR
05-A
PR
09-A
PR
11-A
PR
13-A
PR
17-A
PR
19-A
PR
23-A
PR
25-A
PR
27-A
PR
142.68
142.72
142.76
142.80
142.84
142.88
142.92
03-A
PR
05-A
PR
09-A
PR
11-A
PR
13-A
PR
17-A
PR
19-A
PR
23-A
PR
25-A
PR
27-A
PR
97.25
97.30
97.35
97.40
97.45
97.50
97.55
97.60
97.65
97.70
97.75
03-A
PR
05-A
PR
09-A
PR
11-A
PR
13-A
PR
17-A
PR
19-A
PR
23-A
PR
25-A
PR
27-A
PR
168.25
168.30
168.35
168.40
168.45
168.50
168.55
168.60
168.65
168.70
03-A
PR
05-A
PR
09-A
PR
11-A
PR
13-A
PR
17-A
PR
19-A
PR
23-A
PR
25-A
PR
27-A
PR
Under 3 Bond Index Under 3 Bond Index Return Under 5 Bond Index Under 5 Bond Index Return
109.00
109.10
109.20
109.30
109.40
109.50
109.60
109.70
109.80
03-A
PR
05-A
PR
09-A
PR
11-A
PR
13-A
PR
17-A
PR
19-A
PR
23-A
PR
25-A
PR
27-A
PR
189.60
189.80
190.00
190.20
190.40
190.60
190.80
03-A
PR
05-A
PR
09-A
PR
11-A
PR
13-A
PR
17-A
PR
19-A
PR
23-A
PR
25-A
PR
27-A
PR
129.60
130.00
130.40
130.80
131.20
131.60
132.00
03-A
PR
05-A
PR
09-A
PR
11-A
PR
13-A
PR
17-A
PR
19-A
PR
23-A
PR
25-A
PR
27-A
PR
230.80
231.20
231.60
232.00
232.40
232.80
233.20
233.60
234.00
03-A
PR
05-A
PR
09-A
PR
11-A
PR
13-A
PR
17-A
PR
19-A
PR
23-A
PR
25-A
PR
27-A
PR
Under 10 Bond Index Under 10 Bond Index Return 5 Plus Bond Index 5 Plus Bond Index Return
10 Plus Bond Index
139.60
140.00
140.40
140.80
141.20
141.60
142.00
142.40
142.80
143.20
03-A
PR05
-APR
09-A
PR11
-APR
13-A
PR17
-APR
19-A
PR23
-APR
25-A
PR27
-APR
10 Plus Bond Index Return
259.00
260.00
261.00
262.00
263.00
264.00
265.00
03-A
PR
05-A
PR
09-A
PR
11-A
PR
13-A
PR
17-A
PR
19-A
PR
23-A
PR
25-A
PR
27-A
PR
Page 15 of 23
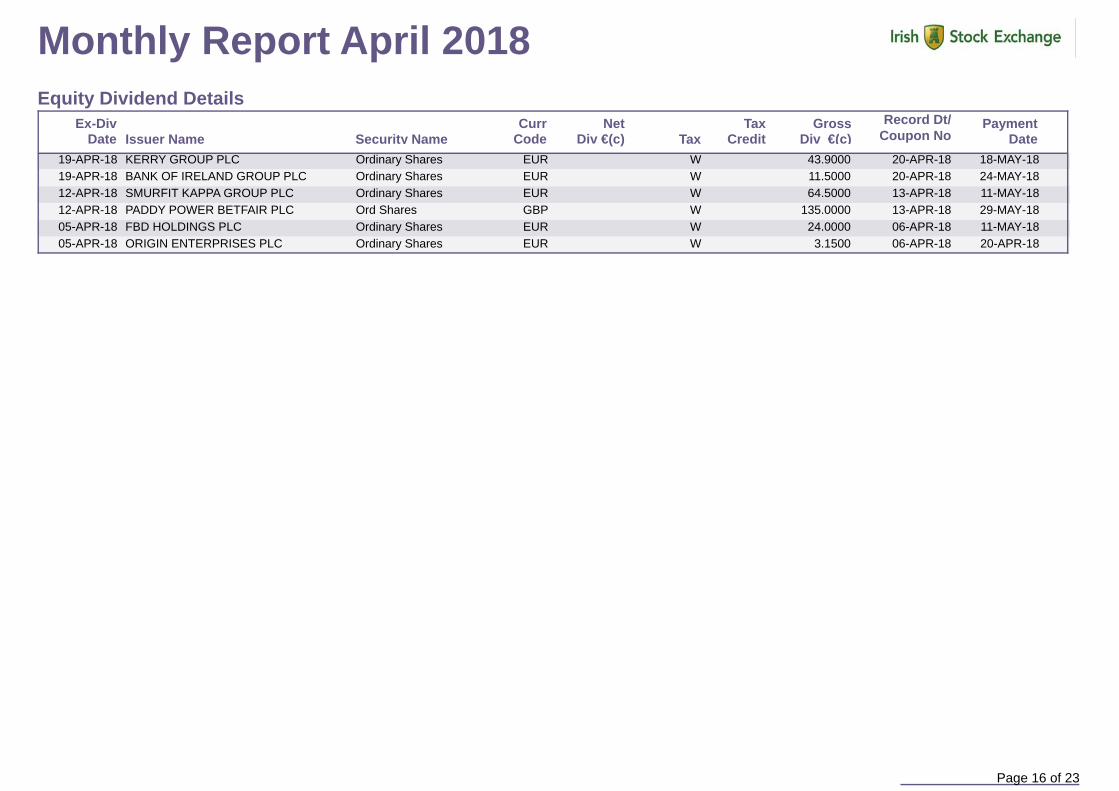
Monthly Report April 2018Equity Dividend Details
Security NameNet
Div €(c) TaxTax
CreditGross
Div €(c)Payment
DateIssuer NameEx-Div
DateRecord Dt/Curr
Code Coupon No
20-APR-1819-APR-18 18-MAY-18EUROrdinary SharesKERRY GROUP PLC 43.9000W20-APR-1819-APR-18 24-MAY-18EUROrdinary SharesBANK OF IRELAND GROUP PLC 11.5000W13-APR-1812-APR-18 11-MAY-18EUROrdinary SharesSMURFIT KAPPA GROUP PLC 64.5000W13-APR-1812-APR-18 29-MAY-18GBPOrd SharesPADDY POWER BETFAIR PLC 135.0000W06-APR-1805-APR-18 11-MAY-18EUROrdinary SharesFBD HOLDINGS PLC 24.0000W06-APR-1805-APR-18 20-APR-18EUROrdinary SharesORIGIN ENTERPRISES PLC 3.1500W
Page 16 of 23

Monthly Report April 2018Market Turnover (€ million)
Individual Irish Government Bonds Turnover* MSM, ESM & Grey MarketVolume (m)Turnover €(m)Stock
4.50 per cent Treasury Bond 2020 223.48 203.17Floating Rate Treasury Bond due 2051 0.00 0.003.90 per cent Treasury Bond 2023 1,095.67 923.562.00% Treasury Bond 2045 686.25 640.831.7% Treasury Bond 2037 929.39 896.884.40 per cent Treasury Bond 2019 130.59 123.59Floating Rate Treasury Bond due 2053 0.00 0.000.80 per cent Treasury Bond 2022 676.90 653.783.40% Treasury Bond 2024 870.60 736.130% Treasury Bond 2022 1,075.73 1,078.015.00 per cent Treasury Bond 2020 821.76 722.58EUR100000000 2.350% Notes due 01 April 2116 0.00 0.002% Notes due 29 June 2063 0.00 0.002% Notes due 29 June 2064 0.00 0.001.30% Treasury Bond 2033 18,575.56 18,628.97Floating Rate Treasury Bond due 2047 0.00 0.00Floating Rate Treasury Bond due 2049 0.00 0.002.4 per cent Treasury Bond 2030 991.08 861.421.00 per cent Treasury Bond 2026 1,572.08 1,528.56Series 2 - Issue of EUR 609,500,000 Inflation Linked Notes due 1 April 2040
0.00 0.00
0.9% Treasury Bond 2028 2,661.54 2,669.314.50 per cent Treasury Bond 2018 127.02 123.935.40 per cent Treasury Bond 2025 894.87 669.425.90 per cent Treasury Bond 2019 491.75 448.42
31,824.27 30,908.56Total:
Turnover €(m)Date321.8203-APR-18327.9504-APR-18283.5305-APR-18308.1306-APR-18262.8309-APR-18303.9810-APR-18393.0911-APR-18389.2212-APR-18338.3513-APR-18249.0016-APR-18379.5917-APR-18395.5918-APR-18337.3319-APR-18451.5420-APR-18349.8123-APR-18405.5524-APR-18480.0625-APR-18393.5426-APR-18454.1427-APR-18374.8530-APR-18
Total:Daily Average:
7,199.91360.00
Turnover €(m)Date0.0003-APR-180.0004-APR-180.0005-APR-180.0006-APR-180.0009-APR-180.0010-APR-180.0011-APR-180.0012-APR-180.0013-APR-180.0016-APR-180.0017-APR-180.0018-APR-180.0019-APR-180.0020-APR-180.0023-APR-180.0624-APR-180.0025-APR-180.0026-APR-180.0027-APR-180.1430-APR-18
Total:Daily Average:
0.190.01
Exchange Traded Funds
Volume (m)Turnover €(m)StockTreasury Bill 18.03.2019 50.23 50.00Treasury Bill 24.09.2018 30.06 30.00TREASURY BILL 18.06.2018 13.51 13.50Treasury Bill 17.12.2018 15.04 15.00
108.85 108.50Total:
Individual Irish Government Treasury Bills Turnover* 5.92 per cent Amortising Bond 2042 (issued 2013) 0.00 0.005.92 per cent Amortising Bond 20 January 2037 0.00 0.005.92 per cent Amortising Bond 20 September 2047 0.00 0.005.72 per cent Amortising Bond 20 July 2027 0.00 0.005.82 per cent Amortising Bond 20 March 2032 0.00 0.005.92 per cent Amortising Bond 2047 (issued 2013) 0.00 0.005.92 per cent Amortising Bond 20 May 2042 0.00 0.005.92 per cent Amortising Bond 2037 (issued 2013) 0.00 0.005.72 per cent Amortising Bond 2027 (issued 2013) 0.00 0.005.82 per cent Amortising Bond 2032 (issued 2013) 0.00 0.00
0.00 0.00Total:30,908.56Total: 31,824.27
Page 17 of 23*Information contained in this report generally represents off exchange trades, however executed, in Irish Government bonds submitted to the ISE at end of day by Primary Dealers. On exchange trades (if any) are included and also published separately by the ISE.
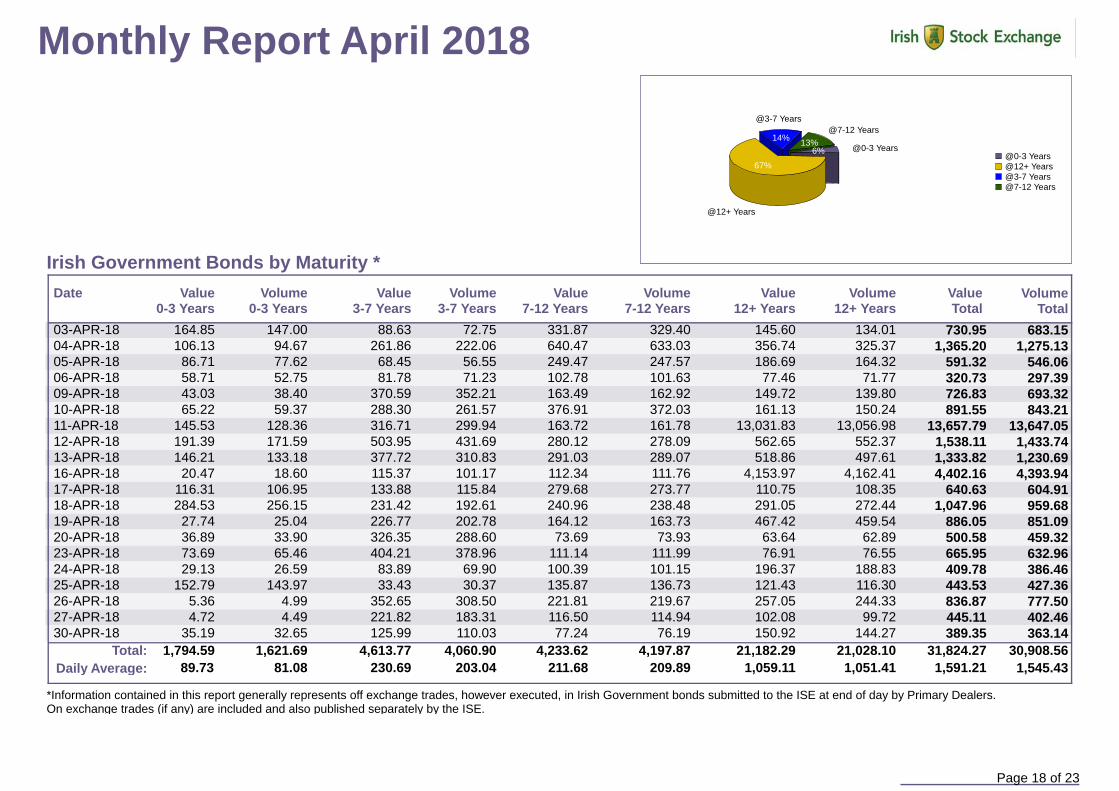
Monthly Report April 2018
Irish Government Bonds by Maturity *Volume
TotalVolume
12+ YearsVolume
7-12 YearsVolume
3-7 YearsVolume
0-3 YearsValueTotal
Value12+ Years
Value7-12 Years
Value3-7 Years
Value0-3 Years
Date
164.85 88.63 331.87 145.60 730.95147.00 72.75 329.40 134.01 683.1503-APR-18106.13 261.86 640.47 356.74 1,365.2094.67 222.06 633.03 325.37 1,275.1304-APR-18
86.71 68.45 249.47 186.69 591.3277.62 56.55 247.57 164.32 546.0605-APR-1858.71 81.78 102.78 77.46 320.7352.75 71.23 101.63 71.77 297.3906-APR-1843.03 370.59 163.49 149.72 726.8338.40 352.21 162.92 139.80 693.3209-APR-1865.22 288.30 376.91 161.13 891.5559.37 261.57 372.03 150.24 843.2110-APR-18
145.53 316.71 163.72 13,031.83 13,657.79128.36 299.94 161.78 13,056.98 13,647.0511-APR-18191.39 503.95 280.12 562.65 1,538.11171.59 431.69 278.09 552.37 1,433.7412-APR-18146.21 377.72 291.03 518.86 1,333.82133.18 310.83 289.07 497.61 1,230.6913-APR-18
20.47 115.37 112.34 4,153.97 4,402.1618.60 101.17 111.76 4,162.41 4,393.9416-APR-18116.31 133.88 279.68 110.75 640.63106.95 115.84 273.77 108.35 604.9117-APR-18284.53 231.42 240.96 291.05 1,047.96256.15 192.61 238.48 272.44 959.6818-APR-18
27.74 226.77 164.12 467.42 886.0525.04 202.78 163.73 459.54 851.0919-APR-1836.89 326.35 73.69 63.64 500.5833.90 288.60 73.93 62.89 459.3220-APR-1873.69 404.21 111.14 76.91 665.9565.46 378.96 111.99 76.55 632.9623-APR-1829.13 83.89 100.39 196.37 409.7826.59 69.90 101.15 188.83 386.4624-APR-18
152.79 33.43 135.87 121.43 443.53143.97 30.37 136.73 116.30 427.3625-APR-185.36 352.65 221.81 257.05 836.874.99 308.50 219.67 244.33 777.5026-APR-184.72 221.82 116.50 102.08 445.114.49 183.31 114.94 99.72 402.4627-APR-18
35.19 125.99 77.24 150.92 389.3532.65 110.03 76.19 144.27 363.1430-APR-181,794.59 4,613.77 4,233.62 21,182.29 31,824.27Total: 21,028.104,060.901,621.69 30,908.564,197.87
1,059.11211.68230.6989.73 1,591.21Daily Average: 1,051.41209.89203.04 1,545.4381.08
*Information contained in this report generally represents off exchange trades, however executed, in Irish Government bonds submitted to the ISE at end of day by Primary Dealers. On exchange trades (if any) are included and also published separately by the ISE.
6% @0-3 Years
67%
@12+ Years
14%
@3-7 Years
13%@7-12 Years
@0-3 Years@12+ Years@3-7 Years@7-12 Years
Page 18 of 23

Monthly Report April 2018
2015€(m)
2016€(m)
2017€(m)
2018€(m)
Month
6,286.27 6,555.157,241.11January 9,201.256,069.83 7,831.1311,072.76February 8,359.327,204.19 9,518.497,390.19March 8,498.996,318.98 6,752.317,042.38April 7,199.917,456.55 6,044.496,517.99May
17,476.19 7,298.319,570.24June7,024.99 5,958.216,829.49July6,725.96 6,285.185,534.14August8,434.05 7,475.109,013.26September8,995.96 7,313.085,441.88October8,953.06 7,633.647,738.40November7,383.96 5,473.386,077.50December
98,329.99 84,138.47405.60 388.66 352.24 331.25
Total:Daily Average:
89,469.3433,259.46
Monthly Equity Market Turnover
0
4,000
8,000
12,000
16,000
20,000
24,000
10/20
0011
/2001
04/20
0209
/2002
02/20
0307
/2003
12/20
0305
/2004
10/20
0403
/2005
08/20
0501
/2006
06/20
0611
/2006
04/20
0709
/2007
02/20
0807
/2008
12/20
0805
/2009
10/20
0903
/2010
08/20
1001
/2011
06/20
1111
/2011
04/20
1209
/2012
02/20
1307
/2013
12/20
1305
/2014
10/20
1403
/2015
08/20
1501
/2016
06/20
1611
/2016
04/20
1709
/2017
02/20
18
2018Volume (m)
2017€(m)
2015€(m)
2016€(m)
2018€(m)
Month
33,771.81 33,801.39 44,517.3532,737.46 23,917.06January15,492.18 21,935.41 36,756.1814,689.42 17,956.56February19,021.29 20,081.74 24,178.8717,879.51 15,168.62March31,933.12 15,341.08 18,685.1431,017.06 15,023.68April
14,366.16 18,856.628,706.61May17,531.15 17,323.8211,332.76June10,422.55 13,502.909,250.94July
8,307.21 9,261.885,940.78August15,242.69 18,144.2911,620.77September14,779.34 20,034.6329,033.07October22,355.52 12,679.9115,107.95November11,017.00 11,176.208,522.13December
171,580.93 205,181.24 245,117.791,222.18 678.19 807.80 965.03
Total:Daily Average: 1,174.68
96,323.22100,218.15
0
5,000
10,000
15,000
20,000
25,000
30,000
35,000
40,000
45,000
01/20
0006
/2000
11/20
0004
/2001
09/20
0102
/2002
07/20
0212
/2002
05/20
0310
/2003
03/20
0408
/2004
01/20
0506
/2005
11/20
0504
/2006
09/20
0602
/2007
07/20
0712
/2007
05/20
0810
/2008
03/20
0908
/2009
01/20
1006
/2010
11/20
1004
/2011
09/20
1102
/2012
07/20
1212
/2012
05/20
1310
/2013
03/20
1408
/2014
01/20
1506
/2015
11/20
1504
/2016
09/20
1602
/2017
07/20
1712
/2017
Monthly Market Turnover for Irish Government Bonds (€ million)*
*Includes Irish Treasury Bills.Information contained in this report generally represents off exchange trades, however executed, in Irish Government bonds submitted to the ISE at end of day by Primary Dealers. On exchange trades (if any) are included and also published separately by the ISE.
Page 19 of 23
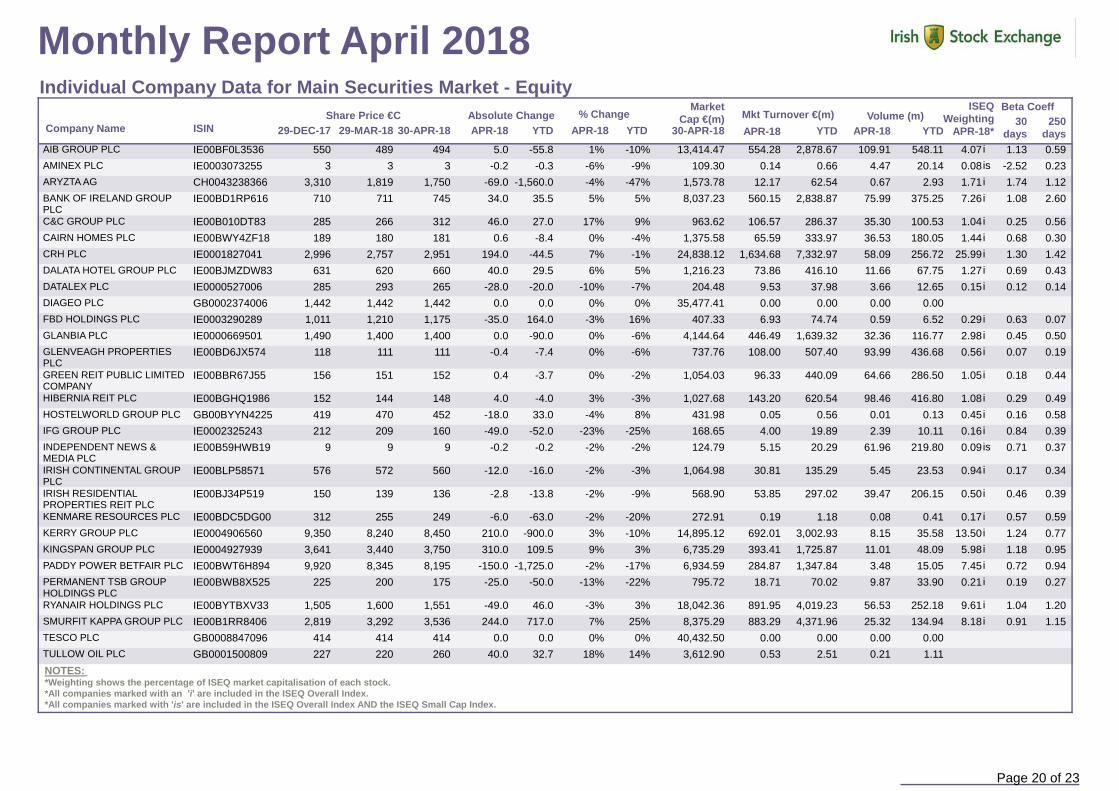
Monthly Report April 2018Individual Company Data for Main Securities Market - Equity
Beta CoeffISEQ Weighting
APR-18*Volume (m)
APR-18Mkt Turnover €(m)APR-18
% Change Absolute ChangeShare Price €CAPR-18APR-1829-MAR-1829-DEC-17 30-APR-18Company Name ISIN YTD YTD
MarketCap €(m)
YTD YTD30
days250
days30-APR-18
0.591.13548.11109.912,878.67554.28494IE00BF0L3536 489550 5.0 -55.8 %1 %-10 13,414.47AIB GROUP PLC 4.07i0.23-2.5220.144.470.660.143IE0003073255 33 -0.2 -0.3 %-6 %-9 109.30AMINEX PLC 0.08is1.121.742.930.6762.5412.171,750CH0043238366 1,8193,310 -69.0 -1,560.0 %-4 %-47 1,573.78ARYZTA AG 1.71i2.601.08375.2575.992,838.87560.15745IE00BD1RP616 711710 34.0 35.5 %5 %5 8,037.23BANK OF IRELAND GROUP
PLC7.26i
0.560.25100.5335.30286.37106.57312IE00B010DT83 266285 46.0 27.0 %17 %9 963.62C&C GROUP PLC 1.04i0.300.68180.0536.53333.9765.59181IE00BWY4ZF18 180189 0.6 -8.4 %0 %-4 1,375.58CAIRN HOMES PLC 1.44i1.421.30256.7258.097,332.971,634.682,951IE0001827041 2,7572,996 194.0 -44.5 %7 %-1 24,838.12CRH PLC 25.99i0.430.6967.7511.66416.1073.86660IE00BJMZDW83 620631 40.0 29.5 %6 %5 1,216.23DALATA HOTEL GROUP PLC 1.27i0.140.1212.653.6637.989.53265IE0000527006 293285 -28.0 -20.0 %-10 %-7 204.48DATALEX PLC 0.15i
0.000.000.000.001,442GB0002374006 1,4421,442 0.0 0.0 %0 %0 35,477.41DIAGEO PLC
0.070.636.520.5974.746.931,175IE0003290289 1,2101,011 -35.0 164.0 %-3 %16 407.33FBD HOLDINGS PLC 0.29i0.500.45116.7732.361,639.32446.491,400IE0000669501 1,4001,490 0.0 -90.0 %0 %-6 4,144.64GLANBIA PLC 2.98i0.190.07436.6893.99507.40108.00111IE00BD6JX574 111118 -0.4 -7.4 %0 %-6 737.76GLENVEAGH PROPERTIES
PLC0.56i
0.440.18286.5064.66440.0996.33152IE00BBR67J55 151156 0.4 -3.7 %0 %-2 1,054.03GREEN REIT PUBLIC LIMITED COMPANY
1.05i
0.490.29416.8098.46620.54143.20148IE00BGHQ1986 144152 4.0 -4.0 %3 %-3 1,027.68HIBERNIA REIT PLC 1.08i0.580.160.130.010.560.05452GB00BYYN4225 470419 -18.0 33.0 %-4 %8 431.98HOSTELWORLD GROUP PLC 0.45i0.390.8410.112.3919.894.00160IE0002325243 209212 -49.0 -52.0 %-23 %-25 168.65IFG GROUP PLC 0.16i0.370.71219.8061.9620.295.159IE00B59HWB19 99 -0.2 -0.2 %-2 %-2 124.79INDEPENDENT NEWS &
MEDIA PLC0.09is
0.340.1723.535.45135.2930.81560IE00BLP58571 572576 -12.0 -16.0 %-2 %-3 1,064.98IRISH CONTINENTAL GROUP PLC
0.94i
0.390.46206.1539.47297.0253.85136IE00BJ34P519 139150 -2.8 -13.8 %-2 %-9 568.90IRISH RESIDENTIAL PROPERTIES REIT PLC
0.50i
0.590.570.410.081.180.19249IE00BDC5DG00 255312 -6.0 -63.0 %-2 %-20 272.91KENMARE RESOURCES PLC 0.17i0.771.2435.588.153,002.93692.018,450IE0004906560 8,2409,350 210.0 -900.0 %3 %-10 14,895.12KERRY GROUP PLC 13.50i0.951.1848.0911.011,725.87393.413,750IE0004927939 3,4403,641 310.0 109.5 %9 %3 6,735.29KINGSPAN GROUP PLC 5.98i0.940.7215.053.481,347.84284.878,195IE00BWT6H894 8,3459,920 -150.0 -1,725.0 %-2 %-17 6,934.59PADDY POWER BETFAIR PLC 7.45i0.270.1933.909.8770.0218.71175IE00BWB8X525 200225 -25.0 -50.0 %-13 %-22 795.72PERMANENT TSB GROUP
HOLDINGS PLC0.21i
1.201.04252.1856.534,019.23891.951,551IE00BYTBXV33 1,6001,505 -49.0 46.0 %-3 %3 18,042.36RYANAIR HOLDINGS PLC 9.61i1.150.91134.9425.324,371.96883.293,536IE00B1RR8406 3,2922,819 244.0 717.0 %7 %25 8,375.29SMURFIT KAPPA GROUP PLC 8.18i
0.000.000.000.00414GB0008847096 414414 0.0 0.0 %0 %0 40,432.50TESCO PLC
1.110.212.510.53260GB0001500809 220227 40.0 32.7 %18 %14 3,612.90TULLOW OIL PLC
NOTES : *Weighting shows the percentage of ISEQ market capitalisation of each stock. *All companies marked with an 'i' are included in the ISEQ Overall Index. *All companies marked with 'is' are included in the ISEQ Overall Index AND the ISEQ Small Cap Index.
Page 20 of 23

Monthly Report April 2018
Volume (m)APR-18
Mkt Turnover €(m)APR-18
% Change Absolute ChangeShare Price €CAPR-18APR-1829-MAR-1829-DEC-17 30-APR-18Company Name ISIN YTD YTD
MarketCap €(m)
YTD YTD30-APR-18
ISEQ Weighting
APR-18*
Beta Coeff250day
30 days
0.050.010.760.121,530IE0000020408 1,4901,450 40.0 80.0 %3 %6ABBEY PLC 328.03 0.06 0.12 0.04is0.540.180.120.0420GB00BDD1LS57 2424 -4.0 -4.0 %-17 %-17AMRYT PHARMA PLC 54.96 0.03 0.45 0.80is
12.392.9371.9718.01636IE00BXC8D038 584542 52.0 94.5 %9 %17APPLEGREEN PLC 582.95 0.29 -0.06 0.16i2.820.2617.391.57620IE0007214426 616622 4.0 -1.8 %1 %0CPL RESOURCES PLC. 168.47 0.11 0.72 0.22is2.281.2319.2610.80880IE0002184616 885779 -5.0 101.1 %-1 %13DONEGAL INVESTMENT GROUP PLC 79.64 0.08 0.31 0.14is0.090.000.450.01530GB00BY7QYJ50 540422 -10.0 108.4 %-2 %26DRAPER ESPRIT PLC 379.542.341.190.560.3126CA3060711015 2424 2.0 2.0 %8 %8FALCON OIL & GAS LTD 241.850.010.000.490.014,470GB0031477770 4,4904,733 -20.0 -263.3 %0 %-6FIRST DERIVATIVES PLC 1,147.58 0.83 -0.13 0.12i0.110.070.040.0340GB00BGCC6189 3238 8.0 2.0 %25 %5GAN PLC 28.021.950.330.020.001IE00B1FR8863 22 -0.3 -0.7 %-20 %-37GREAT WESTERN MINING CORPORATION
PLC7.11 0.01 -3.85 0.55is
29.357.6331.127.92106IE00BF2NR112 104107 2.3 -1.0 %2 %-1GREENCOAT RENEWABLES PLC 286.20 0.20 -0.53 -0.02i0.000.000.070.041,570IE00BJYS1G50 1,5601,280 10.0 290.0 %1 %23MAINSTAY MEDICAL INTERNATIONAL PLC 103.92 0.05 0.03 -0.21is0.570.144.761.11820IE00BVGC3741 760850 60.0 -30.0 %8 %-4MALIN CORPORATION PLC 373.32 0.35 -0.19 -0.18i2.950.413.610.50128IE00BD64C665 123100 5.0 28.0 %4 %28MINCON GROUP PLC 269.49 0.11 0.25 0.26is
55.9910.22315.0752.83534IE00B1WV4493 535634 -1.0 -100.0 %0 %-16ORIGIN ENTERPRISES PLC 670.59 0.71 0.39 0.40i16.324.120.430.113IE00BF0MZF04 33 0.4 0.3 %15 %11ORMONDE MINING PLC 14.18 0.01 2.67 0.37is
0.150.020.010.0010IE00B4XVDC01 108 0.1 1.8 %1 %22OVOCA GOLD PLC 8.16 0.00 0.53 -0.98is7.211.000.130.022IE00B0Q82B24 21 0.0 0.6 %0 %60PETRONEFT RESOURCES PLC 11.24 0.01 0.66 0.19is
27.785.893.270.7512IE00B66B5T26 1110 0.8 2.3 %7 %24PROVIDENCE RESOURCES PLC. 70.52 0.07 -1.08 -0.28is126.6812.09304.3328.81236IE00B1HDWM43 240256 -4.0 -20.0 %-2 %-8TOTAL PRODUCE PLC 915.28 0.84 0.04 -0.65i
0.120.050.010.007GB00B9275X97 815 -1.0 -7.5 %-13 %-52VENN LIFE SCIENCES HOLDINGS PLC 4.220.780.090.100.0114IE00BG0HDR01 12 1.5 %13VR EDUCATION HOLDINGS PLC 26.07 0.01 -0.29 -0.11is1.910.000.080.004IE00B1G17W46 45 0.0 -0.5 %0 %-11ZAMANO PLC 3.98 0.00 0.17is
NOTES*Weighting shows the percentage of ISEQ market capitalisation of each stock. *All companies marked with an 'i' are included in the ISEQ Overall and ESM Indices.*All companies marked with 'is' are included in the ISEQ Overall Index AND the ISEQ Small Cap Index.
Individual Company Data for Enterprise Securities Market
Volume (m)APR-18
Mkt Turnover €(m)APR-18
% Change Absolute ChangeShare Price €CAPR-18APR-1829-MAR-1829-DEC-17 30-APR-18Company Name ISIN YTD YTD
MarketCap €(m)
YTD YTD30-APR-18NAV AUM
APR-18 APR-180.900.191,365IE00BVFB1H83 1,3001,412 65.0 -46.5 %5 %-3WISDOMTREE ISSUER PLC 19.11 13.74 19,233,2000.060.01
Individual Company Data for Main Securities Market - ETF
Page 21 of 23

Monthly Report April 2018
Date Company Action New Capital (€) Existing Capital (€) Money Raised (€)
APPLEGREEN PLC Exercise of Options 585,0006-Apr-2018HIBERNIA REIT PLC Employee Share Options 236,3449-Apr-2018DALATA HOTEL GROUP PLC Block Listing 3,748,60010-Apr-2018
Equity Investment Flows
GlossaryNew Capital Value of newly issued shares (Capital increase) - Monetary value of shares issued through a capital increase, by both newly listed companies and already listed companies.
Existing Capital Value of already issued shares (Sale) - Monetary value of public/secondary offers through a sale of already issued shares, by both newly listed companies and already listed companies.
Money Raised The aggregated amount of actual money raised (gross proceeds) by companies admitted to listing and trading on the ISE in a specific period through various share issuances.
Page 22 of 23

Monthly Report April 2018
365 986 5,2481,351 Funds Subfunds ClassesTotal Funds/Subfunds (incl Umbrella Funds)Investment Funds
% of TotalNo of Funds & Subfunds % of Total % of TotalNo. of ClassesNo. of FundsIreland 190 4,593%52.05 %87.521,061 %78.53Bermuda 38 67%10.41 %1.2844 %3.26British Virgin Islands 15 41%4.11 %0.7819 %1.41Cayman Islands 73 302%20.00 %5.7596 %7.11Delaware 2 2%0.55 %0.042 %0.15Guernsey 12 144%3.29 %2.7438 %2.81Jersey 14 36%3.84 %0.6948 %3.55Mauritius 4 4%1.10 %0.085 %0.37Other 5 12%1.37 %0.235 %0.37Luxembourg 9 43%2.47 %0.8229 %2.15Malta 2 3%0.55 %0.063 %0.22Singapore 1 1%0.27 %0.021 %0.07
365 5,248 Total: %100 %1001,351 %100
Total Securities Currently listed at the end of April 2018
Fund - Summary Statistics
% of Total % of Total % of TotalNo of Funds & SubFundsLegal Structure No of SubfundsNo of FundsInvestment Company 307 8581,165 %84.11 %87.02%86.23Unit Trust 25 79104 %6.85 %8.01%7.70Limited Partnership 2 02 %0.55 %0.00%0.15ICAV 8 3139 %2.19 %3.14%2.89Other 15 520 %4.11 %0.51%1.48PCC 4 812 %1.10 %0.81%0.89SPC 4 59 %1.10 %0.51%0.67
365 986Total: 1,351 %100 %100%100
Debt Securities - Summary Statistics Debt Security Debt Non-Debt Programme
Issuers* Programme Issuers TranchesTotal End of April 2018New April 2018 New Year To Date 2018
32,1473,07541
139
5615
21*Includes all programme issuers (i) with securities listed or (ii) currently approved to list.
1,1694,453
Page 23 of 23The Irish Stock Exchange plc, trading as Euronext Dublin, is regulated by the Central Bank of Ireland.