crystalline media for srs conversion of high power 1.32 ... crystalline media for srs ... va...
TRANSCRIPT

Institute for Laser Physics of SC "Vavilov State Optical Institute"&
Company Lasers and Optical System, Ltd.
Crystalline Media for SRS Conversionof High Power
1.32 Micron Radiation
Final Report
7PC T7- 408o
Director of the Institute Prof. Arthur A.Mak
Principle Investigator Sergey N.Karpukhin
St.-Petersburg
1999
DISTRIBUIJTON STATEMENTrAApproved for Public Release
Distribution Unlimited

REPORT DOCUMENTATION PAGE Form Approved OMB No. 0704-0188
Public reporting burden for this collection of information is estimated to average 1 hour per response, including the time for reviewing instructions, searching existing data sources,gathering and maintaining the data needed, and completing and reviewing the collection of information. Send comments regarding this burden estimate or any other aspect of thiscollection of information, including suggestions for reducing this burden to Washington Headquarters Services, Directorate for Information Operations and Reports, 1215 JeffersonDavis Highway, Suite 1204, Arlington, VA 22202-4302, and to the Office of Management and Budget, Paperwork Reduction Project (0704-0188), Washington, DC 20503.1. AGENCY USE ONLY (Leave blank) 2. REPORT DATE 3. REPORT TYPE AND DATES COVERED
1999 Final Report
4. TITLE AND SUBTITLE 5. FUNDING NUMBERS
Delivery of Crystalline Media for SRS Conversion of High Power 1.32 Micron Radiation F6170897W0255
6. AUTHOR(S)
Dr. Sergey Karpukhin
7. PERFORMING ORGANIZATION NAME(S) AND ADDRESS(ES) 8. PERFORMING ORGANIZATIONREPORT NUMBER
CompanyBirzhevaya line 12 N/ASt. Petersburg 199034Russia
9. SPONSORING/MONITORING AGENCY NAME(S) AND ADDRESS(ES) 10. SPONSORING/MONITORINGAGENCY REPORT NUMBER
EOARDPSC 802 BOX 14 SPC 97-4080FPO 09499-0200
11. SUPPLEMENTARY NOTES
12a. DISTRIBUTION/AVAILABILITY STATEMENT 12b. DISTRIBUTION CODE
Approved for public release; distribution is unlimited. A
13. ABSTRACT (Maximum 200 words)
This report results from a contract tasking Company as follows: The contractor will (1) deliver SRS crystal samples currently available, andanalyze the principal limitations of SRS conversion of 1.32 micron radiation; (2 ) deliver SRS crystal samples available at this stage of thecontract, and operate the laser with rep rate of up to 20 Hz and energy of 20mJ single mode and 150mJ multi-mode, and grow larger SRS-active crystals; and (3) produce final SRS crystal samples, and study SRS conversion parameters (vary beam focus within and outside thecavity), measure spectral and coherence properties of the radiation, investigate SRS amplification of single mode radiation with multi-modepumping, and prepare final report.
14. SUBJECT TERMS 15. NUMBER OF PAGES
78EOARD, Laser Raman Conversion 16. PRICE CODE
N/A
17. SECURITY CLASSIFICATION 18. SECURITY CLASSIFICATION 19, SECURITY CLASSIFICATION 20. LIMITATION OF ABSTRACTOF REPORT OF THIS PAGE OF ABSTRACT
UNCLASSIFIED UNCLASSIFIED UNCLASSIFIED ULNSN 7540-01-280-5500 Standard Form 298 (Rev. 2-89)
Prescribed by ANSI Std. 239-18298-102

Contents
1. Introduction ........................................................................................ . . 3
2. Measuring of SRS gain for the pump wavelength of 1.32 tm .............. 3
3. Generation in the focused beams ....................................................... 6
4. Generation in the cavity ..................................................................... 12
5. Amplification of the diffraction-limited beamsin SRS media, pumped by laser beam with a wide angular spectrum .... 21
5.1. Introduction .............................................................................. 2 1
5.2. The model of SRS amplifier: basic equations and relationships ... 22
5.3. Results of calculations and discussion .................................... 27
5.4. Experimental study of amplification ........................................ 43
6. M ain results ..................................................................................... . . 47
7. R eferences ...................................................................................... 48
Application 1: First interim report.
Application 2: Second interim report.
2

1. Introduction
This Report is delivered on the completion of the third final stage of the workin the frame of the Contract F61708-97-W0255. According to the Contract provisionson the final stage we had to study the SRS conversion parameters (to vary beam focuswithin and outside the cavity), to measure the spectral and the coherence properties ofthe radiation, to investigate the SRS amplification of single mode radiation, with themulti-mode pumping and had also to grow up the large-size SRS-active crystal. Thestudy was carried out by the Company LOS Ltd., St.-Petersburg, Russia with theparticipation of the scientists of the Research Institute for Laser Physics,St.- Petersburg, Russia, and of the Research Center "Vavilov State Optical Institute",St. -Petersburg, Russia.
In the First Interim Report we have analyzed the basic physical limitations ofthe approach on the base of the literature data on the studies of the SRS in crystals.The said report contains the review of the available literature as well as the someoriginal numerical simulation results, related to the thermal optics behavior of theSRS process in the pulse-repetitive mode. The experimental setup is described in theSecond Interim Report. This Report contains only the original results, and theliterature data is used only when it is necessary for the analysis.
2. Measuring of SRS gain for the pump wavelength of 1.32 gm
In the First Interim Report we have noted that the SRS gain (the amplificationcoefficient) is the main characteristic of the crystal, determining its SRS activity. Tothis moment the literature has lacked the data on this gain values, so we have startedthe work by its measurements. One can directly evaluate the gain measuring theamplification of the input signal. Such an approach seems to be the most accurate, butits realization requires the detailed account for the spatial and temporal overlap of thesignal and pumping beams. For instance[ I], the measurement accuracy was improvedby the use of the CW input signal, amplified in the field of the pulsed pump. One canalso provide the automatic spatial and temporal coincidence of the pulses whenmeasuring SRS excitation from the spontaneous Raman scattering signal. Thismethod is based on measurement of the SRS threshold.
Let us first evaluate the possibility to use in the gain measurements the multi-frequency single-mode radiation of the pumping laser, described in the SecondInterim Report. One can see from the following equation that within some limits thewidth of the pump spectrum does not influence onto the value of the local gain F [cm"1] of the collinear SRS [2]:
r = gIo-27tAvp(1/us-1/up), for gI > 27rAvp(1/us-l/up)
here g is the SRS gain, I0 is the intensity of the pump, entering the crystal, Avp is thewidth of the pump spectrum and %•, op are the group velocities of the Stokes andpumping waves. As it follows from this relationship, when the inequality is fulfilled,the value of the gain for the multi-frequency radiation does not differ from that for thesingle-frequency radiation. The physical sense of this inequality is that the gain,
3

accumulated along the length, which is equal to the difference of the coherent lengthsof the interacting waves, has to exceed one. In other words, the gain is to besufficiently high. Let us evaluate this inequality fulfillment for the single-pass SRSexcitation in our case. It is well known, that, according to the results of the theoreticaland experimental studies of the stimulated nonlinear processes, the intensity of theStokes wave can reach the level, comparable to the intensity of the pump (IAp -1%),when the total gain is equal approximately 1013 or e3" [3]. This large value is universalfor all the stimulated processes; it describes the experimental threshold of thestimulated scattering rL=30 (here L is the length of the crystal). Indeed for the fixedgeometry of the experiment the reduce of the pump intensity in just 20% below thethreshold results in the signal intensity reduce in 400 times, i.e. in the practicallycomplete dumping of the stimulated scattering. However, the additional detailedaccount for the angle, where takes place the spontaneous Raman scattering signalamplification, has resulted in more accurate evaluation of the total threshold gain [2].The more accurate value equals 20-25 for the parallel pumping beam and 30-35 forthe focused single mode beam. So at the threshold of the SRS excitation in thefocused single-mode beam the left side of the given inequality has to be equal 30/L.;L in our case was equal 6 cm, so the local gain value has to be equal ]=5. Note, thatin the right side (1/u,-1/up)=1/c(1/n,-l/np), that the width of the laser emissionspectrum was Avp=0.4 cm 1 and that (1/ns-1/np)<0.01. So the right side of theinequality is <0.03, i.e. inequality is fulfilled. Consequently, we can use the method ofthe gain measuring by measuring the single-pass SRS excitation threshold. Thismethod is based on the following. The single-mode radiation, whose energy exceedsthe SRS threshold, is focused into the crystal. In the focal waist the radiationpropagates as the plain wave, and hence the gain is described by the followingproduct:
MF= g (P/SF) I F (i)
here P is the pump power, SF is the square of the pumping beam's section
(SF =7 (Fe0 )2), F is the focal length of the lens, 0 is the Gaussian beam divergence4
k- ) and IF is the length of the beam waist. The length of the beam waist in the
crystal is described by the following equation [2]:
I=F2On (2)Do
here Do is the Gaussian beam diameter before lens (Do =2 ) and n is the refraction
index. Combination of (1) and (2) with the account for the expressions for SF and 0results in the expression:
g=nM (3)2 ko Pth n
here MF = 30-35, ko = 27t
4

Joulemeter .=cm
13 gm.2 t
Filter,- K Filter TK
Fig. 2.1.The scheme of experimental setup for measuring an amplification gain.
In the Fig.2.1 is shown the scheme of the experimental setup for measuring ofthe amplification gain. The dimensions of Ba(NO)3 crystal equaled 10xlOx60mm anddimensions of KGW crystal were 05x55mm. The focal length of the lens, mounted atthe distance 120 cm from the coupling mirror of the cavity, equaled 20 cm. Thediameter of the Gaussian beam, which was measured with the use of the apertures,equaled 1.24 mm (the diameter of the aperture inside the laser cavity was in 0,1 mmsmaller than the diameter of the aperture, resulting in the second laser modeexcitation). The Gaussian distribution across the beam was checked by measuring itsdivergence: the relationship Oo,sE = X/DO.sE was fulfilled. The length of the beam waist(6.8 cm) has slightly exceeded the length of the crystal; hence the threshold incrementwas accumulated along the smaller length. The measuring of the amplification gainhas accounted for this difference: the correction coefficient, equal to the lengths' ratio,was used.
The threshold power was measured bymeans of registration of the pump pulse shape atthe crystal input and output. We have evaluated thepower, which was corresponding (with the accountfor the nonlinear losses) to the moment of the Pump puis formcharacter break of the temporal profile of thepumping pulse at the crystal output. This break I
corresponds to the start of the process of the 2!51 n.energy conversion. In the Fig.2.2 are shown thetemporal profiles of the pump pulse at the crystalinput and of the pulse, which has passed through Ptreshold ' Residualthe crystal without conversion. The Table summa-rizes the results of the gain measurements as wellas the values, which were measured earlier for thewavelengths of 1.064 gm and of 0.532 gm. One , , ,can see that the gain reduce with the wavelength rimegrow is described by the law, which faster than thejust inversely proportional. The possible reason is Fig2.2. Temporal profiles of thethe influence of the resonant terms in the pump pulse at the crystal inputexpression for the Raman scattering, accounting and of the pulse, which hasfor the structure of the crystalline electron levels passed through the crystal
[4]. without conversion.
5

Parameters of SRS crystalsg.103 cm/MW __________
Materials Polarization x = 0.5 gm X = 1.06 gm X = 1.32 4m v, cn"'
Ba(N0 3)2 47 11 7.1 1046• 1047 "
KGd(W0 4)2 Ism - axis - 6 - 901.5____ _ ne- axis - 6 - 767.3
* T.T. Basiev, W. Jia, H. Liu, P.G. Zverev, Raman Spectroscopic and Nonlinear Optical Propertiesof Barium Nitrate Crystal., OSA TOPS on Advanced Solid-State Lasers.,1996, v. 1, p.554 -559.
In addition to the said measurements in the barium nitrate crystal we havemade an attempt to measure the gain in the KGW crystal in the similar experimentalconditions. However, in this crystal the threshold of SRS has exceeded the breakdownthreshold. Thus the gain in the KGW crystal was evaluated on the base of measuringof the threshold of the generation in the cavity (see Section 4).
So we have measured the value of the SRS gain in the crystal of barium nitrateat the wavelength 1.32 4tm. It is equal 0.0071 cm/MW.
3. Generation in the focused beams
This section presents the results of the a b cexperimental study of the Stokes radiationgeneration in the focused single and multi mode * *beams. Special attention was paid to theconversion efficiency and to the spectral and Fig.3.1. Spectrum of the radiation,spatio-angular parameters of the radiation. In generated via the single mode beamthe Fig.3.1 is shown the spectrum of the focusing: a -pump; b - first Stokes;radiation, generated via the single mode beam c - second Stokes.focusing. (The spectrum was produced due tothe dispersion of the Stokes radiation in the glass prism and was photographed fromthe screen with the photosensitive layer.) Note the splitting of the second Stokescomponent line. One can see that its longer wavelength subcomponent reveals lowerintensity. The reason of this effect is the threshold-less four-wave mixing conversionof the weak pumping component at the wavelength 1.338 gim (see the First InterimReport) to the Stokes components. The said wavelength is rather close to that of themain component. Hence the wave mismatch of the corresponding parametric processis small (Aks,2 = (kp,1 - ks,l) - (kp,2 - ks,2), Akss,2 = (ksl - kss,I) - (ks,2 - kss,2), here theindexes p, s and ss correspond to the pump, to the first and to the second Stokescomponents, and the indexes 1 and 2 correspond to the pump components at thewavelengths 1.319 and 1.338 4im) and interaction is rather efficient. In all theexperiments which we shall discuss further were observed not more than two Stokescomponents. The energy of the second Stokes component was measured with the useof the selective glass filter, cutting off the first Stokes component.
We have experimentally measured the dependence of the efficiency of theconversion to the both Stokes components vs. the focal length of the lens in order todetermine the optimal focal length. The optical scheme of the experiment is shown in
6

SelectiVerror Selective
x SSS filterE
Filter f pmpump
pump
Fig.3.2. The optical scheme of the experiment for generation in the focused beams.
the Fig.3.2. The crystals were tilted in order to prevent the generation in the direction,perpendicular to their butt-ends. In the Fig.3.3 are shown the results of thesemeasurements for the single and the multi-mode beams at the constant energy. Onecan see that in the case of the single mode beam (Fig.3.3 a) the curve is saturated forthe short focal length. The reason is that for the focal length of 20 cm the length of thefocal waist practically coincides with the length of the crystal. Further shortening ofthe focal length results in just negligible growth of the increment, while the focaldensity of the intensity grows. Such a growth is not desirable in the case of pulse-repetitive mode of laser action. (For example, in the experiments with the coppervapor laser [5] radiation, focused by lens with the focal length of 50 cm, after someperiod of the experiments there was observed the occasional breakdown of the crystal,while in course of the consequent experiments with the focal length of 60 cm nodamage occurred). That is why we have chosen for our experiments the focal lengthof the lens equal to 20 cm.
In the case of the multi-mode pumping the length of the focal waist exceededthe length of the crystal for all the lens we have used. Hence the conversion efficiencywas reducing with the focal length growth (see Fig.3.3 b). However, in our furtherexperiments we have not used the focal lengths, shorter than 20 cm, due to the higherenergy in the pulse of the multi-mode pump and to the limitations, imposed by thepossibility of the optical damage. The threshold of the optical damage can beevaluated as 60 J/cm . The most recently grown crystals were not damaged by such anintensity. However, in the crystals, which were grown up earlier and which werecharacterized by the stronger scattering of the He-Ne laser radiation, the damagesometimes was produced by such an intensity (depending upon the point of radiationfocusing).
Tb,% a % b50 " 50.
40- 40-
30- EP 15mJ 30.
20 EStokes 20 . E P =1 0m
10 Epump 10"
107 20M 2bc 30 40 'cm
Fig.3.3 Dependence of the conversion efficiencyto the both Stokes components vs. the focal length of the lens.
7

a TIP % b
40 - 40 - -- -- - - -- -
30- 30... .. . . .. . .
20- 20.
10 10-
1 ,0 100 E m
10 Ep, mJ 50 100 Ep, mJ
Fig.3.4 Conversion efficiency to the separate Stokes components vs. pump energy forsingle mode beam (a) and multy mode beam (b).
0 - total output Raman radiation, - - - - - first Stokes component, A - second Stokes component;
In the Fig.3.4 are shown the results of measuring of the conversion efficiencyto the separate Stokes components vs. pump energy. As one would expect, theefficiency of the conversion to the most interesting first Stokes component waslimited by the excitation of the second Stokes component. Both Stokes componentswere excited only in the forward direction; the reason is the slightly smaller gain ofthe backward SRS amplification in the field of the multi-frequency pump in our case.The maximal technical efficiencies reached 35% for the single-mode pump and 27%for the. multi-mode pump. The corresponding values of the physical efficiency(accounting for the Fresnel reflection at the butt-ends and for the incompletetransmission through the selective mirror) were thus 41% for the single-mode and32% for the multi-mode pump. One can see that in the case of the single-modepumping the influence of the second Stokes generation onto the efficiency of the firstStokes component generation is smaller. The reason of this effect is as follows. Theprocess of the second Stokes component generation involves the parametric process.In the both regimes the pump has the plain wavefront along the overall length of thecrystal. Hence both of the pumping regimes reveal one and the same increments alongthe length of the nonlinear parametric conversion to the second Stokes component(gls/Akss, here Akss = kp -2k, +kss). At the same time in the single-mode variant ofpumping the diffraction divergence of the second Stokes component (0=%ss/D0,sE,%ss=1.82 gtm) exceeds that for the multi-mode pump because of the much(approximately in 5 times) narrower beam in the first case. This effect obviouslyresults in extra-losses while excitation of the second Stokes component.
The relatively low conversion efficiency results of the temporal profile of thepulse, where the large amount of energy contains in the forward and the backwardtails of the pulse. That is why the Stokes pulse is shorter and has the nearlyrectangular shape (Fig.3.5). This, however, is not the only reason. We havediscovered the additional channel of losses, caused by the nonlinear absorption ofradiation. It is more emphasized for the single-mode radiation. We have firstmeasured the energy balance between the input and output beams when the peakintensity in the pulse was sufficiently lower than the SRS threshold. Such anexperimental conditions were provided when the radiation passed through the crystalwithout focusing (pulse energy of 15 mJ). The output energy was in this case equal tothe input energy with the account for the reflection from the edges, i.e. the linearlosses were negligible. In the case of focusing of the beam with the energy beyond the
8

a~n b4ei21.75113UnstaleWdt Unstable
.histogram 7 7 histogram...................... . . . . i .. . . h, ,o •
S... . !....:: ... : . .. i... T ' •~ o. c~i: 7oo v .. .. ... ! ... .. .: ... .. .........."oom
S~...SO.Omi. 2•.on . .. ..ll .O..~ a".nti ,:
M 25:66s: -dii .t..7.0-0-M.V 2tM6 25 .fl .h .00
IUIý 500MV 25 SOnst ~J 500tsW 2Sns
Fig. 3.5. Temporal profile of the one mode pump pulse(a) and Stokes pulse(b).
threshold, when no SRS took place, for the single-mode pump the energy balance(with the account for the reflexes) was frustrated. Extra-losses equaled 6% of theinput energy. For the saturated SRS these losses grew up to 11-13%. In the case of themulti-mode pumping the nonlinear losses in the saturated regime were smaller than inthe single-mode case; in the mode of the single-pass saturated SRS their value did notexceed 4-6%. The most possible reason of these nonlinear losses is the resonant multi-photon absorption, caused by the continuous spectrum of the electron states in thecrystalline zone structure. The difference in the losses for two variants of the pumpresults, probably, of the different spectral density of radiation. The multi-moderadiation opposite the single-mode radiation contains the transverse oscillations andthus its energy is distributed across the larger amount of the frequency components.(This feature also reveals itself in the much smoother temporal profile of the multi-mode radiation pulse).
Another variant of the experiment geometry (Fig.3.6) has revealed higherefficiency of the energy conversion to the first Stokes component of the multi-moderadiation. In this case the radiation was focused by lens (with the longer focal length)in the direction, which was perpendicular to the butt-ends of the crystal. In this casethe butt-end edges act as the cavity mirrors, and the SRS excitation threshold isapproximately two times lower than in the case of the tilted edges. In such thegeometry there is also observed the excitation of the backward SRS. However, suchan experiment can not be treated as the generation in the cavity: one can see from thedivergence measurements (see further) that in this case the structure of the angulardistribution of the output radiation energy reproduct that of the pump. The opticalscheme of the measurements in this geometry is shown in the Fig.3.6, while theresults of these measurements are shown in the Fig.3.7. One can see that the secondStokes component is excited only for the triple threshold ratio. The reason is thethreshold reduce and thus in the weaker parametric process of the second Stokescomponent generation, whose rate is proportional to the product of the pump intensityand intensity of the first Stokes component. Note also that the radiation focusing intothe auxiliary crystal (Fig.3.6 b) did not result in the improvement of the first Stokescomponent generation efficiency.
9

a
Filter BaN 2SelectilF= 41cm
r9= 1.32 im filter
l,:1.2 gm 49cm/
b
1.4 m a(W 2Bai(N0 3 2 =1.54j gm
F= 41 cm F= 13 cm
X = 1.32 ýtm
Fig.3.6. The optical scheme for generation in the focussed beams with butt endsof a crystal perpendicular to pumping beam direction (6) and with repeated
focusing in the second crystal (b).
30-20 ,
10-
50 100 150 Ep, m,
Fig.3.7 Conversion efficiency to Stokes components vs. pump energy.1 - two crystal scheme ( total output Ramnan radiation ); 2 - one crystal scheme ( first Stokes
component ); 3 - backward SRS ( for one and two crystal scheme ); 4 - second Stokescomponent (two crystal scheme ); [0 - second Stokes component ( one crystal scheme).
10

Pump - Stokes
4 " output
041 4
Fig.3.8 The optical scheme for effective generationof the first Stokes component in focused beams.
1 - mirror; 2 - selective mirror; 3 - polarizer for Stokes radiation; 4 - 901 polarization rotator
Summation of the forward and the backward SRS radiation in the scheme,shown in the Fig.3.8, will result in the utmost conversion efficiency of 41%.
We have tested in the experiment that the parameters of the converted beamsdid not vary up to the pulse repetition rates of 20 Hz.
Radiation divergence was measured with the use of the pinholes, mounted inthe beam waist after the special measuring lens (Fig.3.9). We have also measured (forthe comparison purposes) the divergence of the pumping beam. In this case the beamenergy was attenuated beyond the SRS threshold by the thin neutral filter, and theselective mirror was taken off the scheme. The results of the divergence
aLaser 1.132 4output F = 20 cm F= 13 1.3
oup mirror Filter 1
12 m16 cm 1 62 cm Jb
X~ 13 ým F= 41 cm X' 1.32 ýLm F= 20 cm Joulemeter
Filter 5, cm =68 cm
Fig. 3.9. The optical scheme for divergence measurement wvithone mode pump beam (a) and multy mode (b).
11

n a Ep b1 ' 1 '0 .
0.5 A - PUMP 0.5 '
0 - Stokes
( ,m ra d l. . . . . ( P ,m ra d
1 2 1 2 3
Fig.3.10. The results of the divergence measurements
measurements are shown in the Fig.3. 10. One can see that - both for the single-modeand the multi-mode pumping - the Stokes beam divergence was slightly less than thatof the pumping beam. In the case of the single mode beam such a situation is possibleonly due to the beam diameter increase at the measuring lens. This, in turn, means thatthe diameter of the beam of the Stokes radiation in the crystal is smaller than that ofthe pump beam (such a result was theoretically predicted [6]), and the near-fielddiffraction results in the wider beam in the plane of the measurement lens. Let us, fora conclusion, repeat the main results of this Section:
1. In the focused beam the generation with the wave front reproduction takes place upto the level of saturation. That is why the divergence of the Stokes radiation isclose to that of the pump divergence.
2. Efficiency of the conversion to the first forward Stokes component is limited bythe excitation of the second Stokes component. Conversion efficiency in thesingle-mode focused beam (35%) is higher than that in the multi-mode beam(27%). Efficiency of the first Stokes component for multi-mode generation can beimproved up to 41% by means of summation of the forward and the backwardscattering in the scheme of the low-quality cavity, which does not influence ontothe reproduction of the pump wave front in that of the Stokes component.
3. We have realized - 1 W of the average power at the eye-safe wavelength of1.53 .tm.
4. Generation in the cavity
We have improved the efficiency of the single-mode pump conversion withthe use of the generation in the cavity. The parameters. of the cavity, which are shownin the Fig.4. la, were chosen with the account for the mutual adjustment of the volumeof the zero mode of this cavity and of the focused pumping beam. The Gauss diameterof the zero mode was determined according to the formula [7]:
d0 =2•- JL'(R- L') (3.1)
12

It was equal 0.42 mm. The Gauss diameter of the pumping beam in the crystal whenfocused by the lenses with the focal lengths 41 cm and 30 cm (d0p = (X/Do)F) wasequal to 0.25 and 0.18 mm correspondingly. The diameter at the level 80% of the totalenergy was 0.44 and 0.32 mm correspondingly.
The Gaussian diameter of the cavity mode exceeding that of the pumpingbeam has, seemingly, resulted in the growth of the generation threshold and, maybe,in the better selectivity of the cavity. The coupling mirror reflected the pumpcompletely. According to the results of the paper [8] this also increase in thediscrimination of the second Stokes component generation. When the butt-end edgesof the crystal were orthogonal to the cavity axis we have observed the dual modegeneration. Small tilt of the crystal has resulted in generation of the single mode(Fig.4.2). Fig.4.3 a illustrates the results of measuring of the dependence of theconversion efficiency vs. pump intensity. The maximal efficiency was as high as 55%(accounting for the possibility of the AR coating of the input edge of the crystal).Account for the incomplete transmission of the output mirror indicates the physicallevel of 58.%. Note that no generation of the second Stokes component was observed.
No modification of the generation parameters took place for the pulse-repetitive modes of action (repetition rate - up to 20 Hz).
With the use of the multi-mode pump we have started from the similar schemeof radiation focusing into the volume of the zero mode of the cavity. The mostinteresting was to reveal the possibility to improve the radiation divergence. Theparameters of the cavity we have studied are indicated in the Fig.4. lb.
= 99.5% 41 m 20%
a 15 Cm
= =6%.R2. 3mA"---9-.5 -
~1.32 jmi
R= 20 cm aN32R=0
R,.' []= 99.5 % R 30 20 %
Rr.3r e r 6 % 6R" 1.,2 = 99.5 %
, 5 16 % R, 15 %b 30oc
Fig.1.32 4m1 Th p a t o ti
103XI., w. = 99.6 % RI•. p = 30, 20, 7 %
R -Mirror curvature radius R.2p 13M=9-R,.,,. =] is % R,.,4m [] 15 %
Fig. 4.1 "Me parameters of the cavity for generationwith single-mode pumping (a) and multimode pumping (b).
13

We have used the symmetrical cavity with the concave mirrors. In this caseone has to replace in the formula (3.1) L by L/2 so as to evaluate the mode volume.Neglecting in the long cavity by the cavity length modification due to the refraction inthe crystal we get for the Gaussian diameter of the zero mode the value of 1.54 mm.For the focal length of the focusing lens 41cm the diameter of the beam in the crystal(energy.level 0.8) was equal 1.64 mm.
a b
Fig. 4.2. Far field patterns for generation in the cavity with single- mode pumping.a - tilted crystal; b - parallel crystal.
1, % a b
04 F 41 cm --------------
0.2 'Fus30Ocm 30.20...02
0 .. 1 " mJ 0 160 16 "Ep n
Fig. 4.3. Dependence of the conversion efficiency vs. pump pulse energy for generationin the cavity with single- mode pumping (a) and multy- mode pumping (b).
In the Fig.4.3 b are shown the results of measuring the conversion efficiencyvs. the pumping energy for the different coefficients of the mirror reflectivity. Note,that for the mirror with the reflectivity 7% the threshold is just slightly lower than inthe case of the single-pass SRS when the crystal edges are orthogonal to the opticalaxis (Fig.3.7). The reason is that in the mode of the wave front reproduction theincrement of the Stokes wave amplification twice exceeds the corresponding value forthe waves in the cavity, which are not spatially correlated with the pump [6]. Themaximal efficiency (without the account for the reflection by the input edge of thecrystal) was equal 50%. Hence both variants of the pump reveal approximately oneand the same conversion efficiency, but not the radiation divergence. The Gaussianangle of the zero mode divergence in the described cavity can be calculated accordingto the formula [7]:
14

AO= 2
4 (
It is equal 1.2 mrad. In the Fig.4.4 are shown the results of measuring of the energydistributions in the near (17 cm from the coupling mirror) and far-field zones. Onecan see from these figures that the Stokes radiation contains the core and the widewings. High quality of the core radiation can be seen also from the Fig.4.5. The
a b1.0 - 1.0 t i i I_
Ed -E
E
*-PumP (dos8E =5 mm)
Stokes radiation_ - tilted crystalC03 - parallel crystal
dmm mrad1 1 2 3 4 05
: Gaussian!diffractionlimit level
Fig.4.4. Near field distribution (a) and angular energy distribution (b)for generation in the cavity with multy-mode pumping.
S. ..........~ ~ ~ ~ ~ ~... ....... :i!•iiiiiiiii:::i ...... .
S............... . :• .:;!ii: ......
FilterT=50%
Fig. 4.5. Near (a) and far (b) field patternsfor generation in the cavity with
Filter multy- mode pumping.
T 3

brightness improvement was measured with the higher accuracy in the followingexperiment. At some distance from the coupling mirror we have mounted the aperture(Fig.4.6), cutting off the main part of the radiation wings. The efficiency of theconversion in the presence of such an aperture was 25% (the butt-end edges of thecrystal were not tilted). In such a geometry we have also measured the near and thefar-field energy distributions; the results are shown in the Fig.4.7. The coefficient ofthe brightness improvement k, recalculated for the equal beam diameters according tothe following formula, equaled 5.9:
Here DI is the pumping beam diameter before the focusing lens, Op is thepumping beam divergence for the given diameter, and D, and 0, are the sameparameters of the Stokes radiation in the plane of the measuring lens.
Hence the SRS generation in the cavity makes it possible to improvesignificantly the brightness of the remote object irradiation.
The described cavity differs from the schemes we have described before: itreveals the significant reduce of the efficiency with the growth of the pulse repetition
~10M R=lo m d=3mm
Pump 30cm . 5 .88cm ID0o..= 5 mm
= 2.7 mind
Fig. 4.6 Optical scheme for measuring the brightness improvementfor generation in the cavity with multy-mode pumping.
LIP EdE 10 2.0 d,m E
1.0, 1.0
0.8 --------------------- ,---------------------0.8
0.6, 0.6
Fig. 4.7. Near field and 0.4 0.4
angular energy distributionsfor generation in the cavity 0.2 0.2
with multy-mode pumpingand external spatial filter. ._.. . . . . . . . . . . . .
0.4 0.8 1.2 1.6 20 2.4 ( m , mrad
16

I 1• 2o F. Hz
1.0.
11E p15o0mJ
(18
(16,
.4,Fig. 4.8. Dependence of theconversion efficiency forgeneration in the cavity with 02multy-mode pumpingvs. pump pulse frequency.
. P.W
rate (Fig.4.8). We have found out that the reason is the negative thermal lens, whichmodifies the cavity quality. In the Fist Interim Report we have described the model ofthe thermo-optical distortions in barium nitrate crystal. It was shown that the accountof the relationships between the photoelastic coefficients ((P1.3 -P1.2 )/P1.2 << 1) makesit possible to use the theory, elaborated for the crystals of higher symmetry. Theaverage value of the optical force of the thermal lens for two orthogonal eighen -polarizations is described by the formula [9]:
F = (3.1)PPh
where Ph is the heating power, S is the beam section area, X is the thermal
conductivity coefficient, P = - fn•j1 4, + +2) = -7.9x 10" degree-' - dn4 1-v dT
n is the refraction index, a is the coefficient of linear expansion, v is the Poissoncoefficient and P,1, P12 are the photoelastic coefficients.
One can see from these relationships that the thermal lens reveals the negativeoptical force. This force was measured in the optical scheme, which is shown in theFig.4.9. Diameter of the beam in the crystal was enlarged up to 2.2 mm (0.9E, nearlyflat top distribution) by means of the spherical mirror, replacing one of the flat mirrors
SRl, = 99.5 % (Ba(N0 3 )2 ); 90% (KGW) Rj,puMp = 6 %Sa0.62 Rz = 15 %, 30% (Ba(NO 3)2); 50% (KGW) Rzpump = 99.5 %
X = 1.32 pmn AL=1c j Screen
R 1.43 mn R=10m
SeletiveF =30 cm
mirro R, R2 +3Oc
Absorber
Fig. 4.9. Optical scheme for measuring thermal lens.
17

in the pumping laser cavity. We have measured in the experiment the distance fromthe plain of the auxiliary lens to the center of the focal waist of the He-Ne laserradiation beam. Such measurements were done in the presence of the SRS excitationin the cavity and in its absence. The calculation was done with the use of the lensformula. ((Preliminary - in the absence of SRS - we have measured the radius of theHe-Ne laser beam wave front curvature in the plane of the crystal). For the pulseenergy 115 mJ, pulse repetition rate 20 Hz, efficiency of generation to the first Stokescomponent 50% and to the second one 7% the measured value of the thermal lensfocal distance was equal minus 150 cm.
It was interesting to compare this value of the thermal lens focal length with thevalue, calculated for the deposed thermal power:
Ph = Pp Ilis + T2 2s1 (3.2)
( Vs 2Vss)
Here rils and ilss are the efficiencies of the pump conversion to the first and to thesecond Stokes components and Vs and Vss are the frequencies of these components.
If one uses in the formula (3.1) the value of the thermal losses of 0.24 W and thevalues of some other constants (see Table 2 of the First Interim Report), he willevaluate the focal length of the lens as rather short - equal to minus 35 cm. This is acontradiction with the experimental result. One can use the experimental value of thefocal length for evaluation of the thermooptical constant P. It is thus equal to2.3x10-5 degree-l, while calculated value is 7.9x10⁻⁵ degree-'. This constant iscalculated as the difference between two constants, and is thus rather sensitive to theaccuracy of measuring them. (Let us, for example, assume, that the real value of 03exceeds twice the value, available from the literature, and let us also assume, that thevalue of cc is, vice versa, twice smaller. In this case the calculated value of the Pwould change in an order of magnitude and would be thus 2.5 times smaller than theexperimentally measured.)
We have also tried to measure the thermal lens in the crystal of KGW in thesimilar cavity. Unfortunately, the use of the pulse-repetitive pump has destroyed theAR coating on the butt-ends of the crystal. However, before this damage occurred wehave carried out the series of the preliminary adjustment experiments. In thisexperiments we have, in particular, registered on the photosensitive paper the nearfield distribution. On this basis we can make a statement that for the various pulserepetition rates the near field distribution does not change. In the barium nitrateexperiment under the similar conditions we have observed the noticeable modificationof the near field distribution due to the thermal lens action. Hence, one can state thatin the crystal of KGW the thermooptical constant P is smaller than that in the crystalof the barium nitrate. Worth mentioning that in the crystal of YAG its value is7.7x 10-7 degree", i.e. is smaller more than in order of magnitude [8].
In the First Interim Report we have analyzed the possibility to eliminate for thethermally induced birefringency. It was done experimentally using the optical scheme,shown in the Fig.4.10. The geometrical axis in the crystal was parallel to thecrystallographyc axis [ '10]. Lateral faces were crystallographyc planes {111 l}and{112}. (The angle between axis [100] and lateral face {111} is equal 35'.) In theFig.4.11 are shown the dependencies of the efficiency of the pump conversion to theStokes radiation in the cavity vs. the pump power for the various crystal orientations.For the optimal orientation, when polarization of pump radiation is parallel to
18

L = 10 cm JoulemeterXP . UMP :lo Calcite pi
VBa(NO3)2 -b-R = 1.43 m R=10m
R1,s = 99.5 % R2,s = 15 %.
Joulemeter
Fig. 4.10. Optical scheme for measuring influence of radiation depolarizationon generation efficiency in the cavity.
..11_x
2
0.5-3
1 ~ 2 PPW
Fig. 4.11. Dependence of relative generation efficiency in the cavityvs. mean pump power.
I- pump radiation polarization vector is parallel to axis [100].2- polarization vector is directed under angle 450 to an axis [100].3- separately for Stokes radiation with polarization vector parallel to pump vector.
crystallographic axis [100], the rate of depolarization was negligible, and for theorientation with angle 45' between them the depolarization has reached its maximalvalue, resulting in reduce of the conversion efficiency. The minor depletion of theefficiency, observed for the optimal orientation, results of the thermal lensing (thefocal length of the thermal length at the maximal repetition rate is compatible with thefocal length of the cavity's spherical mirror). So one can say that there was observedthe correlation of the theoretical predictions and of the experimental resultsconcerning the possibility to eliminate for the depolarization.Let us conclude this section by the evaluation of the gain in the KGW crystal. It canbe done on the base of the of the generation threshold values, measured for the KGW
19

100o A,* - total output Raman radiationA ,0 - second Stokes component
Fig. 4.12 Dependence of theconversion efficiency for sogeneration in the cavityvs. pump pulse energy.
1-R2s=15%, Ba(N0 3)2;2-R 2s=30% Ba(N0 3) 2 ;3- R2s=50%, Rls=90%, KGW. 50 100 _,. mJ
crystals; mounted in the same cavity which was used for the thermal lensmeasurements. In the Fig.4.12 are shown the dependencies of the generationefficiency vs. the pump energy; the value of the threshold was determined from theirextrapolation till crossing the abscissa axis. The crystal KGW was mounted in theorientation, where the oscillation with the shift of 770 cm"1 is active. The end surfacesof the KGW crystal were covered by untireflection coating for pump and Stokesradiation. Length of the crystal was 55mm.The gain value was determined with theuse of the formula for the generation threshold (g I- (In (1/RIR 2))/2 I )ut =30; here T isthe pulse duration, u = c/nt, t = (L+ I (n-1))/n/ - the coefficient, accounting for theincomplete fill Of the cavity by the crystal, L is the cavity length and I is the crystallength. This formula accounts for the presence of the over-threshold intensity surplus,which is necessary to overcome the energy threshold [10]. With the use of thisformula and the relation of measured threshold energies for KGW and Ba(NO)2 atfirst was determined the relation of gain values in these crystals. They are equal 2.2and 1.7 accordingly for reflectivities of output mirrors 30 and 15 % for generation inBa(NO) 2. For a value of the gain in KGW it is accepted medial between two valuesobtained with the use gain in Ba(NO) 2 (from section 2) and this two relations. It isequal 3.7x10"cm / MW. Note that at the wavelength of 1.06 ýim the gain in KGWwas twice lower than that in the barium nitrate. According to the results of ourmeasurements the growth of the wavelength did not result in the significant variationof this ratio.
Let us in conclusion enumerate the main results of this Section:1. We have shown that the use of the generation in the cavity can provide the 55% -
conversion efficiency of the single-mode pumping beam to the single-mode beamof the first Stokes component.
2. In the case of the multi-mode pumping the Stokes beam brightness was improvedin approximately six times in comparison with the pumping beam.
3. We have measured the thermal constant, which determines the thermal lens in thebarium nitrate crystal.
4. We have confirmed in the experiment for the wavelength 1.32 ýLm the possibility toeliminate the influence of the depolarization onto the efficiency for the optimalorientation of the barium nitrate crystal.
20

5. Amplification of the diffraction-limited beams in SRS media,pumped by laser beam with a wide angular spectrum
5.1. IntroductionYet in 70-es [11] it was shown that one can amplify the diffraction-limited
beams, preserving their spatial structure, in the SRS-amplifier, pumped by the beam,whose divergence is in one or two orders of magnitude higher than that of theamplified beam. The possibility of such an amplification is explained by two differenttheoretic models, namely by the model of plain waves and by the model of thespeckle-field.
In the model of plain waves [11,12] the possibility to preserve the angulardivergence of the diffraction-limited beam while its amplification is explained by thedumping of the parametric generation of the non-axial Stokes components. Such adumping takes place when the relationship
CRI =2(Fk/ kLOL) «1, (5.1)
is valid. Here F is the local increment of SRS, ks and kL are the wave numbers of theStokes wave and of the pumping wave in the SRS-active medium, and OL is theangular'divergence of the pumping beam.
In the model of the speckle-field [2] this possibility to preserve the diffractionlimited divergence of the amplified beam is explained by the averaging of thepumping field inhomogeneity. Efficient averaging is possible only for the sufficientlysmall-scaled speckle inhomogeneity of the pumping field. The criterion of theefficient averaging looks like:
CR l = 16Viarctg/-LkLOLOD <<I. (5.2)
Here L is the length of the SRS-active medium and 0O is the diffraction limiteddivergence angle.
One can see from the relationships (5.1) and (5.2) that the criteria reveal theirqualitative nature. These two formulae contain different parameters and reveal thedifferent law of dependence upon the pump divergence angle OL. Thus their use forthe evaluation of the pumping beam divergence, for which it is possible to realize thedistortions-lacking amplification of the Stokes beam, results in quite different values.One can see this from the Fig.5. 1, presenting the dependencies of CR1 and CR 2 vs.
0.75 0.75
0 0 . -_ 0 .5 -
0.25 0.25
a 0Lis 24 33 42 51 60 145 230 315 400
eL/e)D e,./e
Fig.5.1. Dependence of the criteria figures of merit vs. angular divergence21

0L/0D. The calculations were carried out for LkL62I/4=9x1O-' and
02/k9)2 =55104 .
So one can see that the requirements to the angular divergence of the pump arequite unclear. That is why it is interesting to carry out the numerical simulation of thediffraction limited beam amplification in the field of the pump with the wide angularspectrum and thus to determine the values of the criteria (5.1) and (5.2) whichcorrespond to the amplification of the Stokes wave without the significant distortionof its wavefront. Especially interesting are such amplification regimes when thecriteria (5.1) and (5.2) are frustrated, but the angular divergence of the pump is stillhigh. Such a situation is usual for the pumping by the solid-state laser emission.
5.2. The model of SRS amplifier: basic equations and relationshipsThe numerical simulation of amplification of the Stokes wave with the
primarily diffraction limited quality in the field of the wide angular spectrum laserbeam was carried out in the stationary two dimensional approximation. It was doneon the base of the following set of equations, which is widely used in the theory ofSRS:
z-2 1s a Es =j•gELEs,
ac i a 2] I kL 2
"-- 2 NL hIEL =--g -L-EsI E,, (5.3)
Eslz=o = Eso, EL IZ=0 = ELO
Here EL, Es are the electric tensions of the pumping and Stokes waves, g is the gain ofSRS, x and z are the transverse and the longitudinal coordinates.
It is well known [11] that the set of equations (5.3) provides the quite adequatedescription of the Stokes wave amplification for the wide range of the SRS-activemedia parameters when the duration of the relaxation process is negligibly short. Forthe condensed media this duration is in the picosecond range [13]. That is why thestationary approximation is applicable for pulse with the nanosecond duration.
One can generalize the calculations by the use of the dimension-lessparameters:
z x Es ELL Xo - I-Here L and 2x, are the length and the width of the SRS-active medium. Io is the so-called normal intensity fluency. Thus the set of equations (5.3) is transformed into:
a i kL a212
Laz4CL ki xC2] 2 (5.4)
ffz ~x22EL ES
22

Here G = gLIo, CL = kL Xo/2L is the parameter, which characterizes the geometry
of the amplifier (it is some analog of the Fresnel number). One can use variousmethods for establishment of the relationship between the dimension values of theStokes and pumping beam intensities at the amplifier input, on the one hand, and thevalue of the normal intensity I0, on the other hand. In the experiment it is most simpleto measure the Stokes and pumping beam intensities, integrated across the beamsection. Hence it is reasonable to use the following equations to establish the saidrelationship between the dimension and dimension-less values:
J'ELO'dx =1, J'lEsodx =q, (5.5)-1 -1
Here q is the coefficient, which determines the relationship between the Stokes beam
power Pso and the pumping beam power PLO at the amplifier input (q = Pso /PLO).The goal of the calculations was to analyze the process of the SRS-
amplification for the various configurations and positions of the pumping beam withrespect to the Stokes beam. We have, in particular, analyzed the situation, when thethe pumping wave is tilted with respect to the Stokes wave in some angle 0 (withfocusing of the pumping radiation and without; see Fig.5.2).
M MZ
/, ': RKS SRS-Sain -onW~
L
KL KL
Fig. 5.2. Geometry of the pumping waveinteraction with the Stokes wave in the
KL SRS-amplifier
In the calculations the Stokes wave Eso was described by the real hyper-Gaussfunction, and the pumping wave ELO was described by the superposition of the finitenumber NH of the Gauss-Hermit modes, whose random phases and amplitudes aredistributed according to the definite law. Such a description of Eso and ELO is quiteadequate to the experimental situation, because it describes the diffraction-limitedbeams and the beams with the wide angular spectrum, generated in the solid-statelaser with the stable cavity [9]. Hence, Eso and ELO look like:
23

0 =:[x0 m2"1/2m ] Yxp_ Oip[ x 2m],(.Es°- 4 rs roI/ 2 )J r. X J (5.6)
ELO = eXP[i{CR(x - h- kLxoox}la.l exp(icgn)T. 2(x -hn-0 Ir
Here F(y) is the Gamma-function, m is the integer value, which describes the shape ofthe hyper-Gauss function, 0 is the angle between the Stokes and the pumping beams,,h=L0/2x0 , CR = kL 0 /2R, R is the curvature radius of the wavefront, a, are thereal amplitudes, which are proportional to the function exp[-y(n-nm) 2], r6 is thenumber- of the mode with the largest amplitude, y>O is the parameter, whichdetermines the variation of the amplitudes a,, (Pn are the random phases, which areuniformly distributed across the range [0, 27t], rs and rL are the characteristic sizes(see further), and 'P are the normal Gauss-Hermit modes, described by the formula:
Here Hn are Hermit polynoms: H,(x) = 2xH0.1(x) - 2(n-1)Hn. 2(x), H0 = 1, H1 = 2x.One can see from the formula (5.6) that in the case, when the pumping beam is
tilted with respect to the Stokes beam or when it is focused (0, 1/R # 0), the pumpingfield distribution contains the terms, which reveal strong oscillations. One can see thatin the cases of practical interest the number of oscillations across the range x( [-1,1]can be as high as several hundreds. These oscillations to a large extent tantalize thenumerical solution of the set of equations (5.4). That is why it is reasonable todescribe the field EL(X,z) as a product of the slowly oscillating function UL(x.z) and ofthe fast oscillating function:
EL (x,z) = UL (x, z) exp[iFL (x,z)]. (5.7)
According to the estimations, one can replace the function FL(x,z) by somephase factor, which is one and the same for all the Gauss-Hermit modes. It isproduced while the free-space propagation of the pumping beam ELO. On the base ofthe Guigence-Fresnel principle and of the well-known relationships for the Hermitpolynoms [14] one can outline the following relationship for the function FL(X,Z):
FL (x,z) = CL[ca(x +2hz- h) 2 - 4h(x + hz)], (5.8)
z+CR(zCR + CL)(rL/Xo) 4
Here a= zz2 +(zCR +CL) 2 (rL/XO) 4
With the help of the relationships (5.7) and (5.8) one can transform the set ofequations (5.4) to:
24

E i kL 92 1 1S4C ks OA -- IL2 EsL 2(5.9)
-- {2h-ct(x+2hz-h)}- - .£dc 4CLt &2 U
=-[l-G G ES 2 +c- iC,(a' -P)(x +2hz -h)2]UL,L2 k, 2
S1+CI(rL/Xo)4
Here = z2 +(zCR +CL) 2(rL/Xo) 4 .
The characteristic size rs, which determines the size of the zone, containingthe main part of the Stokes wave field, and the characteristic size rL, which determinesthe scale of the amplitude distribution inhomogeneity, were determined from therequirement of the small amplitude of the fields at x = ±1. The width of the zone ofthe SRS-active medium is to be limited by the finite range. Out of this range theintensities of the Stokes and of the pumping waves are to be negligible. From thecorresponding estimations it is clear, that it will be provided if the relative values ofthe Stokes and of the pumping waves intensities were not more than 10-3 of themaximal value for x = ±1. The Table 5.1 summarizes the relationships for thedetermining of the characteristic sizes rs and rL, which were determined with theaccount for the above-said requirement and for the diffraction spreading out of thebeams. The parameter p>1 determines the size of the minimal region xin(xmin = 2x/p); outside this region the amplitude of the wave field is not more than 10-3of its maximal value. In the case of the beam focusing (see Fig.5.2) the parameter pdescribes the curvature radius of the wavefront R according to the followingformulae:
CR =-CL L 0C.-X/r4 R >0,
Ck CL± +c / /rL, R<0
According to a rather simple analysis the range of values of the coefficient p, forwhich the minimal size of the zone of the pumping field concentration while itsfocusing Xmin is laced in the plane z =0 or z = 1, is limited. In particular, for
/rLC2 << 1 the said values of the coefficient p are to fill into the interval:
0+O/2rL4C' <p<rLCL/Xo2
Table 5.1
o p[d, -_,m=1, d, =C/61nlO p[3Mn>1011, e>1, CL >>1
CR 0 >0 <0
XOdrL. d d -,]Y PCL/JIdY CL/,1iJ7
NH 0 >0d2 c(LO h h)/61ni I021- ,(I -h)/(0,863j, + 2,087f]
2
25

In course of the solution of the system of equations (5.9) the range of thecontinuous variation of the argument x was replaced by the discrete set of the pointswith the coordinate:
x"=-4+(n-1)5, n=1,2 .... N, 8=2/(N-1).Correspondingly, the functions Es and UL were discretized on the variable xaccording to the relationships Es, = Es(xn,z), UL, = UL(X.,z), and their derivatives onx were replaced by the differential equations according to the well-known formulae[15]:
,6W(x,,,z) 1
e92W(x",Z) 11(6&2 -- (W.+ - 2W, + w.), (5.10)
n = 2,3 ....... N-1.
According to the results of investigations, for x = ± 1, it is reasonable to use for thederivatives on x not the relationships (5.10), but the more complicated differentialrelationships:
65w(-1, z) 1-- 1(10W -15W 2 +6W3-W4),66
05W (1,z) = (lOrv - 15 Wv -, + 61- ---- iw -IW.l+ N 2 -WN)
d - -(1"01 2 7 WN +21W -SWN 3))I&2 62( W -27,_+ 'K2 - 5J-3)
As a result, the system of the equations in the partial derivatives (5.9)transforms into the system of the usual differential equations. Accounting for thecomplexity of the functions Es and UL, this set consists of 4N equations. This systemwas solved with the use of the standard codes from the Fortran-77 library. The valueof N was chosen to be N=226, which is determined by the available software.According to the results of test solutions, such a quantity is sufficient to describewithout significant distortions the beams, containing up to 30..50 modes for p•5(1,5- 2 )and for h _ (0,1-0,2).
5.3. Results of calculations and discussionThe goal of the calculations was to determine the influence of the pumping
wave field structure onto the spatial structure of the Stokes wave, and, in particular,onto its angular divergence and direction. With this purpose we have varied across thewide range the amplitude and the phase distribution of the pumping wave at the inputof the amplifier, of the SRS gain, and of the relationship between the intensities of theStokes and the pumping waves for various geometry of their interaction in the SRS-active medium. Our situations differs from that in the paper [16]. In the said paperthere was numerically simulated the experiment with the XeCl eximer laser radiationand its SRS in hydrogen. We have simulated the experiment with the solid-state laserradiation and its SRS in the solid-state medium. Usually the angular divergence of
26

such a laser beam, used for the pumping purposes, equals to several dozens of thediffraction limits. That is why it was very interesting to investigate the dependence ofthe spatial distribution of the amplified Stokes beam upon the pumping beam qualitywithout application of any special means of the forced control over the spatialcoherence of this radiation (produced, for instance, by the aberrant).
Our studies have revealed the following main features:* The most efficient approach to the Stokes beam angular distribution improvement
is tilt of the pumping beam. If the angular divergence of the pumping beam OLO(OLO is the angle, containing 80% of pumping beam power at the amplifier input)equals several dozen diffraction limits, already for O•-(1- 3 )OLO the angulardivergence of the amplified Stokes beam is nearly diffraction limited, and itsintensity distribution is rather smooth. The reduce of the pumping beamdivergence is accompanied by the growth of the ratio 0 /0 LO for which oneobserves the significant reduce of the Stokes beam divergence. We are to note,however, that for the pumping beam divergence of several diffraction limits theaggravation of the Stokes beam divergence is not strong, while the improvementof the Stokes beam distribution, caused by the pumping beam tilt, is small.
"* In the case of the collinear propagation of the Stokes and pumping beam throughthe amplifier and of the angular divergence of the pumping beam of several dozendiffraction limits, only some 50..60% of the amplified Stokes radiation fills intothe angle of (1-2)08o (here 0so is the angle, containing 80% of the Stokes beampower at the amplifier input). All other power is emitted to the wide wings.Further enlargement of the pump divergence up to 100.. 120 diffraction limitsresults in the reduce of the power, emitted to these wings.
"* Seemingly, the criterion CR1 is valid only for the case of the pumping beam tiltwith respect to the Stokes beam. In this case one has to replace in the formula(5.1) the angle 0 L by the angle 0 (however, this situation corresponds to theprimary sense of the said criterion [12]).
"* The criterion CR 2, seemingly, becomes valid for the very large (exceeding onehundred of diffraction limits) angular divergence of the pumping beam. For thesmaller divergence of the pumping beam the value of this criterion does notcorrelate with the variation of the Stokes beam divergence.
Said features are illustrated by the following Figures. In the Fig.5.3 is shownfor an example four variants of the primary distributions of the pumping beamintensity in the transverse direction and of the corresponding angular divergencies. Inthe first and in the second variants the pumping beam consisted of odd Gauss-Hermitmodes (NH 29). In the second variant the beam was also focused (the value of theparameter p = 1,2). In the variants 3 and 4 the pumping beam consisted of both oddand even modes (NH = 50 Hi 8). The angular distributions are presented as thefunctions of the current angle OR ratio to the angle Oix, which contains 80% of thediffraction-limited Gauss beam. Its amplitude at x = ±1 equals 10-3 of the maximalvalue. One can see in the same Figure the distributions of the Stokes beam intensity,described by the hyper-Gauss function at m = 1 and 5.
27

0. -2 0.8
10.8
A.00.6
0.4 C-0.
E20.4
-1. 0.2 05 . 0.0 . . . . . . . . . . .
X/G0 10 20 30
1. 2 1.0 -2
A. 0.
90.4.
0 .2 60.2
0.0
0S.4 20.4
S0.2 0.4
0202
0.0 i-1.0 -0.5 0.0 0.5 1.0 0.0 ....
:i i.0 - /o1.0 3 5 O/ D 04
04
j 0.80.
00.60.
0.40.
:r 0 20:
JO. 20.4
0.0.
-1.0 -0.5 0.0 0.5 1.0 0.0 . . . . . . . . . . . .X/Xo 0 123 4 56a 1
0.88

In the Fig.5.4 are shown the results of studying of the dependence of theamplified Stokes beam divergence Os (Os is the angle, containing 80% of the power ofthe amplified Stokes beam) vs. the angle 0. The curves 1, 2 and 4 in the Fig.5.4correspond to the variant 1, the curve 3 corresponds to the variant 2 (R>O, thediverging pumping beam), the curve 5 - to the variant 3 and the curve 6 - to thevariant 4 of the primary distributions of the pumping beam field (see Fig.5.3). Otherconventions are described in the caption for the Fig.5.4. The calculations were carriedout for CL = 1000, q = 0.01, kL/ks = 1.1 and variation of h from 0 to 0.1. The criterionCRi was calculated according to the formula (5.1), where the angle OL was replacedby the angle 0, and the local SRS increment F was determined from the gain Gaccording to the relationship F = GAL. In the Figures 5.5-5.10 are shown thedistributions of the intensity, phase and angular distributions of the amplified Stokesbeam for h 0 and 0.1, corresponding to the curves 1-6.
5 5
o "
O -- - - -/-I(
2
.3
-............. .............. 0.0001 0.01 1 1000.0i' 0.8. . . . 1/cR1 (o)
Fig. 5.4. Variation of the angular divergence of the amplified Stokes beamwith the pumping beam tilting:
G =4 (2) and 6(1, 3,4, 5,6), m =1 (4) and 5(1, 2, 3,5, 6).
29

U b
0.0 0.00.2. 0.6
-- I.0 -a.s 0,0 06 -1I1000 O. .X/Xo X/Xo
1.0 b,
o S
in0.4 O.4 ^ .A A A
"02 0..
24 4
0.2 0.2
-1.000
X/Xo X/Xo
..0 b5
6..0.6 - .
o, or0.20.4
* 416
g -. 2 0.4
-0 .2
0. 0.2
X/Xo X/X
rn0.0 .. . . . . . ,.. . . . . . . . . . . . . .0 30 b0 ;D O. .
OR/Oso .4 2.0 ',OIO.0',J
Fig.5.5. Distributions of the intensity, phase and angular distribution of the amplifiedStokes beam, corresponding to the curve I of Fig. 5.4 for O/OLO = 0 (a) and 3.46 (b) .
30

.0 10
0.62 0.0.0 A0
002
-. 0 , 0.
- 0 .- 0,.3 -4..3. 1.0. .0 .
X/Xo X/Xo
1.0 1-0
8 b
0.5 - M4
-0.Q2 0.
MO M0
A A
-0.6 0.50. 00 . 7. .
X/X
Fig. 5.6. Distributions of the intensity, phase and angular distribution of theamplified Stokes beam, corresponding to the curve 2 of Fig.5.4
for 010t~o =0 (a) and 3.46 (b).
31

1.0 1.0b
60.8
4A 0.4
0.4 0.
-0.2 60.2
0.0. 0.0.-I.0 -0.5 0.0 0.5 IAJ -I,0 -0.0 0.0 0.5 1,0
X/Xo X/Xo
7A I b
O4 0
.0.2
0.6
Ut
-0.,
-1.0 060 1. -1.0 -.as 0.0 0.5 1.
X/Xo X/Xo3.0 .
b
0.6 - Oh
0. 0'
& 0.2 w0.6
0.4 0. ...... .., 0.0 . ......0 16 32 4,.. 'is ....... ,.o 0o o O/so
Fig. 5.7. Distributions of the intensity, phase and angular distribution of the amplifiedStokes beam, corresponding to the curve 3 of Fig.5.4 for 0/eLO 0 (a) and 1.15 (b).
32

b
20.
*0.4 0.4
0.02
-1.0 -0. 00 0.5 1.0 1.0 -0. 00 0.0 1.0X/Xo X/Xo
1.00.S b
0.4
6 -0.2
S-0.2
0.6 0. 0.00 O
X/Xo X/Xo
1.0 1b
0aa &4
o~OA4 . .... .. ... L 460./ '0
Stksbacrepndn-otecre4o Fi..4fo L=0(aan3.6b)
U3

A 0.4 0.4,
0.20.
A.0 1.0 .
X/Xo X/XoOA 0.4 60
"0-0 '0.4
-1.2 0.2
-I. -0 0.0 0.5 1.0 -1.0 -04 0.0 0.5 1.X/Xo X/Xo
2.3 1.0 h
0.6 0.6
..0.4*0.2 0
0.2
.0 Is bQ,,O,
Fig. 5.9. Distributions of the intensity, phase and angular distribution of the amplified Stokesbeam, corresponding to the curve 5 of Fig.5.4 for O/OLo = 0 (a) and 2.36 (b).
34

1.0 1.0 "
0.8 0.8
066
00., / 0.,
IDo2 0 j2
0.0........ k.... 0.0,,- 1.0 -0.5 0.0 0.5 1.0 - 1.0 -0.5 0.0 0.5 1.0
X/Xo X/Xo
1 .0 a1.0b
0.8 .0.8
* "a S
0. *0.4
O 00.4a
0.2 0.2
-0.0 -0.0
-0.2 1 . . .... ,0. 1.. . . .. . . . I.. . . .. . . . . . . ....... .. -0.-1.0 -0.5 0.0 0.5 1.0 -1.0 -0.5 0.0 0.5 1.0
X/Xo X/Xo
1.0o 1.0 b
a b
0.8 0.8
,0.6 -,0.6
0.4 6 0.4
0.4
0 4 .12 0.0 ......2...........
-0.03 -0.04
Fig..5.10. Distributions of the intensity, phase and angular distribution of the amplifiedStokes beam, corresponding to the curve 6 of Fig.5.4 for LO = 0 (a) and 11.74 (b).
The presented data obviously evidence that the amplified Stokes beam spatialstructure varies in a similar way for a wide range of the amplifier and pumping beamparameters. One can see from the given curves that when 0 = 0 even for the pumpingbeam divergence of several dozens of diffraction limits 50-60% of the Stokesradiation power at the amplifier output Ps contains in 1.5-3 diffraction limited angles
(see Fig.5. 11). Pumping beam tilt results first of all in dumping of the wings in theangular distribution of the Stokes radiation. Such an evolution of the Stokes beamdivergence quite corresponds to the theory of the parametric mechanism of generation
35
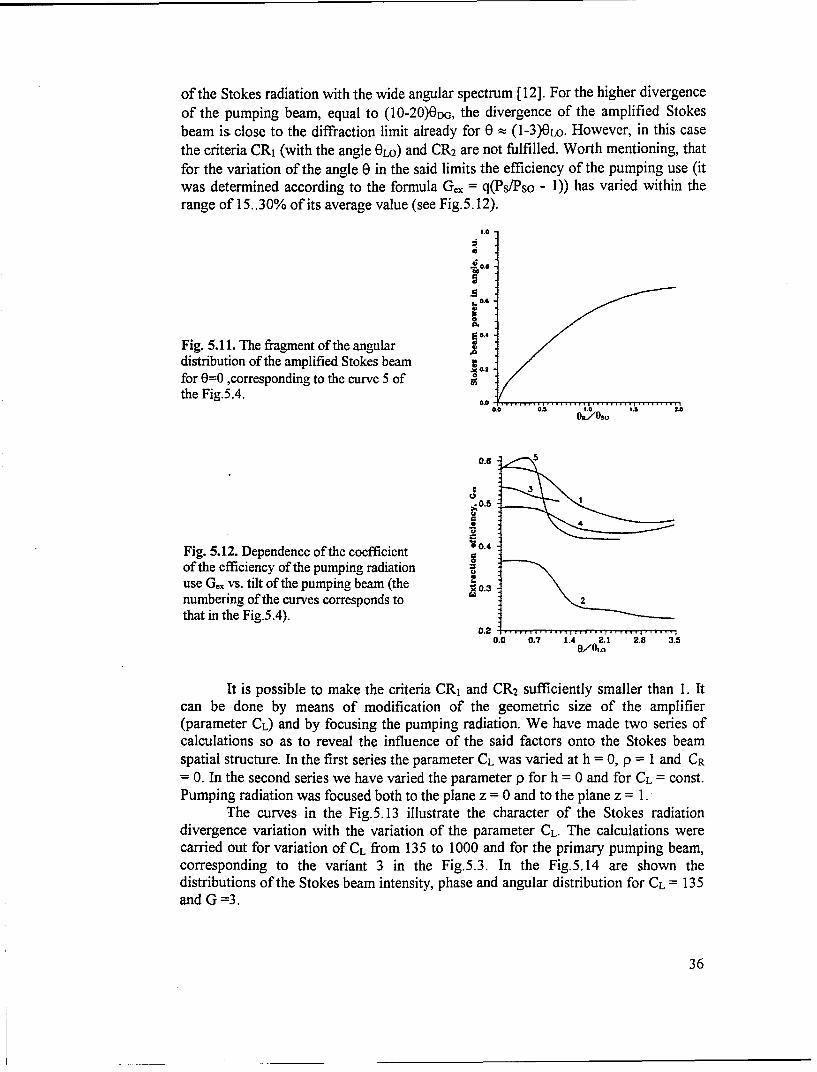
of the Stokes radiation with the wide angular spectrum [12]. For the higher divergenceof the pumping beam, equal to (10-20)ODG, the divergence of the amplified Stokesbeam is. close to the diffraction limit already for 0 - (1-3)OLO. However, in this casethe criteria CRI (with the angle OLO) and CR 2 are not fulfilled. Worth mentioning, thatfor the variation of the angle 0 in the said limits the efficiency of the pumping use (itwas determined according to the formula Ge, = q(Ps/Pso - 1)) has varied within therange of 15..30% of its average value (see Fig.5.12).
t.0
Fig. 5.11. The fragment of the angular .distribution of the amplified Stokes beam ••for 0=0 ,corresponding to the curve 5 of .
a)
the Fig.5.4. *
0.6 5
A0.5
U
.04
Fig. 5.12. Dependence of the coefficient0.
0 S0.4
of the efficiency of the pumping radiationuse G,i vs. tilt of the pumping beam (the beanumbering of the curves orresponds tothe Fig.4th . 0ig.5.4)
0 .6 0.7 1.4 ?.1 2.8 3.5
It is possible to make the criteria CRI and CR2 sufficiently smaller than 1. Itcan be done by means of modification of the geometric size of the amplifier(parameter CL) and by focusing the pumping radiation. We have made two series ofcalculations so as to reveal the influence of the said factors onto the Stokes beamspatial structure. In the first series the parameter CL was varied at h = 0, p = I and CR
= 0. In the second series we have varied the parameter p9 for h = 0 and for CL = const.Pumping radiation was focused both to the plane z = 0 and to the plane z = 1.
FThe curves in the Fig.5.13 illustrate the character of the Stokes radiationdivergence variation with the variation of the parameter CL. The calculations werecareed out for variation Of CL from 135 to 1000 and for the primary pumping beam,corresponding to the variant 3 in the Fig.5.3. In the Fig.5.14 are shown thedistributions of the Stokes beam intensity, phase and angular distribution for CL = 135
and G =3.
36

4-4 4"h
,o 0
Tý0 0.12
* * 2
2
100 0L 1 10 1/cRiOO 1000
C,
aC
Fig. 5.13. Variation of the Stokes •1o
beam divergence with the variation 2
of the amplifier's geometry size forG 6 (1) and 3 (2).
0.1 1/CRII
LO • 3.2 -
2.4
30.2
22 -6.S
M 37
0.4-0*.
0,2
X/Xa
3*
i,0.S--
Fig. 5.14. Amplified Stokes beam intensity, 20.4
phase and angular distributions,corresponding to the curve 2 in the Fig.5. 13. • .,
0,3/0so
37

For the pumping beam focusing case the Stokes beam divergence reveals thesame character of variation. Noteworthy, that the angular divergence of theconverging beam is better than that of the diverging. Probably, this feature can beexplained by the difference in the value of the local increment of SRS. Modificationof the angular divergence of the Stokes beam with the pumping beam focusing isillustrated by the Fig.5.15. The calculations were carried out for CL=1000 and for thepumping beam, corresponding to the variant 3 in the Fig.5.3. The curve 1 wascalculated for the diverging pumping beam (R>0), while the curves 2-4 - for theconverging beams (R<0). The curves 1-3 were calculated for the Stokes beam,described by the hyper-Gauss function for m=5, while the curve 4 corresponds to theGauss beam. In the Fig.5.16 are shown the intensity, phase and angular distributionsof the Stokes beam for p = 1.5 and G =3. The angular divergence of the pumpingbeam was equal 1200DG.
*, 4.
a b
1.0 i.' . 1.3 1.4 1.5 1 100 2 000S I/CR
C S C
Fig. 5.15. Variation of the amplified % 2
Stokes =:'beam divergence with the pumping beam ' ,focusing for G 6 (1, 2, 4) and 3 (3).
0.1 1 10I/CR2
38

1.2r
6 0.,
0.?
M e 0.21
'0.45%6
0.2
00 -0.0-2.0 -0.5 0.0 0.5 2.0o 05 0. . .
X/Xo X/XoX/1.0
Ra;
- 0.8
Fig. 5.16. Amplified Stokes beam intensity,phase and angular distributions, 0.4
corresponding to the curve 3 in the Fig.5.15.Ag 0.2
One can see from the Figures 13b,c and 15b,c that the angular divergence ofthe Stokes beam at the amplifier output reduces down to 1.5-2 diffraction limitedangles if CRI<(10"4-10"3) and CR 2<(0.2-0.1). However, worth mentioning that thevalues of the criteria CR1 and CR 2, for which the increase of the angular divergence ofthe beam via their amplification is insufficient, to a large extent depend on thegeometry of the beams' interaction geometry. That is why it rather difficult to usethese criteria in practice.
One can make the following conclusion of the presented results. Seemingly,the models of the plain waves and the model of the speckle-field, adequately describethe regime of the amplification in the field of the high divergent pumping wave of theStokes wave without significant aggravation of its divergence when the divergence ofthe divergence of the pumping wave exceeds that of the Stokes wave in severalhundred time.
39

Worth mentioning that the angular divergence of the Stokes wave stronglydepends not only upon the considered factors, but also upon the ratio of its startingpower to that of the pump. In the Fig.5.17 is shown for example the dependence of theStokes beam divergence vs. the ratio q=Pso/PLo. The calculations were carried out forCL = 1000, h = 0 and CR = 0. The curves 1 and 2 correspond to the variant 1 in theFig.5.3, and the curve 3 - to the variant 3 of the pump. The curves 1 and 3 werecalculated for the case of the Stokes beam, described by the hyper-Gauss function form=5, and the curve 2 corresponds to the Gauss beam. In the same Figure are shownthe dependencies of the power gain Gs (Gs = Ps/Pso) of the Stokes beam and of theefficiency of the pumping radiation use G,, vs. the parameter q for its variation from0.001 to 1. In the Fig.5.18 are shown the intensity, phase and angular distributions ofthe amplified Stokes beam, corresponding to the case of the minimal divergence.
00
e,,
0.001 0.01 0.1 0.001 0.01 0.1Pin /Pln P0 /PL
1.0
10.8
Fig. 5.17. Dependence of the angulardivergence, of the Stokes beam amplification 00 4
Gs and of the coefficient of the pump useefficiency Ge, vs. the ratio PSO/PLO for G = 6 90.2
(1, 2) and 3 (3).
0.001 0.01 0.1Po /PLO
40

OA
OA.0i
0.4 O0.4
.20.6
X/XO X/Xo
~oa1 A a
no.o5,
Fig. 5.18. Amplified Stokes beam intensity, jphase and angular distributions for ,Pso/PLO=0. 1, corresponding to the curve 2 -2in the Fig.5.175
OR/030
The given data indicates that under some specific conditions (say, the choiceof the Stokes beam intensity profile) the amplification of the Stokes beam withoutsignificant deterioration of its angular divergence can be realized under the relativelylow (some 10%) of the Stokes beam power to that of the pumping beam.
ConclusionWe can summarize as follows the main results of the numerical studies of the
diffraction limited Stokes beams in the field of pumping by the beams with the wideangular spectrum:"• In the case, when the divergence of the pumping beam equals several dozen of the
diffraction limited angles, the Stokes beam divergence can be efficiently improvedby means of tilting the pumping beam. If this tilt is equal to some 1-3 angles of theS~pumping beam divergence, the amplified Stokes beam reveals nearly diffractionlimited divergence, and its intensity distribution is efficiently smoothed.
"• Seemingly, the models of the plain waves and of the speckle-field adequatelydescribe the regime of amplification in the field of the pumping wave with thewide, angular spectrum of the collinear Stokes wave without significantdeterioration of its angular divergence in the case, when the angular divergence ofthe pump exceeds diffraction limit in several hundred times.
41

5.4. Experimental study of amplificationThe experimental studies of the amplification were carried out with the use of
the multi-mode laser, which was described in the Second Interim Report, and of thedual stage amplifier. (In this amplifier we have used the stages, which were createdfor the single-mode laser, where the rods were replaced by rods of a larger diameter).The half of the laser energy was sent by a beam splitter for the SRS-generatorpumping, and the residual part was amplified in the laser amplifier and then used forthe SRS amplifier pumping. SRS generation was realized with the use of the schemeof the pumping radiation into the volume of the zero mode with the consequentselection by the remote diaphragm, which was discussed in the Section 4. We havestudied the amplification in collinear and in the quasi-collinear schemes. In theFig.5.19 is shown the optical scheme, which was used for the amplifier studies. Themaximum energy of the amplifier pumping was equal to either 108 mJ (divergence of12 diffraction limits, produced by the cavity with the plain mirrors) or 80 mJ(divergence 22 diffraction limits, produced by the cavity, where one of the mirrorswas concave). For both divergencies the diameter of the pumping beam in the crystalequaled 1.6 mm (the reason was approximately double difference of the beamdiameters in the plane of the focusing lens). At the input of the SRS-amplifier crystalthe energy of the Stokes beam with the near diffraction limited divergence was equal9 mJ for lower pump divergence and 7 mJ for higher one. For the said parameters themaximal efficiency of the amplifier equaled 40% for lower pumping divergence.Similar to the calculations, the amplifier efficiency was determined as the ratio of thedifference of the output and input Stokes signals to the energy of the wave, pumpingthe amplifier. No nonlinear absorption took place. Note that measured value was lessthan that obtained in the Section 5.1.3. The reason is that there was simulated thestationary process without account for the temporal overlap of the pulses. The pulseshapes of a output signal and passed without conversion pump are shown in the
Joulemeter RMSM2
F1 = 66 cm4 M, Ba(NO F2= 41 cm
F4 0 M2 F3= 100 cmX 1=2P 4= 66 cm
=..2 M= Selective mirrorS1 R =50 crn
IF,
F.•-' 2 r aa(NO3)2u
Fig. 5.19. Optical scheme for the amplifier studies.
42

Fig.5.20. The higher efficiency was observed in the two-pass pumping scheme, whichwas realized by means of relay of the pumping beam back to the crystal with the useof the spherical mirror (see the Fig.5.19). In the Fig.5.21 is shown the dependence ofthe amplifier efficiency in the collinear amplification geometry vs. the pumpingenergy. As seen from figure it reveals the same character as all the previousdependencies of the efficiency vs. the pump, because the amplification from thespontaneous noise measured in previous sections the similar saturated process.
.... .. . rift
' .. . .... . . . . . .... . " '" " " " ' " '" : " ' " " .... '....
fm D t lb is"..I.i
Fig. 5.20. The pulse shapes of passed without conversion pump (a) and the output signal (b).
rl, %"
40-
30,
20.
Fig. 5.21.The dependence of the amplifierefficiency in the collinear amplification 10.geometry vs. the pumping energy.
g0o .... 00 E ml
Measurements of the weaker signal amplification were done with the energy ofthe pumping pulse less than the maximal value pointed out above. The reason is that,because the measurement of the weak wave amplification gain in the collinear schemeis impeded by the self-excitation of the amplifier. For the maximal pumping energy of108 mJ the self-excitation resulted in generation of the Stokes radiation with theefficiency of 5-10% in the direction of the pump.
We can now calculate the value of the increment for the pumping intensity,average across the beam section. For pulse duration equaled 25 ns, beam diameterequaled 1.6mm and the gain equaled 0.0071 cm/MW, we can evaluate the saidincrement as ; 9. It is much smaller than the value of the threshold increment, whichwas given in the first Section. This contradiction can be explained in the followingway. Nevertheless the butt-ends of the crystal are tilted, for the large diameter of thebeam in the crystal there occurs some scattering, which provides the feedback.Another reason is that (as we have said already) the increment of the spontaneous.
43

k
40- 104
Fig. 5.22. The dependencies for the 30 103collinear geometry of the gain and ofthe amplifier efficiency vs. ratio of thesignal energy to the pump energy 20- 10
equaled 86 mJ.10- 10
1 0 I02 1 '03 104 10 b 'L;Eq, imut
noise, which correlates with the pump, is twice as high. The dependencies of the gainand of amplifier efficiency vs. ratio of the signal energy to the pumping energy for thecollinear geometry are shown in the Fig.5.22. We have observed the maximal gain of5.6x 103 for the conversion efficiency of 10% and the pump energy of 86 mJ, i.e. itcorresponds (with neglection of saturation) to the increment of 8.63. This valueexceeds the value of 7.3 which was evaluated from the calculation for such pumpenergy with the account for the gain, measured in the first Section and for the saidbeam diameter. Seemingly, in this case we once again observe the enlargement of theamplification coefficient due to the realization of the regime of the reproduction of thepump wavefront in the amplified Stokes radiation as it can be seen from the followingresults.
In the Figures 5.23 and 5.24 are shown the results of measuring of thedivergence in the collinear and quasi-collinear schemes for the various values of the
I1 2 1 - 1 2 3Eq, 1 Ecp - 4
0.5- 0.5-
3 6 9 12 15_0. 3 6 9_0.
Od OdFig. 5.23. The divergence of Stokes Fig. 5.24. The divergence of Stokes beams for
beams for the collinear amplification the quasi-collinear amplification scheme withscheme. the angle in the crystal between Stokes beam
1-input Stokes beam; and pumping beam 0=20 L (OL/JD = 12 )and for2-0 L'0 D =12, Esimp-- 9 mJ ,EL=86mJ(A); the collinear amplification scheme(0 = 0) with
OL/OD= 22, Es.ki=7 nJ, EL=8OmJ (0) the same eL,3-OL 0 D =12, EL=86 mJ, Esj,,pt=2,5 nd; 1- input Stokes beam; 2,3 -0 =20 L, 4,5 - 0 =0;
signal amplification K=2 (2,4) and 2,7-(3,5).
44

gain and of the pump divergence as well as for the different values of input signalvalues. In the quasi-collinear mode of interaction beams crossed in the centre of thecrystal at the angle equaled 20 L (here OL - pump divergence in the crystal). One cansee from the Fig.5.22 that in the case of the collinear geometry of interaction thespatial structure of radiation contains the nearly diffraction limited core and the widewings. Just in agreement with the calculations the increase of the pump divergencefrom 12 to 22 diffraction limits is not accompanied by variation of the amplifiedsignal divergence - notwithstanding the fulfillment in the experiment of the inequalityof the plain waves criterion in nearly two orders of magnitude.
The reduce of the input signal energy under the constant pumping results in thereduce of the relative energy of the core, accompanied by the minor reduce of theenergy, going to the maximal angle (due to the crossing of the curves 2 and 3 in theFig.5.24); its shape becomes closer to the shape of the pump divergence contour. Thisis an evidence of the absence of the core while amplification of the weak signal, whilethe signal divergence becomes equal to that of the pump. Hence for weak signal theamplification is carried out in the mode of the wavefront reproduction.
For the equal gain (increment), the quasi-collinear amplification scheme revealsmuch smaller part of the energy, going to the wings, than it takes place in the collinearscheme (see curves 3 and 5 in the Fig.5.24 which represent equaled amplification),
The reduce of the pump intensity (the reduce of the gain) results in the increaseof the relative energy in the core for both geometries of the amplification.
The important practical conclusion is that it is reasonable to use the quasi-collinear amplification geometry so as to improve the output divergence. The use ofthis method results, of course, in the reduce of the amplifier efficiency for the samepumping energy. The practical scheme, shown in the Fig.5.25, probably will improvethe amplifier performance, because it provides for the averaging during theamplification and for the spatial overlapping of the interacting beams (one has toprevent, of course, the self-excitation of the amplifier).
Fig. 5.25. Scheme for amplification.
All the described results qualitatively confirm the conclusions, drawn out fromthe numerical simulation. Let us once again enumerate the conclusions, which areconfirmed by both theory and experiment:1. Presence of the diffraction-limited core and of the wide wings in the single mode
beam, amplified in the multi-mode pumping field.2. Increase of the relative energy in the core with the growth of the input signal
energy under the constant pumping level.3. Significant reduce of the relative energy of the wings in the case of the quasi-
collinear pumping when the angle exceeds in 1.3 times the divergence of the pump.
45

6. Main results
Let us in conclusion enumerate the main results of the work:
1. We have measured the gain and the constant, responsible for the thermal lens, inthe crystal of barium nitrate.
2. We have established that in the focused beam the generation reveals the feature ofthe wavefront repetition up to the achievement of the saturation. Hence the Stokesbeam divergence is close to that of the pump.
3. For the focused beam the efficiency of the first Stokes component generation islimited by the excitation of the second component. For the case of the focusedsingle-mode beam it is higher than that for the multi-mode beam (35 and 27%correspondingly) due to the higher diffraction losses during the second Stokescomponent generation. In the scheme with the low quality cavity the efficiency ofthe first Stokes component generation with the wavefront repetition can beimproved up to 41%.
4. We have realized in the experiment the 55% efficiency of generation of the single-mode first Stokes component, the six-times growth of the Stokes beam brightnesswith respect to that of the pump, generation in the focused beam of 1 W of theaverage power and the Stokes signal gain (amplification) of 5.6x 10³.
5. We have shown in the experiment that during the generation in the cavity it ispossible to eliminate the influence of the depolarization onto the efficiency byusing of the proper optimal orientation of the barium nitrate crystal.
6. We have theoretically and experimentally established the following. For thecollinear amplification of the single-mode beam in the field of the multi-modepump with the divergence of 10-20 diffraction limits and for the energy of theinput signal of - 0.1 of the saturated pump energy, the structure of the amplifiedradiation contains the nearly diffraction-limited core, which containsapproximately one half of the total energy, and the wide wings. Tilt of the pumpingbeam in the angle, exceeding its divergence, results in significant improvement ofthe amplified signal divergence.
46

References
1. William K. Bischel , Marc J. Dyer . Wave length dependence of the absoluteRaman gain coefficient for the Q(1) transition in H 21. J. Of the Optical Society ofAmerica B. Optical Physics. 1986, v.3, #5, p.6 7 7-6 82 .2. V.I.Bespalov, G. A. Pasmanik. Nonlinear optics and adaptive laser systems., Moscow,
Nauka publishers, 1986 (in Russian).3. B.Ya. Zeldovich, N.F. Pilipetsky, V.V.Shkunov .Wave front conjugation, Moscow, Nauka
publishers, 1985, p.34 ,(in Russian).4. N. Bloembergen., Nonlinear optics.,W.A. Benjamin, Inc., New York -Amsterdam, 1965.5. S. A. Vitsinskii, V.K. Isakov, S.N. Karpukhin, I.L. Lovchii. Stimulated Raman scatteringof copper-vapor laser radiation in a barium nitrate crystal., Kvant. Elektron.(Moscow) v.20,1993 p.1155, [Sov. j. Quantum Electron.v.23, 1993, p.1001].6. V.I.Bespalov, A.A.Betin, G. A. Pasmanik, Reproduction of a pump wave in stimulated
scattering radiation. Proseedings of higher educational institutions, Radiophysc, v.21, #7,p.961-980 (in Russian).
7. Y. A. Anan'ev. Optical Resonators and Laser Beams, Nauka Publishers, 1990 (inRussian).
8. S.N. Karpukhin, A.I. Stepanov., Stimulated Emission From the Cavity Under SRS inBa(N0 3)3, NaNO3 and CaCO3 Crystals., Kvant. Elektron.(Moscow) v.13, 1572(1986)[Soy. J. Quantum Electron. v. 16,1027(1986)].
9. Mezenov A.V., Soms L.N., Stepanov A.I. Thermal optics of solid-state lasers, J. of SovietLaser Research, v.8, N5, 1987, p.4 27-549.
10. A. Z. Grasuk. Raman lasers, Kvant. Elektron.(Moscow), v.1, #3,1974, p.4 85-50 9 (inRussian).
11. Yu.E.D'akov, S.Yu.Nikitin. Kvantovaya Elektronika, 1987, v. 14, No. 10, p. 1925-195 7 (inRussian).
12. J. Goldhar, J. R. Murray, IEEE J. Quantum Electron. QE-18, 1982, No. 3, p. 399-409.13. Y. R. Shen, The principles of nonlinear optics, John Wiley & Sons., 1984.14. N.Ya.Vilenkin. Special functions and the theory of croup presentation. Moscow, Nauka,
1965 (in Russian).15. A.A.Samarsky. Introduction to the numerical methods. Moscow, Nauka, 1987 (in
Russian).16. R. S. F. Chang, R. H. Lehmberg, M. T. Duignan, N. Djei, IEEE J. Quantum Electron.,
QE-21, 1985, No. 5, p. 477-487.
47

Application 1
Institute for Laser Physics of SC "Vavilov State Optical Institute"
&
Company Lasers and Optical System, Ltd.
Crystalline Media for SRS Conversion of
High Power 1.32 Micron Radiation
Interim Report #1
Director of the Institute QProf. Arthur A.Mak
Principle Investigator Sergey N.Karpukhin
St.-Petersburg
1997

1. Introduction 3
2. Selection of crystals for Raman frequency conversion 3
3. SRS generation and amplification in crystals 5
4. Influence of medium heating onto SRS ofpulse repetitive radiation 14
5. Conclusion 22
6. References 22
2

1. Introduction
This Report is delivered on the completion of the studies in the frame of the
Contract F61708-97-W0255, devoted to analysis the principal limitations of SRS
conversion of 1.32 radiation carried out by the Company LOS Ltd., St.-Petersburg,
Russia with the participation of the scientists of the Research Institute for Laser
Physics, St.-Petersburg, Russia, and of the Research Center "Vavilov State Optical
Institute", St.-Petersburg, Russia.
The use of stimulated Raman scattering (SRS) for Nd:YAG laser 1:32 gm
emission conversion is rather promising idea, providing the possibility of realization
of the completely solid-state source of the eye-safe radiation. Such a possibility was
for the first time noted and experimentally tested in [1].
Most of the preceding papers on SRS in crystalline media were carried out
with the use of pumping by 1.064 jim or its second harmonics. These activities
revealed the novel crystalline media with the low generation threshold, demonstrated
the possibility of the efficient energy conversion via SRS. It was shown that it is
possible to obtain the diffraction limited radiation in the mode of phase conjugation,
as well as to realize the amplification of weak wave without distorting it and to work
in the kHz range of pulse repetition rates.
However, the results of these activities, as well as of studies of SRS in other
media, had, at the same time, revealed some limitations of principal character, which
are to be accounted for in design of SRS converters, including those pumped by 1.32
gim emission; in fact, a lot of general features of SRS process are valid across the
wide spectral range and are to a large extent determined by general properties of theradiation, such as divergence and spectrum width, and by the spatial geometry of SRS
excitation, such as SRS in focused beam, SRS in cavity etc.
2. Selection of crystals for Raman frequency conversion
The main parameter of the medium, which describes its applicability for SRS
process, is the SRS gain. In [2] there was for the first time given the expression for
this gain:
G =22,(dcrd.d2) Ip/hvrA v
3

Here As and vs are the wavelength and frequency of the Stokes radiation, du/dd2 - the
cross-section of scattering from the single unit of the medium volume to the unit of
the corporal angle, Ip - pump intensity and Av - linewidth of the spontaneous Raman
scattering. The obvious conclusion from that formula would be the following. The
best gain can be realized in crystals which reveal the highest value of ratio of the
cross-section of scattering by the active molecular oscillation to the linewidth.
However, it is impossible to find out the gain for this or that crystal by means of direct
calculations: from the quantum theory it is known that the cross-section value depends
on the outlook of the wave functions of this crystal electron states which is not known
for the majority of crystalline media [3]. However, it is possible to derive one general
principle of the search for the crystals with the highest gain.
It is well known from the classical theory that the scattering cross section is
proportional to the square of the polarization derivative on the oscillation coordinate,
calculated in the state of atomic equilibrium [3]. One can expect to find out the
highest values of such a derivative in the crystals, containing in their structure the
molecular complexes with the covalent atomic ties. The oscillations of the atoms,
subject to such ties, result in strongest deformations of their common electron orbitals
and thus in highest values of the said derivative [4].
So the search for the crystals with the highest gain of SRS process was done
earlier by means of experimental evaluation of the media with such ties, namely
nitrates; nitrites and sulfates of some metals. The search was carried out as the
evaluation of SRS threshold in various polycrystalline media (the pressurized tablets
of the medium powder [5,6]). This method is based on the inverse proportional
character of this threshold dependence on SRS gain.
We have chosen the nitrates of several metals as the most prospective media.
Further studies of the crystal growth processes resulted in choosing of two crystalline
media, namely barium and sodium nitrates. The parameters of these crystals,
important from the point of view of SRS excitation, are summarized in the Table 1.
This Table contains also for the comparison purposes the same parameters for the
natural crystal of calcite.
This Table 1 also contains the data on crystal of KGW (KGd(W0 4)2). The
SRS in this medium was the first time revealed in the Vavilov State Optical Institute
4

while investigating the picosecond generation in the laser, based on Nd-doped KGW
active medium [7].
Table 1. Parameters of SRS crystals [8,9]
Materials Polarization v cm'l Av cm'" g 103 cm/ MW__ =0.53 pm ?p =1.06 pm
Ba(N0 3)2 1046 1.5 47 111047/10/ 0,56/10/
NaNO3 I optical axis 1066 2.0 47 11CaCO3 -0 - 1085 2.3 13KGd(W0 4)2 n. axis 901.5 5.9 6
np axis 767.3 7.8 16
One can see from the Table that the barium and sodium nitrate crystals reveal
the highest SRS gain. In KGW the comparatively high value of g (g=G/Ip) is
accompanied by the large linewidth of the oscillation transition; such a combination
makes this medium rather promising for SRS of radiation with the wide spectrum and
for picosecond pulses of radiation.
3. SRS generation and amplification in crystals
Let us now discuss some experimental and theory results, which can help us to
determine some limitations. We shall start with the results on studying the simplest
scheme of SRS excitation via radiation focusing to the crystal volume [8,11]. In the
Fig. 1 is shown the experimental setup, which was used in these experiments. The
multi-mode radiation from Nd:YAG and Nd:KGW lasers (2 = 1.064 and 1.067 tim)
was focused into the crystal. In the Fig.2 are shown the results of measuring of the
efficiency of conversion to all the Stokes components.
One can see that for the high threshold ratio in crystals of Ba(N0 3)2 and KGW
are realized the efficiencies of SRS conversion of- 70%. In KGW the pumping pulse
energy was limited by the breakdown. It took place at the level of pumping pulse
energy of - 10 mJ, i.e. at the intensity of breakdown of less than 1 GW/cm2.
However, in the pulse repetitive mode of pumping laser action these crystals revealed
the bulk damage at the energy level which is much lower than the damage threshold
for the single pulse action. So the thermal stress due to the Stokes loss can limit the
use of this medium. The barium nitrate crystal could have been subjected to the action
of 60 mJ pulses without damage.
5

Crystal1 = 80 mm Prism
•'P~l"06Xm XS• ss
Lenses, F = 20 cm
Joulemeter Joulemeter
Fig. 1. Optical scheme for investigation of the focused beam SRS.
11
0.6
0.4
0.2
0 10 Ep mJ 20
Fig.2. Energy conversion to all Stokes components efficiency (0) dependence vs. pump energy (Ep) for
the crystals: A - Ba(N0 3)2, 0 - KGd(W0 4)2, polarization along the axis nm,
0 - KGd(W0 4)2, polarization along the axis np.
6

'1a b0.6
11
First Stokes0.4- 0.4 gScnStokes 0-O--N.Frst Stokes
Second Stokesd Stokes
0.2 0.2 Second Stakes
Backad R
1'0 ýo ýD0 10 20 30 40 5o Ep0 mJ
Fig.3. Conversion efficiency and residual pump energy at the crystal output for SRS in Ba(N0 3)2 for
radiation from Nd:KGW laser (Fig.3a, Avp =1.8 cmf l) and Nd:YAG laser (Fig.3b, Avp =0.5 cm')
7

The surface damage threshold of this crystal can be evaluated at the level 1.5 G/cm2
(X,=1.06 pm). The crystal volume has to reveal higher threshold. In this crystal no
thermal damage occurs at the level, typical for KGW, but the radiation is depolarized
(see further).
The most interesting case is that of maximal conversion to the first Stokes
component. In the Fig.3 are shown the dependencies of the energy conversion to
Stokes components vs. pumping energy for the case of focusing the multi-mode
radiation with various width of spectrum [11]. One can see that at the conversion
efficiency of 40% the excitation of second Stokes component reveals itself, limiting
thus the conversion to the first one. The main role plays the SRS excitation by the first
Stokes component.
Second Stokes component generation is supported by the parametric
interaction of pump and first Stokes component waves. There is significant wave
mismatch in this process: Ak = kp - 2ks + kss; here kp, ks, kss are correspondingly the
wave vectors of pump, first and second Stokes components. Nevertheless, this process
results in decrease of the second Stokes component generation threshold. For
instance, in [12] the investigation of pumping by dual wavelength radiation revealed
the decrease of the excitation threshold by weak component, and the efficiency of this
process grew up.
In the case of pumping by the narrow linewidth radiation some part of
radiation is scattered to the backward direction (Fig.3b). It means that there exists the
competition between the processes of forward and backward generation of the first
Stokes components. This competition is also to be regarded as the principal limitation
of the conversion efficiency to the forward (or backward) Stokes component of SRS
in focused beam. Some reduce of the role of this negative factor can be obtained by
the proper choice of focal length of the lens. Such a possibility was earlier determined
for the case of focusing to the crystal of the single mode beams, whose spectral width
was limited by the pulse duration [13]. Short focal length resulted in preferably
backward SRS generation, while longer - in preferably forward SRS process.
Observation of SRS in the cavity has also revealed the limitation of the energy
and conversion to first Stokes component efficiency due to second component
excitation [9,14]. The use of low selectivity mirrors at the high threshold ratio level,
8

which is necessary for the efficient conversion, did not provide complete dumping of
the second Stokes component.
More efficiently the second Stokes component is dumped in SRS master
oscillator - power amplifier schematics or in the case of SRS generation inside the
pumping laser cavity [15]. These devices, of course, belong to the class of more
complicated nonlinear devices. SRS in the cavity provides the possibility to realize
the comparatively efficient device at the relatively small threshold ratio. The reason is
lack for pump energy losses, for it is locked in the closed cavity. For instance, in [15]
for barium nitrate pumping by 1.32 pim there was obtained the 12 mJ output to the
first Stokes component with the efficiency 48 %. Scaling of these results gave the
energy output of up to 250 mJ.
Now let us discuss the spatio-angular parameters of radiation and their
connection with SRS generation energy and efficiency. In [11,13] it was shown that
the forward SRS is accompanied by the so called effect of the wavefront reproduction,
while the backward SRS results in phase conjugation of the scattered beam. In the
Fig.4 is shown the optical scheme, which was used for measuring the divergence of
the beam, realized via SRS of focused beam. In the Fig.5a are shown the results of
measurements for the multy-mode pumping beam (Ep, is the energy in the angle V. and
E - the total generation energy) [11]. One can see that for the low energies the
scattered beam divergence coincides with that of the pumping beam, i.e. the effect of
wavefront repetition takes place; note, that divergence of the Stokes beam is even
slightly smaller than that of the pumping beam, because the low energy wings of the
beam do not participate in the nonlinear process. The energy increase, however,
results in more than double aggravation of the beam divergence due to the spatially
incoherent mode of scattering.
One can expect that in the case of single mode pumping the growth of
threshold ratio would also result in deterioration of forward SRS beam [13]. In
addition, in the mode of the wavefront repetition the energy of single mode beam
would be always smaller than that of multy-mode one, for the threshold energy is
proportional to the beam divergence [16]. So in the case of use of focused beams the
generation of diffraction limited forward SRS beam is possible only at the low energy
level; for 1.32 4tm this range is limited by 1 and 4 mJ. In the case of backward SRS
the
9

Iris diaphragm
JoulemeterF =19 cm F =11 cm Filter
Fig.4. Optical scheme for measuring the angular divergence of the forward SRS radiation,
excited by the focused beam.
Stokes Pump(Ep= 6 mJ) P Stokes (E;= 18 mJ)
"- Stokes (Ep= 58 mJ)
b0.5 &/ J a Pump
0'5" E0.8,
Stokes
0 (Ep= 15 rni)
0.4 os 1 q), mrad
10 15 ' p, arc.min
Fig.5. Dependence of the angular energy distribution EI/E vs. angle (p for multy-mode pumping (a) by
radiation with X- 1.067 ýLm, beam diameter d=t5 nun and for single mode pumping (b) by radiation
with X = 0.532 Ipm, d=-6 mm; the scheme with two crystals was used [13].
10

proper choice of the focal length of the lens provided at the high energy level
(threshold ratio of- 2 orders of magnitude) the Stokes beam divergence of not more
than 2-3 diffraction limited values (Fig.5b); the conversion efficiency in this case was
35-40%. However, for the fixed energy of the backward scattered Stokes beam
there is the principal limitation of the divergence improvement possibilities by the
damage threshold of the crystal, because the reduce of focal length results in increase
of the intensity in the focal plane as - 1/F2 .
In the case of SRS generation in the cavity the nearly diffraction limited
output beam was realized under the pumping by the beam, whose diameter is
approximately equal to that of zero mode [14,15]. With this purpose the in [15] the
waists of the cavity modes for the pump and SRS generation radiation were spatially
matched in the center of barium nitrate crystal. In [14] it was shown that the increase
of the pumping beam waist diameter over diffraction limited, but preserving pump
intensity, results in the divergence growth.
Further increase of energy of scattered beam with the low divergence
preservation is possible with the use of SRS amplification. The most interesting
variant is that of single mode beam amplification under the multy-mode pumping. For
the Nd:YAG laser typical divergence of multy-mode beam is somewhat - 2 mrad.
Such a divergence of pump would, however, result in deterioration of the amplified
beam divergence. The reason of such a deterioration [17] is as follows.
Let the pumping waves of SRS amplifier consists of two spatial components
with the wave vectors kp1 and k 2 correspondingly and the amplified Stokes beam -
the wave vector t6 (Fig.6). The action of pumping and Stokes waves excites in the
medium the wave of molecular oscillations Q:
Q=ZQexp[i (02t -qir)], i=1,2
here q i = kpi -ks are the wave vectors of molecular oscillations. The scattering of
pump components on the excited molecular oscillations results in generation of
Stokes radiation with wave vectors:
k., = kp1- qi = ks
ks2 = kp2- q2 = ks
1s3-= kpl- q2 = ks- (kp2 - kpl)
ks4 = kp2- qi = k1- (kpl - kp2)
11

ks3
kpj
ks4
Fig.6. Direction of the Stokes radiation amplification.
Op - divergence of pumping beam, 0, - divergence of pumping beam
K
0.6 60
0.4 40
0.2-
io "lbo" 1000
Ep/Eso
Fig.7. Conversion efficiency (iq) and amplification (k) vs. ratio of pump energy to seed Stokes energy
(pIEo); Op = 16 mrad, 0, = 0.5 mrad, A, 0 - two passes, Ip = 16 MW/cm 2,
0 - single pass, Ip = 24 MW/cm2.
12

One can see from these equations that two first wave vectors coincide with the wave
vector of the amplified Stokes beam. It means that the pumping wave scattering on
the wave of molecular oscillations, which was created with the said light wave
participant, represents the Raman scattering without distorting the wavefront. At the
same time the wave vectors t6 , k. differ from the amplified beam vector.
Generation of such waves is realized due to the parametric interaction of pump
components with the input Stokes beam. This process results in wavefront distortions
and thus in increase of the divergence of the amplified radiation. The mismatch of the
parametric process of the waves with the wave vectors kC, ks4 is described by the
equation:
Ak=-Ik,31 -1Ik, I=I k, 4 1 ýk, IjW69,k,/2k 3
Here ep is the diverence of the wave, pumping the amplifier. The dumping of the
parametric interaction of waves and thus distortions-lacking amplification requires the
fulfillment of the following relationship [17]:
(G kAk 2 e &2)2
Let us assume that the gain has the value in the typical range of G=0.5-1 cm"1, which
corresponds to the range of pump intensities of Ip=60-120 MW/cm 2. In our evaluation
of G we have used the value of g=0.0086 cm/MW; it was recalculated from the value
for X, = 1.064 pim (see Table 1) with the account for the spectral dependence of
scattering cross-section: do/d.0 -v 4 [3]. It was assumed that ep= 2 mrad, 2,= 1.32
J.m, 2A =1.53 jim ( k= 2,r/2). So for the left part of the formula we get the value of
some 5-20, i.e. the relationship is not fulfilled. Hence the parametric process of multy-mode pump interaction with the amplified Stokes beam reveals itself as the principal
limitation of the distortions-lacking amplification.
One can see from the discussed relationship that the negative influence of the
parametric process can be reduced by means of pump divergence increase or by the
quasi-longitudinal amplification with the comparatively large angle between the pump
and amplified beam propagation directions [ 18].
For example, in [15], the single-mode pumping beam was intentionally
distorted up to the divergence of 16 mrad by the etched plate. The plane of this
13

distorting plate was imaged into the crystal by special relay. In this experiment the
signal with the divergence of 0.5 mrad was amplified without distortions. In the Fig.7
one can see the results of measurements of the amplifier efficiency and amplification
gain vs. ratio of the pump and the input signal. In the dual pass (both for pump and
amplified Stokes beam) scheme there was demonstrated the conversion efficiency of
74%. Higher ratio of the pumping beam energy to that of the input Stokes beam
resulted in conversion efficiency deterioration due to the amplifier self-excitation.
4. Influence of medium heating onto SRS of pulse repetitive radiation
In this Section we present the preliminary novel results on quantitative
analysis of the Stokes losses influence.
SRS is accompanied by the significant frequency shift in the value
corresponding to the frequency of molecular oscillations. This energy deficit (Stokes
losses) is released in the medium as the heat. For the pumping wavelength of 1.32 gm
in the barium nitrate crystal the rate of Stokes losses equals 14%. In [10] in
experiment there was measured the dependence of the molecular oscillation linewidth
vs. temperature. It was determined that the temperature growth results in linewidth
enlargement due to the stronger interaction between the active oscillation and other
molecular oscillations in the crystal. So the gain is reduced.
Hence one can predict the deterioration of the SRS process efficiency. The
strength of influence of the medium heating onto the efficiency of the pulse repetitive
radiation SRS can be evaluated on the example of the SRS amplifier. Let the crystal is
cylinder shaped. Both pumping and Stokes beams propagate along the cylinder axis,
and the beam radius R, is less than the crystal radius R2 . Let us also assume that the
crystal is cooled by cooling agent. In general case the temperature of the crystal
surface would exceed that of cooling agent. The heat flow from this surface to the
cooling agent is described by the equation [19]:
ZdT/dn = a (Tr-Td)In this equation X is the thermal conductivity coefficient, ca is the thermal exchange
coefficient, T, - surface temperature and T, - cooling agent temperature. The derivative
was taken in the direction, normal to the crystal surface. Let W(z) is the average
power, released in crystal volume unit. It includes not only the Stokes losses, but also
the linear absorption of radiation in the crystal. Let us now assume the following
14

simplifications. Let us neglect the temperature gradient in the direction of the crystal
axis. In this case the solution for the temperature in the practically interesting range of
polar coordinate r values from 0 to R, can be derived analytically and looks like [20]:Srm 2 2R ,m 2
T(z, r) = Tc + (1- + -_)_+ In -R
4R 2 -i 2Z -
Here Bi = aR2/Z is the so called dimension-less criterion of similarity. Rather
uncertain parameter is the value of the thermal exchange coefficient. It is known [19],
that in the case of liquid cooling this coefficient value fills to the range of 0.1.. 1
W/cm 2K° (i.e. Bi = 5.. 10 for R 2 = 0.5 cm). In the case of gas cooling a < 0.01
W/cm2KO and, correspondingly, Bi< 0.5.
The following equations describe the interaction of the pumping and the
Stokes waves with the account for the variation of the thermal power deposition in the
unit of medium volume and thus variation of the gain:d~s d/,- = g(T) I P1, = -g(T) IPIsdZ dZ
dls •W(Z) =F - + r +KF (Ic(Z) + Ip (Z))
dZ v,
Here Ip, Is are the intensities of the pumping and Stokes components, F - repetition
rate, k - absorption coefficient and r - pulse duration.
We have calculated the amplifier efficiency q, determined as the ratio of the
difference between output and input energy of the Stokes beam to the pumping
energy, in its dependence on the input pumping power P. The function g(T) was
determined from the approximation of experimental dependencies in [10]. The results
of calculations are shown in the Fig.8.
The calculation was carried out with the following set of parameters: Z =
1.1 W/m K°, Ip = 50 MW/cm 2, intensity of the input Stokes beam 5 MW/cm 2, crystal
length 5 cm, g=0.0086 cm/MW (T= 300°K), pulse duration r= 10 ns, R1 = 0.3 cm, R 2
= 0.5cm, absorption coefficient k-0.004 cm 1 .
15

1,%"" "h Bi~l
0.4
0.3
0.2 B! 0.1
0.1
0 = 1 1 I p p 1 1 5 S I & I S
3 6 92 pW
Fig.8. Dependence of amplifier efficiency vs. average power of pump
16

One can see from this Figure that the amplifier efficiency is strongly
influenced by the Stokes losses in the case of non-efficient cooling of the crystal (low
Bi). Note at the same time, that the crystals of nitrates, to the contrary with that of
KGW, are rather hygroscope media. In this case the comparatively high value of Bi
can be provided, for instance, by means of the contact with the surface of metal,
cooled by some agent.
Let us now discuss another aspect of the Stokes losses influence onto the
process of stimulated Raman scattering. It is the depolarization of radiation in the
crystal of barium nitrate, induced in the pulse repetitive mode of action.
The crystal of barium nitrate is the cubic crystal of the symmetry m3. The
cubic crystals do not reveal the birefringence, because in such a crystal the indicatrix
of the refraction index is spherically symmetrical (Bxixi=l, i=1,2,3, B=l/n 2, n -
refraction index of the crystal). Thermal distortions of the crystal results in this sphere
transformation into the ellipse, described by the equation:Bij xjxj =1 i~j =1,2,3
Here Bij is the tensor of the so called relative dielectric impermeability. In general
case the modification of the indicatrix in comparison with its primary shape is
described by the relationship [21]:
ABij= Pijkj kj i,j,k,1 = 1,2,3
Here pij,k, is the tensor of the fourth rank, describing the photoelastic effect, and Sk.u is
the tensor of the second rank, which describes the thermally induced deformations.
The crystal symmetry results in zero value of some components of the photoelastic
tensor. So the modification of the tensor of the relative dielectric impermeability can
be described in the simpler way [21]:
AB =pij i,j 1,2.. 6
In the same paper there was given the description of the tensor pij for the
crystals. of various symmetry classes. Let us write out the expressions for the
components of tensor ABR for the symmetry m3 and reorder the terms:
AB 1 = P1161 +P1,262 +P1,3 83 =pii8i+1 p,22 +p,2 [1+( P1,3 - Pl,2)/PI,2]63
Al 2 = P1381 +p1,182 +PI,2 63 = P1162 +p1,263 +P1,2 [1+( PI,3 - Pl,2)/p1,2161
AR 3 = P1261 +P1,3e2 +P1,1 63 = P163 +P1,261 +P1,2 [1+( P1,3 - P1,2)/p1,2]12
Al4 = p 444 4. A p5 = P44 5. AB6 = p 44F6 .
17

Let us now neglect the value of ( P1,3 - P1,2)/ P1,2= - 0.06 (see Table 2) as very
small in comparison with 1 in the expressions for AB1, AB 2 ,AB3. So the expressions
for ABi would be quite the same as for the class m3m of higher symmetry. So one can
apply the existing theory of depolarization in YAG crystals for the analysis of the
depolarization in barium nitrate crystal.
Table 2. Physical constants of barium nitrate crystal [21,22].
In the Table: n - refraction index for X = 1.06 ptm, O3=dn/dT°, a- the coefficient of
linear expansion (T =250 C), X - thermal conductivity coefficient (T=250 C) and v-
Poisson coefficient.
n ox105 ax105 X v Pit P12 p13 p44degree-' degree-l W/rnK0
1.555 2 1.1 1.1 0.237 2.49 3.40 3.20 -0.021
The essence of this theory is as follows [21,23,24]. Let the crystalline active
element is subjected to the thermally induced deformations. In each point of its
transverse section with the polar coordinates (r,tp)l the axes of the ellipsis of the
optical indicatrix &re turned with respect to the direction r in the angle CC= (P'- (P,
where the angle (p' is to be determined from the equation:
tg2p' = t tg2qp
One can see from this equation that for t#1 the axes of the ellipses of the
optical indicatrix, corresponding to various points of the crystal, do have in their
orientation the emphasized direction (t=1 (9' =(p) for the direction z I I [111 ]). In the
crystal of barium nitrate for the orientation of the geometric axis of the active element
z I1 [001] t= 2 p44/(pi -P12 ) =0.04 and for z I I [ T10] t=8p4I(3pni - 3 p12 +2 p44)
=0.057. Such a low values of the parameter ý mean that the axes of the ellipses in
various points of the active element section are practically parallel. So, as we shall
show further, it is possible to choose the crystal position with respect to the
polarization vector in which the depolarization rate is minimal.
For the ray, which is parallel to the geometrical axis, and the coordinates (r,q)
the power in the depolarized component is determined by the equation:a(r, 9•)=sin2 2((p'-y )sin 2 [5(rpq)/2]
Here (P is measured with respect to the plane, containing the geometry axis z and the crystallographic
axis [100].
18

Here y is the angle between the polarization vector and the plane, containing the
geometry axis z and the crystallographic axis [100], 6(rq) is the phase shift in some
point between the own polarization states of the optical indicatrix. The summary rate
of depolarization across the section losses can be described analytically only for the
directions ofz! [001], [111], [ -110]:
1ý4( tg2,pcos2ry-sin2y) 2 1 sin2G] Lf_ 1+ ý2 tg 2
G Bl+ý2tg:22,1 +tg 2 2(p
4;ranf 1 I+ v WR2
B- A 1-v 4Z
Here W is the thermal power, released in the unit of volume, (x - linear expansion
coefficient, X - Stokes beam wavelength, v - Poisson coefficient, R, - radius of the
channel of beams' interaction, X - thermal conductivity coefficient, L - crystal length,
''=PIi-pI2, 3/4 (pll-pl2) +1/2 p44 and P11-P12+4P44 correspondingly for z I [001],
[110] and [111].
In the Fig.9 are shown the results of calculation according to the given
expressions of A dependence vs. parameter B, which is proportional to the phase shift
between r and Vp polarization states. One can see that for y= 00 it is possible to obtain
the significant reduce of depolarization for the directions of z [001] and [ 110]. For
the direction of z II [111] the rate of depolarization does not depend on the value of y.
This direction is less interesting with respect of intense pulse-repetitive radiation SRS.
The most interesting is the direction of z II [ 110], for it is the direction, in
which it is possible to cut out the longest crystals of barium nitrate. Note, that the
given expressions are valid for z I I[ 110] when there is fulfilled the relationship
(pi1-p12 +p44 )/(3 p,1- 3p12 +2p44)<<l [26]. However, the requirement of significant
difference is not fulfilled, for the left side of this relationship equals in fact 0.32. It is
impossible to evaluate the real situation for A by analytical means. So it is necessary
to carry out the numerical calculations by Nye matrix method [21].
2 The figures in square brackets indicate the crystallographic direction in the crystal.
19

60' 60a 1, b
A,% A,%0.85
40-
0.6
20 0.4
0.2-
0 4 B, rad 0, 2 4 B, rad
Fig.9. Dependence of depolarization rate A vs. parameter B.
Fig.9a: solid line - z 1II [ Ti], [0011, r= 450;
dotted line - z II [I 111, r=45° and = 0';
Fig.9b: solid line - zII [ TI0], r= 00;
dotted line - z I [0011, r= 00.
20

Earlier we have carried out the experimental measurement (in the pulse
repetitive mode of laser action) of the rate of Stokes beam depolarization with the
pumping by 1.064 gpm radiation for this direction. For the average pumping power of
2 W the depolarized component contained - 25% of the total power for y = 450 and -
2-2.5% for 7 = 0'. In [12] for y = 45' there was also observed the reduce of SRS
conversion efficiency. Crystal tilt in 45' (y = 0°) resulted in absence of such an
efficiency reduce. These results indicate qualitative correspondence of experiment and
above given discussion on the possibility to compensate for the thermally induced
birefringence. However, the power level, when the depolarization is observed for y450 are much smaller than the theoretically predicted.
Let us evaluate the pumping power which is to result in 10% depolarization at
1.32 ptm pumping. According to the calculated curve in the Fig.8a for such A we have
B=O.8. Let us use in the equation forB the value of
W=P~! ,+kL•R 1
Here P is the average pumping radiation power, 77 - SRS conversion efficiency,
)/ v8 - ratio of the molecular oscillation frequency to that of Stokes wave, k -
absorption coefficient. Solution for this equation gives us the value of P = 5.6 W. For
the radiation of 1.064 pnm we should have the value of P= 4.3 W; that value is much
higher than that measured in real experiment.
In [12] there was revealed the violation of the energy balance for the input and
output beams with the account for the Stokes losses. Possible reasons of such
misbalance can be scattering to large angles, as well as nonlinear absorption (dual
photon for the visible range of spectrum); it can occur for 1.064 pLm as well. One can
observe the violation of the energy balance at focusing for the pump energies,
exceeding 15 mJ, analyzing the curves in the Fig.3a. One can see from this Figure that
for the high pump energies the efficiency of conversion to second Stokes component
alone is not changed, while the parts of the residual pump (at the crystal output) and
of the first Stokes component are reduced. So the energy of the output radiation grows
slower than that of input radiation. For the pump energy of 60 mJ the misbalance,
accounting for Stokes losses, reaches 27%. It is rather difficult to separate the
influence of the nonlinear absorption and of the scattering to large angles. At the same
time the studies of the thermally induced birefringence can be regarded as an
21

instrument for the nonlinear absorption measurements. New studies are thus
necessary.
As to the single axis crystal of sodium nitrate it is possible to neglect the
influence of the thermally induced birefringence, for the induced retardation of r and
qo phases would be much smaller than that of natural origin. The main difficulty in this
crystal application results of its high hygroscopicity and thus difficulties in butt-ends
processing.
5. Conclusion
In conclusion let us now enumerate the principle limitations, which are to
accounted for while optimization of the crystalline SRS converters of high intensity
1.32 .tm radiation.
"* Optical breakdown of the crystal (limitation of the Stokes radiation energy).
"* Generation of the second Stokes component (reduce of efficiency of the conversion
to the separately first stokes component).
"* Forward and backward SRS competition while generation in focused beams
(reduce of either forward or backward SRS process efficiency).
"* Parametric interaction of spatial components of the multy-mode pump with the
amplified Stokes beam (radiation divergence increase).
"* Medium heating in pulse repetitive mode of action due to the Stokes losses
(efficiency reduce, thermally induced birefringence, thermal damage of the
crystal).
6. References
1. S.N.Karpukhin, A.A.Nikitichev. Close IR range of spectrum radiation via SRS in barium nitrate.Proceedings of All-Union Conference Laser Optics'90, Leningrad, 1990, p.311 (in Russian).
2. Garmine E., Paudarese F., Townes C.H , Cogerently driven molecular vibration and lightmodulation., Physical Review Letters, 1963, v. 11, p. 160 -16 3.
3. N. Bloembergen., Nonlinear optics.,W.A. Benjamin, Inc., New York -Amsterdam, 1965.4. Eckhardt G., Selection of Raman Laser Materials., IEEE j. of Quantum Electronics, 1966, v. QE-2,
X21, p.1-8.5. Kondilenko I.I., Korotkov P.A., Maly V.I. Thermal dependence of SRS spectra of some salts of
inorganic acids in crystalline phase. Journal of Applied Spectroscopy, 1974, v.21, Xo_2, p.282-285(in Russian).
6. Bortkevich AV., Karpukhin S.N., Stepanov A.I. Study of some crystalline media for SRSconverters, phase. Journal of Applied Spectroscopy, 1982, v.37, "o_2, p.332-334 (in Russian).
7. Ivanuk A.M., Ter-Pogasyan M.A., Shakhverdov P.A. et al. Picosecond laser pulses via intracavitystimulated Raman scattering in active element of neodymium laser. Optika I spektroskopiya, 1985,v.59, X25, p.950-952 (in Russian).
22

8. V.A. Berenberg,, S.N. Karpukhin, I.V. Mochalov, Stimulated Ranman Scattering of NanosecondPalses in KGd(WO4)2 Crystals., Kvant. Elekton.(Moscow) v .14,X29, 1987.
9. S.N. Karpukhin, A.L. Stepanov., Stimulated Emission From the Cavity Under SRS in Ba(N0 3)3,NaNO3 and CaCO3 Crystals., Kvant. Elektron.(Moscow) v.13, 1572(1986) [Soy. J. QuantumElectron. v. 16,1027(1986)].
10. T.T. Basiev, W. Jia, H. Liu, P.G. Zverev, Raman Spectroscopic and Nonlinear Optical Propertiesof B~arium Nitrate Crystal., OSA TOPS on Advanced Solid-State Lasers., 1996, v. 1, p.554- 559.
I1I. V.N.Voitsekhovskii, S.N. Karpukhin, V.E. Yacobson, Single-cristal barium nitrate and sodiumnitrate as efficient materials for laser-radiation frequency based on stimulated Raman scattering,J.Opt.Teclmol., v.62(11), 1995, p.770-776.
12. S. A. Vitsinskii, V.K. Isakov, S.N. Karpukhin, I.L. Lovchii .Stimnulated Raman scattering of copper-vapor laser radiation in a barium nitrate crystal., Kvant. Elektron.(Moscow) v.20, 1993 p.1 155,[Sov. j. Quantum Electronmv.23, 1993, p. 10011.
13. S.N. Karpukhin, V.E.YashiIL, Stimulated Emidssion and Amplification of Radiation Under SRS inCrystals., Kvant. Elektron.(Moscow) v.11, 1984, p.19982, (1984),[ Soy. j. Quantum Electron. v14,1337(1984)1.
14. C. He, T. H. Chyba., Solid-state barium nitrate Raman laser in visible region. OpticsCommunications., v. 135, 1997, p.273-278.
15. J.T. Murray, R-C. Powell, N.Peyghambarian, D.Smith, W.Austin, R.A.Stolzenberger., Generationof 1,5-pin radiation through intracavity solid-state Raman shifting in Ba(N03 )2 nonlinear Crystals.,Optics Letters, 1995, v.20, N9, p. 10 17-1019.
16. V.I.Bespalov, G. A. Pasmanik, Nonlinear optics and adaptive laser systems., Moscow, Naukapublishers, 1986 (in Russian).
17. Yu. E. D'yakov, S.Yu. Nildtin., SRS of the Laser Radiation with a Wide Angular Spectrum, Kvant.Elektron.(Moscow),v. 14, NIO, p. 1925-1957 [Soy. 3. Quantum Electron. v. 17,p. 1227-1247 (1987)].
18. Robert S.F. Chang, Robert FL Lenmberg, Michael T. Duignan, N. Djeu ., Raman Beam Cleanup ofa Severely Aberrated Pump Laser., IEEE J.of Quantum Electronics v.Q.E.21,N5, 1985, p.477-487.
19. Mezenov A.V., Soms L.N., Stepanov A.I. Thermal optics of solid-state Lasers, J. of Soviet LaserResearch, v.8, N5, 1987, p.427-549.
20. Mikheev M.A., Mikheeva 1.M. Principles of thermal transfer, Moscow, Energia publishers, 1977 (inRussian).
2 1. J.F. Nye, Physical Properties of crystals., Oxford at the Clarendon Press 1964.22. Belevceva L.I., Voitzekliovsky V.N., Nazarova N.A., Romanova G.I., Shvedova M.V., Yakobson
V.E. Basic properties of optical crystals of barium nitrate. Optiko-mekhanicheskayapromyshlennost, No.4, 1989 (in Russian).
23. L.N. Soms. A.A.Tarasov, V.V. Shashkin. On the Problem of Depolarization of Linearly PolarizedLight by a YAG:Nd3+ Laser Red Under Conditions of Thermally Induced Birefringence. Kvant.Elektron.(Moscow)., v.7, N3, 1980, p.619-62 1.
24. L.N. Soms, A.A.Tarasov, Thiermal Deformations in Color-Center Laser Active Elements.1.T'heory., Kvant. Elektror.(Moscow).,1985, v.6, N12, p.2546-2551.
23

Application 2
-institute for Laser Physics of SC "Vavilov State Optical Institute"
&
Company Lasers and Optical System, Ltd.
Crystalline Media for SRS Conversion of
High Power 1.32 Micron Radiation
Interim Report #2
Director of the Institute Prof. Arthur A.Mak
Principle Investigator Sergey N.Karpukhin
St.-Petersburg
1998

1. Introduction
This Report is delivered on the completion of the second stage of the work in
the frame of the Contract F61708-97-W0255. According to the Contract provisions on
the second stage we had to prepare the Q-switched laser system, operating at 1.32
micron wavelength in pulse repetitive mode up to 20 Hz and providing the output of
20 mJ in single mode and 150 mJ in multimode operation regimes, and had also to
grow up the larger SRS-active crystal. The study was carried out by the Company
LOS Ltd., St.-Petersburg, Russia with the participation of the scientists of the
Research Institute for Laser Physics, St.-Petersburg, Russia, and of the Research
Center "Vavilov State Optical Institute", St.-Petersburg, Russia.
2. Laser setup
The setup was created accounting for the possibility of studies of the single
mode radiation amplification in the field of multimode pumping according to the
schedule of the final stage of the Contract. The setup comprises two lasers with the
synchronized starting up of the electrooptical Q-switches. One of these lasers operates
in the single mode regime, while the other - in the multimode. It is also provided that
in the experiments with the single mode beam the laser heads of one laser can be used
for the amplification of the beam from the other one.
The functional scheme of the setup is shown in the Fig. 1. The electrooptical
switches of both lasers are controlled by one and the same modulator 1. The divider 2
of the Q-switch shutters driving frequency provided the variation of pulses rate at the
fixed pulse rate of flash lamps, with repetition rate scaling 2,3,4,8,16. Thus it is
possible to perform SRS studies with the variable thermal loading. Otherwise the
variation of the lamp pump repetition rate could result in variation of thermal lens in
laser YAG rod, and cause the variation of the pump radiation divergence and spatial
structure.
Fig.1. Functional scheme of laser setup.7 t 1 - control unit for the electrooptical switches;
2 - the unit for the reducing of the repetitionrate of the elctrooptical switching;, 3, 4, 5 and
7i-FLFLF7L j IF I] 6 - power supply units for the flashlams; 7 -.. J L JL.J1 laser head.
2

54ý 6 7itg 8S... ......... .... .......
2 3 4
10
2 39 ----- ---.. .. ..... ........
Fig.2. Optical scheme of laser setup.
I - mirror, R1.321.06= 99%/10%; 2 - electrooptical switches; 3 - polarizer, 4, 6, 9 and 10-Nd:YAG crystals (4- 05x65 mm, 6 - U4x65 mm, 9, 10- 06.3x80 ram); 5 - RI3n.o699,%0/10%; 7 - aperture 02 mm; 8 - R1.37 1.06= 50°/o/10%.
The optical scheme of the pumping lasers is shown in the Fig.2. The cavities of
both lasers (single mode and multimode ones) have similar lengths (- 80 cm); their
mirrors have the identical reflectivity. The crystals of Nd:YAG are pumped by the
xenon flashlamps with the discharge gap length of 65 mm. Each of the cavities
comprised two active elements, providing thus the possibility to reduce somewhat the
pumping energy and the reflectivity of the coupling mirror. Such a reduce was
necessary with the goal of reducing the intensity at the electrooptical Q-switch, which
is made of lithium niobate. This medium has lower damage threshold, than the crystals
of KDP and KDP* (DKDP), which are used for these purposes at 1.06 micron, but
reveal significant absorption at 1.32 micron wavelength. Further reduce (- 2 times) of
the specific intensity at the edges of this crystal was obtained by means of these edges
tilting at the Brewster angle. Each of the cavities also comprises two auxiliary
spectrum selective mirrors, providing generation dumping at 1.064 micron (when these
mirrors were absent we have observed the free run oscillation at this wavelength,
reducing thus the Q-switched pulse energy and in the extra noise.,We have fabricated
two variants of the backward mirror for the cavity (position 1 in the Fig.2) - the plain
mirrors and the concave with the curvature radius 2 m. In the second case we shall
3

realize the nearly semi-confocal cavity, which reveals the highest divergence of
radiation among all the stable cavities with the exception of the so called conjugated
cavity [1]. Such an operation mode is necessary for the studies of the regime of the
averaging. via the amplification (see the Report for the 'I stage of this work).
3. Pumping laser parameters
The energy of pulses was measured by the calorimeter. The energy of the
multimode laser equaled 150 nm. The energy of the single mode radiation was 10 mJ
for the repetition rate 20 Hz and 8 nil for the repetition rate 50 Hz; this energy was
limited by the excitation of the second mode. The energy of 20 mJ, required by the
Contract provisions was obtained after the amplification in two stages.
E
2
0.5/
Fig.3. Divergence of radiation from themultimode laser.
(1)- with the plain backward mirror and (2) - withthe concave backward mirror (semi-confocal cavity). 1 2 3 4 5 6 q), mrad
The divergence of the radiation was measured with the use of hard pinholes,
positioned in the focal plane of the lens with the large focal length. The results of these
measures are shown in the Fig.3. In the multimode laser, whose cavity was realized
with the use of plain backward mirror the 0.8 of the beam energy filled into the angle
of _= 2,5 mrad, while in the semi-confocal geometry it was =- 5 mrad. The far-field
distribution of the single mode beam is shown in the Fig.4; its divergence was
practically within the diffraction limit of 2.44 Xd.
4

. . .... , . .. .. ..
Fig.4. Far-field distribution of the single mode beam.
Pulse duration was measured with the use of the Tektronics oscilloscope TDS
744 (input bandwidth 500 M4Hz) and of the coaxial photosensitive element FEK-19
(bandwidth 1 GHz). The duration of the pulse (FWHM) was ~ 25 ns (see the
oscillograms in the Fig. 5).T : : : : n::Sampl
"Fig.5. Oscillogram of laser pulse. I .S.... .... ...... . . . ....
ZjII LDV m2 .6s cnAl7 Z.5510 19may lo0t15:45,19
The width of the generation spectrum was measured using the second harmonics
generation in KDP crystal 25 mm lengthl (ooe - interaction) .This an approach was
valid because the generation spectrum is much more narrow than the width of
frequency doubling synchronism ( the last being about -8 cm'l for KDP with the
crystal length spesified [2]). Three generation lines were detected , well resolved
according to the doubling crystal angular position, which was interpreted as result of
two lines generation in 1,3 micron region, viz. 1,319 and 1,344 micron. The brightest
line corresponded to the doubling of 1,318 micron line. As long as the angle between
beam direction and crystal axis increased, the weaker line appeared corresponding to
frequency summation , and then the weakest line coupled with the 1,344 micron
doubling was observed. The absolute wave lengths are given according to [3]. In the
Fig.6 is shown the optical schematics which we have used for measuring the relative
energy of these two components; it was determined that the energy emitted at 1.344 micron
5

K
F .... ' "• •• • "'" ' 2 ' '• •*" " "•" ' :-.. °.... ...-...... ..... ° °-..°.. °° .°..-°° °.°................°
-------- 7--L ~ ~ ~ ---------
S=1 .3 2 g .m Fr L ---.-.2
Fig.6. Optical scheme for measuringof energy distribution across spectral components.
F-filter, L1,3-lenses with focus length 5,70,150 cm ,G- diffractiongrating with 400 lines per mm, M-mirror, K-calorimeter.
was about 5% of that at 1.318 micron. Further, if it would be necessary, we plan to
dump the weak component by the use of the intra-cavity interferometer with the
appropriately small length and reflectivity. The spectrum width was measured with the
use of the interferometers with the length of 1, 3 and 5 mm. The reflectivity of the
mirrors was 90%. In the Fig.7 is shown an example of the interferogram, while the
densitograms, recorded with the use of microdensitometer, are shown in the Fig.8.
For the spectrum width evaluation from the densitograms, recoded with the 5 mm
interferometer, the overlap of the neighboring interference orders was accounted. We
have measured the relative density of the pattern near the center of the free interval (at
the distance of 0,5 cm-1 from the line center). Such a measurement was realized with
the use of the interferogram, recorded with the filter, transmitting 50% of the
radiation. "Assuming for the equal contribution of the neighboring orders, we could
evaluate the result for the one interference order in the center of the free interval as
0,25 , or one half of the measured relative blackening. Accounting for this evaluation,
we have then calculated the resulting spectrum width, using the formula for the
gaussian shape of the generation line. The resulting value equaled 0.7 cm"1 (9p(v) =
exp(- v/Avg)2 , q(0,5cmn')=0,25 for Avg =0,42 cmn , and Av = 2Av vIi ). For the
length 3 mm, the influence of the neighboring order to the relative blackening was
6

Fig.7. Interferograms of the 1.318 micron radiationfor the interferometer base 3'mm (a) andS5mm (b).v
a
Fig.8. Densitograms for the interferometer base 5 mm (a) and 3 mm (b)(1 - without the filter and (2) - with the fl~ter, T=50%).
7

. negligible, resulting in the close value of 0,75 cm71 .So, for the spectrum width of
second harmonic radiation we obtained medium value 0,73 cm"' .Consequently for
1,319 ýun we have value 0,37 cnf'.
We have grown the crystals of barium nitrate, of sodium nitrate and of the
KGW. Now the fabrication of the SRS active elements is in its progress - from the
first two crystals with the size 1OxlOx6O mm and from KGW crystal - 05x60 mm.
4. References
1. Yuri A. Anan'ev. Optical resonators and laser beams. Moscow, <<Nauka
publishers&, 1990, p. 87.
2. Optica i spectroscopiya. Volosov V.D., Kalinsev A.G. v.59, #5, p.10 8 1-10 84 .
3. L.T. Murray,R.C. Powell, N.Peyghambarian, D.Smith, W.Austin,R.A.Stolzenberger. Optics Letters, 1995, v.20, N9, p.1017-1019.
8