cs526 - advanced internet & web systems may 11, 2009 nathan archer
TRANSCRIPT

CS526 - Advanced Internet & Web SystemsMay 11, 2009Nathan Archer
Background
Websites compete based on usability & responsiveness
Offline load tests may not present realistic traffic.
End-to-end response times may not provide sufficient troubleshooting information.

Scope
Confine research to LAMP server (Linux, Apache, MySQL, PHP)
Monitoring methods should be minimally-intrusive- something that could realistically be used on a production system.
Basic Web Performance Tests A typical test:
Perform repeated “HTTP-GET” requests on a set of URLs & report measurements such as: File transfer time & throughput rate Connection time Number of concurrent connections Port-open time Service-connection time
Limitations: Real traffic is less homogenous (fewer cache hits in
real life) Little troubleshooting information (what caused the
delay?)
Why use logs?
Already well-integrated with system (low overhead, low development cost)
Can provide more detail for troubleshooting than end-to-end response times.
Another purpose: logs can be analyzed to produce real-world profiles of user requests Determine how users are really using the
website-what content is most important? Use data to create realistic traffic profiles for off-
line load testing Example tools: Analog, Webalyzer, etc. etc.
Drawbacks of Using Logging Logging adds overhead, worsening
the performance we are measuring
High-detail information may require some effort to customize scripts & search through log files

Potential Bottlenecks (1/2) Network
Web server CPU & RAM limitations Caching scheme Multi-threading configuration Network interface
File system Hard disk SAN or Network File System
Potential Bottlenecks (2/2) Application server
Scripting/programming technologies Database
Security SSL Firewall
Apache Logging Features
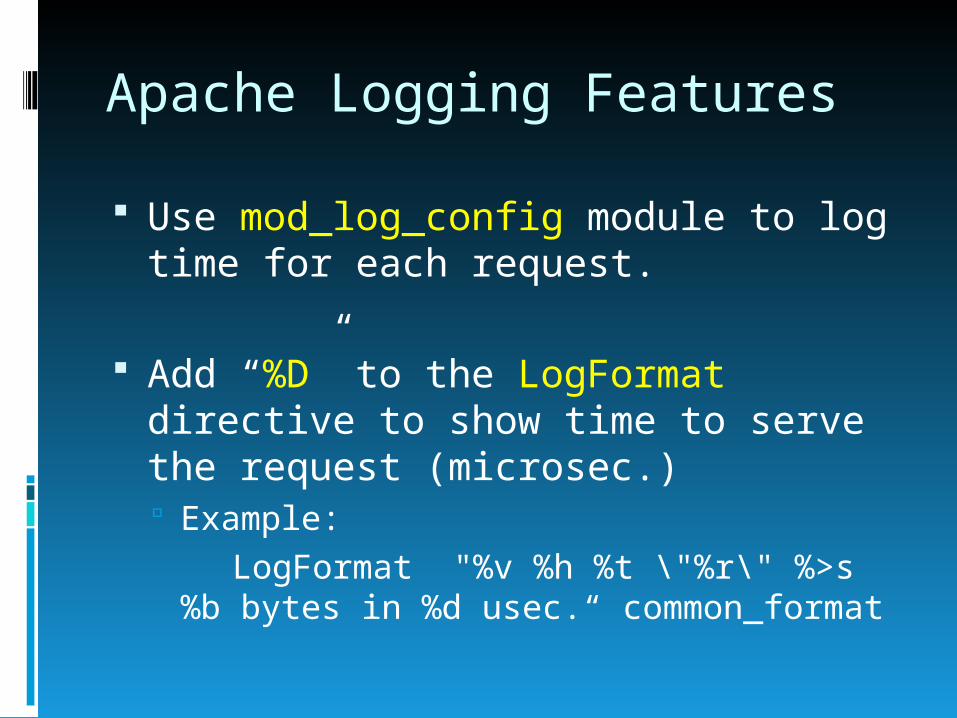
Use mod_log_config module to log time for each request.
Add “%D” to the LogFormat directive to show time to serve the request (microsec.) Example: LogFormat "%v %h %t \"%r\" %>s %b
bytes in %d usec.“ common_format

Adding More Detail Use CustomLog rule to filter on request: To filter on only PHP requests:
SetEnvIf Request_URI "(\.php)$" php_request CustomLog logs/imageAccess.log common
env=php_request
To filter on everything but HTML files: SetEnvIf Request_URI "(\.html|\.shtml)$" html_req CustomLog logs/nonHTMLAccess.log common
env=!html_req
http://www.serverwatch.com/tutorials/article.php/10825_3376671_2#condlogging

PHP Performance Logging No PHP logging solution available without running a
debugger.
However, we can customize PHP scripts to report run-time using microtime command.
Example timer class found at:http://www.phpclasses.org/browse/file/19094.html
Call start() & stop() to run timer. Add custom logging code in your own script.
http://www.phpguru.org/article/129

MySQL Performance Logging MySQL’s binary log keeps track of how long queries took.
To enable, invoke MySQL service with –log-bin=mylogfile option.
We can edit the config file to log the slowest queries- for example, those over 2 seconds: [mysqld]
log_slow_queries=/var/log/mysql_slow_query.loglong_query_time=2
http://homepage.mac.com/kelleherk/iblog/C711669388/E1631032272/index.html
Putting it all Together:A Proposed Monitoring Scheme Web server components each publish
logs on a shared network folder.
Every night, run a shell script to find the slowest requests for each server component from the logs.
If any Apache responses are > 2 sec., send an email alerting the webmaster.

Questions?