csc535 communication networks i chapter 3a: data transmission fundamentals dr. cheer-sun yang
TRANSCRIPT
CSC535 Communication Networks I
Chapter 3a:Data Transmission Fundamentals
Dr. Cheer-Sun Yang

2
Fundamental of CommunicationsFourier Series Approximation(section 3.3)Nyquist Theorem(section 3.4)Shannon’s Theorem(section 3.4)Line Encoding (section 3.5)Modulation and Demodulation (section
3.6)

Copyrighted by McGraw Hill (Leon-Garca and Widjaja) Communication Networks
3
Receiver
Communication channel
Transmitter
Figure 3.5
A Transmission System
....0110101 ....0110101
4
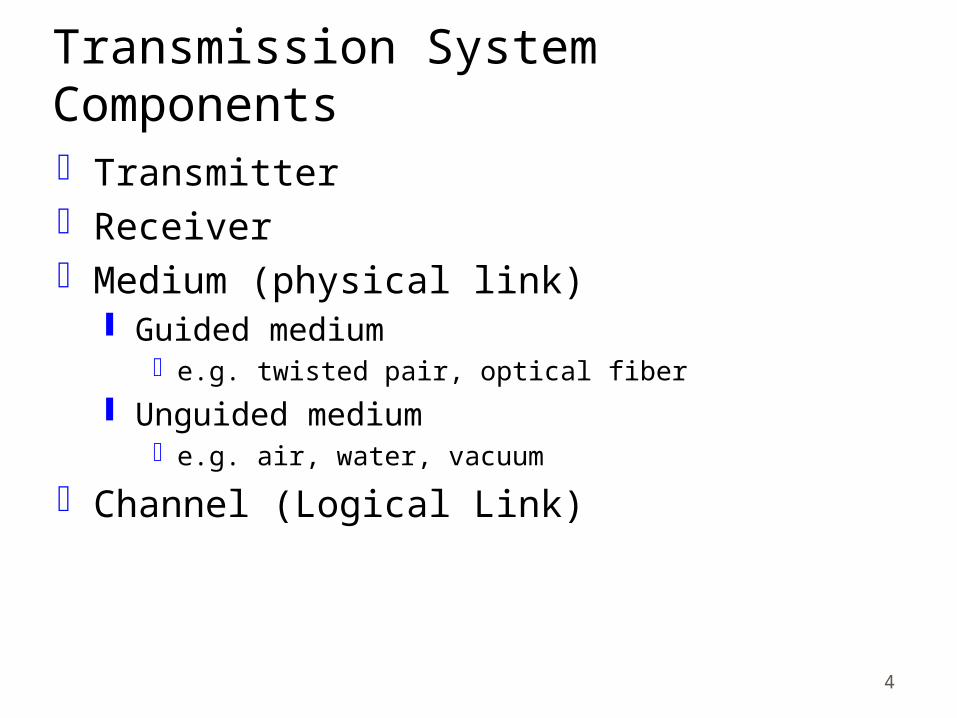
Transmission System ComponentsTransmitterReceiverMedium (physical link)
Guided mediume.g. twisted pair, optical fiber
Unguided mediume.g. air, water, vacuum
Channel (Logical Link)

5
Channel TypesDirect link
No intermediate devices
Point-to-point Direct link Only 2 devices share link
Multi-point More than two devices share the link

6
Signal ClassificationsContinuous signal
Amplitude changes in a smooth way over time
Discrete signalAmplitude maintains a constant level then changes
to another constant level
Periodic signalPattern repeated over time
Aperiodic signalPattern not repeated over time

7
Continuous & Discrete Signals

8
PeriodicSignals

9
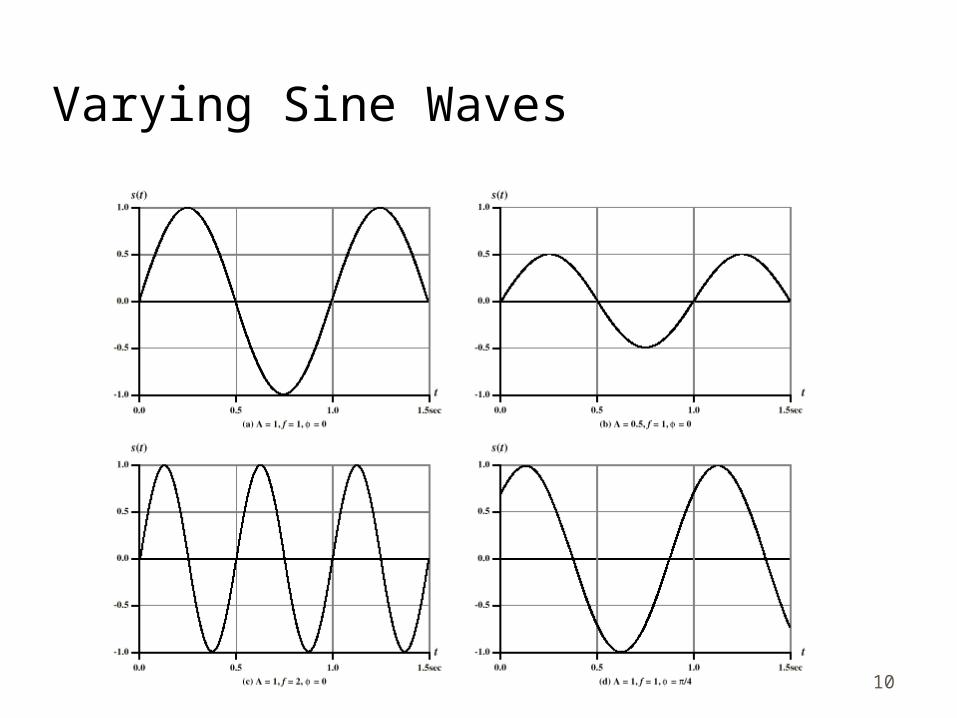
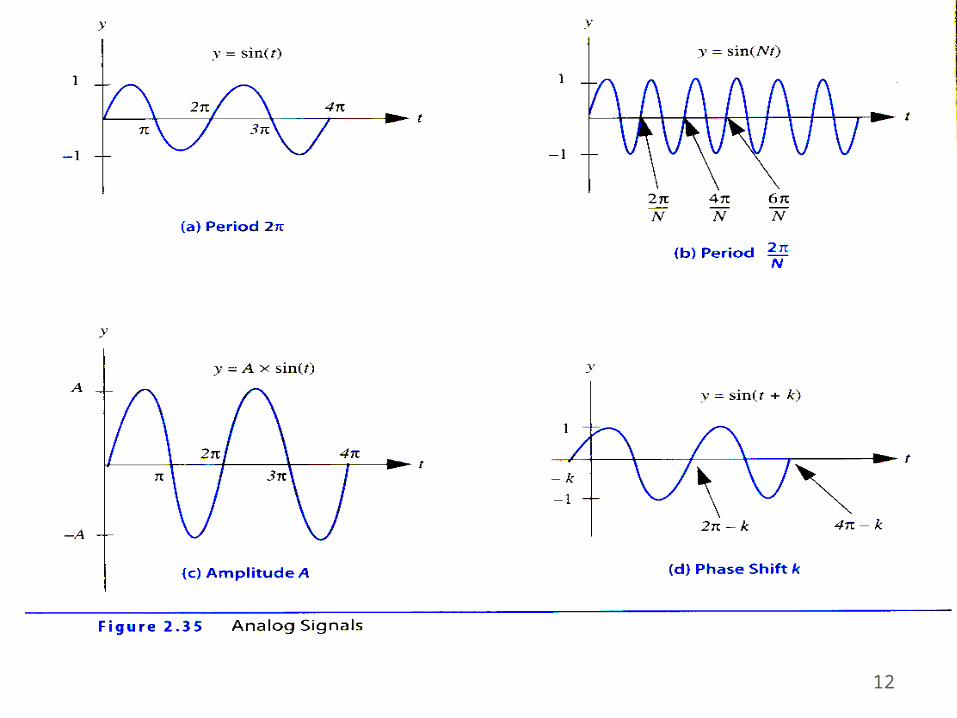
Properties of a Periodic SignalAmplitude (A)
maximum strength of signal unit: volts
Frequency (f) Rate of change of signal Hertz (Hz) or cycles per second Period = time for one repetition (T) T = 1/f
Phase () Relative position in time
10
Varying Sine Waves

11
WavelengthDistance occupied by one cycleDistance between two points of
corresponding phase in two consecutive cycles
Represented by the symbol Assuming signal velocity v
= vT f = v c = 3*108 ms-1 (speed of light in free space)
12

13
Characterizations of Communication ChannelsTime Domain Characterization -
represents the amplitude s(t) changes of a channel at different time
Frequency Domain Characterization - represents the amplitude s(f) of frequencies of a signal
14
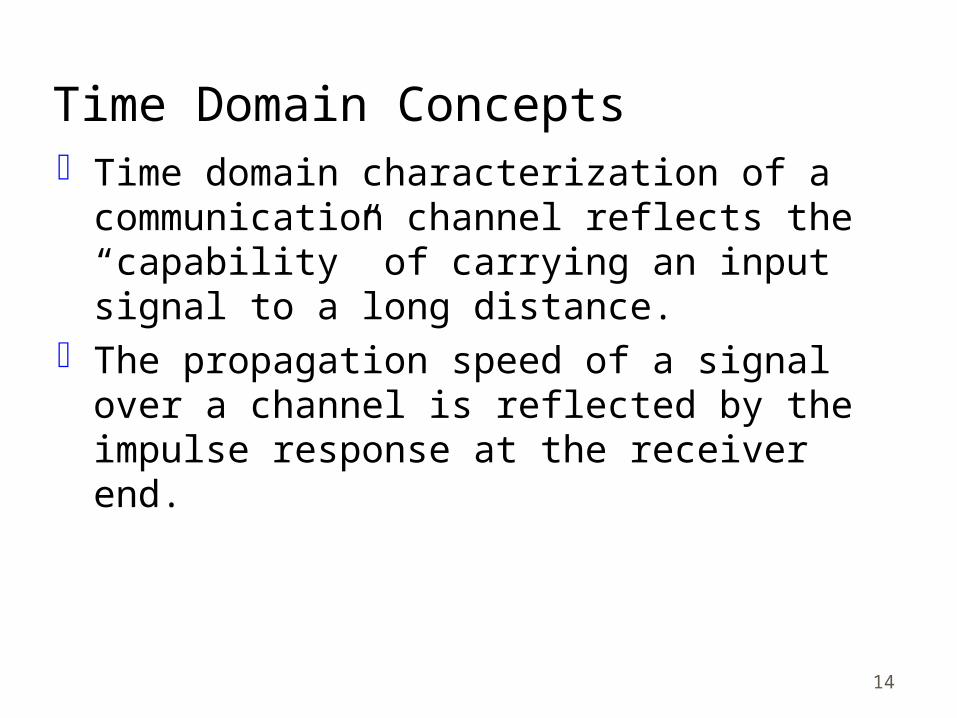
Time Domain ConceptsTime domain characterization of a
communication channel reflects the “capability” of carrying an input signal to a long distance.
The propagation speed of a signal over a channel is reflected by the impulse response at the receiver end.

Copyrighted by McGraw Hill (Leon-Garca and Widjaja) Communication Networks
15
Channel
t0t
h(t)
td
Figure 3.17
16
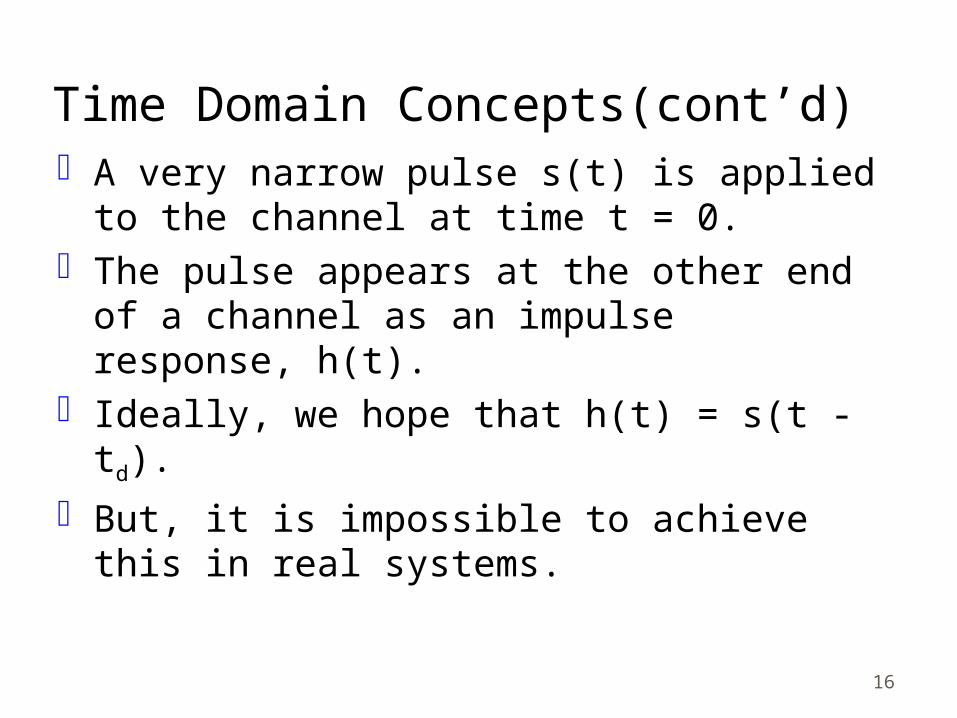
Time Domain Concepts(cont’d)A very narrow pulse s(t) is applied to the
channel at time t = 0.The pulse appears at the other end of a
channel as an impulse response, h(t).Ideally, we hope that h(t) = s(t - td).But, it is impossible to achieve this in real
systems.
17
Fourier Transform
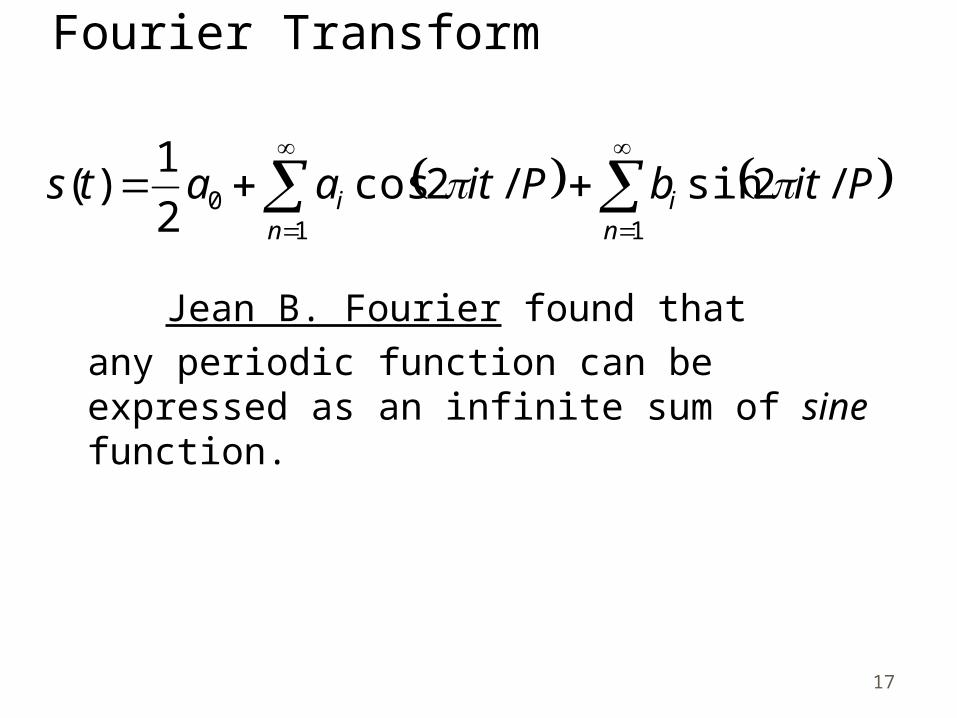
Jean B. Fourier found that any periodic function can be expressed as an infinite sum of sine function.
11
0 /2sin/2cos2
1)(
ni
ni PitbPitaats
18
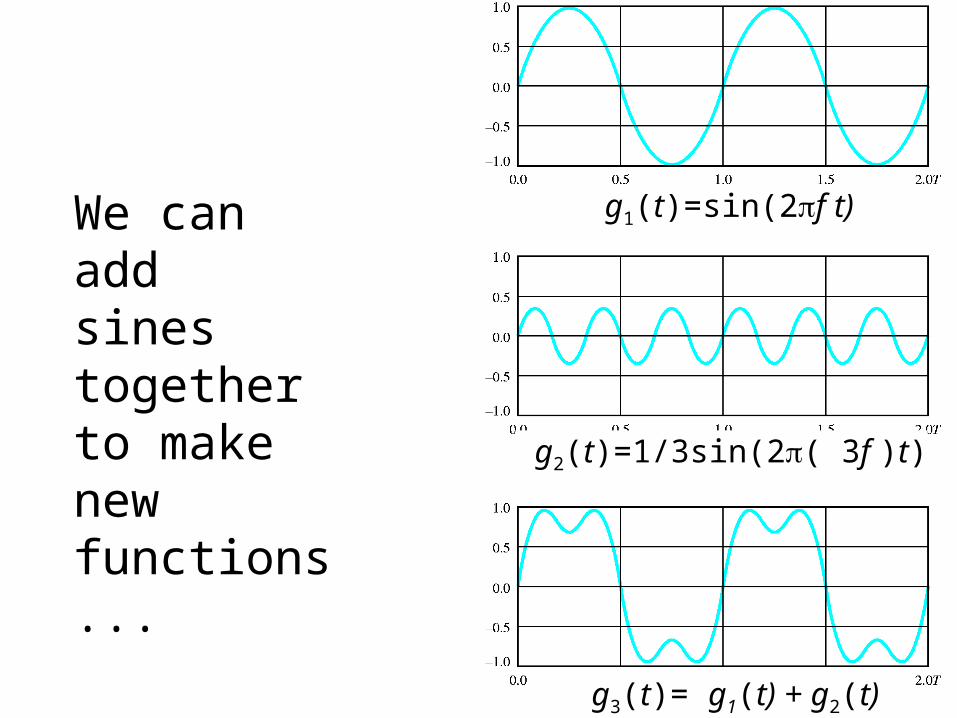
We can addsines together to make new functions...
g2(t)=1/3sin(2( 3f )t)
g1(t)=sin(2f t)
g3(t)= g1(t) + g2(t)

19
Addition of FrequencyComponents

20

Copyrighted by McGraw Hill (Leon-Garca and Widjaja) Communication Networks
21
1 0 0 0 0 0 0 1
. . . . . .
t
1 ms
Figure 3.15

Copyrighted by McGraw Hill (Leon-Garca and Widjaja) Communication Networks
22
- 1 . 5
- 1
- 0 . 5
0
0 . 5
1
1 . 5
0
0.125 0.2
5
0.375 0.5
0.625 0.7
5
0.875
1
- 1 . 5
- 1
- 0 . 5
0
0 . 5
1
1 . 5
0
0.125 0.2
5
0.375 0.5
0.625 0.7
5
0.875
1
- 1 . 5
- 1
- 0 . 5
0
0 . 5
1
1 . 5
0
0.125 0.2
5
0.375 0.5
0.625 0.7
5
0.875
1
( b ) 2 H a r m o n i c s
( c ) 4 H a r m o n i c s
( a ) 1 H a r m o n i c
Figure 3.16

23
Frequency Domain ConceptsSignal usually made up of many
frequenciesComponents are sine wavesCan be shown (Fourier analysis) that
any signal is made up of component sine waves
Can plot frequency domain functions

Copyrighted by McGraw Hill (Leon-Garca and Widjaja) Communication Networks
24
Channel
t t
Aincos 2ft Aoutcos (2ft + (f))
Aout
AinA(f) =
Figure 3.13

25
FrequencyDomain

26
Signal with DC Component
27
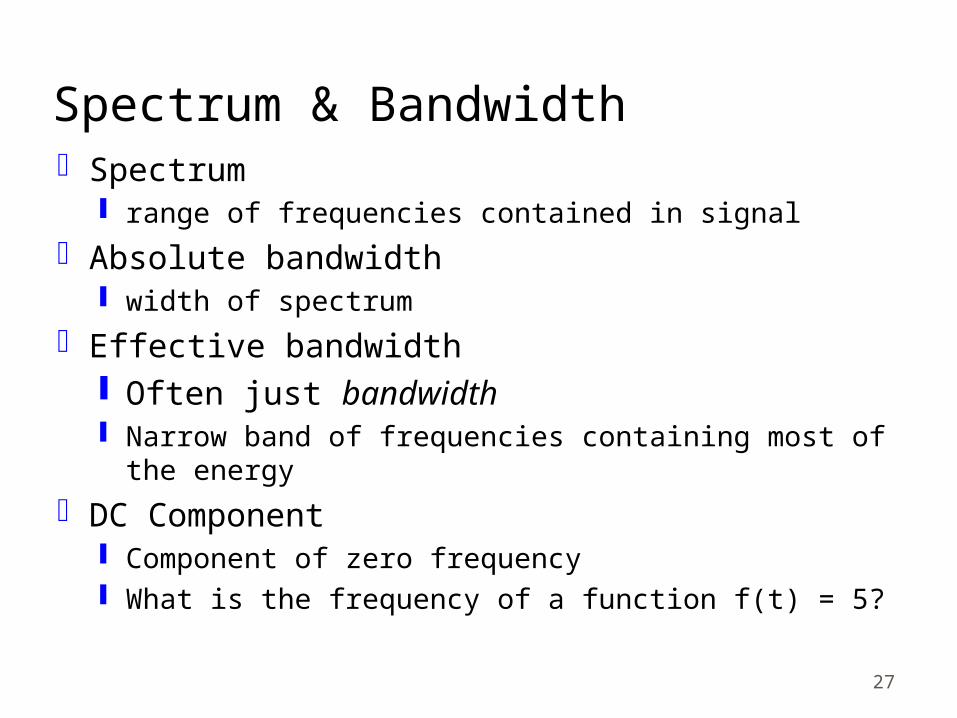
Spectrum & BandwidthSpectrum
range of frequencies contained in signal
Absolute bandwidth width of spectrum
Effective bandwidth Often just bandwidth Narrow band of frequencies containing most of the
energy
DC Component Component of zero frequency What is the frequency of a function f(t) = 5?

28
Analog and Digital Data TransmissionData
Entities that convey meaning
Signals Electric or electromagnetic representations of
data
Transmission Communication of data by propagation and
processing of signals
From now on, we can assume that a bit stream can be transmitted via a physical link using pulses or sine waves.

Copyrighted by McGraw Hill (Leon-Garca and Widjaja) Communication Networks
29
communication channel
d meters
0110101... 0110101...
Figure 3.10

30
Transmission SpeedAlso known as bit rate with the unit of
bits/sec.We need to measure how fast a signal can
be transmitted by a transmitter: transmission speed
We also are interested in how fast a signal can be propagated through a physical link: propagation speed

31
DataAnalog
Continuous values within some interval e.g. sound, video
Digital Discrete values e.g. text, integers

32
SignalsMeans by which data are propagatedAnalog
Continuously variable Various media
wire, fiber optic, space
Speech bandwidth 100Hz to 7kHz Telephone bandwidth 300Hz to 3400Hz Video bandwidth 4MHz
Digital Use two DC components

33
Data and SignalsUsually use digital signals for digital data
and analog signals for analog dataCan use analog signal to carry digital data
Modem
Can use digital signal to carry analog data Compact Disc audio

34
Analog SignalsDigital computers are incompatible with
analog transmission media such as phone lines.
How can one use analog signals to represent digital data bits?
We need to convert digital data to analog signal at the sender side and convert analog data back to digital data at the receiver side.
35
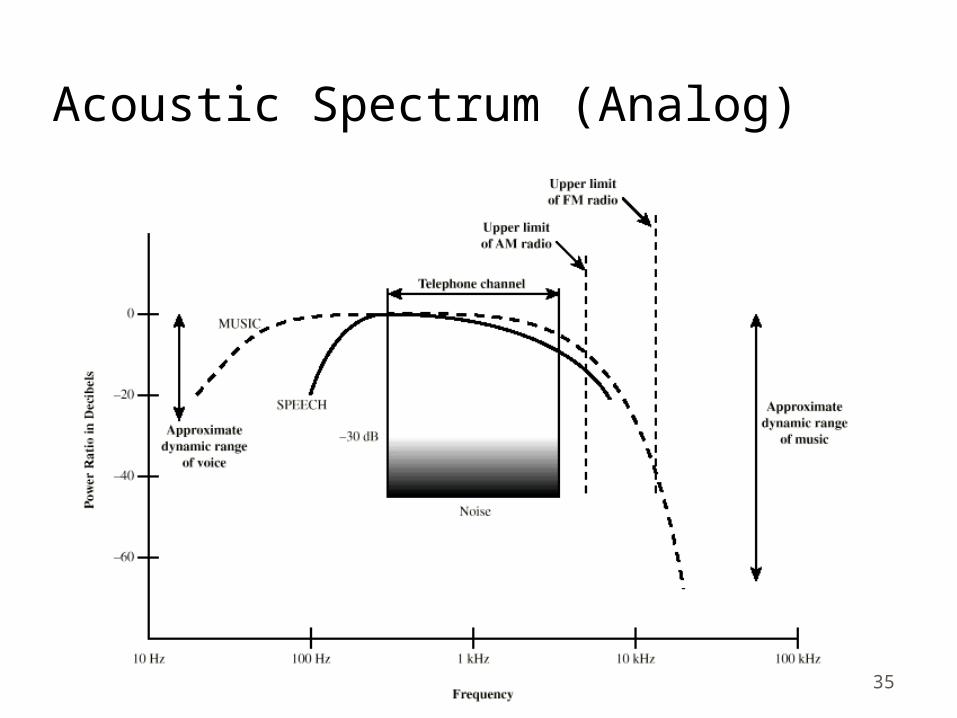
Acoustic Spectrum (Analog)

36
Analog Signals Carrying Analog and Digital Data

37
Digital Signals Carrying Analog and Digital Data

38
Analog TransmissionAnalog signal transmitted without regard
to contentMay be analog or digital dataAttenuated over distance Use amplifiers to boost signalAlso amplifies noise

39
Digital TransmissionConcerned with contentIntegrity endangered by noise,
attenuation etc.Repeaters usedRepeater receives signalExtracts bit patternRetransmitsAttenuation is overcomeNoise is not amplified

40
Advantages of Digital TransmissionDigital technology
Low cost LSI/VLSI technology
Data integrity Longer distances over lower quality lines
Capacity utilization High bandwidth links economical High degree of multiplexing easier with digital techniques
Security & Privacy Encryption
Integration Can treat analog and digital data similarly

Copyrighted by McGraw Hill (Leon-Garca and Widjaja) Communication Networks
41
(a) Analog transmission: all details must be reproduced accurately
Sent
Sent
Received
Received
• e.g digital telephone, CD Audio
(b) Digital transmission: only discrete levels need to be reproduced
• e.g. AM, FM, TV transmission
Figure 3.6

42
Transmission ImpairmentsSignal received may differ from signal
transmittedAnalog - degradation of signal qualityDigital - bit errorsCaused by
Attenuation and attenuation distortion Delay distortion Noise
43
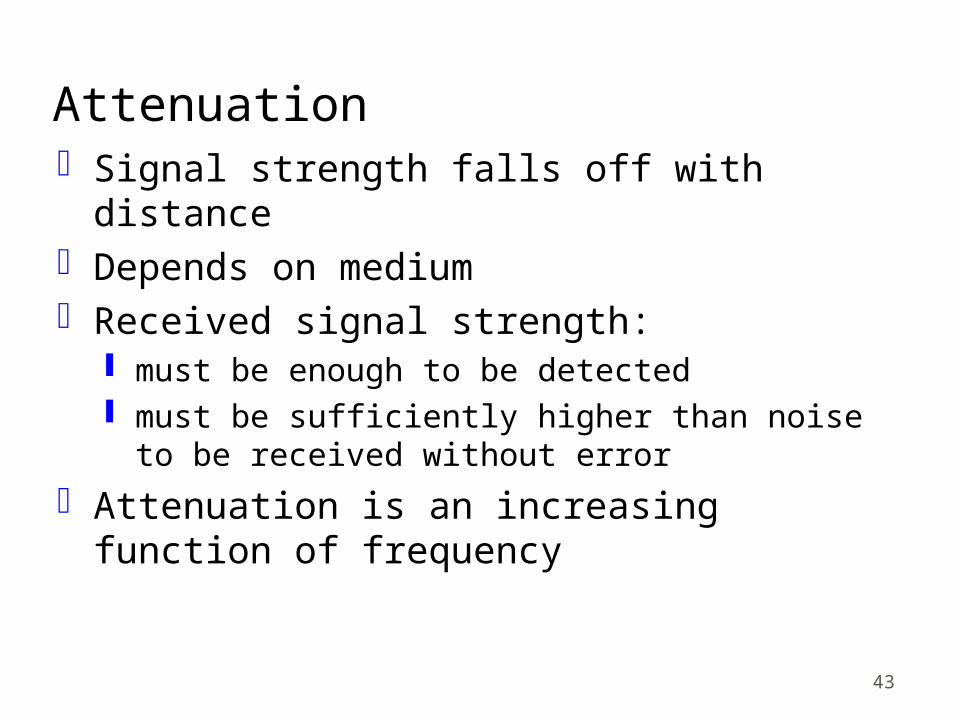
AttenuationSignal strength falls off with distanceDepends on mediumReceived signal strength:
must be enough to be detected must be sufficiently higher than noise to be
received without error
Attenuation is an increasing function of frequency

Copyrighted by McGraw Hill (Leon-Garca and Widjaja) Communication Networks
44
AmplifierEqualizer
TimingRecovery
Decision Circuit.& SignalRegenerator
Figure 3.9
45
Delay DistortionOnly in guided mediaPropagation velocity varies with frequency

46
Noise (1)Additional signals inserted between
transmitter and receiverThermal
Due to thermal agitation of electrons Uniformly distributed White noise
Intermodulation Signals that are the sum and difference of
original frequencies sharing a medium

47
Noise (2)Crosstalk
A signal from one line is picked up by another
Impulse Irregular pulses or spikes e.g. External electromagnetic interference Short duration High amplitude
Copyrighted by McGraw Hill (Leon-Garca and Widjaja) Communication Networks
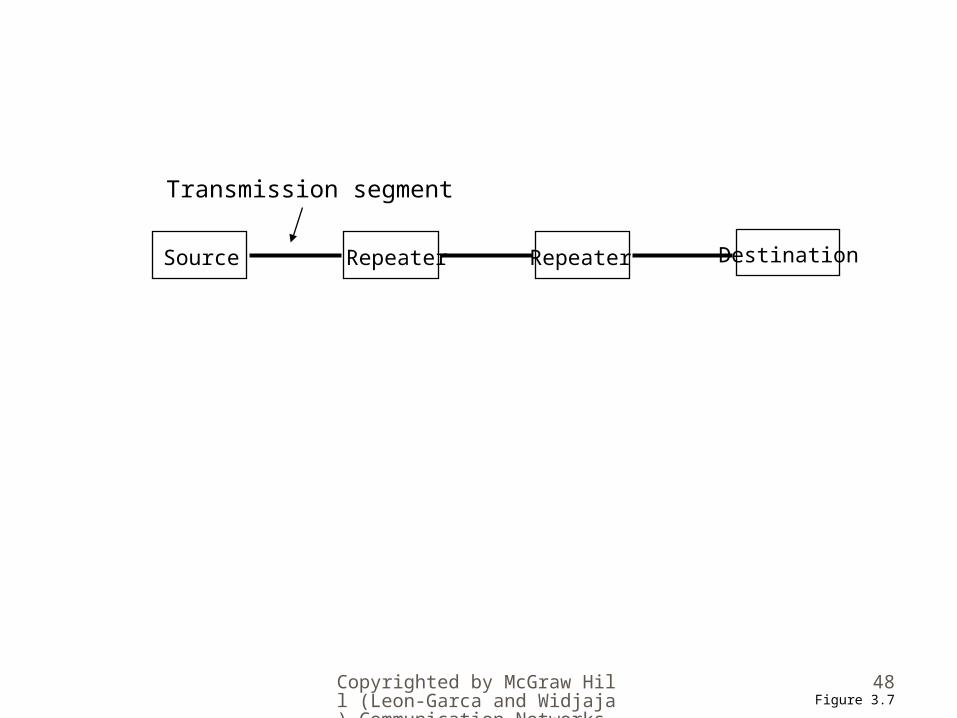
48
Source Repeater DestinationRepeater
Transmission segment
Figure 3.7

Copyrighted by McGraw Hill (Leon-Garca and Widjaja) Communication Networks
49
Attenuated & distorted signal +
noise
EqualizerRecovered signal
+residual noise
Repeater
Amp.
Figure 3.8
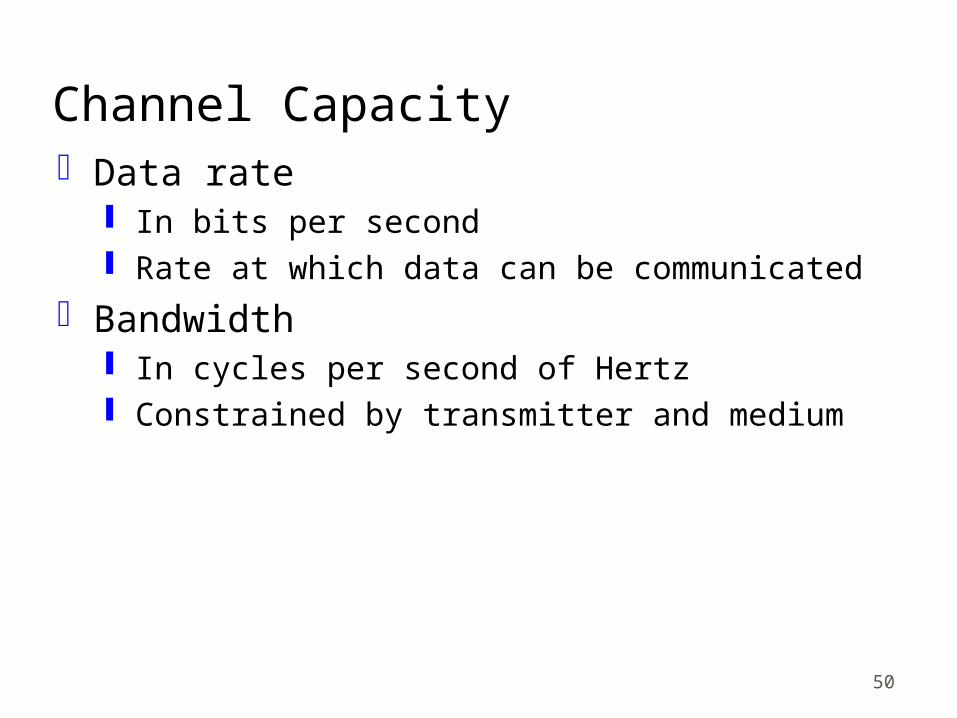
50
Channel CapacityData rate
In bits per second Rate at which data can be communicated
Bandwidth In cycles per second of Hertz Constrained by transmitter and medium

Copyrighted by McGraw Hill (Leon-Garca and Widjaja) Communication Networks
51
f0 W
A(f)
(a) Lowpass and idealized lowpass channel
(b) Maximum pulse transmission rate is 2W pulses/second
0 Wf
A(f)1
Channel
tt
Figure 3.11

52
Bandwidth RevisitedA transmission channel can be characterized
by the signals within a certain frequency ranges.
If a channel allows low frequency signals to pass, it is called a low-pass channel.
If a channel allows high frequency signals to pass, it is called a high-pass channel.
The bandwidth of a channel is defined as the range of fequencies that is passed by a channel.
First major theorem: Nyquist’s Result

53
Bit Rate and BandwidthFirst major theorem: Nyquist’s ResultThe bit rate at which pulses can be
transmitted over a channel is proportional to the bandwidth.
In essence, if a channel has a bandwidth W, the narrowest pulse that can be transmitted over the channel has width = 1/2W seconds.
Thus the fastest rate at which pulses can be transmitted into the channel is given by the Nyquist rate: rmax = 2W pulses/second.
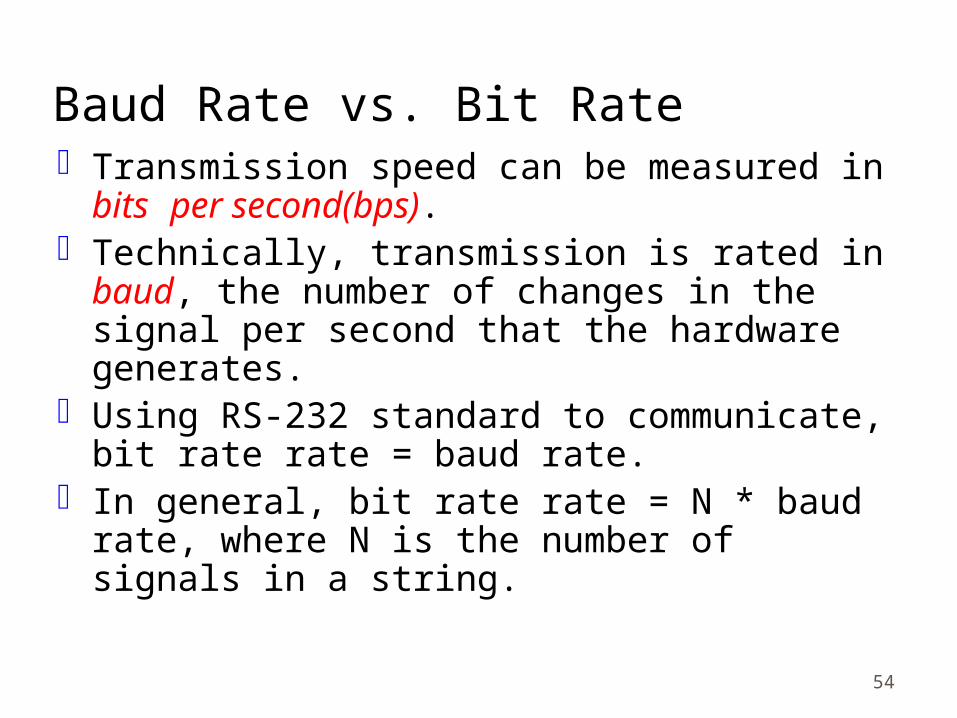
54
Baud Rate vs. Bit RateTransmission speed can be measured in
bits per second(bps).Technically, transmission is rated in baud,
the number of changes in the signal per second that the hardware generates.
Using RS-232 standard to communicate, bit rate rate = baud rate.
In general, bit rate rate = N * baud rate, where N is the number of signals in a string.

55
Baud Rate vs. Bit Rate Sender sends the bit string, by b1 b2 … bn. The transmitter alternately analyzes each string
and transmits a signal component uniquely determined by the bit values. Once the component is sent, the transmitter gets another bit string and repeats this process.
The different signal components make up the actual transmitted signal. The frequency with which the components change is the baud rate.
At the receiving end, the process is reversed.The receiver alternately samples the incoming signal and generates a bit string.
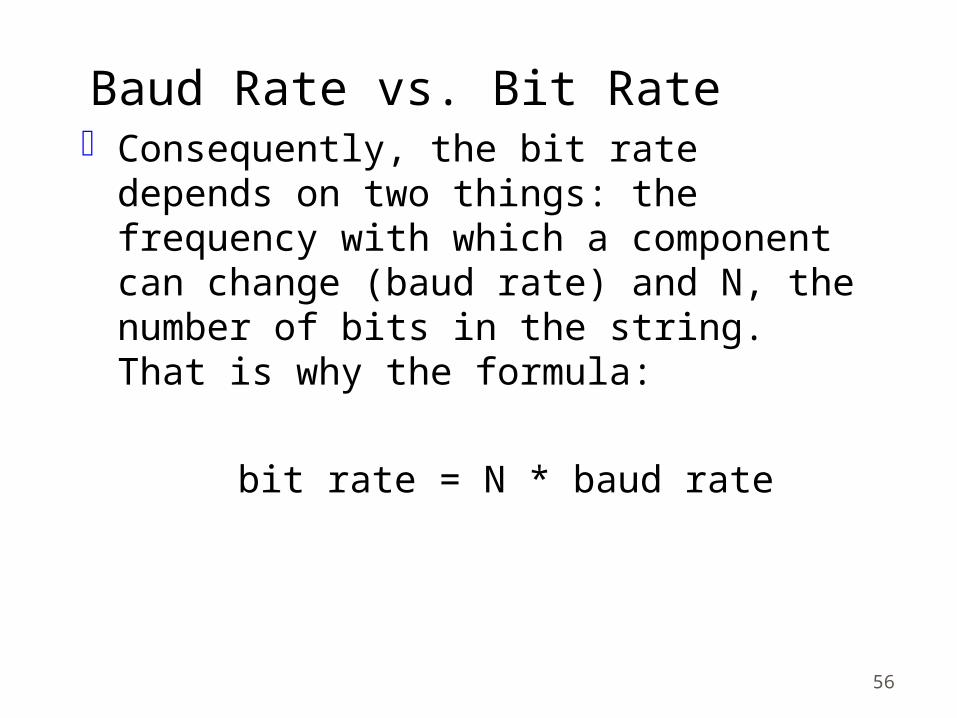
56
Baud Rate vs. Bit RateConsequently, the bit rate depends on
two things: the frequency with which a component can change (baud rate) and N, the number of bits in the string. That is why the formula:
bit rate = N * baud rate

57
Nyquist Sampling Theorem Due to Harry Nyquist (1920) Nyquist showed that if F is the maximum
frequency the medium can transmit, the receiver can completely reconstruct by sampling it 2ƒ times per second on a perfectly noiseless channel.
In other words, the receiver can reconstruct the signal by sampling it at intervals of 1/(2f) second.
For example, if the max frequency is 4000 Hz, the receiver needs to sample the signal 8000 times per second or using 2ƒ as the baud rate.
Bit rate = 2ƒ * N.

Copyrighted by McGraw Hill (Leon-Garca and Widjaja) Communication Networks
58
+A
-A0 T 2T 3T 4T 5T
1 1 1 10 0
Transmitter Filter
Comm. Channel
Receiver Filter Receiver
r(t)
Received signal
t
Figure 3.19

59
Data Rate and Bandwidth It looks like that one can increase the
bandwidth W of a channel to achieve a higher bit rate r without considering the actual characteristics of a transmission link.
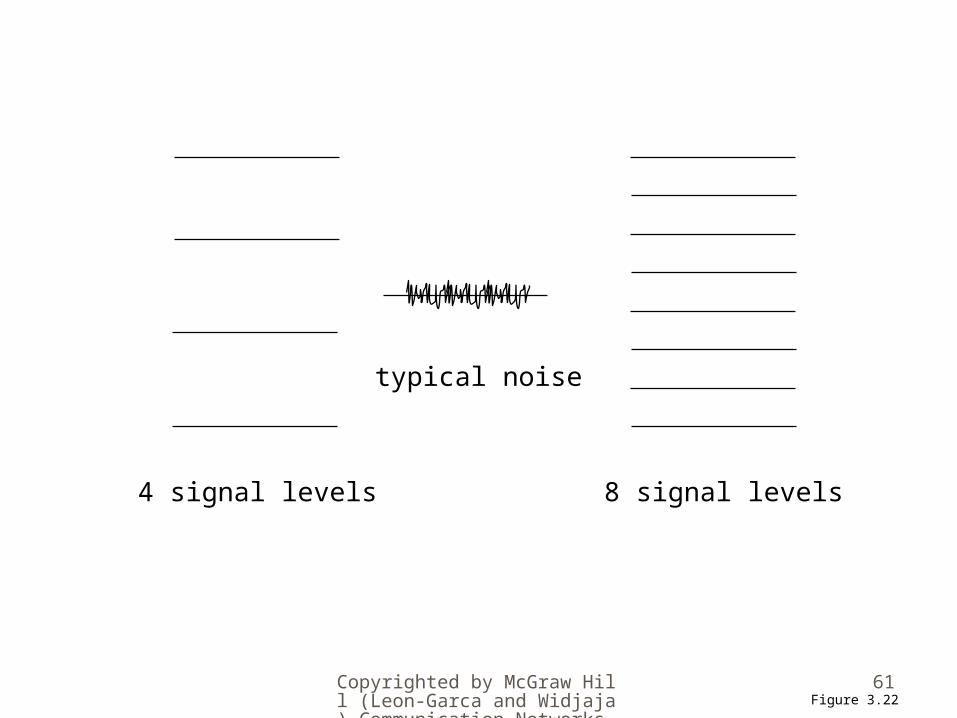
In fact, any transmission system has a limited band of frequencies. For example, a channel can use +5V as bit 1, -5V as bit 0; a channel may also be able to use +5V as ‘11’, +3V as ‘10’, -3V as ‘01’, and -5V as ‘00’. We are actually dividing the frequency range of F(=1/T) for representing 2 bits into that for representing 4 bits.

60
Data Rate and Bandwidth
Question: Can we keep increasing the
bandwith or dividing the bandwidth to increase the bit rate?
Copyrighted by McGraw Hill (Leon-Garca and Widjaja) Communication Networks
61
4 signal levels 8 signal levels
typical noise
Figure 3.22

62
Data Rate and Bandwidth In fact, any transmission system has a limited
band of frequencies. We cannot increase the bandwidth indefinitely. Signals can be impaired.
We cannot keep dividing the total frequency range into smaller ranges since the receiver will become harder to distinguish one frequency from another.
This also limits the data rate a channel can achieve.
This leads to the second major result: Shannon’s Theorem

63
Any Limit on Bit Rate?
The formula that Bit rate = 2ƒ * N seems to imply that there is no upper bound for the data rate given the maximum frequency. Unfortunately, this is not true for two reasons.
64
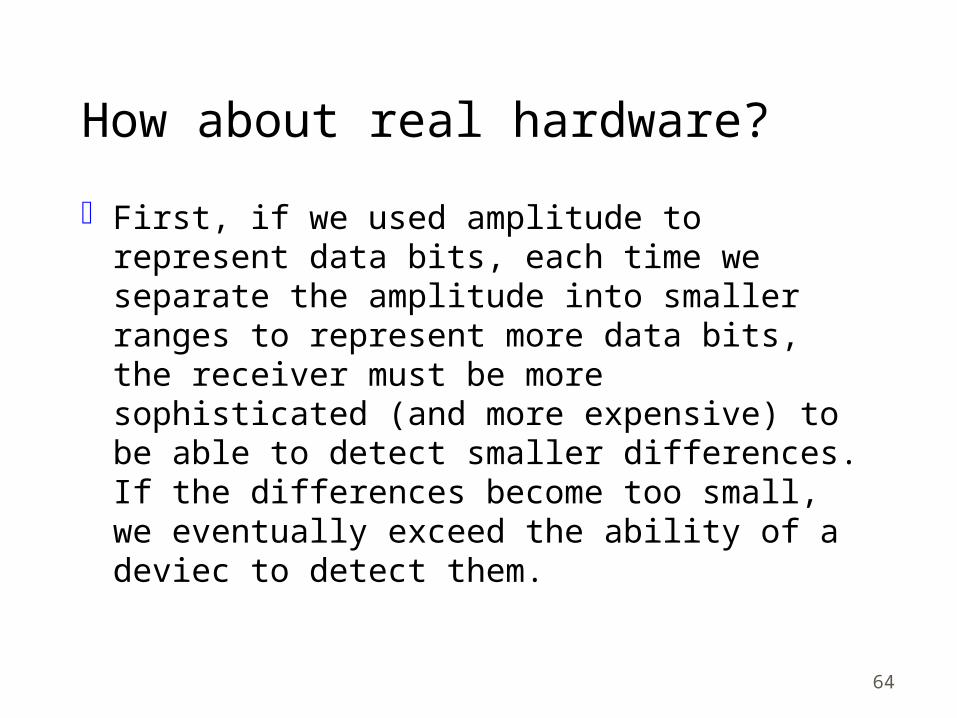
How about real hardware?
First, if we used amplitude to represent data bits, each time we separate the amplitude into smaller ranges to represent more data bits, the receiver must be more sophisticated (and more expensive) to be able to detect smaller differences. If the differences become too small, we eventually exceed the ability of a deviec to detect them.

65
How about real hardware?
Second, many channels are actually subject to noise.

66
Limitation on Real Hardware

67
Signal-to-Noise Ratio
Electrical engineers uses S/N to indicate the quality of sound. The higher the ration is, the better the quality is.
B = log 10 (S/N) bels, where B is the quality rate.
S/N is known as the signal-to-noise ratio.Quality of sound is measured in decibles
(abbreviated dB) or bels (1 dB = 0.1 Bel).
If B=2.5 bels, then S = ___________N?
Copyrighted by McGraw Hill (Leon-Garca and Widjaja) Communication Networks
68
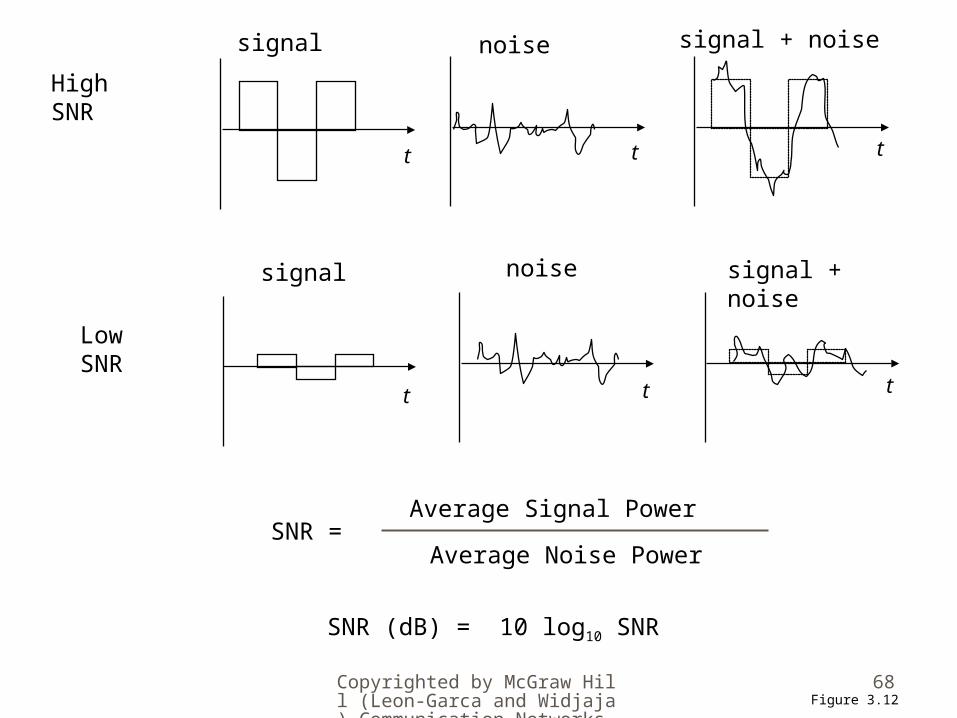
signal noise signal + noise
signal noise signal + noise
HighSNR
LowSNR
SNR = Average Signal Power
Average Noise Power
SNR (dB) = 10 log10 SNR
t t t
t t t
Figure 3.12

69
Shannon’s TheoremBit rate = Bandwidth * log 2 (1+S/N) bps.According to this result, a bit rate around
35,000 bps is an upper limit for conventional modems.

70
Example of Shannon’s TheoremBandwidth = 3000 Hz, Quality rate = 35 dB or 3.5 bels, What is the bit rate?Please work with your neighbors now.Hint: You must find S/N first.
71
Reading MaterialDon’t read sections 3.2 and 3.3 now. You
may get confused.