cse 442 - data visualization hierarchies
TRANSCRIPT

CSE 442 - Data Visualization
Hierarchies
Jeffrey Heer University of Washington
Today: Visualizing Hierarchical Data Next Time: Visualizing Network Data
Goals Overview of layout approaches Assess strengths and weaknesses Insight into implementation techniques
Graphs and Trees
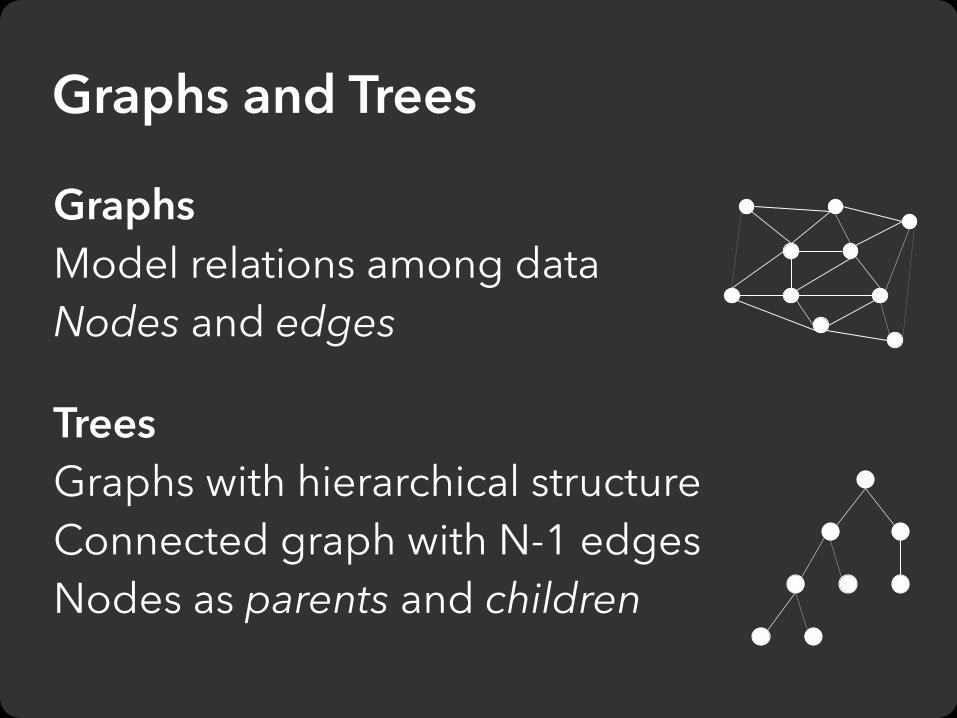
Graphs Model relations among data Nodes and edges
Trees Graphs with hierarchical structure Connected graph with N-1 edges Nodes as parents and children
Graphs and Trees

A primary concern of tree/graph drawing is the spatial arrangement of nodes and edges.
Often (but not always) the goal is to effectively depict the graph structure: - Connectivity, path-following - Topological distance - Clustering / grouping - Ordering (e.g., hierarchy level)
Spatial Layout

Indentation Linear list, indentation encodes depth
Node-Link diagrams Nodes connected by lines/curves
Enclosure diagrams Represent hierarchy by enclosure Layering Relative position and alignment
Typically fast: O(n) or O(n log n), interactive layout
Tree Visualization

Interactive Layout Demo (requires Flash Player)

Tree Layout

Places all items along vertically spaced rows Indentation used to show parent/child relationships Commonly used as a component in an interface Breadth and depth contend for space Often requires a great deal of scrolling
Indentation
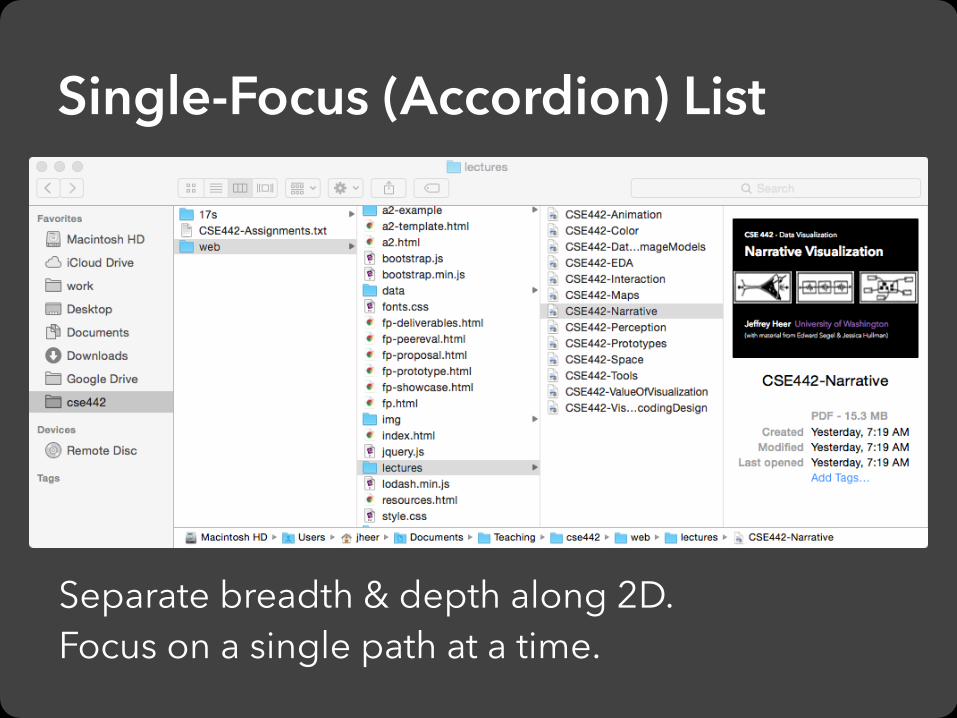
Single-Focus (Accordion) List
Separate breadth & depth along 2D. Focus on a single path at a time.
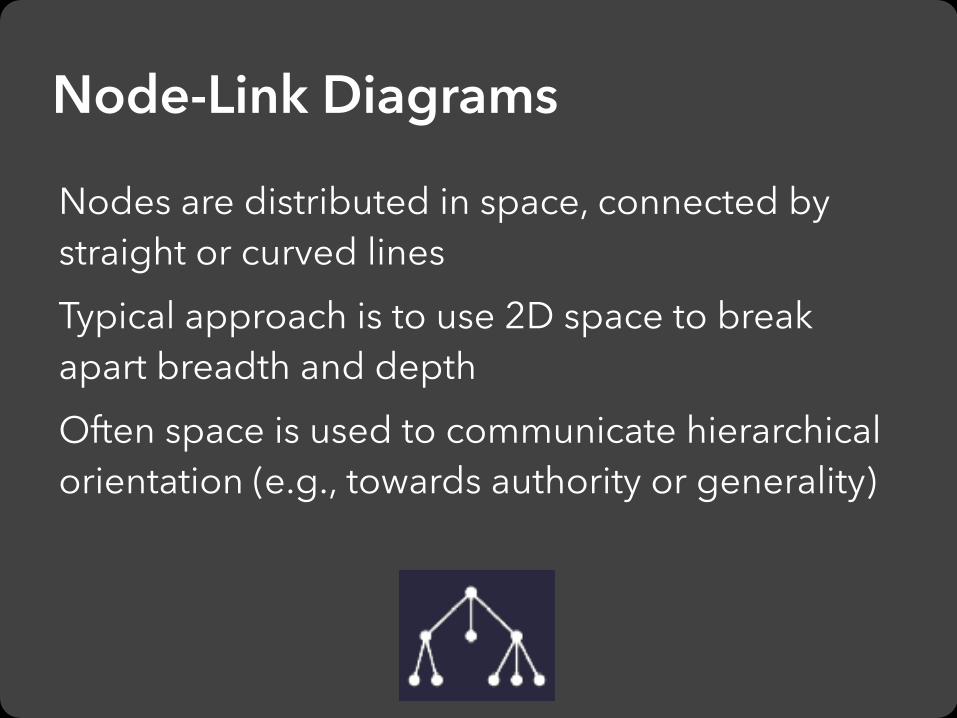
Nodes are distributed in space, connected by straight or curved lines Typical approach is to use 2D space to break apart breadth and depth Often space is used to communicate hierarchical orientation (e.g., towards authority or generality)
Node-Link Diagrams

Naïve Recursive Layout
Repeatedly divide space for subtrees by leaf count ▪ Breadth of tree along one dimension ▪ Depth along the other dimension

Naïve Recursive Layout
Repeatedly divide space for subtrees by leaf count ▪ Breadth of tree along one dimension ▪ Depth along the other dimension Problem: exponential growth of breadth
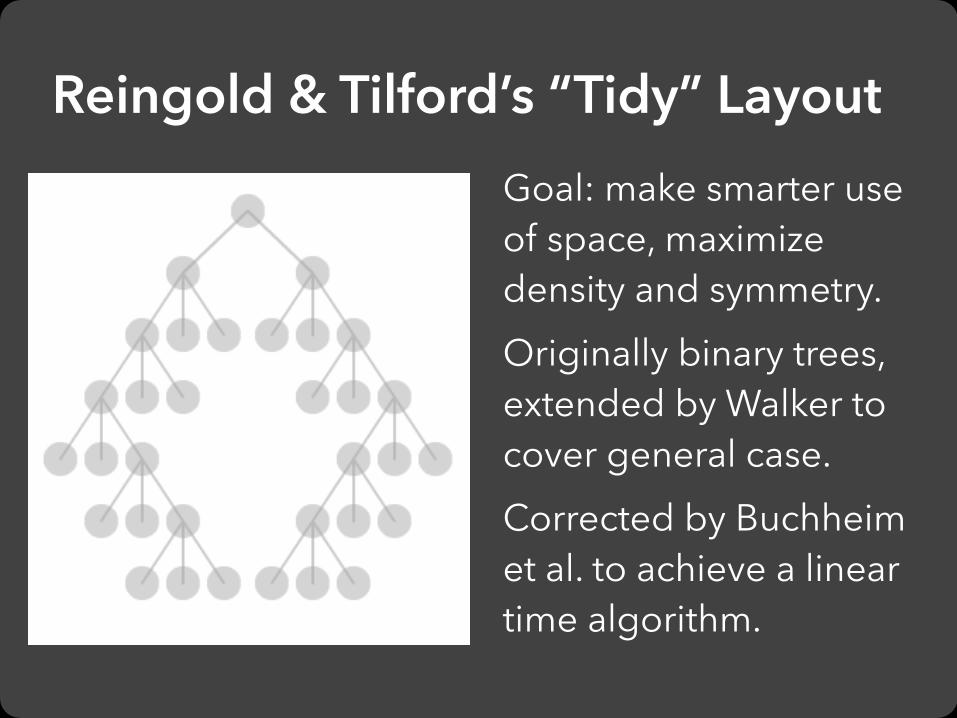
Goal: make smarter use of space, maximize density and symmetry. Originally binary trees, extended by Walker to cover general case. Corrected by Buchheim et al. to achieve a linear time algorithm.
Reingold & Tilford’s “Tidy” Layout

Design Considerations Clearly encode depth level No edge crossings Isomorphic subtrees drawn identically Ordering and symmetry preserved Compact layout (don’t waste space)
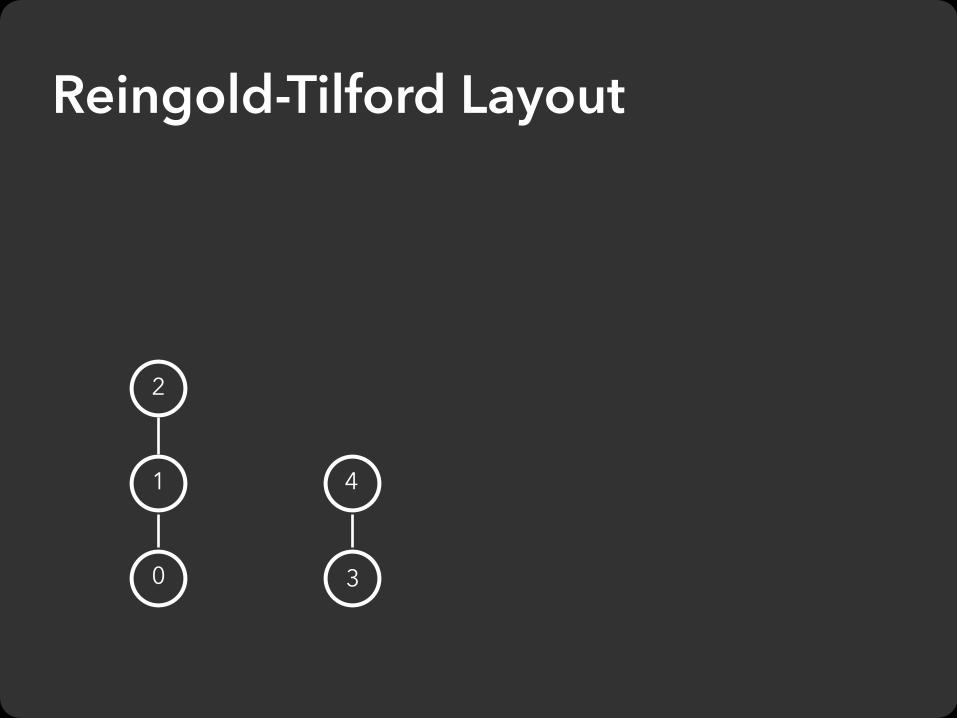
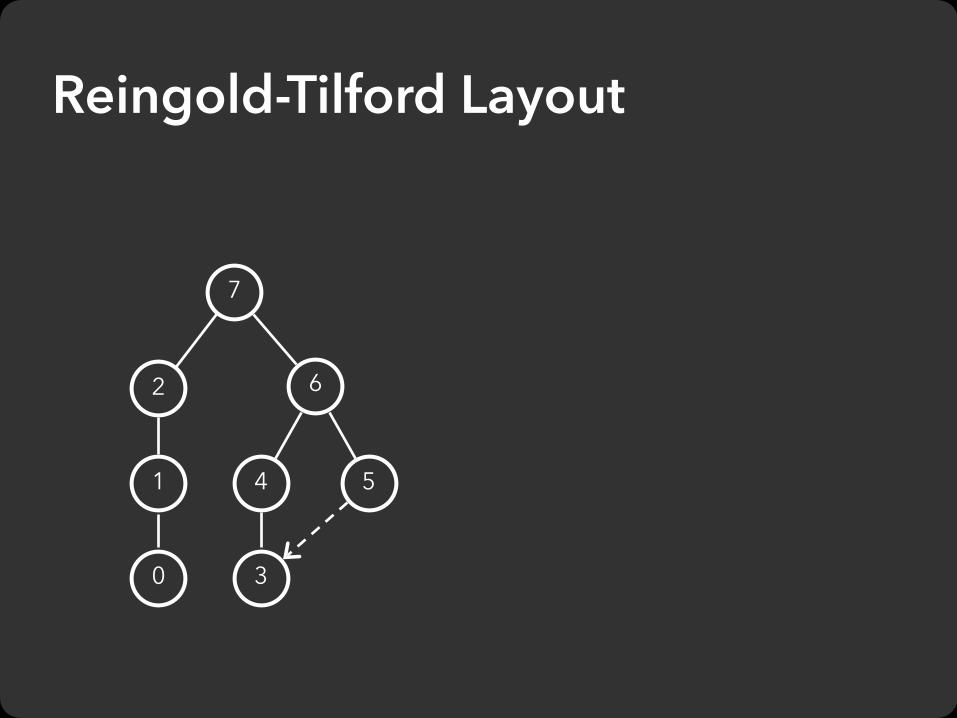
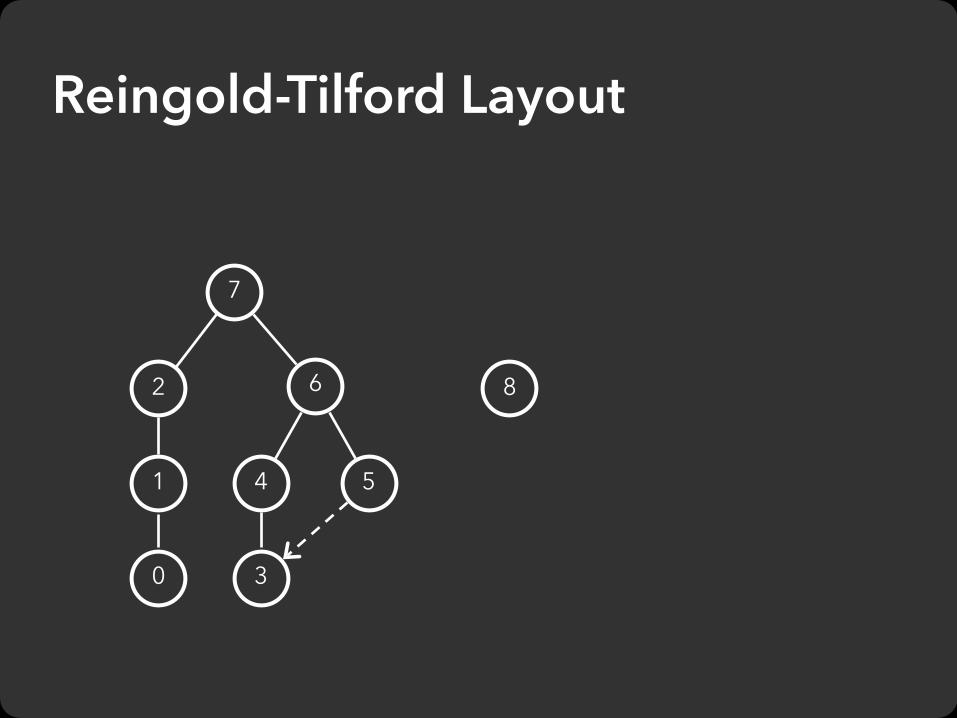
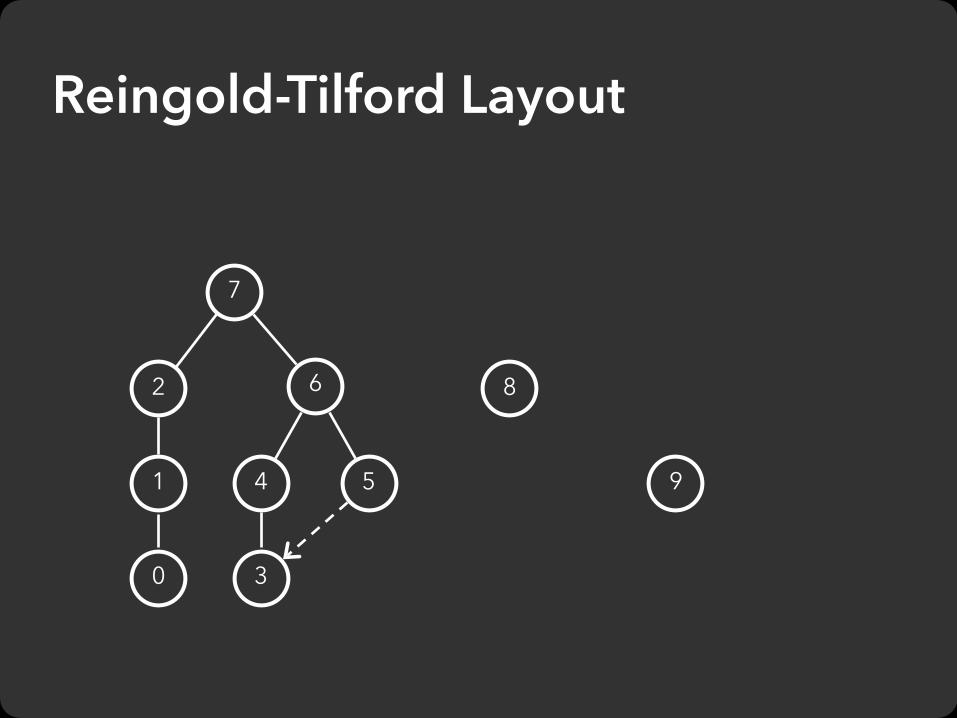
Reingold-Tilford Layout
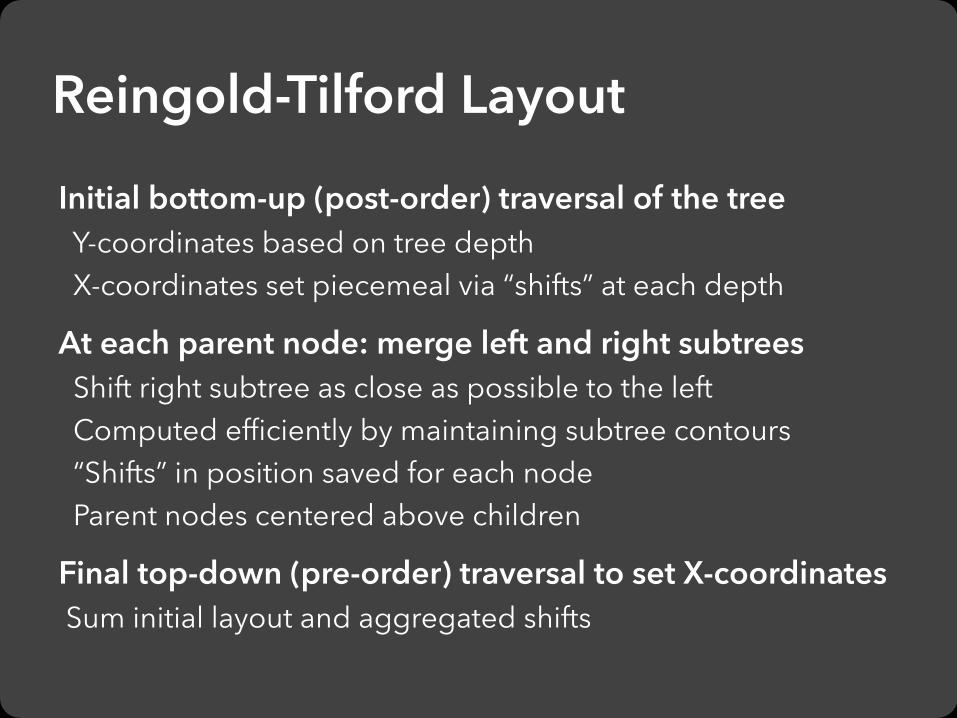
Initial bottom-up (post-order) traversal of the tree Y-coordinates based on tree depth X-coordinates set piecemeal via “shifts” at each depth
At each parent node: merge left and right subtrees Shift right subtree as close as possible to the left Computed efficiently by maintaining subtree contours “Shifts” in position saved for each node Parent nodes centered above children
Final top-down (pre-order) traversal to set X-coordinates Sum initial layout and aggregated shifts
Reingold-Tilford Layout

0
1
2
7
6
4
3
5
8 10
9
11
12
Reingold-Tilford Layout

Reingold-Tilford Layout
0

Reingold-Tilford Layout
0
1

Reingold-Tilford Layout
0
1
2

Reingold-Tilford Layout
0
1
2
3
4
Reingold-Tilford Layout
0
1
2
3

0
1
2
4
3
5
Reingold-Tilford Layout

0
1
2
4
3
5
Reingold-Tilford Layout

0
1
2
4
3
5
Reingold-Tilford Layout

0
1
2
4
3
5
Reingold-Tilford Layout

0
1
2
4
3
5
Reingold-Tilford Layout

0
1
2 6
4
3
5
Reingold-Tilford Layout

0
1
2 6
4
3
Reingold-Tilford Layout
5

0
1
2 6
4
3
5
Reingold-Tilford Layout

0
1
2 6
4
3
5
Reingold-Tilford Layout
0
1
2
7
6
4
3
5
Reingold-Tilford Layout
0
1
2
7
6
4
3
5
8
Reingold-Tilford Layout
0
1
2
7
6
4
3
5
8
9
Reingold-Tilford Layout

0
1
2
7
6
4
3
5
8 10
9
Reingold-Tilford Layout

0
1
2
7
6
4
3
5
8 10
9
Reingold-Tilford Layout

0
1
2
7
6
4
3
5
8 10
9
Reingold-Tilford Layout

0
1
2
7
6
4
3
5
8 10
9
Reingold-Tilford Layout

0
1
2
7
6
4
3
5
8 10
9
Reingold-Tilford Layout

0
1
2
7
6
4
3
5
8 10
9
11
Reingold-Tilford Layout

0
1
2
7
6
4
3
5
8 10
9
11
Reingold-Tilford Layout

0
1
2
7
6
4
3
5
8 10
9
11
Reingold-Tilford Layout

0
1
2
7
6
4
3
5
8 10
9
11
Reingold-Tilford Layout

0
1
2
7
6
4
3
5
8 10
9
11
Reingold-Tilford Layout

0
1
2
7
6
4
3
5
8 10
9
11
12
Reingold-Tilford Layout

Depicts cluster trees produced by hierarchical clustering algorithms.
Leaf nodes arranged in a line, internal node depth indicates order/value at which clusters merge.
Naïve recursive layout with orthogonal two-segment edges.
Cluster Dendrograms

Node-link diagram in polar co-ordinates.
Radius encodes depth, with root in the center.
Angular sectors assigned to subtrees (often with naïve recursive layout).
Reingold-Tilford method can also be applied here.
Radial Tree Layout

Layout in 3D to form Cone Trees.
Balloon Trees can be described as a 2D variant of a Cone Tree. Not just a flattening process: circles must not overlap.
Circular Tree Layout

Focus + Context

………
Indented Layout Reingold-Tilford Layout
Visualizing Large Hierarchies

Scale Tree breadth often grows exponentially Even with tidy layout, quickly run out of space
Possible Solutions Filtering Focus+Context Scrolling or Panning Zooming Aggregation
More Nodes, More Problems…

MC Escher, Circle Limit IV

Perform tree layout in hyperbolic geometry, project the result on to the Euclidean plane.
Why? Like tree breadth, the hyperbolic plane expands exponentially!
Also computable in 3D, projected into a sphere.
Hyperbolic Layout

Space-constrained, multi-focal tree layout
Degree-of-Interest Trees
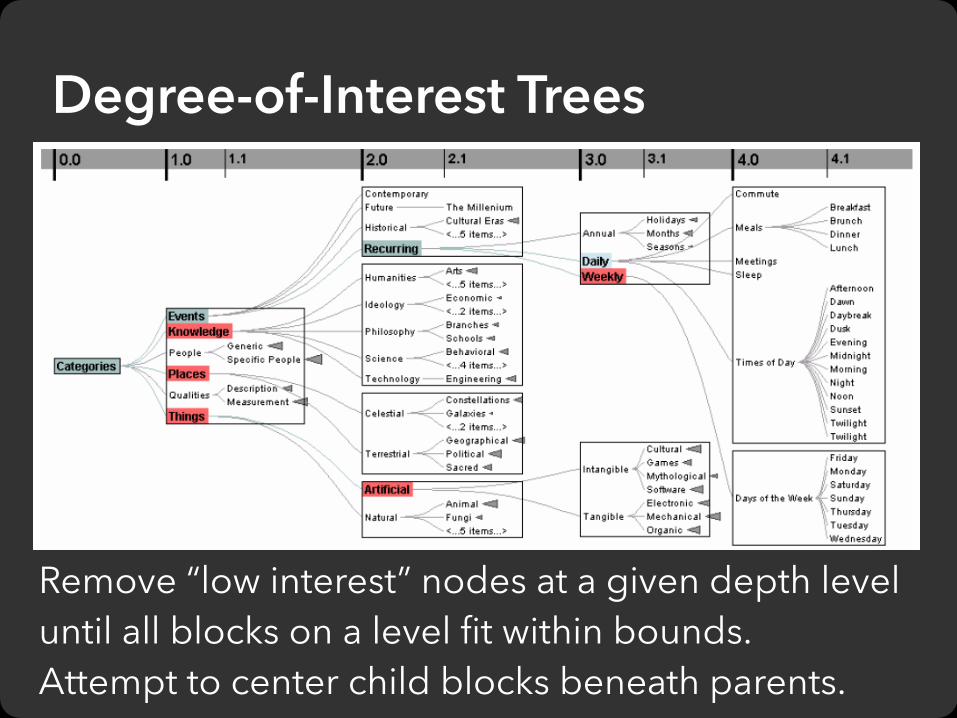
Remove “low interest” nodes at a given depth level until all blocks on a level fit within bounds. Attempt to center child blocks beneath parents.
Degree-of-Interest Trees

Enclosure

Encode structure using spatial enclosure Popularly known as treemaps
Benefits Provides a single view of an entire tree Easier to spot large/small nodes
Problems Difficult to accurately read structure / depth
Enclosure Diagrams

Nodes are represented as sized circles.
Nesting shows parent-child relationships.
Issues? Inefficient use of space. Parent size misleading?
Circle Packing Layout

Hierarchy visualization that emphasizes values of nodes via area encoding. Partition 2D space such that leaf nodes have sizes proportional to data values. First layout algorithms proposed by Shneiderman et al. in 1990, with focus on showing file sizes on a hard drive.
Treemaps

Slice & Dice layout: Alternate horizontal / vertical partitions.

Wattenberg 1998
Squarifed layout: Try to produce square (1:1) aspect ratios

Slice & Dice layout suffers from extreme aspect ratios. How might we do better?
Squarified layout: greedy optimization for objective of square rectangles. Slice/dice within siblings; alternate whenever ratio worsens.
Squarified Treemaps [Bruls et al. ’00]
vs.

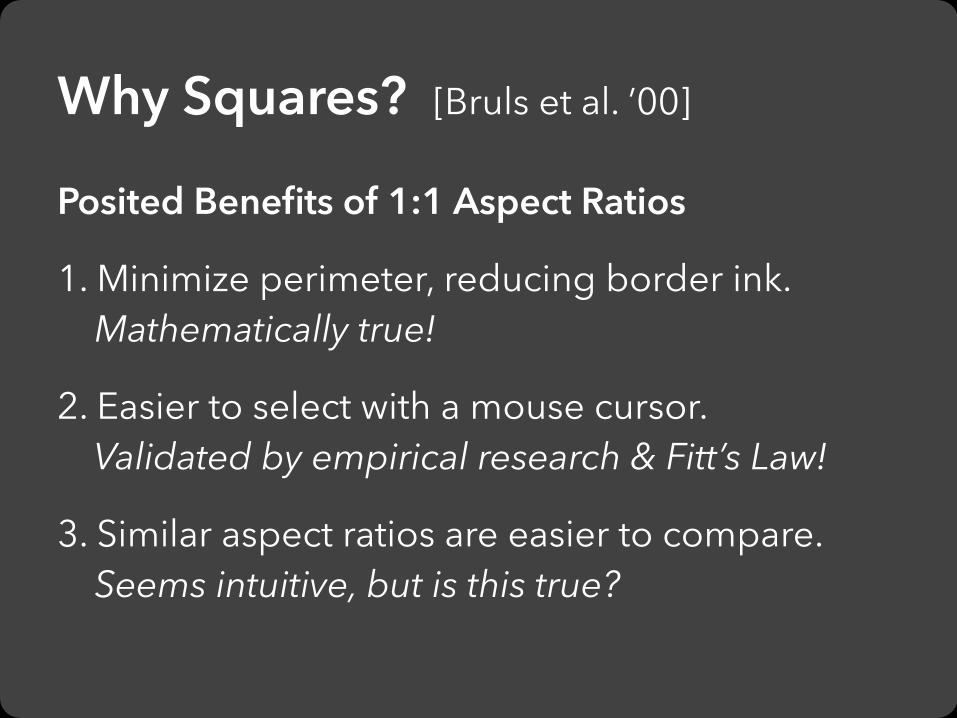
Posited Benefits of 1:1 Aspect Ratios
1. Minimize perimeter, reducing border ink. Mathematically true!
2. Easier to select with a mouse cursor. Validated by empirical research & Fitt’s Law!
3. Similar aspect ratios are easier to compare. Seems intuitive, but is this true?
Why Squares? [Bruls et al. ’00]

Study by Kong, Heer & Agrawala, InfoVis ’10. Comparison of squares has higher error! “Squarify” works because it fails to meet its objective?
Comparison Error vs. Aspect Ratio
Squares

Posited Benefits of 1:1 Aspect Ratios
1. Minimize perimeter, reducing border ink. Mathematically true!
2. Easier to select with a mouse cursor. Validated by empirical research & Fitt’s Law!
3. Similar aspect ratios are easier to compare. Seems intuitive, but is this true?
Why Squares? [Bruls et al. ’00]

Posited Benefits of 1:1 Aspect Ratios
1. Minimize perimeter, reducing border ink. Mathematically true!
2. Easier to select with a mouse cursor. Validated by empirical research & Fitt’s Law!
3. Similar aspect ratios are easier to compare. Extreme ratios & squares-only more inaccurate. Balanced ratios better? Target golden ratio?
Why Squares? [Bruls et al. ’00]

Position is generally more effective than area, but… What happens when the element count gets high? What happens when comparing groups of elements, such as leaf values vs. internal node values?
Treemaps vs. Bar Charts [Kong et al. ’10]

At low densities (< 4k elements), bar charts more accurate than treemaps for leaf-node comparisons. At higher density, treemaps led to faster judgments. Treemaps better for group-level comparisons.
Treemaps vs. Bar Charts [Kong et al. ’10]

Uses shading to emphasize hierarchal structure.
Cushion Treemaps [van Wijk & Wetering ’99]
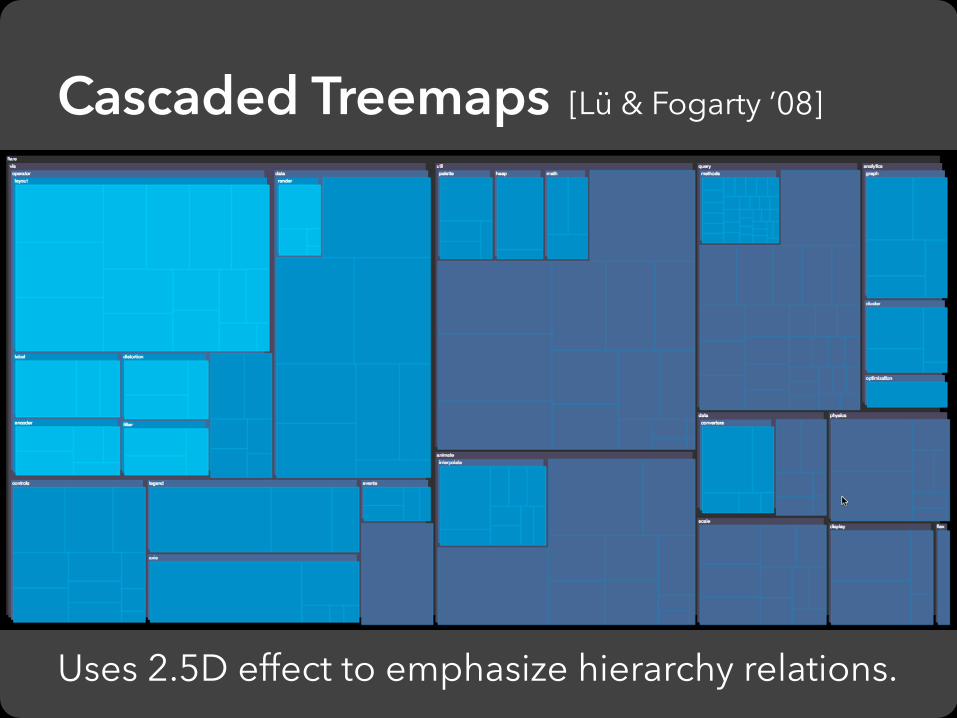
Uses 2.5D effect to emphasize hierarchy relations.
Cascaded Treemaps [Lü & Fogarty ’08]
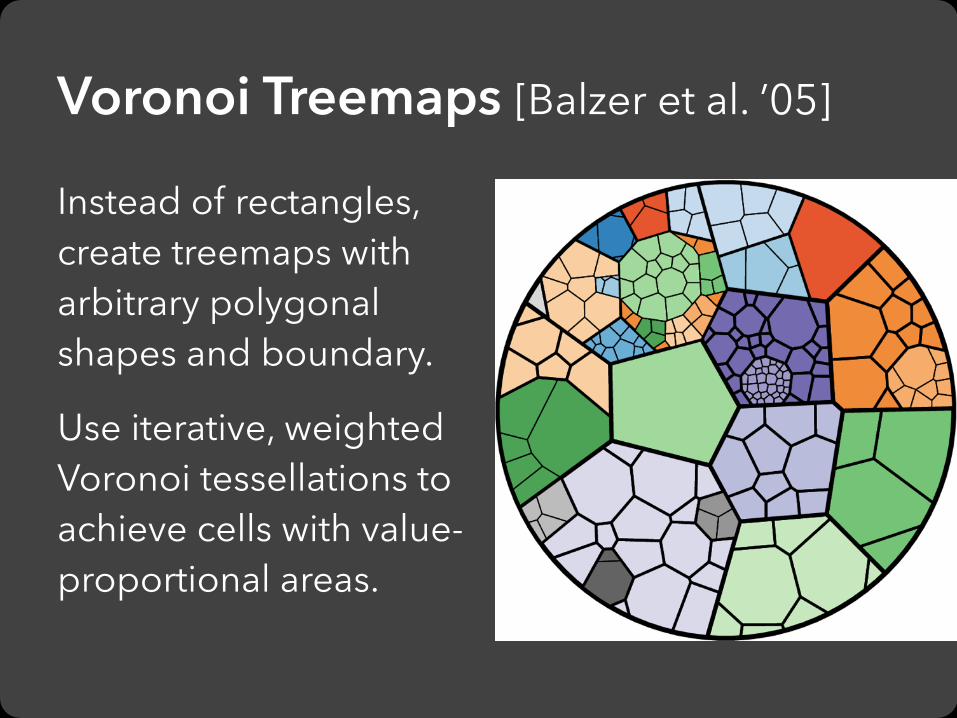
Instead of rectangles, create treemaps with arbitrary polygonal shapes and boundary.
Use iterative, weighted Voronoi tessellations to achieve cells with value-proportional areas.
Voronoi Treemaps [Balzer et al. ’05]


Layering

Signify tree structure using: - Layering - Adjacency - Alignment
Involves recursive sub-division of space.
Leaf nodes may be sized by value, parent size visualizes sum of descendant leaf values.
Layered Diagrams

Icicle Trees: Cartesian Partition


Layered Trees Useful Elsewhere…

Hybrids

Hybrids are also possible…
“Elastic Hierarchies”
Node-link diagram with treemap nodes.
Little uptake for real-world use…

Administrivia

Interactive Web Page Working (near-final) version due Wed 5/31. Final version due by showcase on Mon 6/5.
Demonstration Video (<= 2 min) Due Wed 5/31. We will show in-class on 6/1!
Poster & Demo for Final Showcase Monday 6/5, 10:30am-1pm in Allen Center atrium. External judges will award top projects!
Read assignment description for more!
Final Project Deliverables

When: Monday June 5, 10:30am - 1pm. Where: Allen Center Atrium
The event is open to the public. Invite your friends!
Public showing begins at 11am. Arrive at 10:30am to set up your poster and demo. Be prepared to give a ~3 min. presentation + demo to visitors.
Invited judges will rate & award the top projects.
Refreshments will be served!
Final Project Showcase

Focus on a compelling real-world use. Who is your user? How do you gauge success?
Consider multiple design alternatives. Prototype quickly (use Tableau, R, Gephi…).
Seek feedback (representative users, peers, …). Even informal usage can provide insights.
Choose appropriate team roles.
Start early (and read the suggested paper!)
Tips for a Successful Project

Animated Transitions in Tree Visualizations

Cone Trees [Robertson 91]

Animate pivots across intersecting hierarchies. Tested a number of animation parameters. Best duration: ~1 sec Rotational movement degraded performance, translation preferred.
Polyarchies [Robertson 02]

Animation of expanding/collapsing branches
Degree-of-Interest Trees [Heer 04]

Break animated transitions into discrete stages
Space Tree [Grosjean 04]

Optimize animation to aid comprehensionhttp://people.ischool.berkeley.edu/~rachna/gtv/
Radial Graph Layout


Help maintain context of nodes and general orientation of user during refocus.
Transition Paths Linear interpolation of polar coordinates Node moves in an arc, not straight lines Moves along circle if not changing levels When changing levels, spirals to next ring
Animation in Radial Graph Layout
Transition constraints Minimize rotational travel (move former parent
away from new focus in same orientation) Avoid cross-over of edges
Animation in Radial Graph Layout
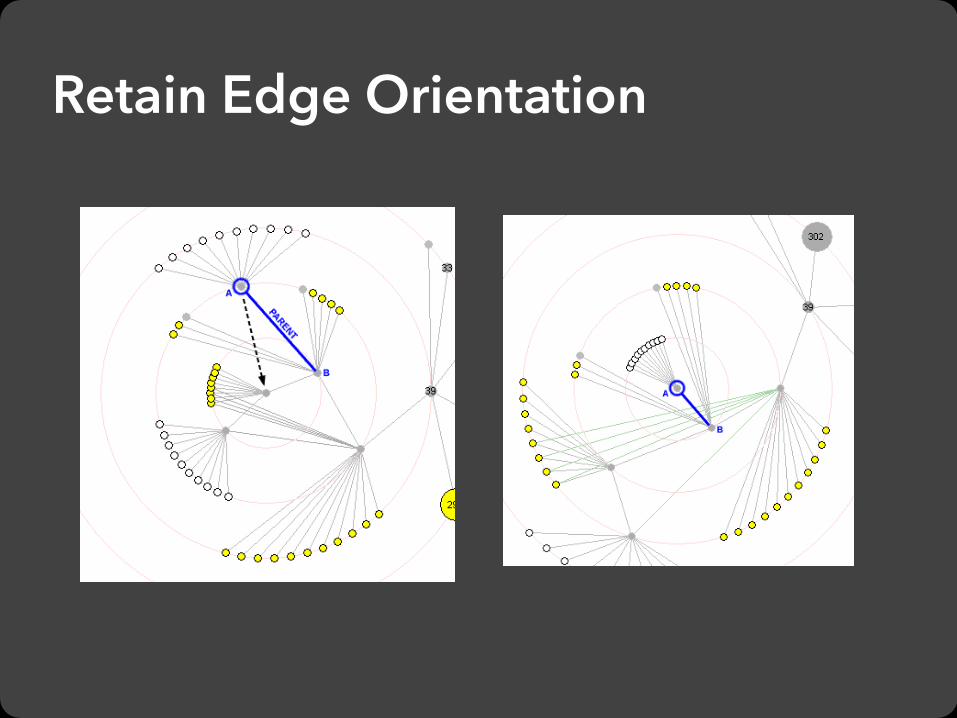
Retain Edge Orientation

Retain Neighbor Order

Indentation Linear list, indentation encodes depth
Node-Link diagrams Nodes connected by lines/curves
Enclosure diagrams Represent hierarchy by enclosure Layering Relative position and alignment
Focus + Context techniques for scale!
Summary: Tree Visualization