csiro&mk3.6.0-southern- hemisphere-heat … ·...
TRANSCRIPT
CSIRO&MK3.6.0-SOUTHERN-HEMISPHERE-HEAT-AND-MOMENTUM-CHANGE-UNDER-UNIQUELY-FORCED-
ATTRIBUTION-AND-DETECTION-EXPERIMENTS!
Mark!Collier1,!Kwang1Yul!Kim2,!Tony!Hirst1,!Leon!Rotstayn1!and!Stephen!Jeffrey3!
1.!CSIRO!Marine!and!Atmospheric!Research,!Victoria,!Australia!2.!School!of!Earth!and!Environmental!Sciences,!Seoul,!South!Korea!3.!Queensland!Centre!for!Climate!Change!Excellence,!Queensland,!Australia!

S1!
• BRIEF-MODEL-DESCRIPTION-OF-CSIRO&MK3.6-
• AEROSOL&INDUCED-HEAT-&-OCEAN-CIRCULATION-CHANGES-
!!

CSIRO&MK3.6:-18-LEVELS-T63-ATMOSPHERE-31-LEVEL-T63YX2-OCEAN-DYNAMIC/THERMODYNAMIC-SEA&ICE-INTERACTIVE-AEROSOLS-!!• Rotstayn,!L.D.,!Collier,!M.A.,!Dix,!M.R.,!Feng,!Y.,!Gordon,!H.B.,!O’Farrell,!S.P.,!Smith,!I.N.!and!J.I.!Syktus!(2010):!Improved!SimulaZon!of!Australian!Climate!and!ENSO1related!rainfall!variability!in!a!global!climate!model!with!interacZve!aerosol!treatment.!Int.!J.!Climatol.!30:!106711088.!DOI:!10.1002/joc.1952.!
• Rotstayn,!L.D.,!Collier,!M.A.,!Mitchell,!R.M.,!Qin,!Y.,!S.K.!Campbell!and!S.!M.!Dravitzki!(2011).!Simulated!enhancement!of!ENSO1related!rainfall!variability!due!to!Australian!dust.!Atmos.!Chem.!Phys.,!11,!!657516592,!!doi:10.5194/acp1111657512011.!
• Rotstayn,!L.D.,!Jeffrey,!S.J.,!Collier,!M.A.,!Dravitzki,!S.M.,!Hirst,!A.C.,!Syktus,!J.I.!and!K.K.!Wong!(2012):!Aerosol1induced!changes!in!summer!rainfall!and!circulaZon!in!the!Australian!region:!a!study!using!single1forcing!climate!simulaZons,!Atmos.!Chem.!Phys.!Discuss.,!12,!510715188,!doi:10.5194/acpd1121510712012,!2012.!
• Collier,!M.A.,!Jeffrey,!S.J.,!and!L.D.!Rotstayn!(2011).!The!latest!Australian!CMIP!climate!model!submission,!BulleZn!of!the!Australian!Meteorological!and!Oceanographic!Society,!Vol.!24,!No.!5,!October!2011,!pages!1031108.!hfp://www.amos.org.au/documents/item/589!
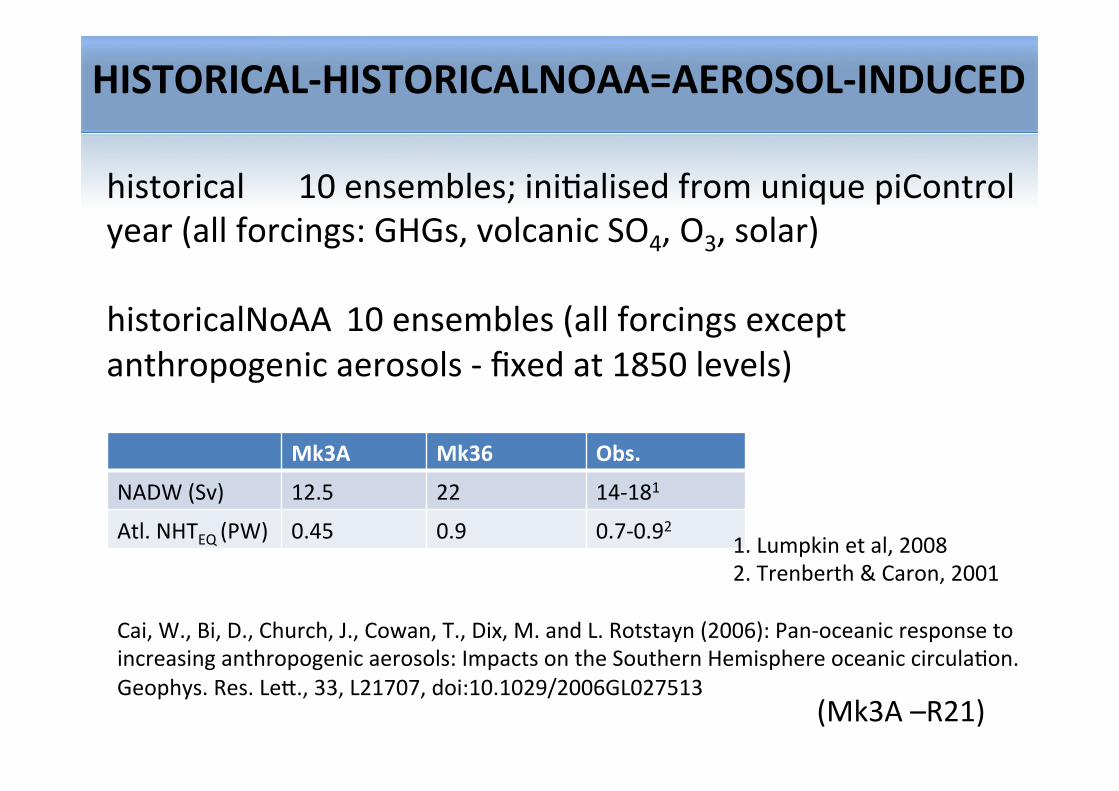
historical! !10!ensembles;!iniZalised!from!unique!piControl!year!(all!forcings:!GHGs,!volcanic!SO4,!O3,!solar)!!historicalNoAA !10!ensembles!(all!forcings!except!anthropogenic!aerosols!1!fixed!at!1850!levels)!
Cai,!W.,!Bi,!D.,!Church,!J.,!Cowan,!T.,!Dix,!M.!and!L.!Rotstayn!(2006):!Pan1oceanic!response!to!increasing!anthropogenic!aerosols:!Impacts!on!the!Southern!Hemisphere!oceanic!circulaZon.!Geophys.!Res.!Lef.,!33,!L21707,!doi:10.1029/2006GL027513!
(Mk3A!–R21)!
Mk3A- Mk36- Obs.-
NADW!(Sv)! 12.5! 22! 141181!
Atl.!NHTEQ!(PW)! 0.45! 0.9! 0.710.92!1.!Lumpkin!et!al,!2008!2.!Trenberth!&!Caron,!2001!
HISTORICAL&HISTORICALNOAA=AEROSOL&INDUCED--!!
Mk3.6!
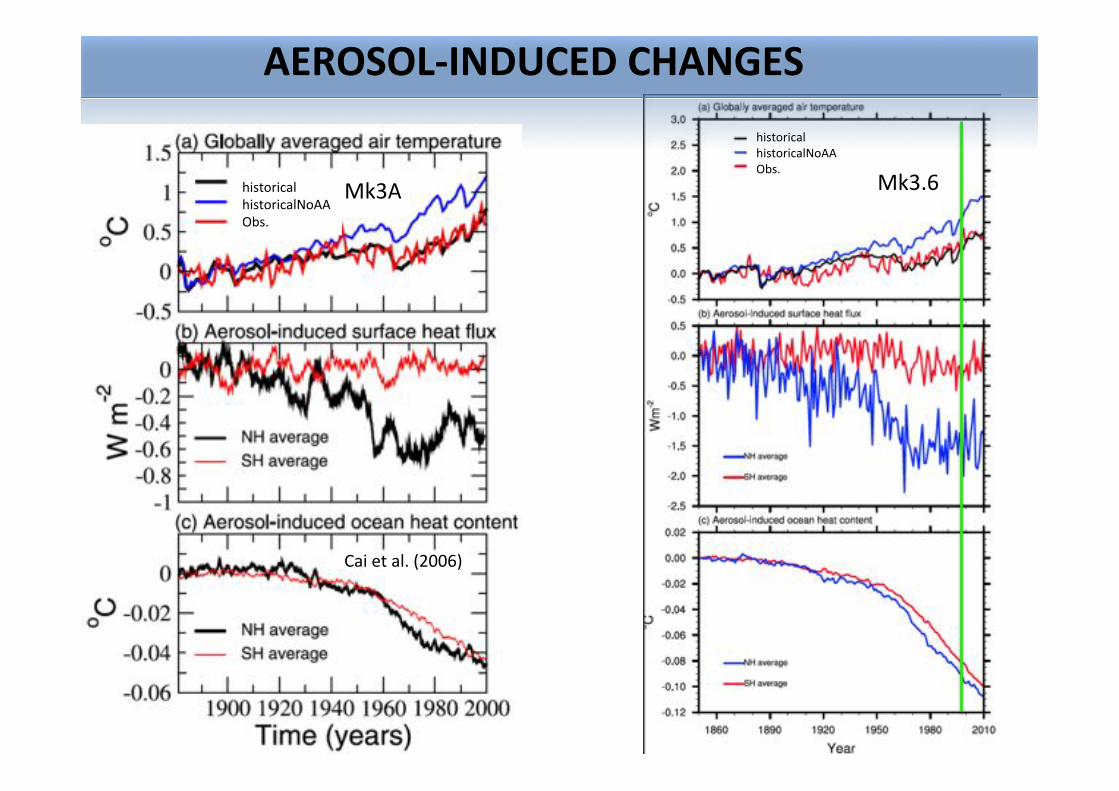
historical!historicalNoAA!Obs.!
Mk3A!historical!historicalNoAA!Obs.!
AEROSOL&INDUCED-CHANGES--!!
Cai!et!al.!(2006)!
Mk3.6!
Mk3A!
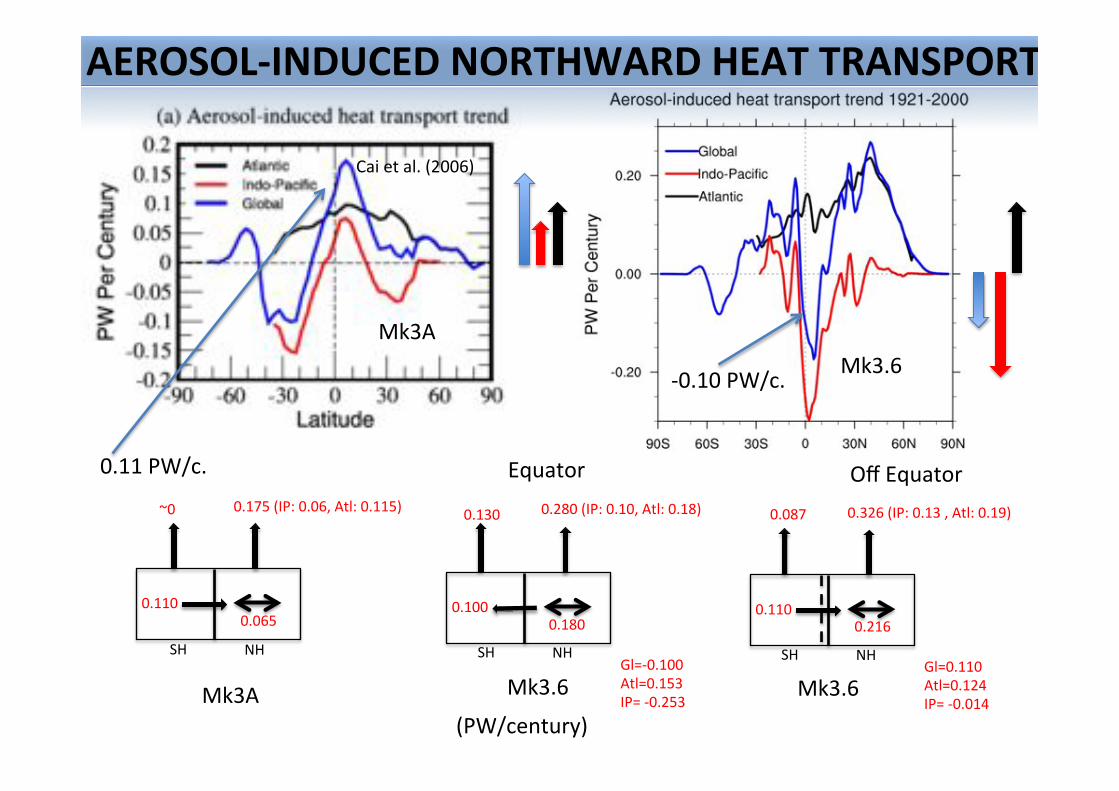
0.11!PW/c.!
SH! NH!
0.175!(IP:!0.06,!Atl:!0.115)!
0.110!0.065!
~0!
Mk3A!
10.10!PW/c.!
0.280!(IP:!0.10,!Atl:!0.18)!
0.100!0.180!
SH! NH!
0.130!
Mk3.6!Gl=10.100!Atl=0.153!IP=!10.253!
0.326!(IP:!0.13!,!Atl:!0.19)!
0.110!0.216!
SH! NH!
0.087!
Mk3.6!Gl=0.110!Atl=0.124!IP=!10.014!
Equator! Off!Equator!
(PW/century)!
AEROSOL&INDUCED-NORTHWARD-HEAT-TRANSPORT--!!
Cai!et!al.!(2006)!
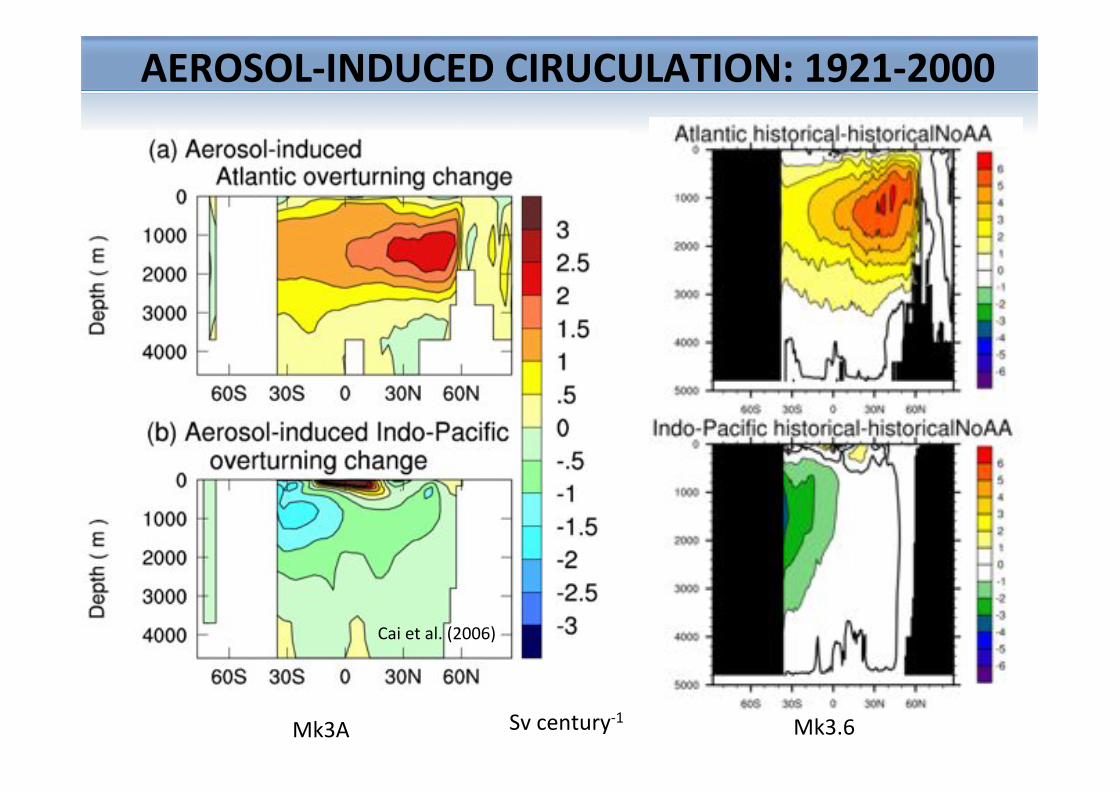
Mk3A! Mk3.6!Sv!century11!
AEROSOL&INDUCED-CIRUCULATION:-1921&2000-!!
Cai!et!al.!(2006)!
historical! rcp!historical! rcp!
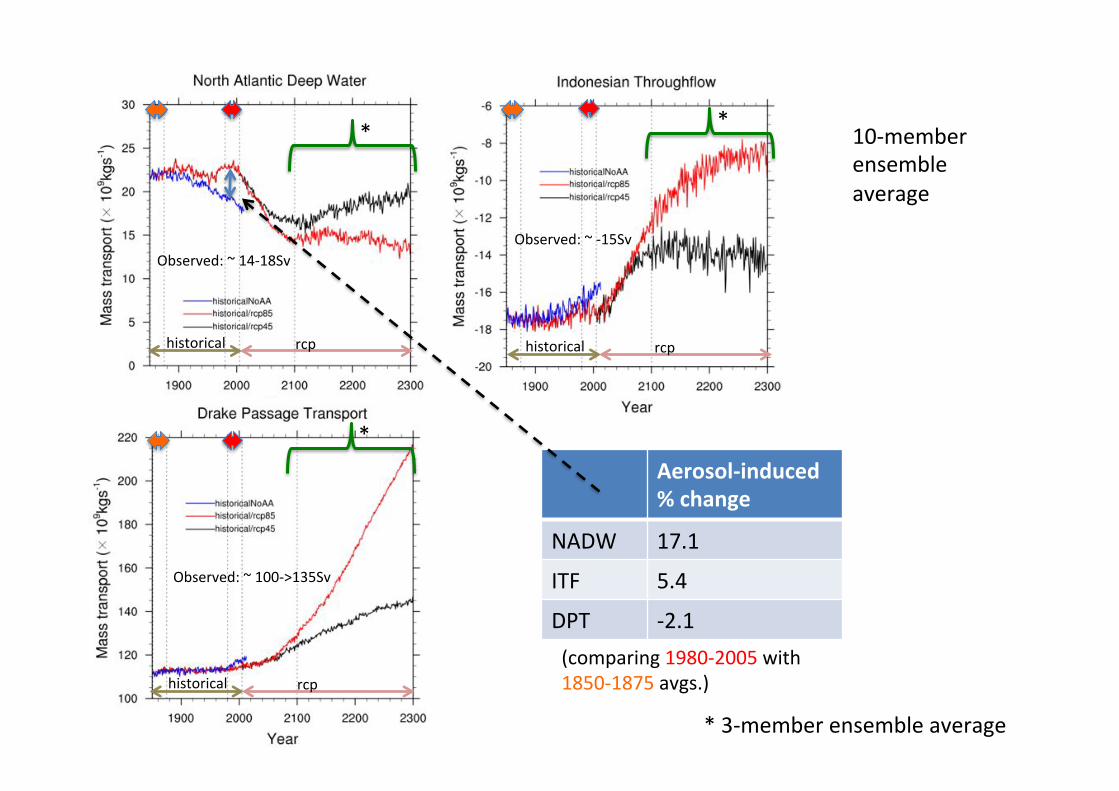
(comparing!198012005!with!185011875!avgs.)!
Aerosol&induced-%-change-
NADW! 17.1!
ITF! 5.4!
DPT! 12.1!
*!*!
*!
*!31member!ensemble!average!
101member!ensemble!average!
historical! rcp!
Observed:!~!1001>135Sv!!
Observed:!~!14118Sv!Observed:!~!115Sv!!

01700m!currents:!cm/s/century!VerZcally!averaged!temperature:!°C/century!
AEROSOL&INDUCED-TRENDS-1951&2000-
CONCLUSIONS-!!• Anthropogenic Aerosols (AAs) in coupled climate models are required to capture 20th
century changes in near surface global air temperature.
• Mk3A/Mk36 hemispheric time-series of net heat flux and heat content have similar features, however there are some noticeable differences.
• Mk36 has a stronger Northward heat flux trend for the Atlantic than Mk3A, and a mostly Northward heat flux trend for the Global value. The Indo-Pacific value is highly variable on annual and decadal time-scales. The Atlantic is a particularly efficient at moving heat Northwards at all latitudes and on all time-scales over the 20th century.
• Mk36 trend in the SH net heat flux in the last few decades of the 20th century, and a contrasting Indo-Pacific overturning circulation hint at uniquely different regionally based aerosol-induced air-sea interaction: combination of model improvements and an improved aerosol emissions database.
• AAs result in greater heat loss in the North Atlantic than the Indo-Pacific system introducing a range of “aerosol-induced” circulation changes regionally linked to the Ocean Conveyor. We have found a 17 (5) [-2]% change in NADW (ITF) [DPT] when we compare the last 1980-2005 years of aerosol-induced experiments to the same length period directly after PI times.
• Changes to the surface ocean currents & Conveyor in the Mk36 model have a much “richer” structure than compared to Mk3A. The strengthening of the Atlantic heat transport mitigates the slow-down of the Atlantic overturning due to GHGs. Into the future this protection of the Conveyor by AAs is likely to weaken.
S17!