csn network assessment
TRANSCRIPT

CSN Network
Assessment
National Ambient Air Monitoring Conference
August 2014
1
Beth Landis8/12/14

Network Overview
• 1997 PM2.5 NAAQS review led to the establishment of the
Chemical Speciation Network (CSN)
• Initial monitoring began with 13 pilot sites in 2000
• Currently, the network consists of 189 sites:
– 52 Speciation Trends Network (STN) sites
– 137 supplemental sites
– 174 sites utilize EPA’s national contract and were considered in the network
assessment
• Sites collect aerosol samples of 24 hours on filters analyzed for:
– PM2.5 mass
– Elements
– Ions (sulfate, nitrate, sodium, potassium & ammonium)
– Organic and elemental carbon (OC/EC)
National Ambient Air Monitoring Conference August 2014 2
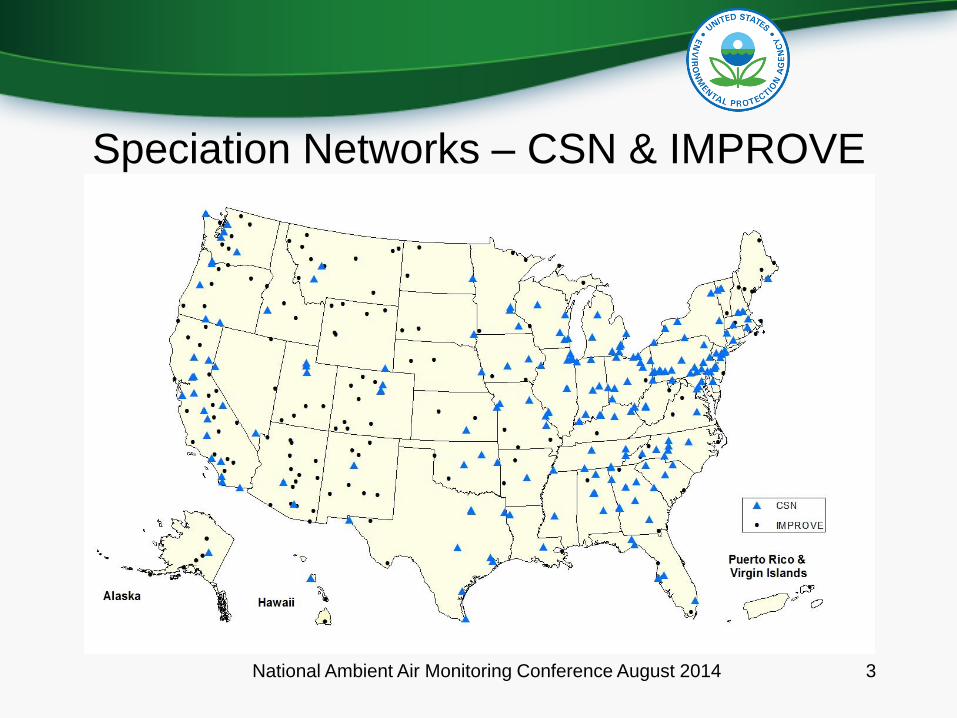
Speciation Networks – CSN & IMPROVE
National Ambient Air Monitoring Conference August 2014 3

Goals of the Assessment
• Create a CSN network that is financially sustainable
going forward
• Redistribute resources to new or high priorities from
those of low-priority or low-benefit
• Extract more value from the existing
network
• Fully leverage the value of other existing networks
(e.g., IMPROVE)
National Ambient Air Monitoring Conference August 2014 4

CSN Cost Breakdown
• Current network cost ≈ $6.7 million
• Goal of 30% cut, 10% reinvestment (total reduction of
20%)
– 30% cut ≈ $2M
– 10% reinvestment ≈ $670,000
– 20% total reduction ≈ $1.34M
• Total to spend on base network ≈ $4.7 million
These are current numbers for the network, and will be
contingent on future contract costs
National Ambient Air Monitoring Conference August 2014 5
Assessment Approach
• An objectives based approach was taken in an effort
to optimize the network to support the primary
objectives, which include:– Support of PM2.5 Implementation (e.g., SIPs, non attainment areas,
control strategies, model development, etc.)
– Aid in interpretation of health studies
– Detection of trends
• We are aware and sensitive to the fact that there are
many secondary objectives of our CSN sites (e.g.,
urban increment, regional haze, etc)
National Ambient Air Monitoring Conference August 2014 6

National Ambient Air Monitoring Conference August 2014 7
Assessment Approach & Communication Timeline
2013 Apr Jun Aug Oct DecFeb2014
Apr Jun Aug 2014
NAAMC Conference08/12/14
OAR Mgmt.
07/30/14
OAQPS Mgmt.
07/21/14
HEI Conference05/05/14
ORD Sponsored Webinar
05/01/14
NACAA
04/24/14
AAPCA
04/23/14
EPA Regions
04/08/14
OAR Mgmt.
03/31/14
OAQPS Mgmt.03/26/14
NACAA MSC
12/03/13
CSN Assessment Team Kickoff Meeting
04/25/13
07/21/14 - 08/12/14Communication of Revised Recommendations
07/01/14 - 07/21/14Revisions of Initial Recommendations Based on Feedback
04/08/14 - 06/30/14Request for Feedback Regarding Initial Recommendations
03/31/14 - 05/05/14Communication of Initial Recommendations
12/03/13 - 03/31/14Additional Data Assessment & Revisions
04/01/13 - 12/03/13 Determination of Approach & Initial Data Assessment

Original Recommendations (April 2014)
CSN Assessment
#1 – Defund 53 “Low Value”
Sites
#2 – Eliminate CSN Mass (July 2014)
#3 – Reduce Sample
Frequency (2 Sites)
#4 – Reduce Carbon Blanks
#5 – Reduce Icepacks in Shipment
National Ambient Air Monitoring Conference August 2014 8
Recommendation #1 – Defund Sites
• Evaluated which sites meet the primary objective(s)– Points assigned for: NCore, design values, STN, health research city, daily
FRM, continuous monitors, collocation (i.e. NATTS, PAMS & IMPROVE)
– 73 sites “Low Value”– more analysis necessary
• Created decision matrix for 73 “low value” sites– Points assigned for: design value ranges, population, county emissions,
proximity of speciation sites, species trends & correlation, and model bias/error
• Considering the decision matrix scoring and various intangibles, 53 “low value” sites were initially recommended for defunding*
• After incorporating feedback, 44 sites are scheduled for defunding in January 2015*
*While sites recommended for defunding will no longer receive laboratory analysis funding, their speciation monitors may continue to operate if other funding sources are provided
National Ambient Air Monitoring Conference August 2014 9

Map of CSN Sites Recommended for Defunding
National Ambient Air Monitoring Conference August 2014 10
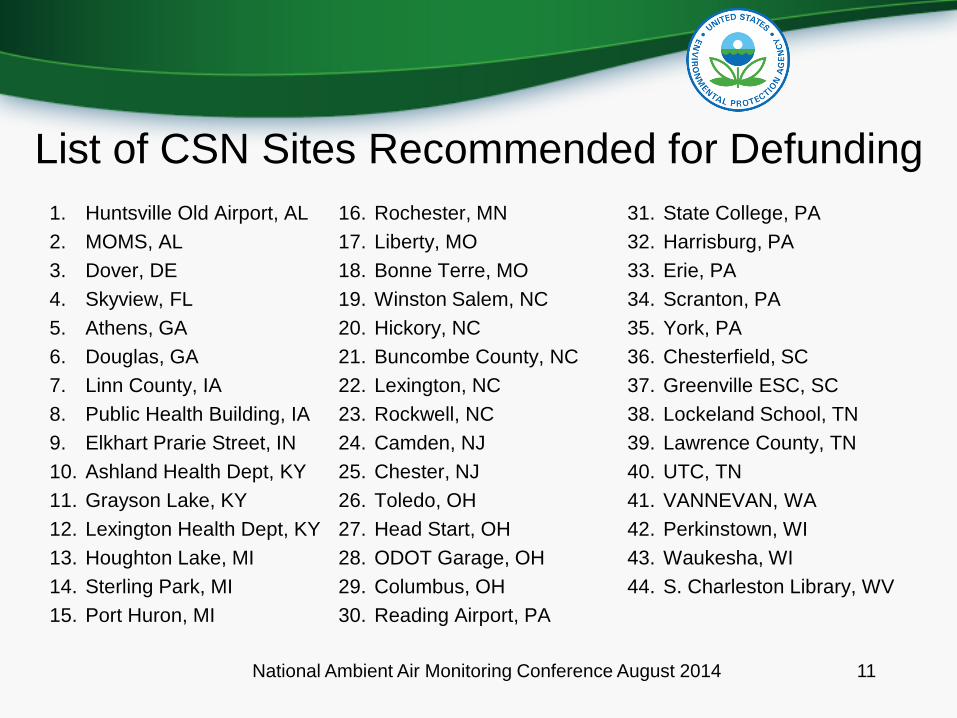
List of CSN Sites Recommended for Defunding
1. Huntsville Old Airport, AL
2. MOMS, AL
3. Dover, DE
4. Skyview, FL
5. Athens, GA
6. Douglas, GA
7. Linn County, IA
8. Public Health Building, IA
9. Elkhart Prarie Street, IN
10. Ashland Health Dept, KY
11. Grayson Lake, KY
12. Lexington Health Dept, KY
13. Houghton Lake, MI
14. Sterling Park, MI
15. Port Huron, MI
16. Rochester, MN
17. Liberty, MO
18. Bonne Terre, MO
19. Winston Salem, NC
20. Hickory, NC
21. Buncombe County, NC
22. Lexington, NC
23. Rockwell, NC
24. Camden, NJ
25. Chester, NJ
26. Toledo, OH
27. Head Start, OH
28. ODOT Garage, OH
29. Columbus, OH
30. Reading Airport, PA
31. State College, PA
32. Harrisburg, PA
33. Erie, PA
34. Scranton, PA
35. York, PA
36. Chesterfield, SC
37. Greenville ESC, SC
38. Lockeland School, TN
39. Lawrence County, TN
40. UTC, TN
41. VANNEVAN, WA
42. Perkinstown, WI
43. Waukesha, WI
44. S. Charleston Library, WV
National Ambient Air Monitoring Conference August 2014 11

Map of Speciation Network After Assessment (Jan 2015)
National Ambient Air Monitoring Conference August 2014 12

Recommendation #2 – Eliminate CSN Mass
• CSN PM2.5 mass measurement widely used when the network was established
• Now, FRM PM2.5 mass measurement widely used for model attainment, model
evaluation, design values, etc.
• Originally recommended eliminating CSN PM2.5 mass in July 2014
• After receiving comments, additional analysis conducted comparing the CSN
and FRM PM2.5 mass measurements (see Tim Hanley’s poster)– CSN and FRM PM2.5 mass measurements compare favorably
– The FRM mass is the regulatory measurement
– Reconstructed Fine Mass (RCFM) compared to FRM mass suitable approach to QC the FRM,
and vice versa
– CSN species and RCFM compared to historical CSN species and RCFM suitable approach to QC
CSN species
• CSN PM2.5 mass measurement now scheduled for elimination* in October 2014
(last samples to be collected September 29th)
* Two sites recommended for funding do not have FRMs & will continue measuring CSN mass until such time as an FRM is established
National Ambient Air Monitoring Conference August 2014 13

Recommendation #3 – Reduce Sample Frequency
• Original recommendation to reduce sample
frequency to 1-in-6 at sites that are not NCore or STN
– Arnold West, MO
– Wylam, AL
• After incorporating feedback, Arnold West, MO,
Wylam, AL & Albany, NY are scheduled for a
reduction in sample frequency to 1-in-6 beginning
January 2015
National Ambient Air Monitoring Conference August 2014 14
Recommendations #4 & #5
(Reduce Carbon Blanks & Icepacks)• Original recommendations:
– Reduce carbon field blanks (from 10% to 5%)
– Eliminate carbon backup filter blanks (currently 5%)
– Reduce the number of icepacks included in sample
shipments from 8 to 6 during the cooler months (October 1 –
April 30)
• No feedback received justifying revisions
• Carbon field blanks will be reduced to 5%, carbon
backup filter blanks will be eliminated, and the
number of icepacks in shipment will be reduced to 6
beginning in January 2015
National Ambient Air Monitoring Conference August 2014 15

CSN Assessment
#1 – Defund 53 “Low
Value” Sites
#1 – Defund 44 “Low
Value” Sites
#2 –Eliminate
CSN Mass (July 2014)
#2 –Eliminate
CSN Mass (October
2014)
#3 – Reduce Sample
Frequency (2 Sites)
#3 - Reduce Sample
Frequency (3 Sites)
#4 – Reduce Carbon Blanks
#4 – Reduce Carbon Blanks
(no change)
#5 – Reduce Icepacks in Shipment
#5 – Reduce Icepacks in Shipment
(no change)
National Ambient Air Monitoring Conference August 2014 16
Feedback received from Regions, State & Local Monitoring
Agencies, Researchers, Academics, etc.
Original
Recommendations
(April 2014)
Updated
Recommendations
(August 2014)

Reinvestments
• Original goal to have 10% ($670K) available for reinvestment in the
network
• Taking feedback into consideration & based on current contract costs,
we approximate $400K available for reinvestments
• The following investment options are being considered*:– Investigating new analytical techniques
– SuperSASS upgrade at STN and/or NCore sites on Alternate 1:3 schedule
– New sites in areas with emerging air quality issues
– Continuous measurements (e.g., Sunset OC/EC, Aethalometer)
– XRF & light absorption on daily FRM teflon filters
– New measurement parameters
• We welcome input regarding reinvestment options for the network
*Final funds available for reinvestment will depend on the cost of the new contract
National Ambient Air Monitoring Conference August 2014 17

National Ambient Air Monitoring Conference August 2014 18
Assessment Implementation Timeline
2014 Aug Sep Oct Nov DecJan2015 2015
New National Contract Awarded
1/1/2015
Reduce sample frequency, carbon blank frequency & icepacks
1/1/2015
Last CSN samples collected at sites being defunded
12/31/2014
Last CSN PM2.5 Mass Sample Collected
9/29/2014
NAAMC Conference
8/12/2014
Receive Last Minute Feedback Regarding Recommendations8/11/2014 8/22/2014
Finalize Recommendations & Brief Upper Management8/25/2014 9/5/2014
Share Final Recommendations with Regions & Other Stakeholders (Assessment Website)9/8/2014 9/12/2014
8/11/2014 12/31/2014Receive Feedback Regarding Reinvestment Options
Determine Use of Available Funds for Reinvestments 1/1/2015 1/31/2015

CSN Assessment Website
National Ambient Air Monitoring Conference August 2014 19

CSN Assessment Summary
• The following recommendations will become final in the next two
weeks:
– Defund 44 sites (to be implemented Jan. 2015)
– Eliminate CSN PM2.5 mass measurement (to be implemented Oct. 2014)
– Reduce sample frequency at 3 sites (to be implemented Jan. 2015)
– Reduce carbon blank frequency (to be implemented Jan. 2015)
– Reduce icepacks in shipment (to be implemented Jan. 2015)
• THIS IS THE FINAL CALL FOR PROVIDING FEEDBACK
• See Beth Landis at the CSN/IMPROVE Breakout Discussion
Center for additional information about the assessment and to
provide feedback (today from 3-5pm)
National Ambient Air Monitoring Conference August 2014 20

Key Points
• The CSN network assessment recommendations incorporate feedback
received from regional, state & local monitoring agencies, researchers
and academics (as of August 8, 2014)
• Sites recommended for defunding will no longer receive laboratory
analysis funding, however their speciation monitors may continue to
operate if other funding sources are provided
• The cost breakdown and target savings numbers are contingent on
current contract pricing (as of August 12, 2014) and are subject to
change with the new contract (anticipated January, 2015)
• Further resource assessments will be necessary as contract costs and
budgets change
National Ambient Air Monitoring Conference August 2014 21

Acknowledgements - CSN Assessment Team
• Beth Landis, Joann Rice, Lew Weinstock & Tim Hanley –
OAQPS air monitoring
• Adam Reff, Neil Frank & Liz Naess- OAQPS air quality analysis
• Tesh Rao – OAQPS emissions inventory
• Jim Kelly – OAQPS modeling
• Beth Palma – OAQPS policy
• Beth Hassett-Sipple – OAQPS standards
• Alan VanArsdale – Region 1 air monitoring
• Daniel Garver – Region 4 air monitoring
• Rich Poirot - National Association of Clean Air Agencies
(NACAA)
National Ambient Air Monitoring Conference August 2014 22

National Ambient Air Monitoring Conference August 2014 23
QUESTIONS?