cu l t u r e researh f u a ev journal of aquaculture
TRANSCRIPT

Open Access
Volume 4 • Issue 3 • 1000170J Aquac Res DevelopmentISSN: 2155-9546 JARD, an open access journal
Open Access
Kalantarian et al., J Aquac Res Development 2013, 4:3 DOI: 10.4172/2155-9546.1000170
Open Access
Keywords: Rainbow trout; Dietary-Ca; Dietary-K; Growth indices;Biochemical composition; Whole body minerals
IntroductionMinerals are required for the normal life processes, and fish, need
these inorganic elements. Fish may derive these minerals from the diet and also from ambient water [1-3]. All forms of aquatic animals require inorganic elements or minerals for their normal life processes [3]. Many essential elements are required in such small quantities that it is difficult to formulate diets and maintain an environment that is low in minerals to demonstrate a mineral deficiency [3]. Definition of the mineral requirements of fish is complicated by the facility with which they can take up certain ions from the water. Ca, Mg, Na, K, Fe, Zn, Cu and Se can all be obtained from the water. For marine fish, a full mineral package in the diet appears unnecessary and probably only P, Fe and Zn need to be supplied [4]. Calcium is one of the most abundant cations in the body of a fish and closely related to the development and maintenance of the skeletal system and participate in several physiological processes including the maintenance of acid–base equilibrium, osmoregulation, muscle contraction, bone mineralization, blood clot formation, nerve transmission, maintenance of cell membrane integrity, and activation of several important enzymes [3,5,6] and is readily derived from the water and occurs in adequate amounts in most diets consumed by fish [3]. Regulation of Ca influx and efflux occurs at the gills, fins, and oral epithelia. The endocrine control of Ca metabolism in fish is also regulated by hyper-and hypocalcemic hormones. Teleosts possess two hormones with hypocalcemic action: calcitonin, secreted by the ultimobranchial gland, and stanniocalcin (STC), secreted by the corpuscles of Stannius [7].
Very few studies have been conducted on the dietary Ca requirements of fish. Dietary Ca supplementation up to a certain level benefited the performance of blue tilapia reared in Ca-free water [8] but also fingerling scorpion fish reared in sea water [9]. A positive effect of dietary Ca supplementation was also found in American cichlid [10] and Atlantic salmon when dietary P level was inadequate [11] and in red sea bream at high dietary P levels [12]. However, excess dietary Ca has been reported to induce negative effects in other fish species [11,13].
In previous studies we observed that the redlip mullet Liza haematocheila, tiger puffer Takifugu rubripes and giant croaker Nibea japonica. Could not absorb adequate Ca from seawater to fulfill their requirements [9,14,15]. In contrast, Ca absorption from seawater by red sea bream Pagrus major and black sea bream Acanthopagrus requirements [16,17]. In rainbow trout fry no effect of dietary Ca deficiency was noticed on growth performance and fish composition
*Corresponding author: Kalantarian SH, University College of Agriculture & Natural Resources, University of Tehran, Karaj, Iran, E-mail: [email protected]
Received October 27, 2012; Accepted December 29, 2012; Published January 09, 2013
Citation: Kalantarian SH, Rafiee GH, Farhangi M, Mojazi Amiri B (2013) Effect of Different Levels of Dietary Calcium and Potassium on Growth Indices, Biochemical Composition and Some Whole Body Minerals in Rainbow Trout (Oncorhynchus Mykiss) Fingerlings. J Aquac Res Development 4:170 doi:10.4172/2155-9546.1000170
Copyright: © 2013 Kalantarian SH, et al. This is an open-access article distributed under the terms of the Creative Commons Attribution License, which permits unrestricted use, distribution, and reproduction in any medium, provided the original author and source are credited.
AbstractTwo completely randomized experimental designs were conducted to investigate the effect of different levels of
dietary Ca (0.95%, 1.21%, 1.41% and 1.61%) and K (0.72%, 0.9%, 1.1% and 1.3%) on some growth indices, body biochemical composition and some whole body elements in rainbow trout fingerlings in a culture system. Tow basic diets with 0.95% Ca and 0.72% K were prepared and with CaCO3 for experiment І and K2CO3 for experiment ІІ, other dietary treatments were built. In initiation of each experiments, 25 pieces of rainbow trout fingerlings (12.18 ± 0.04 and 15.60 ± 0.05) introduced in each experimental units respectively, and were fed with dietary treatment ad libitum two times daily at 9:00 and 15:00 for a 8 week period. It was resulted that different levels of inorganic dietary-Ca in diets, had not significantly affected on growth factors (W1, WG, G%, SGR% day-1 and TGC), but different levels of inorganic dietary-K in diet had significantly affected (p<0.05) on these factors. FCR and survival rates did not show significant differences between the treatments in each experiment. In The first experiment, crude protein CP% and Ash% significantly increased and total lipid showed depletion with an increase in the dietary Ca (p<0.05). Change in inorganic dietary-Ca had significantly affected on Ca, P, Mn, Zn, Cu and Fe of whole body contents (p<0.05) and not affected the Mg and K of whole body. With increasing the inorganic dietary-K, diet with 0.9% total K, had significantly increased in CP% (p<0.05), however not significant differences between the trails in Ash% and total lipid% were observed. The Ca, K, P, Mg, Zn, Fe and Cu of whole body were significantly changed (p<0.05), and Mn had not significantly changed with increasing the inorganic dietary-K.
Results were obtained in these studies, showed that, changes in amount of inorganic Ca in diets at the range of 0.95- 1.61% could not significantly affect on growth indices but dietary-K at the range of 0.72-1.3% affected the growth indices significantly (p<0.05). Significant effects on biochemical composition and some whole body minerals of cultured rainbow trout fingerlings with changes the dietary Ca and K were observed.
Effect of Different Levels of Dietary Calcium and Potassium on Growth Indices, Biochemical Composition and Some Whole Body Minerals in Rainbow Trout (Oncorhynchus Mykiss) FingerlingsKalantarian SH*, Rafiee GH, Farhangi M, and Mojazi Amiri B
University College of Agriculture & Natural Resources, University of Tehran, Karaj, Iran
Journal of AquacultureResearch & Development
Research Article
Jour
nal o
f Aqu
aculture Research &Developm
ent
ISSN: 2155-9546
Citation: Kalantarian SH, Rafiee GH, Farhangi M, Mojazi Amiri B (2013) Effect of Different Levels of Dietary Calcium and Potassium on Growth Indices, Biochemical Composition and Some Whole Body Minerals in Rainbow Trout (Oncorhynchus Mykiss) Fingerlings. J Aquac Res Development 4:170 doi:10.4172/2155-9546.1000170
Page 2 of 8
Volume 4 • Issue 3 • 1000170J Aquac Res DevelopmentISSN: 2155-9546 JARD, an open access journal
[18]. The Ca requirement of fish is affected by the water chemistry, the phosphorus level in the diet, and species differences [7,19,20] and between 0.3-0.65% [3] and approximate 1% [5] were determined. A low concentration of Ca (0.34% or less) is required in the diet of red sea bream, carp, eel, and catfish for optimum growth [12,21-23]. Optimal dietary Ca: P ratios seem to vary between different species, but reported to be 0.2 in Atlantic salmon [11] and 1.3 in American cichlid [10].
Sodium, potassium, and chloride are the most abundant electrolytes in the body of living organisms. Sodium and chloride are the major cation and anion, respectively, of extracellular fluids of the body, whereas potassium and magnesium are the major intracellular cations. The osmotic pressure of the intracellular and extracellular fluids is rigidly controlled, largely through energy-dependent regulatory mechanisms that determine the rate of absorption of sodium ions and water by the epithelial membranes of the gill, gut, integument, and kidney [3].
As with all animals, potassium is the most abundant intracellular ion in fish and plays many important physiological roles including the maintenance of cellular volume and membrane potentials and the generation of nerve impulses [24,25]. In fish, potassium plays additional critical roles in osmo-and iono-regulation and acid/base balance [26,27].
Plasma membranes contain an energy-dependent Na+ pump, which actively transfers Na+ from the intracellular to the extracellular environment. As Na+ exists, K+ enters, because the membrane is fully permeable to K+ and these ions are very similar in properties to the Na+ they are replacing [3,19]. Potassium deficiency causes overall muscle weakness, resulting in intestinal distention, weakness of cardiac and respiratory muscles, and their ultimate failures [3,19]. K supplementation was found necessary in purified diets for Chinook salmon. Juvenile Chinook salmon reared in freshwater required 0.8% K in their diet for maximum growth, and whole-body K saturation was reached at a K concentration between 0.6 and 1.2% of the diet [28]. Fish reared in seawater, where the K concentration is much higher than in freshwater, do not require K supplementation [16].
Effects of Ca on growth, biochemical composition and elements of whole body were studied in various researches [18,29-32] but few studies focus on effects of K on these factors and had not exact data on requirements of rainbow trout for these tow minerals and requirements of rainbow trout may vary with the mineral content of the water [4, 18]. For these reasons, in the present study, we investigated the effect of different levels of inorganic dietary Ca and K on some growth indices, body biochemical composition and some whole body minerals in rainbow trout fingerlings in a culture system to access the new data in the widely range.
Materials and MethodsExperimental fish and conditions
All rainbow trout (O. mykiss) fingerlings were provided by fish farm from Dohezar; Tonekabon (mazandaran-Iran) and transferred to experimental fish farm of university of Tehran (Karaj-Iran). After primary accumulation, 30 rainbow trout fingerling, introduced in each experimental units randomly, and fed with basic diets (5% biomass) for 10 days. Then, 25 pieces of fish (initial mean weight: 12.18 ± 0.04 gram for experiment І and 15.60 ± 0.05 gram for experiment ІІ) introduced in to 12 fiberglass tanks containing 200 L water for each experiment respectively, and fed whit experimental diets for 8-week period. Water of each units were re- circulated with a water pump and filtered for collecting the fecal matters and other suspended solids. 20%
of water were exchanged after two days and aerated with one air pump. Temperatures were satiable at 16-17°C and light period was naturally regulated.
Feed production and feeding regime
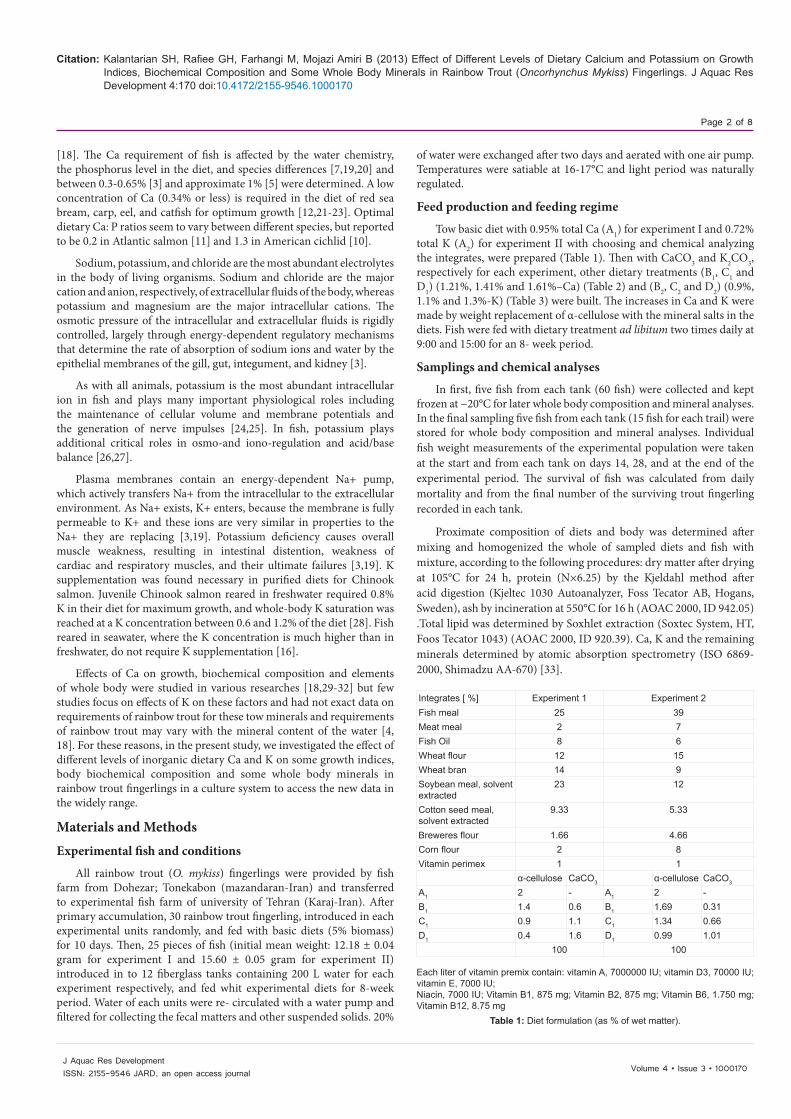
Tow basic diet with 0.95% total Ca (A1) for experiment І and 0.72% total K (A2) for experiment ІІ with choosing and chemical analyzing the integrates, were prepared (Table 1). Then with CaCO3 and K2CO3, respectively for each experiment, other dietary treatments (B1, C1 and D1) (1.21%, 1.41% and 1.61%–Ca) (Table 2) and (B2, C2 and D2) (0.9%, 1.1% and 1.3%-K) (Table 3) were built. The increases in Ca and K were made by weight replacement of α-cellulose with the mineral salts in the diets. Fish were fed with dietary treatment ad libitum two times daily at 9:00 and 15:00 for an 8- week period.
Samplings and chemical analyses
In first, five fish from each tank (60 fish) were collected and kept frozen at −20°C for later whole body composition and mineral analyses. In the final sampling five fish from each tank (15 fish for each trail) were stored for whole body composition and mineral analyses. Individual fish weight measurements of the experimental population were taken at the start and from each tank on days 14, 28, and at the end of the experimental period. The survival of fish was calculated from daily mortality and from the final number of the surviving trout fingerling recorded in each tank.
Proximate composition of diets and body was determined after mixing and homogenized the whole of sampled diets and fish with mixture, according to the following procedures: dry matter after drying at 105°C for 24 h, protein (N×6.25) by the Kjeldahl method after acid digestion (Kjeltec 1030 Autoanalyzer, Foss Tecator AB, Hogans, Sweden), ash by incineration at 550°C for 16 h (AOAC 2000, ID 942.05) .Total lipid was determined by Soxhlet extraction (Soxtec System, HT, Foos Tecator 1043) (AOAC 2000, ID 920.39). Ca, K and the remaining minerals determined by atomic absorption spectrometry (ISO 6869-2000, Shimadzu AA-670) [33].
Integrates [ %] Experiment 1 Experiment 2Fish meal 25 39Meat meal 2 7Fish Oil 8 6Wheat flour 12 15Wheat bran 14 9Soybean meal, solvent extracted
23 12
Cotton seed meal, solvent extracted
9.33 5.33
Breweres flour 1.66 4.66Corn flour 2 8Vitamin perimex 1 1
α-cellulose CaCO3 α-cellulose CaCO3
A1 2 - A1 2 -B1 1.4 0.6 B1 1.69 0.31C1 0.9 1.1 C1 1.34 0.66D1 0.4 1.6 D1 0.99 1.01
100 100
Each liter of vitamin premix contain: vitamin A, 7000000 IU; vitamin D3, 70000 IU; vitamin E, 7000 IU;Niacin, 7000 IU; Vitamin B1, 875 mg; Vitamin B2, 875 mg; Vitamin B6, 1.750 mg; Vitamin B12, 8.75 mg
Table 1: Diet formulation (as % of wet matter).
Citation: Kalantarian SH, Rafiee GH, Farhangi M, Mojazi Amiri B (2013) Effect of Different Levels of Dietary Calcium and Potassium on Growth Indices, Biochemical Composition and Some Whole Body Minerals in Rainbow Trout (Oncorhynchus Mykiss) Fingerlings. J Aquac Res Development 4:170 doi:10.4172/2155-9546.1000170
Page 3 of 8
Volume 4 • Issue 3 • 1000170J Aquac Res DevelopmentISSN: 2155-9546 JARD, an open access journal
Calculations and statistical analyses
- Growth indices and feed conversion were determined according to the following formulas (W2=final bodyweight, W1=initial body weight):
- Growth percent: G%= (W2/W1)×100
- Specific growth rate: SGR (%)=(ln W2−ln W1)×100/feeding days.
- Feed conversion ratio: FCR=feed consumed/biomass gain.
- Thermal growth coefficient: TGC=(W2 1/3−W1
1/3)×1000/Σ (t×feeding day) [34].
Percentage data were arc-sin transformed and data were checked for heterogeneity and normality prior to analysis and transformed, if necessary. Analytical data were subjected to one-way analysis of variance (ANOVA) using SPSS 18.0 for Windows and differences between means were tested using the Duncan test. Data are given as means ± standard errors and effects were considered significant at a probability level of Pb 0.05.
ResultsGrowth indices
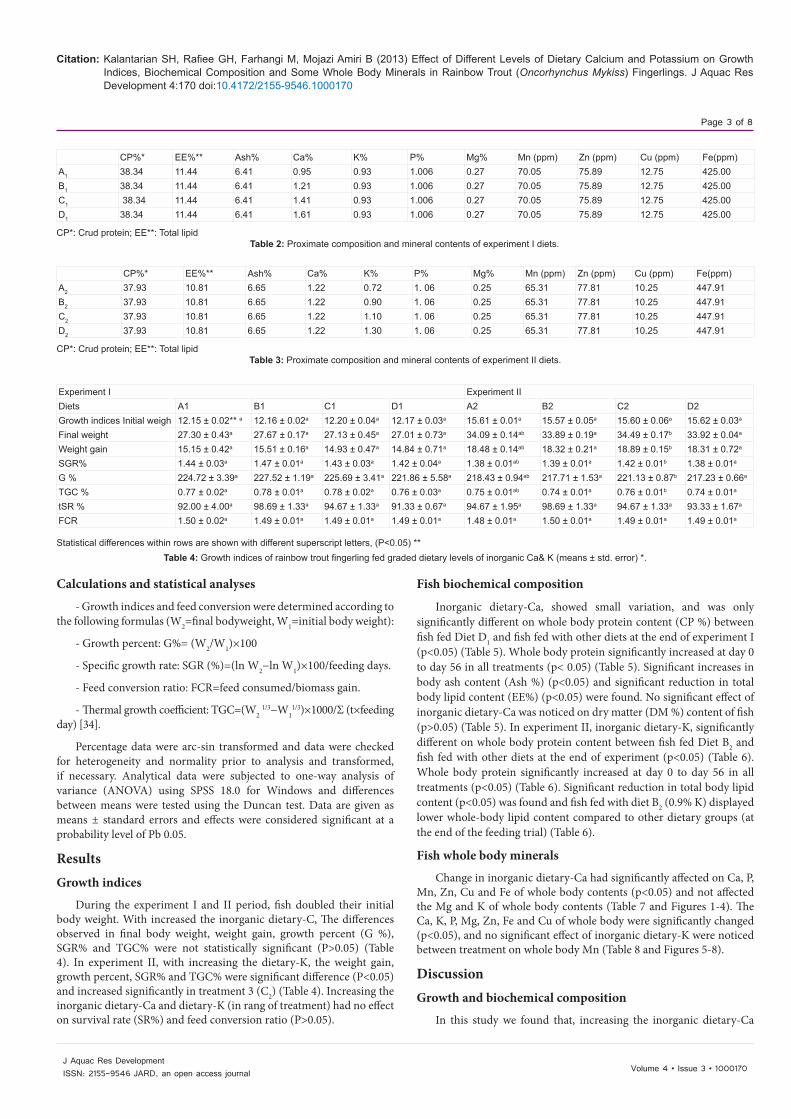
During the experiment І and ІІ period, fish doubled their initial body weight. With increased the inorganic dietary-C, The differences observed in final body weight, weight gain, growth percent (G %), SGR% and TGC% were not statistically significant (P>0.05) (Table 4). In experiment ІІ, with increasing the dietary-K, the weight gain, growth percent, SGR% and TGC% were significant difference (P<0.05) and increased significantly in treatment 3 (C2) (Table 4). Increasing the inorganic dietary-Ca and dietary-K (in rang of treatment) had no effect on survival rate (SR%) and feed conversion ratio (P>0.05).
Fish biochemical composition
Inorganic dietary-Ca, showed small variation, and was only significantly different on whole body protein content (CP %) between fish fed Diet D1 and fish fed with other diets at the end of experiment І (p<0.05) (Table 5). Whole body protein significantly increased at day 0 to day 56 in all treatments (p< 0.05) (Table 5). Significant increases in body ash content (Ash %) (p<0.05) and significant reduction in total body lipid content (EE%) (p<0.05) were found. No significant effect of inorganic dietary-Ca was noticed on dry matter (DM %) content of fish (p>0.05) (Table 5). In experiment ІІ, inorganic dietary-K, significantly different on whole body protein content between fish fed Diet B2 and fish fed with other diets at the end of experiment (p<0.05) (Table 6). Whole body protein significantly increased at day 0 to day 56 in all treatments (p<0.05) (Table 6). Significant reduction in total body lipid content (p<0.05) was found and fish fed with diet B2 (0.9% K) displayed lower whole-body lipid content compared to other dietary groups (at the end of the feeding trial) (Table 6).
Fish whole body minerals
DiscussionGrowth and biochemical composition
In this study we found that, increasing the inorganic dietary-Ca
CP%* EE%** Ash% Ca% K% P% Mg% Mn (ppm) Zn (ppm) Cu (ppm) Fe(ppm)A1 38.34 11.44 6.41 0.95 0.93 1.006 0.27 70.05 75.89 12.75 425.00B1 38.34 11.44 6.41 1.21 0.93 1.006 0.27 70.05 75.89 12.75 425.00C1 38.34 11.44 6.41 1.41 0.93 1.006 0.27 70.05 75.89 12.75 425.00D1 38.34 11.44 6.41 1.61 0.93 1.006 0.27 70.05 75.89 12.75 425.00
CP*: Crud protein; EE**: Total lipid Table 2: Proximate composition and mineral contents of experiment І diets.
CP%* EE%** Ash% Ca% K% P% Mg% Mn (ppm) Zn (ppm) Cu (ppm) Fe(ppm)A2 37.93 10.81 6.65 1.22 0.72 1. 06 0.25 65.31 77.81 10.25 447.91B2 37.93 10.81 6.65 1.22 0.90 1. 06 0.25 65.31 77.81 10.25 447.91C2 37.93 10.81 6.65 1.22 1.10 1. 06 0.25 65.31 77.81 10.25 447.91D2 37.93 10.81 6.65 1.22 1.30 1. 06 0.25 65.31 77.81 10.25 447.91
CP*: Crud protein; EE**: Total lipid Table 3: Proximate composition and mineral contents of experiment ІІ diets.
Experiment І Experiment ІІDiets A1 B1 C1 D1 A2 B2 C2 D2Growth indices Initial weigh 12.15 ± 0.02** a 12.16 ± 0.02a 12.20 ± 0.04a 12.17 ± 0.03a 15.61 ± 0.01a 15.57 ± 0.05a 15.60 ± 0.06a 15.62 ± 0.03a
Final weight 27.30 ± 0.43a 27.67 ± 0.17a 27.13 ± 0.45a 27.01 ± 0.73a 34.09 ± 0.14ab 33.89 ± 0.19a 34.49 ± 0.17b 33.92 ± 0.04a
Weight gain 15.15 ± 0.42a 15.51 ± 0.16a 14.93 ± 0.47a 14.84 ± 0.71a 18.48 ± 0.14ab 18.32 ± 0.21a 18.89 ± 0.15b 18.31 ± 0.72a
SGR% 1.44 ± 0.03a 1.47 ± 0.01a 1.43 ± 0.03a 1.42 ± 0.04a 1.38 ± 0.01ab 1.39 ± 0.01a 1.42 ± 0.01b 1.38 ± 0.01a
G % 224.72 ± 3.39a 227.52 ± 1.19a 225.69 ± 3.41a 221.86 ± 5.58a 218.43 ± 0.94ab 217.71 ± 1.53a 221.13 ± 0.87b 217.23 ± 0.66a
TGC % 0.77 ± 0.02a 0.78 ± 0.01a 0.78 ± 0.02a 0.76 ± 0.03a 0.75 ± 0.01ab 0.74 ± 0.01a 0.76 ± 0.01b 0.74 ± 0.01a
tSR % 92.00 ± 4.00a 98.69 ± 1.33a 94.67 ± 1.33a 91.33 ± 0.67a 94.67 ± 1.95a 98.69 ± 1.33a 94.67 ± 1.33a 93.33 ± 1.67a
FCR 1.50 ± 0.02a 1.49 ± 0.01a 1.49 ± 0.01a 1.49 ± 0.01a 1.48 ± 0.01a 1.50 ± 0.01a 1.49 ± 0.01a 1.49 ± 0.01a
Statistical differences within rows are shown with different superscript letters, (P<0.05) **Table 4: Growth indices of rainbow trout fingerling fed graded dietary levels of inorganic Ca& K (means ± std. error) *.
Change in inorganic dietary-Ca had significantly affected on Ca, P, Mn, Zn, Cu and Fe of whole body contents (p<0.05) and not affected the Mg and K of whole body contents (Table 7 and Figures 1-4). The Ca, K, P, Mg, Zn, Fe and Cu of whole body were significantly changed (p<0.05), and no significant effect of inorganic dietary-K were noticed between treatment on whole body Mn (Table 8 and Figures 5-8).

Citation: Kalantarian SH, Rafiee GH, Farhangi M, Mojazi Amiri B (2013) Effect of Different Levels of Dietary Calcium and Potassium on Growth Indices, Biochemical Composition and Some Whole Body Minerals in Rainbow Trout (Oncorhynchus Mykiss) Fingerlings. J Aquac Res Development 4:170 doi:10.4172/2155-9546.1000170
Page 4 of 8
Volume 4 • Issue 3 • 1000170J Aquac Res DevelopmentISSN: 2155-9546 JARD, an open access journal
(between 0.95-1.61%) could not significantly effect on some growth indices. The diet B1 with 1.21% total Ca showed the best growth indices and trail 4 (D1) with 1.61% Ca had lowest rates. It is recorded that, dietary Ca is not required for some fish species held in freshwater such as common carp, chum salmon, rainbow trout, channel catfish and
Treatment (diets)
Day 0 A1 (day 56) B1 (day 56) C1 (day 56) D1(day 56)
Biochemical compositionCP %EE %Ash %DM %
52.34 ± 1.54*a**38.05 ± 0.15d
8.00 ± 0.20a
99.50 ± 0.30a
63.23 ± 0.99b
20.45 ± 0.85c
11.00 ± 0.00b
99.30 ± 0.30a
63.68 ± 0.36b
17.35 ± 0.75b
12.80 ± 0.20c
99.75 ± 0.50a
61.98 ± 0.69b
19.40 ± 0.30c
13.10 ± 0.30c
99.60 ± 0.20a
67.95 ± 0.53c
11.85 ± 0.25a
16.50 ± 0.25d
99.65 ± 0.50a
Statistical differences within rows are shown with different superscript letters, (P<0.05)**. Table 5: Whole body biochemical composition of rainbow trout fingerling in first and fish fed graded dietary levels of inorganic Ca at the end of experiment І (means ± std. error).
Treatment (diets)
Day 0 A2 (day 56) B2 (day 56) C2 (day 56) D2 (day 56)
biochemical compositionCP %EE %Ash %DM %
52.34 ± 1.54*a**38.05 ± 0.15e
8.00 ± 0.20a
99.50 ± 0.30a
67.93 ± 0.39b
13.25 ± 0.25b
14.60 ± 0.60b
99.70 ± 0.25a
72.62 ± 2.16c
8.40 ± 0.10a
15.90 ± 0.10b
99.65 ± 0.30a
63.71 ± 0.01bb
17.25 ± 0.65d
15.50 ± 0.90b
99.60 ± 0.40a
65.08 ± 0.04 14.95 ± 0.15c
14.90 ± 0.30b
99.50 ± 0.50a
Statistical differences within rows are shown with different superscript letters, (P<0.05) .** Table 6: Whole body biochemical composition of rainbow trout fingerling in first and fish fed graded dietary levels of inorganic k at the end of experiment ІІ (means ± std. error) *.
Treatment (diets)
Day 0 A1 (day 56) B1 (day 56) C1 (day 56) D1 (day 56)
Minerals (%) CalciumPhosphorusPotassiumMagnesium
2.06 ± 0.04*a**1.16 ± 0.01a
0.81 ± 0.01a
0.16 ± 0.01a
2.48 ± 0.15ab
1.84 ± 0.01c
0.80 ± 0.02a
0.19 ± 0.01c
2.46 ± 0.13ab
1.88 ± 0.01d
0.81 ± 0.01a
0.19 ± 0.00c
2.52 ± 0.06b
1.82 ± 0.00bb 0.81 ± 0.02a
0.18 ± 0.00ba
3.21 ± 0.31c 1.82 ± 0.00 0.81 ± 0.01a 0.20 ± 0.02
Statistical differences within rows are shown with different superscript letters, (P<0.05) **. Table 7: Whole body mineral composition of rainbow trout fingerling in first and fish fed graded dietary levels of inorganic Ca at the end of experiment І (means ± std. error)*.
Treatment (diets)
Day 0 A2 (day 56) B2 (day 56) C2 (day 56) D2 (day 56)
Minerals (%) CalciumPhosphorusPotassiumMagnesium
2.06 ± 0.04*a**1.16 ± 0.01a
0.81 ± 0.01a
0.16 ± 0.01a
3.60 ± 0.13b
1.79 ± 0.00c
0.83 ± 0.00a
0.20 ± 0.01c
3.50 ± 0.01b
1.84 ± 0.00e
0.90 ± 0.02b
0.22 ± 0.02d
3.59 ± 0.18b
1.82 ± 0.02d
0.95 ± 0.02bc
0.19 ± 0.00b
4.21 ± 0.01c 1.80 ± 0.00b 0.97 ± 0.01c 0.21 ± 0.02c
Statistical differences within rows are shown with different superscript letters, (P<0.05)**.Table 8: Whole body mineral composition of rainbow trout fingerling in first and fish fed graded dietary levels of inorganic K at the end of experiment ІІ (means ± std. error) .*
0
50
100
150
Zn
(ppm
)
day0 A1 B1 C1 D1
bd
b ac
Figure 1: Whole body Zn composition of rainbow trout fingerling in first and fish fed graded dietary levels of inorganic-Ca at the end of experiment І. Means not sharing a common superscript letter are significantly different (P<0.05) accord-ing to one-way ANOVA followed by a Duncan’s test.
05
1015202530
Mn
(ppm
)
day0 A1 B1 C1 D1
ab aab
ab
Figure 2: Whole body Mn composition of rainbow trout fingerling in first and fish fed graded dietary levels of inorganic-Ca at the end of experiment І. Means not sharing a common superscript letter are significantly different (P<0.05) accord-ing to one-way ANOVA followed by a Duncan’s test.
0
10
20
30
40C
u(p
pm)
day0 A1 B1 C1 D1
cba ab ab c
Figure 3: Whole body Cu composition of rainbow trout fingerling in first and fish fed graded dietary levels of inorganic-Ca at the end of experiment І. Means not sharing a common superscript letter are significantly different (P<0.05) accord-ing to one-way ANOVA followed by a Duncan’s test.
0
200
400
600
800
Fe (p
pm)
day0 A1 B1 C1 D1
c b b a
d
Figure 4: Whole body Fe composition of rainbow trout fingerling in first and fish fed graded dietary levels of inorganic-Ca at the end of experiment І. Means not sharing a common superscript letter are significantly different (P<0.05) accord-ing to one-way ANOVA followed by a Duncan’s test.
0
50
100
150
200
Zn
(ppm
)
day0 A2 B2 C2 D2
ac b b
a
Figure 5: Whole body Zn composition of rainbow trout fingerling in first and fish fed graded dietary levels of inorganic-K at the end of experiment ІІ. Means not sharing a common superscript letter are significantly different (P<0.05) accord-ing to one-way ANOVA followed by a Duncan’s test.

Citation: Kalantarian SH, Rafiee GH, Farhangi M, Mojazi Amiri B (2013) Effect of Different Levels of Dietary Calcium and Potassium on Growth Indices, Biochemical Composition and Some Whole Body Minerals in Rainbow Trout (Oncorhynchus Mykiss) Fingerlings. J Aquac Res Development 4:170 doi:10.4172/2155-9546.1000170
Page 5 of 8
Volume 4 • Issue 3 • 1000170J Aquac Res DevelopmentISSN: 2155-9546 JARD, an open access journal
guppy (Poecilia reticulata.) [21,22,35-37]. In Atlantic salmon reared in freshwater and rainbow trout fry, the dietary Ca, had not significant effects on growth and final body weight [11,18]. In Atlantic cod (Gadus morhua), WG, final body weight, SGR% and TGC% were not affected by dietary-Ca between 0.4–1.2% in diet [32]. These finding indicating that fish can require Ca needs, through the surrounding water [38-41]. Takagi et al. (1989) Observed that both water and dietary Ca requiring sources of Ca for normal calcification of regenerating scales in tilapia. Some marine fish such as red lip mullet, giant croaker and tiger puffer also showed a necessity for dietary Ca supplementation when fed purified or semi-puri-fied diets [9,15,42]. In contrast, Sakamoto and Yone (1976) reported that a dietary Ca supplement was dispensable for red sea bream fed a purified diet. It has been reported that a dietary Ca supplement is essential in tilapia (Tilapia mossambica.), even while they are reared in artificial seawater [43]. Therefore, the Ca requirement in marine fishes appears to be species-specific [9]. In many studies,
the Ca and P ratio (Ca: P) in diets reported as important factor to attain the suitable growth. In this research, for balancing the Ca in treatments, the Ca: P ratio in experimental treatments changed within the experimental diets and ranged to 0.95, 1.2, 1.4 and 1.6. In juvenile Grouper (Epinephelus coioides), increasing the Ca supplementation in diet caused a depletion in growth [31]. Growth of rainbow trout fry was not affected by dietary P or Ca level which it was in agreement with some other studies shown that the requirement for P is lower for growth than maximum P deposition [44-46]. Channel catfish and tilapia reared in calcium-free water showed requirement of 0.45% and 0.7% Ca in the diet, respectively. The uptake of Ca from seawater was not sufficient to meet the Ca requirement of red sea bream, and it is shown that dietary Ca at least 0.34% Ca in the diet [12,15,16,47,48] is necessary for growth of redlip mullet, Japanese flounder and scorpion fish, but not for black sea bream [9].
Increasing the inorganic dietary-k (between 0.72-1.3%) significantly affected on some growth indices (WG, final body weight, SGR% and TGC %). The diet C2 with 1.1% total K showed the higher growth indices and trail 2(B2) with 0.9 % and then the trail 4 (D2) with 1.3% K had lowest in this indices. Findings of this research showed that, the dietary-K significantly affected the rainbow trout fingerlings growth. K supplementation was found necessary in purified diets for juvenile Chinook salmon reared in freshwater (required 0.8% K in their diet for maximum growth) [28]. Results we found in this research showed that, the dietary-Ca and K requirements for fish growth were species-specific and dependent to water chemistry, ecosystem and interaction between minerals especially Ca and P.
In this research, it was shown that, increasing the inorganic dietary-Ca and K, causing to increase the crude protein and decrease the total lipid (Tables 5 and 6) in whole body of fish. In this respect, there is not dietary-Ca and K impact on fish protein content or protein utilization in haddock and Atlantic salmon [29], however P inadequacy caused a decrease in the whole body protein content [30]. It is well known that dietary Ca can lower the net absorption of dietary fat by its precipitating in the digestive tract resulting in the increased fat excretion in feces [49]. The whole body lipid level of cod increased when the dietary P level was inadequate. The same effect has also been observed in haddock [30], Atlantic salmon [29], rainbow trout [45,46] and other farmed fish species [10,50-52]. The mechanism behind this effect remains to be elucidated. Assumptions were made that this is caused by the accumulation of fatty acids due to impaired β-oxidation [51] or oxidative phosphorylation due to P deficiency, leading to the inhibition of the TCA cycle and accumulation of acetyl-CoA and an increase in fatty acid synthesis [46]. Interestingly, Ca supplement under the two P levels decreased whole body and muscle lipid, and liver protein, which suggests Ca supplement has the same effects associated with P supplement on decreasing lipid accumulation, and a relationship between Ca and protein metabolism.
It seems that, with increasing the dietary-Ca and these effects on Ca of water (kalantarian et al. unpublished data) activity of Ca regulatory proteins such as Calamodulin and Troponin C, increased. On the other hands, increasing the activity of phagocytosic cells as a result of role of Ca ion on immunological activity, caused to increase the total crude proteins of whole body in this study [53]. Our findings, concluding that there is a lack of information or data about the effects of inorganic dietary-K on biochemical composition of rainbow trout. It seems that, as a result of depletion of lipid in primary diets, significant difference between trails of K was observed. In this regarded, physiologic process
17181920212223
Mn
(ppm
)
day0 A2 B2 C2 D2
a a aa
a
Figure 6: Whole body Mn composition of rainbow trout fingerling in first and fish fed graded dietary levels of inorganic-K at the end of experiment ІІ. Means not sharing a common superscript letter are significantly different (P<0.05) according to one-way ANOVA followed by a Duncan’s test.
0
10
20
30
40
)pp
m(
Cu
day0 A2 B2 C2 D2
ac
ba a
Figure 7: Whole body Cu composition of rainbow trout fingerling in first and fish fed graded dietary levels of inorganic-K at the end of experiment ІІ. Means not sharing a common superscript letter are significantly different (P<0.05) according to one-way ANOVA followed by a Duncan’s test.
050
100150200250300350
Fe (p
pm)
day0 A2 B2 C2 D2
ba a a
b
Figure 8: Whole body Fe composition of rainbow trout fingerling in first and fish fed graded dietary levels of inorganic-K at the end of experiment ІІ. Means not sharing a common superscript letter are significantly different (P<0.05) according to one-way ANOVA followed by a Duncan’s test.
Citation: Kalantarian SH, Rafiee GH, Farhangi M, Mojazi Amiri B (2013) Effect of Different Levels of Dietary Calcium and Potassium on Growth Indices, Biochemical Composition and Some Whole Body Minerals in Rainbow Trout (Oncorhynchus Mykiss) Fingerlings. J Aquac Res Development 4:170 doi:10.4172/2155-9546.1000170
Page 6 of 8
Volume 4 • Issue 3 • 1000170J Aquac Res DevelopmentISSN: 2155-9546 JARD, an open access journal
of diet protein and lipid absorption in relation to various ions should be analyzed.
The role of dietary Ca in lipid and protein metabolism remains to be elucidated [31]. Increasing the inorganic dietary-Ca (between 0.95-1.61%) significantly increased the whole body ash and had not significant effect on inorganic dietary-K (between 0.72-1.3%) and Ca were noticed between treatment on whole body ash and dry matter contents. The whole body ash content in cod steadily increased with an increase in dietary P and Ca supplementation. An increase in body ash recorded while dietary P increased in haddock [30] as well as in several other farmed fish species [10,21,36,51,54]. Different from that found in Atlantic salmon [11], the dietary Ca supplementation had not a significant effect on body ash levels in cod, in contrast in other fish species an increase in levels of dietary Ca had a positive effect on vertebrae ash levels when dietary P levels were sufficient [55,56]. Effects of dietary-Ca and K, as a mineral that affected the ash and dry matter may be attended.
Whole body mineral content
Whole body minerals content showed small variation. There are several reports showing that changes in the levels of Ca affects the availability of other minerals both in terrestrial animals [57] and in fish [58] probably due to competitive inhibition of these cations during intestinal absorption [30]. When Ca is oversupplied, P absorption by the intestine may be hindered by its combination with Ca to form biologically unavailable calcium phosphates [59]. Dietary Ca also affected the growth but not vertebral Ca and P contents of channel blue tilapia and catfish when reared in Ca-free water [8,23]. However, O’Connell and Gatlin (1994) observed in blue tilapia that a dietary Ca supplement increased the bone Ca content when they were reared in low-Ca water. In addition to the potential dietary essentiality, dietary Ca may interact with other essential dietary minerals such as P, magnesium (Mg) and zinc (Zn) [11,13,60,61]. For instance, Nakamura (1982) reported excess dietary Ca inhibited P absorption in common carp. Increasing levels of dietary P have caused an increase in P, Ca, Mg and K levels in rainbow trout [45], a decrease in Zn and/or Mn levels in rainbow trout [60,62] as well as a decrease in Atlantic salmon vertebrae Mg levels [11].
Some studies in other fish species [13,63,64] the dietary Ca supplementation without additional P did not result in a significant decrease in vertebrae P or Ca content, but it did induce a significant decrease in the levels of vertebrae Mg and Mn. A negative effect of high dietary Ca supplementation on vertebrae Cu, Fe, Zn and Mn, has been observed in scorpion fish [9]. An antagonistic relation in fish between Ca and P, Mg and Zn utilization has been reported [11,60] and although fish are able to take up Mg from the water. Indicating dietary Ca supplement was not necessary for Mg deposition whether P was supplemented or not and excess Ca had a negative on Mg and Zn deposition. High concentration of dietary Ca interferes with the absorption and retention of certain trace elements and Mg [3]. An inhibited effect of dietary Ca supplement on Mg deposition in scales and vertebrae has been reported in Atlantic salmon [11]. It has been reported in scorpion fish that a supplementation of 2.5% Ca as tricalcium phosphate decreased Zn content of vertebrae from 0.162 to 0.076 mg/g [48] and 4% tricalcium phosphate supplementation in the diet of rainbow trout decreased bone Zn from about 0.18 to 0.11 mg/g [65]. Rafiee and saad [66] found that the red tilapia could assimilate 11.46% Fe, 13.43% Zn, 6.81% Mn, 3.55% Cu, 26.81 Ca%, 20.29% Mg, 32.53% N, 7.16% K and 15.98% P content of the feed supply during a culture period.
Fontagné et al. [18] showed that dietary Ca deficiency did not affect whole-body composition. Requirement of rainbow trout fry can be met in large part by absorption of Ca through gills and skin in freshwater [3], especially when the Ca content of water is relatively high (83 mg/L) as in the present study [18]. Fish fed diets without P supplements showed reduced mineral (Ca, P and Mg) deposition in scales, vertebrae and opercula. When P was not supplemented, Ca supplement of 6 g kg-1 had no significant effect on mineral (Ca, P, Mg and Zn) deposition in scales and vertebrae. When diets were supplemented with 6 g kg-1 P, Ca supplement of 6 g kg-1 had no significant effect on mineral (Ca, P and Mg) content in scales, vertebrae and opercula, but excess Ca supplement (up to 12 g kg-1) had a negative effect on scale mineral (Ca, P and Mg) deposition and vertebrae Zn deposition. Ca supplement of 6 g kg-1 (Ca/P=1) might be optimum when diet was supplemented with 6 g kg-1 P.
In marine fishes the Ca content of whole body and vertebrae were not affected by the lack of dietary Ca supplement. In other words, Ca absorption from seawater was sufficient for maintaining normal tissue Ca but not for normal growth, similar results recorded in red lip mullet, giant croaker and tiger puffer [9,15,42]. These findings, concluding that there is a lack of information or data about the effects of inorganic dietary-K on Whole body minerals content of rainbow trout. However in whole mineral content is very difficult to observe clear effects of increasing or decreasing dietary-Ca or K on other minerals and requiring to more studies on this subject.
ConclusionsThe present experiment suggests that inorganic dietary-Ca in tested
range had no significant effects on growth, whole body minerals and biochemical composition of trout in range of The Ca of water (100 mg/l in first and 57-73 mg/l during experiment I), which is in agreement with the generally accepted view that most of fish can absorb Ca from the aquatic environment or from feed ingredients to meet their requirements. Inorganic dietary-K had significant effect on growth, whole body minerals and biochemical composition of trout. The role of dietary-K on reduction of Zn and Cu of whole body content may be important. Suggested that the optimums percent of inorganic dietary-Ca and K for rainbow trout fingerlings growth are 1.21% Ca and 1.1% K.
Acknowledgements
This study was supported by the department of fisheries of University of Tehran-karaj-Iran. The authors would like to thank A.R. Naisi for the technical assistance and care of fish and A. Nazarzade for technical support.
References
1. Watanabe T, Kiron V, Satoh Sh (1997) Trace minerals in fish nutrition. Aquaculture 151: 185-207.
2. Glover CN, Bury NR, Hogstrand C (2004) Intestinal zinc uptake in freshwater rainbow trout: evidence for apical pathways associated with potassium efflux and modified by calcium. Biochim Biophys Acta 1663: 214-221.
3. Lall SP (2002) The minerals, Fish Nutrition, (3rdedn). Elsevier, Amsterdam, The Netherlands: 259-308.
4. Cowey CB (1992) Nutrition: estimating requirements of rainbow Trout. Aquaculture 100: 177-189.
5. NRC (1993) Nutrient Requirements of Fish. National Academy Press, Washington, DC, USA.
6. Dato-Cajegas CR, Yakupitiyage A (1996) The need for dietary mineral supplementation for Nile tilapia, Oreochromis niloticus, cultured in a semi-intensive system. Aquaculture 144: 227-237.
7. Lall SP, Lewis-McCrea LM (2007) Role of nutrients in skeletal metabolism and pathology in fish-An overview. Aquaculture 267: 3-19.

Citation: Kalantarian SH, Rafiee GH, Farhangi M, Mojazi Amiri B (2013) Effect of Different Levels of Dietary Calcium and Potassium on Growth Indices, Biochemical Composition and Some Whole Body Minerals in Rainbow Trout (Oncorhynchus Mykiss) Fingerlings. J Aquac Res Development 4:170 doi:10.4172/2155-9546.1000170
Page 7 of 8
Volume 4 • Issue 3 • 1000170J Aquac Res DevelopmentISSN: 2155-9546 JARD, an open access journal
8. Robinson EH, LaBomascus D, Brown PB, Linton TL (1987) Dietary calcium and phosphorus requirements of Oreochromis aureus reared in calcium-free water. Aquaculture 64: 267-276.
9. Hossain MA, Furuichi M (2000) Essentiality of dietary calcium supplement in redlip mullet Liza haematocheila. Aquacult Nutr 6: 33-38.
10. Chavez-Sanchez C, Martinez-Palacios CA, Martinez-Perez G, Ross LG (2000) Phosphorus and calcium requirements in the diet of the American cichlid Cichlasoma uraphthalmus (Gunther). Aquaculture Nutrition 6: 1-9.
12. Sakamoto S, Yone Y (1973) Effect of dietary calcium/phosphorus ratio upon growth, feed efficiency and blood serum Ca and P level in red sea bream. Bulletin of the Japanese Society of Scientific Fisheries 39: 343-348.
13. Nakamura Y (1982) Effects of dietary phosphorus and calcium contents on the absorption of phosphorus in the digestive tract of carp. Bulletin of the Japanese Society of Scientific Fisheries 48: 409-413.
14. Furuichi M, Furusho Y, Hossain MA, Matsui S, Azuma R (1997) Essentiality of Ca supplement to white fish meal diet for tiger puffer. J Fac Agric KyushuUniv 42:77-85.
15. Hossain MA, Furuichi M (1999) Dietary calcium requirement of giant croaker Nibea japonica. J Fac Agric Kyushu Univ 44: 99-104.
16. Sakamoto S, Yone Y (1978) Effect of dietary phosphorus level on chemical composition of red sea bream. Bull Jpn Soc Sci Fish 44: 227-229.
17. Hossain MA, Furuichi M (1999) Necessity of dietary calcium supplement in black sea bream. Fish Sci 65: 893-897.
19. Roy LA, Davis DA, Saoud IP, Henry RP (2007) Effects of varying levels of aqueous potassium and magnesium on survival, growth, and respiration of the Pacific white shrimp, Litopenaeus vannamei, reared in low salinity waters. Aquaculture 262: 461-469.
20. Partridge GJ, Lymbery AJ (2008) The effect of salinity on the requirement for potassium by barramundi (Lates calcarifer) in saline groundwater. Aquaculture 278: 164-170.
21. Ogino C, Takeda H (1976) Mineral requirements of fish III. Calcium and phosphorus requirements in carp. Bulletin of the Japanese Society of Scientific Fisheries 42: 793-799.
22. Lovell RT, Li YP (1978) Dietary phosphorus requirement of channel catfish (Ictalurus punctatus). Trans Am Fish Soc 107: 617-621.
24. Epstein FH, Silva P, Kormanik G (1980) Role of Na-K-ATPase in chloride cell function. Am J Physiol 238: 246-250.
25. McDonough AA, Thompson CB, Youn JH (2002) Skeletal muscle regulates extracellular potassium. Am J Physiol Renal Physiol 282: 967-974.
26. Marshall WS, Bryson SE (1998) Transport mechanisms of seawater teleost chloride cells: an inclusive model of a multifunctional cell. Comp Biochem Physiol A Mol Integr Physiol 119: 97-106.
27. Evans DH, Piermarini PM, Choe KP (2005) The multifunctional fish gill: dominant site of gas exchange, osmoregulation, acid-base regulation, and excretion of nitrogenous waste. Physiol Rev 85: 97-177.
28. Shearer KD (1988) Dietary Potassium Requirement of Juvenile Chinook Salmon. Aquaculture 73: 119-129.
30. Roy PK, Lall SP (2003) Dietary phosphorus requirement of juvenile haddock (Melanogrammus aeglefinus L.). Aquaculture 221: 451-468.
31. Ye Ch, Liu YJ, Tian LX, Mai KS, Du ZY, et al. (2006) Effect of dietary calcium and
phosphorus on growth, feed efficiency, mineral content and body composition of juvenile grouper, Epinephelus coioides. Aquaculture 255: 263-271.
32. Kousoulaki K, Fjelldal PG, Aksnes A, Albrektsen S (2010) Growth and tissue mineralisation of Atlantic cod (Gadus Morhua) fed soluble P and Ca salts in the diet. Aquaculture 309: 181-192.
33. Petterson DS, Choct M, Rayner JC, Harris DJ, Blakeney AB (1999) Methods of the analysis of premium livestock grains. Australian Journal of Agricultural Reasearch 50: 775-788.
35. Ogino C, Takeda H (1978) Requirements of rainbow trout for dietary calcium and phosphorus. Bulletin of the Japanese Society of Scientific Fisheries 44: 1019-1022.
36. Watanabe T, Murakami A, Takeuchi L, Nose T, Ogino C (1980) Requirement of Chum salmon held in freshwater for dietary phosphorus. Bulletin of the Japanese Society of Scientific Fisheries 46: 361-367.
37. Shim KF, Ho CS (1989) Calcium and phosphorus requirements of guppy Poecilia reticulata. Nippon Suisan Gakkaishi 55: 1947-1953.
38. Lovelace FE, Podoliak HA (1952) Absorption of radioactive calcium by brook trout. Prog Fish-Cult 14: 154-158.
39. Ichikawa R, Oguri M (1961) Metabolism of Radionuclides in Fish. I. Strontium-Calcium Discrimination in Gill Absorption. Bull Jpn Soc Sci Fish 27: 351-356.
40. Templeton WL, Brown VM (1963) Accumulation of calcium and strontium by brown trout from waters in the United Kingdom. Nature 198: 198-200.
41. Love RM (1980) In: The Chemical Biology of Fishes. Academic Press, New York 2: 943.
42. Hossain MA, Furuichi M (1998) Availability of environmental and dietary calcium in tiger puffer. Aquacultur Int 6: 121-132.
44. Shearer KD, Hardy RW (1987) Phosphorus deficiency in rainbow trout fed a diet containing deboned fillet scrap. Prog Fish-Cult 49: 192-197.
49. Lorenzen JK, Nielsen S, Holst JJ, Tetens I, Rehfeld JF, et al. (2007) Effect of dairy calcium or supplementary calcium intake on postprandial fat metabolism, appetite, and subsequent energy intake. Am J Clin Nutr 85: 678-687.
50. Takeuchi M, Nakazoe J (1981) Effect of dietary phosphorus on lipid content and its composition in carp. Bulletin of the Japanese Society of Scientific Fisheries 47: 347–352.
51. Vielma J, Koskela J, Ruohonen K (2002) Growth, bone mineralization, and heat and low oxygen tolerance in European whitefish (Coregonus lavaretus L.) fed with graded levels of phosphorus. Aquaculture 212: 321-333.
53. Nikapitiya C, De Zoysa M, Whang I, Kim SJ, Choi CY, et al. (2010) Characterization and expression analysis of EF hand domain-containing calcium-regulatory gene from disk abalone: Calcium homeostasis and its role in immunity. Fish Shellfish Immunol 29: 334-342.
54. Borlongan IG, Satoh S (2001) Dietary phosphorus requirement of juvenile milkfish, Chanos chanos (Forsskal). Aquaculture Research 32: 26-32.
11. Vielma J, Lall SP (1998) Phosphorus utilization by Atlantic salmon (Salmo salar) reared in freshwater is not influenced by higher dietary calcium intake. Aquaculture 160: 117-128.
18. Fontagné S, Silva N, Bazin D, Ramos A, Aguirre P, et al. (2009) Effects of dietary phosphorus and calcium level on growth and skeletal development in rainbow trout (Oncorhynchus mykiss) fry. Aquaculture 297: 141–150.
23. Robinson EH, Rawles SD, Brown PB, Yette HE, Greene LW (1986) Dietary calcium requirement of channel catfish Ictalurus punctatus, reared in calcium-free water. Aquaculture 53: 263-270.
29. Albrektsen S, Hope B, Aksnes A (2009) Phosphorous (P) deficiency due to low P availability in fishmeal produced from blue whiting (Micromesistius poutassou) in feed for under-yearling Atlantic salmon (Salmo salar) smolt. Aquaculture 296: 318-328.
34. Farhangi M, Carter CG (2001) Growth, physiological and immunological responses of rainbow trout (Oncorhynchus mykiss) to different dietary inclusion levels of dehulled lupin (Lupinus angustifolius). Aquaculture Research 32: 329-340.
43. Boroughs H, Townsley SJ, Hiatt RW (1957) The metabolism of radionuclides by marine organisms: III. The uptake of calcium45 in solution by marine fish. Limnol Oceanogr 2: 28-32.
45. Rodehutscord M, Pfeffer E (1995) Requirement for phosphorus in rainbow trout (Oncorhynchus mykiss) growing from 50 to 200 g. Water Science and Technology 31: 137-141.
46. Skonberg DI, Yogev L, Hardy RW, Dong FM (1997) Metabolic response to dietary phosphorus intake in rainbow trout (Oncorhynchus mykiss). Aquaculture 157: 11-24.
47. Hossain MA, Furuichi M (2000) Necessity of calcium supplement to the diet of Japanese flounder. Fish Sci 66: 660-664.
48. Hossain MA, Furuichi M (2000) Essentiality of dietary calcium supplement in fingerling scorpion fish (Sebastiscus marmoratus). Aquaculture 189: 155-163.
52. Mai K, Zhang C, Ai Q, Duan Q, Xu W, et al. (2006) Dietary phosphorus requirement of large yellow croaker, Pseudosciaena crocea R. Aquaculture 251: 346-353.
Citation: Kalantarian SH, Rafiee GH, Farhangi M, Mojazi Amiri B (2013) Effect of Different Levels of Dietary Calcium and Potassium on Growth Indices, Biochemical Composition and Some Whole Body Minerals in Rainbow Trout (Oncorhynchus Mykiss) Fingerlings. J Aquac Res Development 4:170 doi:10.4172/2155-9546.1000170
Page 8 of 8
Volume 4 • Issue 3 • 1000170J Aquac Res DevelopmentISSN: 2155-9546 JARD, an open access journal
55. Andrews JW, Murai T, Campbell C (1973) Effects of dietary calcium and phosphorus on growth, food conversion, bone ash and hematocrit levels of catfish. J Nutr 103: 766-771.
57. Bowen HJM (1966) Trace elements in biochemistry: The Elementary Composition of Living Matter. Academic Press, London: 241.
61. Gatlin DM, Phillips HF (1989) Dietary calcium, phytate and zinc interactions in channel catfish. Aquaculture 79: 256-266.
62. Satoh S, Porn-Ngam N, Takeuchi T, Watanabe T (1996) Influence of dietary phosphorus levels on growth and mineral availability in rainbow trout. Fisheries Science 62: 483-487.
64. Porn-Ngam N, Satoh S, Takeuchi T, Watanabe T (1993) Effect of the ratio of phosphorus to calcium on zinc availability to rainbow trout in high phosphorus diet. Nippon Suisan Gakkaishi 59: 2065-2070.
65. Apines MJS, Satoh S, Kiron V, Watanabe T, Aoki T (2003) Availability of supplemental amino acid-chelated trace elements in diets containing tricalcium phosphate and phytate to rainbow trout, Oncorhynchus mykiss. Aquaculture 225: 431-444.
56. Shiau SY, Tseng HC (2007) Dietary calcium requirements of juvenile tilapia, Oreochromis niloticus×O. aureus, reared in fresh water. Aquaculture Nutrition 13: 298-303.
58. Shearer KD, Åsgard T, Andorsdottir G, Aas GH (1994) Whole body elemental and proximate composition of Atlantic salmon (Salmo salar) during the life cycle. Fish Biology 44: 785-797.
59. Cowey CB, Sargent JR (1979) Nutrition. In: Hoar WS, Randall J, (eds.). Fish Physiology, Academic Press, New York 3: 1-69.
60. Hardy RW, Shearer KD (1985) Effect of dietary calcium phosphate and zinc supplementation on whole body zinc concentration of rainbow trout (Salmo gairdneri). Canadian Journal of Fisheries and Aquatic Sciences 42: 181-184.
63. Brown PB, Robinson EH (1992) Vitamin D studies with channel catfish (Ictalurus punctatus) reared in calcium-free water. Comp Biochem Physiol 103: 213-219.
66. Rafiee G, Saad CR (2005) Nutrient cycle and sludge production during different stages of red tilapia (Oreochromis sp.) growth in a recirculating aquaculture system. Aquaculture 244: 109-118.