curre nt sta t e of an d is s ues conce r n i ng
TRANSCRIPT

Federal Energy Regulatory CommissionFederal Energy Regulatory CommissionFederal Energy Regulatory CommissionFederal Energy Regulatory CommissionFederal Energy Regulatory Commission ••••• Staff Report ••••• September 30, 2004
C UC UC UC UC U R RR RR RR RR R EEEEE N TN TN TN TN T S T S T S T S T S T AAAAA TTTTT E O F AE O F AE O F AE O F AE O F A NNNNN D ID ID ID ID I SSSSS SSSSS U EU EU EU EU E S C O N C ES C O N C ES C O N C ES C O N C ES C O N C E RRRRR NNNNN IIIII N GN GN GN GN G
U n d e rU n d e rU n d e rU n d e rU n d e rg rg rg rg rg ro u n d N a t u ro u n d N a t u ro u n d N a t u ro u n d N a t u ro u n d N a t u ra l Ga l Ga l Ga l Ga l Ga s Sa s Sa s Sa s Sa s St o rt o rt o rt o rt o ra g ea g ea g ea g ea g e
Federal Energy Regulatory CommissionS t a f f R e p o r t • S e p t e m b e r 3 0 , 2 0 0 4
A – Salt Caverns B – Aquifers C – Depleted Reservoirs
Docket No. AD04-11-000

Federal Energy Regulatory CommissionFederal Energy Regulatory CommissionFederal Energy Regulatory CommissionFederal Energy Regulatory CommissionFederal Energy Regulatory Commission ••••• Staff Report ••••• September 30, 2004
TTTTTABLEABLEABLEABLEABLE OFOFOFOFOF C C C C CONTENTSONTENTSONTENTSONTENTSONTENTS
Current State of and Issues ConcerningUnderground Natural Gas StorageUnderground Natural Gas StorageUnderground Natural Gas StorageUnderground Natural Gas StorageUnderground Natural Gas Storage
Summary of Key FindingsSummary of Key FindingsSummary of Key FindingsSummary of Key FindingsSummary of Key Findings 11111
IntroductionIntroductionIntroductionIntroductionIntroduction 22222
I. Background and History of Underground StorageI. Background and History of Underground StorageI. Background and History of Underground StorageI. Background and History of Underground StorageI. Background and History of Underground Storage 44444
Traditional Underground Storage 4The Nontraditional Usage of Underground Storage 4Three Types of Underground Gas Storage Facilities 4Summary of Physical Characteristics of Traditional Storage 5Operating Characteristics of the Types of Underground Storage 6Nationwide Storage Capacity 7Actual Storage Operating Capacities 9Storage Capacity Summary 10Regional Distribution of Underground Storage 10The Commission’s Role in Underground Storage 12Current Developments Regarding Underground Storage 14Problems with Underground Storage Projects 15Need for More Storage 15Staff Observations on the Current State of Underground Storage 16
II. Economics of Underground StorageII. Economics of Underground StorageII. Economics of Underground StorageII. Economics of Underground StorageII. Economics of Underground Storage 1818181818Storage Economics 18Storage Development Costs 18The Value of Storage 19Economic Summary and Conclusions 24
III. Possible Options for Stimulating Underground Storage DevelopmentIII. Possible Options for Stimulating Underground Storage DevelopmentIII. Possible Options for Stimulating Underground Storage DevelopmentIII. Possible Options for Stimulating Underground Storage DevelopmentIII. Possible Options for Stimulating Underground Storage Development 2626262626Cost-Based Rate Options for Storage Development 27Market-Based Rates 29Revise or Waive Commission Policies 31
Appendix A – UnderAppendix A – UnderAppendix A – UnderAppendix A – UnderAppendix A – Undergggggrrrrround Gas Storage Tound Gas Storage Tound Gas Storage Tound Gas Storage Tound Gas Storage Tararararariff Riff Riff Riff Riff Raaaaatestestestestes 3232323232Appendix BAppendix BAppendix BAppendix BAppendix B – Example of State Regulatory Approach– Example of State Regulatory Approach– Example of State Regulatory Approach– Example of State Regulatory Approach– Example of State Regulatory Approach 3333333333

1Federal Energy Regulatory CommissionFederal Energy Regulatory CommissionFederal Energy Regulatory CommissionFederal Energy Regulatory CommissionFederal Energy Regulatory Commission ••••• Staff Report ••••• September 30, 2004
KKKKKE YE YE YE YE Y F F F F FINDINGSINDINGSINDINGSINDINGSINDINGS:::::
• Under average conditions and from a nationwide perspective, storage appears to beadequate to meet seasonal demand; however, continued commodity price volatilityindicates that more storage may be appropriate.
• Storage may be the best way of managing gas commodity price, so the long-termadequacy of storage investment depends on how much price volatility customersconsider “acceptable.”
• A study performed by the National Petroleum Council indicates that there may be aneed in North America for 700 Bcf of new storage between now and 2025. Anotherstudy, by The INGAA Foundation, concludes that 651 Bcf of new storage may beneeded in the United States and Canada by 2020. In addition, there may be certainregion-specific (e.g., Southwest, New England) needs for new storage.
• Geology, economics and environmental impacts may stall development and couldjeopardize achieving forecasted capacity needs.
• Reengineering of existing storage fields is underway in order to improve workinggas capability – application of new engineering techniques can help to ensure thatdevelopment of new fields stays on track.
• Four key methods that market participants use to value storage (e.g., cost of service;least-cost planning; seasonal valuation, or intrinsic; and, option-based valuation,or extrinsic) do not always reach the same result because they are based on differingviews of the need and reasons for storage.
• Storage projects in certain geographic areas (e.g., Southwest) often fail theCommission’s market-based rates tests.
• Creative ratemaking approaches may encourage storage development.
• Creative certificate and policy choices may also encourage storage development byreducing costs and permitting additional opportunities to generate revenues.

2 Current State of and Issues Concerning Underground Natural Gas StorageUnderground Natural Gas StorageUnderground Natural Gas StorageUnderground Natural Gas StorageUnderground Natural Gas Storage
This report addresses three aspects of the state of and issues concerning the underground storage of natural gas: thehistory of storage development and its physical characteristics and the need for storage; the economics of undergroundstorage; and, ratemaking options for future storage development.
The underground storage of natural gas has historically been critical in assuring that overall demands and use-specific requirements of natural gas customers are met. The Natural Petroleum Council’s (NPC) September 2003report11111 noted that the demand for storage is expected to increase in the foreseeable future. Specifically, the NPCforesees the need for an additional 700 Bcf of new storage in the United States and Canada over the next 20 years,which translates to an average of 35 Bcf of new storage being added each year.
IIIIINTRODUCTIONNTRODUCTIONNTRODUCTIONNTRODUCTIONNTRODUCTION
Presently, from a national perspective and assumingaverage weather, storage appears to be adequate.However, simply considering average demand andnational balances does not tell the complete story. Forsome market areas, particularly those that are distant fromsupply sources, the development of new storageinfrastructure could cost-effectively help customersmaintain service reliability and manage commodity pricevolatility.
In addition, gas prices have increased with the decline ingas production. During the “gas bubble” of the 1980s-1990s, production increased in response to short-termspikes in demand. Production increases coupled withdemand decreases in this same period allowed supply tomeet demand, even during peak periods, withoutsignificant price spikes. As production declined orflattened over the past few years, production spikes canno longer be relied upon to meet demand spikes. As aresult, commodity price swings manage demandfluctuations.22222
Building new storage may be an effective way to reducecommodity price volatility. Demand for storage servicesto manage price volatility will depend on customertolerance for price risk, how that price risk is valued, and
the cost of service. Accordingly, there may be a publicpolicy interest in encouraging storage development.
While the desire of project sponsors to build new storagein the Southwest and Northeast has been demonstratedby the various applications seeking to develop projects,the development has not occurred for economic,environmental, geological and political reasons.
Specifically, in the Southwest there have been three recentstorage projects that, for various reasons, have not beendeveloped. The Desert Crossing storage project, althoughinitiated, has not been further pursued; while no formalreason for not pursing development was provided, market(contractual) support did not materialize andenvironmental concerns associated with certain aspectsof the proposal were raised.33333 The Copper Eagle storageproject, located on the outskirts of Luke Air Force Base,became the subject of security and safety concerns; plansfor its development have been delayed followingexpressions of concern by the State of Arizona legislature.44444
The sponsor of the Red Lake storage project did not pursuedevelopment owing to Red Lake’s unwillingness to goforward without authorization for market-based rates. Itsinability to demonstrate a significant lack of market powerresulted in the Commission’s decision to deny market-
11111 Balancing Natural Gas Policy – Fueling the Demands of a Growing Economy, National Petroleum Council (2003).22222 See Report on the Natural Gas Price Spike of February 2003, Staff Investigating Team, July 23, 2003.33333 Desert Crossing Gas Storage and Transportation System LLC, 98 FERC ¶ 61, 277 (2002).44444 Copper Eagle Gas Storage L.L.C., 97 FERC ¶ 62,193 (2001); Copper Eagle Gas Storage, L.L.C., 99 FERC ¶ 61,270 (2002).

3Federal Energy Regulatory CommissionFederal Energy Regulatory CommissionFederal Energy Regulatory CommissionFederal Energy Regulatory CommissionFederal Energy Regulatory Commission ••••• Staff Report ••••• September 30, 2004
based rate authority.55555 Evidence of the desire for storagein the Southwest was demonstrated in the SouthwesternGas Storage Conference held on August 23, 2003, in Phoenix,Arizona.66666 There, participants, including the Chairmanof the Arizona Corporation Commission, expressedunanimous support for the proposition that developmentof new storage in the region was needed.
In the Northeast, two major projects, the NE Hub storageproject and the Avoca storage project, similarly never cameinto service, and the Wyckoff/Greyhawk storage projecthas been delayed, although they all were certificated bythe Commission, but encountered various technical andeconomic problems.77777 While these projects were locatedin New York state in areas where the geology is conduciveto the development of underground storage, the geologyin other parts of the Northeast is not practical for thedevelopment of underground storage.
As discussed in more detail in this report, there are otherapproaches to achieving the development of new storageusing both new and existing fields. For example,reengineering of existing storage fields is an ongoingexercise to improve working gas capability. In addition,the application of new engineering techniques can proveuseful in achieving greater deliverability from existingfields. These techniques also help to ensure the efficientdevelopment of new fields in areas geologically conduciveto storage, stays on track.
Through new design approaches and the application ofadvanced engineering techniques, certain physicalbarriers to the development of new storage can potentiallybe overcome. However, as discussed later in this report,long-term market price signals appear to be weak for newstorage development. Further, the four key methods thatmarket participants use to value storage (cost of service;
and, least-cost planning seasonal arbitrage, or intrinsic;and option-based or extrinsic) do not always reach thesame result because they are based on differing views ofthe need and reasons for storage.
But regulatory requirements may prove to be a financialbarrier inhibiting development in some regions. Storagedevelopers have claimed a preference for market-basedrates. And, in the markets where new storage developerscannot assert market power, market-based rates have beenallowed.
Current Commission rate policy provides considerableflexibility to design cost-based rates, negotiated rates andmarket-based rates. Additional cost-based rates andmarket-based rate alternatives could be explored toencourage additional storage development. Further,revised storage project certification requirements andprocedures could potentially reduce costs and offer thepotential to generate additional revenues
This report sets out some of these approaches and alsodescribes some non-cost-based approaches that may beuseful in addressing financial obstacles to new storagedevelopment.
55555 Red Lake Gas Storage, L.P, 103 FERC ¶ 61,277 (2003); Red Lake Gas Storage, L.P., 102 FERC ¶ 61,077 (2003).66666 Southwestern Gas Storage Technical Conference, Docket No. AD03-11-000, Notice of Technical Conference (2003).77777 NE Hub Partners, L.P., 105 FERC ¶ 61,334 (2003); Avoca Natural Gas Storage, 88 FERC ¶ 62,245 (1999); Wyckoff Gas Storage Company, LLC, 105 FERC
¶ 61,027 (2003).
4 Current State of and Issues Concerning Underground Natural Gas StorageUnderground Natural Gas StorageUnderground Natural Gas StorageUnderground Natural Gas StorageUnderground Natural Gas Storage
BBBBBACKGROUNDACKGROUNDACKGROUNDACKGROUNDACKGROUND ANDANDANDANDAND H H H H HISTORYISTORYISTORYISTORYISTORY OFOFOFOFOF U U U U UNDERGROUNDNDERGROUNDNDERGROUNDNDERGROUNDNDERGROUND S S S S STORAGETORAGETORAGETORAGETORAGE
Natural gas storage facilities are used to meet gas demandpeaks which exceed production and long-haul pipelinethroughput. Increasingly, storage also plays a variety ofroles helping market participants manage pipelineimbalance charges and daily and seasonal price volatility.When cold weather or other market conditions createmore demand for gas than domestic production or importscan satisfy, gas that has been put in storage can bewithdrawn to make up the difference. While natural gasis also stored for peak daily and hourly uses mainly bydistribution companies and liquefied natural gas (LNG)is stored briefly at import terminals, this report will focuson what is known as traditional underground gas storage,as well as, the new, nontraditional usage of storagedeveloped by the unbundling of storage and the newmarket conditions.
TTTTTraditional Underraditional Underraditional Underraditional Underraditional Undergggggrrrrround Storageound Storageound Storageound Storageound Storage
Geology is a key issue for determining the location ofnew traditional underground storage projects and theexpansion of existing projects. There are areas that havethe geological characteristics to construct storage fields;other areas do not. Selection of any new undergroundgas storage location depends on geological andengineering properties of the storage reservoir, its sizeand its cushion, or base, gas requirements. It also dependson the site’s access to transportation pipelineinfrastructure, gas production sources, and to markets.
The use of underground gas storage facilities in the naturalgas industry is almost as old as the development of longdistance transmission lines. The first high pressuretransmission lines began operations in 1891 withsuccessful construction of two parallel 120-mile, 8-inchdiameter lines from fields in northern Indiana to Chicago.The first successful gas storage project was completed in1915 in Welland County, Ontario. The following year,operations began in the Zoar field near Buffalo, New York.
Underground storage field operations include a host ofcomponent and interdependent facilities. There areinjection/withdrawal wells, observation wells, waterdisposal wells, gathering lines, dehydration facilities, gas
measuring facilities, compressors, etc. Undergroundstorage fields come in three basic types: depleted gas/oilreservoirs, salt caverns, and aquifers. Access to at leastone major transportation pipeline to receive gas or delivergas is, of course, a complementary requirement.
The Nontraditional Usage of UndergroundThe Nontraditional Usage of UndergroundThe Nontraditional Usage of UndergroundThe Nontraditional Usage of UndergroundThe Nontraditional Usage of UndergroundStorageStorageStorageStorageStorage
In addition to meeting the traditional seasonal loadvariations, the hourly swings, and emergency situations,storage is now being used to meet services created by boththe unbundling of storage and by the new marketconditions. Specifically, storage is being used to:
1. Meet the regulatory obligation to ensure supplyreliability at the lowest cost to the ratepayer bymaintaining specific levels of storage inventory.
2. Avoid imbalance penalties and facilitate dailynomination changes, parking and lendingservices, and simultaneous injections andwithdrawals.
3. Ensure liquidity at market centers to help containprice volatility and maintain orderly gas markets.
4. Offset the reduction in traditional supplies thatwere relied upon to meet winter demand.
5. Increase the comfort inventory level of workinggas or top gas.
6. Offset, through the injection of more gas duringthe shoulder months, the growing summer peakimpacts from electric generation.
7. Support other electric generation loads.
Three Types of Underground Gas Storage FacilitiesThree Types of Underground Gas Storage FacilitiesThree Types of Underground Gas Storage FacilitiesThree Types of Underground Gas Storage FacilitiesThree Types of Underground Gas Storage Facilities
Salt Cavern
Some storage facilities use caverns that are leached ormined out of underground salt deposits (salt domes orsalt formations). Salt cavern capacity typically is 20 percentto 30 percent cushion gas and the remaining capacity isworking gas. Working gas can generally be recycled 10-12times a year in this type of storage facility. These facilities

5Federal Energy Regulatory CommissionFederal Energy Regulatory CommissionFederal Energy Regulatory CommissionFederal Energy Regulatory CommissionFederal Energy Regulatory Commission ••••• Staff Report ••••• September 30, 2004
are characterized by high deliverability and injectioncapabilities and are mainly used for short peak-daydeliverability purposes (i.e., for fueling electric powerplants).
Depleted Oil/Gas Reservoir
The most common underground gas storage facilities arethose that use deep underground natural gas or oilreservoirs that have been depleted through earlierproduction. These reservoirs are naturally occurring, andtheir potential as secure containers has been proven overthe millennia that the reservoirs held their originaldeposits of oil and gas. An underground gas storage fieldor reservoir is a permeable underground rock formation(average of 1,000 to 5,000 feet thick) that is confined byimpermeable rock and/or water barriers and is identifiedby a single natural formation pressure. The working gascapacity is typically 50 percent, with the rest of the capacitymaintained to ensure adequate deliverability. Gas istypically withdrawn in the winter season and injectedduring the summer season. This type of storage facilitycould be used for seasonal system supply or for peak-daydemands.
Aquifer
A large number of reservoirs are bound partly orcompletely by water-bearing rocks called “aquifers.” Thenature of the water in the aquifer may vary from fresh tonearly saturated brines. Aquifer storage facilities typicallyhave high cushion gas requirements, ranging between 50percent to 80 percent. However, they achieve highdeliverability rates, with gas injected in the summer seasonand withdrawn in the winter.
The following chart , based on the Department of Energy’sEnergy Information Administration (EIA) final 2001 data,shows that depleted reservoirs are the dominant type ofunderground storage based on total capacity. Thesepercentages have slightly changed using 2002 EIA data,which are not yet final.88888
Source: Energy Information Administration
Types of Underground Storage Capacity
Depleted Reservoir
86%
Aquifer10%
Salt Cavern4%
SummarSummarSummarSummarSummary of Phy of Phy of Phy of Phy of Physical Cysical Cysical Cysical Cysical Characterharacterharacterharacterharacterisisisisistics of Ttics of Ttics of Ttics of Ttics of TraditionalraditionalraditionalraditionalraditionalNatural Gas StorageNatural Gas StorageNatural Gas StorageNatural Gas StorageNatural Gas Storage
( The following descriptions are from the Natural GasSupply Association)99999
The most common form of underground storage consistsof depleted gas/oil reservoirs. Depleted reservoirs arethose formations that have already been tapped of alltheir recoverable hydrocarbons. This leaves anunderground formation geologically capable of holdingnatural gas. In addition, using an already developedreservoir for storage purposes allows the use of theextraction and distribution equipment left over from whenthe field was productive. Having this network in placereduces the cost of converting a depleted reservoir into astorage facility. Depleted reservoirs are also attractivebecause their geological characteristics are already wellknown. Of the three types of underground storage,depleted reservoirs, on average, are the cheapest andeasiest to develop, operate and maintain.
88888 Form EIA-191, Monthly Underground Gas Storage Report.99999 See NGSA’s Web site at http://www.naturalgas.org/naturalgas/storage.asp

6 Current State of and Issues Concerning Underground Natural Gas StorageUnderground Natural Gas StorageUnderground Natural Gas StorageUnderground Natural Gas StorageUnderground Natural Gas Storage
Aquifers are underground permeable rock formations thatact as natural water reservoirs. However, in certainsituations, these water-containing formations may bereconditioned and used as natural gas storage facilities.Because they are more expensive to develop than depletedreservoirs, these types of storage facilities are usually usedonly in areas where there are no nearby depletedreservoirs. Traditionally, these facilities are operated witha single winter withdrawal period, although they may beused to meet peak load requirements as well. Aquifersare the least desirable and most expensive type of naturalgas storage facility for a number of reasons. First, thegeological characteristics of aquifer formations are not asthoroughly known as are depleted reservoirs. Asignificant amount of time and money goes intodiscovering the geological characteristics of an aquifer anddetermining its suitability as a natural gas storage facility.Also, the cushion gas requirement for aquifers is higherthan for depleted oil/gas reservoirs.
Underground salt formations offer another option fornatural gas storage. These formations are well suited tonatural gas storage because salt caverns, once formed,allow little injected natural gas to escape from theformation unless specifically extracted. The walls of a saltcavern also have the structural strength of steel, whichmakes it resilient to reservoir degradation over the life ofthe storage facility. Salt caverns are formed out of existingsalt deposits. These underground salt deposits may existin two possible forms: salt domes and salt beds. Salt domesare thick formations created from natural salt depositsthat, over time, move up through overlying sedimentarylayers to form large dome-like structures. Salt beds areshallower, thinner formations. Because salt beds are wideand thin, salt caverns in them are more prone todeterioration and may also be more expensive to developthan salt domes.
Operating Characteristics of the Types ofOperating Characteristics of the Types ofOperating Characteristics of the Types ofOperating Characteristics of the Types ofOperating Characteristics of the Types ofUnderground StorageUnderground StorageUnderground StorageUnderground StorageUnderground Storage
The pressure range in a depleted reservoir for the storageoperating cycle depends upon (1) the safe upper limit ofthe reservoir pressure (bottom hole or surface pressure),
(2) the flow capacity of the wells, and (3) compressionrequirements when injecting gas into the reservoir ordelivering to market. Normally gas and oil fields havepressures at discovery in the range of 0.43 to 0.52 poundsper square inch per foot of depth. The highest pressurelevel possible normally will provide the maximumstorage capacity and the wells will have the highest flowcapacity.
Peak-day or seasonal deliverability is directly related tostorage volume vs. storage pressure. Required storagedeliverability services (daily or seasonal volumes) requiremaximum storage pressure and gas-in-place volumes priorto the withdrawal season.
Therefore, the main issues are how much gas can be carriedover from year to year, how long the gas can remain inthe reservoir prior to being turned over and how sooncan the capacity be refilled. These problems are not basedon some theoretical behavior, but instead are based onexperience under a variety of turnover and injectionconditions.
It is operationally improper to simply let the gas sit inany storage field. If working gas is not recycled properly,it will move from higher pressure areas of the storagefield to lower pressure areas, move into tighter formationsor migrate to a point that will result in an increase incushion gas requirements or gas loss.
The following table summarizes our understanding of howthe three types of storage fields are generally operated.Less cushion gas is needed for salt caverns and they canbe filled and emptied much more frequently than aquifersor depleted reservoirs. For aquifers or depleted reservoirs,the injection period usually corresponds with the monthsof April through October (214 days), while the withdrawalperiod is usually the months of November through March(151 days). Storage operators must use their best geologicand engineering judgment to vary from this schedule.Early season cold weather can reduce storage gas in placeand deliverability, while late season cold weather canreduce the next season’s required injections in terms ofvolumes and days.

7Federal Energy Regulatory CommissionFederal Energy Regulatory CommissionFederal Energy Regulatory CommissionFederal Energy Regulatory CommissionFederal Energy Regulatory Commission ••••• Staff Report ••••• September 30, 2004
Nationwide Storage CapacityNationwide Storage CapacityNationwide Storage CapacityNationwide Storage CapacityNationwide Storage Capacity
Because not all storage is under the Commission’sjurisdiction, we have to look to other sources ofinformation to get nationwide totals of storage capacity.The EIA reports that as of 2002 (the latest data available),interstate pipelines operated nearly 55 percent of thenation’s gas storage capacity1010101010 but had contractual rightsto use only 8 percent of the working gas capacity for theirown purposes. Local distribution companies (LDCs) andintrastate pipeline companies operated about 35 percentof working gas capacity and independent operatorsoperated about 10 percent of working gas capacity.However, most of the pipeline’s storage capacity, about73 percent, is contractually committed to LDCs. Marketersalso hold a significant share of storage capacity undercontract, about 15 percent. The total maximum U.S.natural gas storage capacity (cushion, or base, gas plusworking gas) reported to the EIA fluctuated slightly above
the 8 Tcf level for the past eight years (8 to 8.4 Tcf), whilefor the same period, the EIA reports that working gasstorage capacity has varied between 4.4 and 4.7 Tcf.
Using a different survey, the Office of Fossil Energy –which, like EIA, also is in the Department of Energy –reported that as of 2003 there were 110 underground gasstorage operators that maintain and operate 415underground gas storage facilities with a working gascapacity of 3.9 Tcf in this country. Of this total number offacilities, 201 are FERC-jurisdictional, controlled by 43operators. The total FERC-jurisdictional working gascapacity is 2.5 Tcf. Close to half of all the storage capacityis located in the Midwest. The graph on the followingpage shows the relatively stable amount of storage capacityfrom 1997 to present, based on EIA’s data.
1010101010 Form EIA-191, Monthly Underground Gas Storage Report.
Source: Analysis of FERC filings
Type Cushion to WorkingGas Ratio
Injection Period(Days)
Withdrawal Period(Days)
Aquifer
Depleted Oil/GasReservoirs
Salt Cavern
Cushion 50% to 80%
Cushion 50%
Cushion20% to 30%
200 to 250
200 to 250
20 to 40
100 to 150
100 to 150
10 to 20
Gas Storage Facility Operations

8 Current State of and Issues Concerning Underground Natural Gas StorageUnderground Natural Gas StorageUnderground Natural Gas StorageUnderground Natural Gas StorageUnderground Natural Gas Storage
Volumes of Underground Natural Gas Storage
Source: U.S. Department of Energy, Office of Fossil Energy
Tcf
Northeast Midwest Southeast West Total U.S.
0.00
1.00
2.00
3.00
4.00
5.00
6.00
7.00
8.00
9.00
1997 1998 1999 2000 2001 2002 2003 2004
However, total reported storage capacity has never reallybeen tested with operating experience. Thus, the valuethat defines “full” when determining the total workinggas capacity is not known exactly. Even the EIA’s “Basicsof Underground Natural Gas Storage” discusses threedifferent approaches to measuring “percent full” of U.S.natural gas storage. Based on our interpretation ofhistorical data, staff believes there is a total practical storageoperating capacity of 7.6 Tcf, of which 3.5 Tcf 1111111111 is workinggas capacity and the remaining 4.1 Tcf is cushion gas. TheAmerican Gas Association (AGA) reported that the largestworking gas capacity held in storage during a given timeperiod was 3,294 Bcf. Therefore, based on EIA data oftotal storage capacity being at least 8.2 Tcf for several recent
years, the staff estimates that there is as much as 600 Bcf ofpotential working gas capacity available within existingstorage fields for future use. Thus, staff estimates the totalU.S. potential working gas capacity to be 3.6 to 3.8 Tcf.Based on these estimations, there is 200 Bcf to 500 Bcf ofpotential working gas capacity beyond the presentlyproven 3.5 Tcf of working gas that could be reengineeredand used.
Another technical point is that storage working gascapacity is directly related to the availability of supply. Ifthere is sufficient gas supply available during the earlyinjection season when storage pressures are lowest, thestorage operators could inject at the highest rates and re-
1111111111 Actual total operating capacity reported by EIA monthly (2001-02 withdrawal season). However, the total potential working gas capacity isestimated by EIA to be 3.9 Tcf, thus we would accept that working gas could be 3.5 Tcf to 3.9 Tcf.

9Federal Energy Regulatory CommissionFederal Energy Regulatory CommissionFederal Energy Regulatory CommissionFederal Energy Regulatory CommissionFederal Energy Regulatory Commission ••••• Staff Report ••••• September 30, 2004
pressurize their storage reservoirs to be ready forwithdrawal season, which usually begins November 1each year. As storage reservoir pressures increase, gas-in-place volume also increases and the injection rate declinesgradually in late injection season. Therefore, the injectionrate is higher at the beginning of injection season andlower at the end of injection season. The withdrawal rateis highest at the end of injection season, when storagereservoir pressure is highest. Storage operators estimatethe volume of supply needed for each season and they tryto refill their storage fields’ working gas capacities basedon historical performance levels and match their storagecapacities with their customers’ requirements. Manystorage fields are designed to have some excess workinggas capacities and operational flexibility to withdraw somecushion gas, as needed, within the late withdrawal season.
Actual Storage Operating CapacitiesActual Storage Operating CapacitiesActual Storage Operating CapacitiesActual Storage Operating CapacitiesActual Storage Operating Capacities
As shown below, based on historic EIA data, cushion gasaveraged about 54 percent of the total operating capacityfrom 1975 through 1991. In 1992, cushion gas began toincrease, reaching 61 percent of the total operatingcapacity in 2000. While cushion gas has been increasing,working gas capacity has been decreasing. This increase/decrease of cushion and working gas capacity couldrepresent the reclassification of working gas to cushiongas as a result of open access, as well as maintaining higherstorage pressures to support higher withdrawal rates. Also,this supports the need for realignment or re-engineeringof existing storage fields to improve the cycling capabilityof the storage fields and reduce cushion gas requirementsif and when higher storage services are needed.
Bcf
Cushion Gas Working gas
0
1,000
2,000
3,000
4,000
5,000
6,000
7,000
8,000
1973
1975
1977
1979
1981
1983
1985
1987
1989
1991
1993
1995
1997
1999
2001
2003
Relative Volumes of Working and Cushion Gas
Source: Graph generated by FERC staff from EIA data
10 Current State of and Issues Concerning Underground Natural Gas StorageUnderground Natural Gas StorageUnderground Natural Gas StorageUnderground Natural Gas StorageUnderground Natural Gas Storage
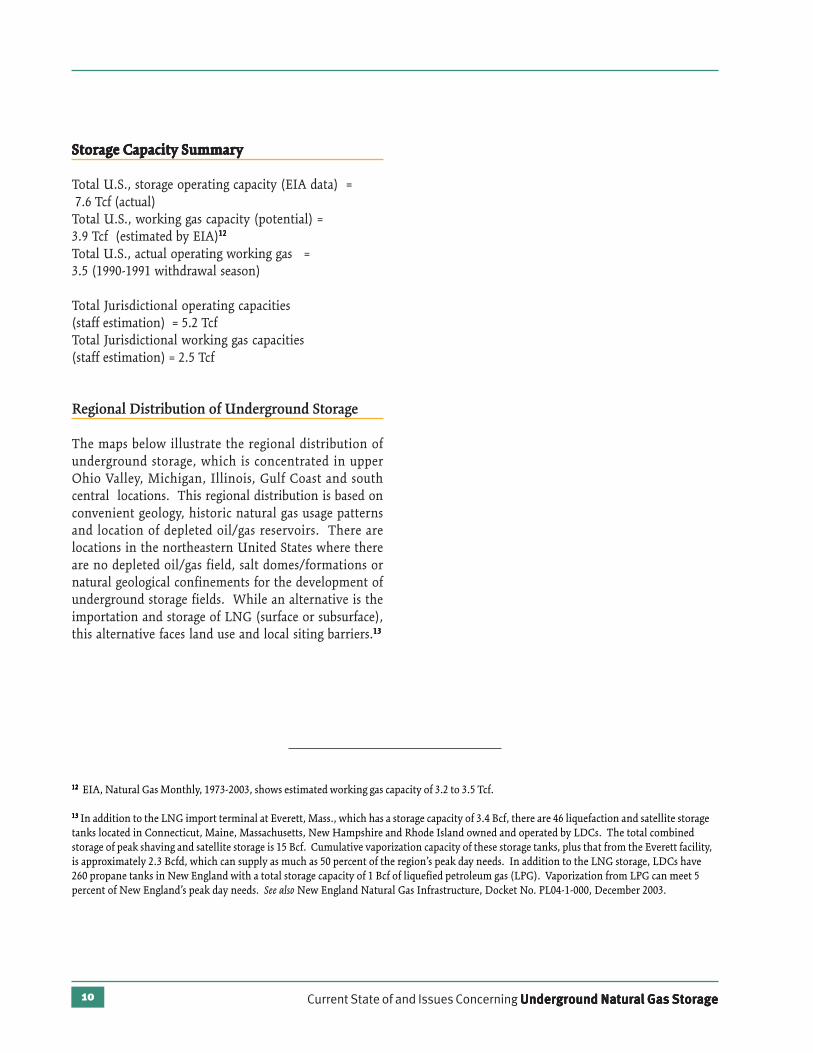
Storage CStorage CStorage CStorage CStorage Capacity Summarapacity Summarapacity Summarapacity Summarapacity Summaryyyyy
Total U.S., storage operating capacity (EIA data) = 7.6 Tcf (actual)Total U.S., working gas capacity (potential) =3.9 Tcf (estimated by EIA)1212121212
Total U.S., actual operating working gas =3.5 (1990-1991 withdrawal season)
Total Jurisdictional operating capacities(staff estimation) = 5.2 TcfTotal Jurisdictional working gas capacities(staff estimation) = 2.5 Tcf
Regional Distribution of Underground Storage
The maps below illustrate the regional distribution ofunderground storage, which is concentrated in upperOhio Valley, Michigan, Illinois, Gulf Coast and southcentral locations. This regional distribution is based onconvenient geology, historic natural gas usage patternsand location of depleted oil/gas reservoirs. There arelocations in the northeastern United States where thereare no depleted oil/gas field, salt domes/formations ornatural geological confinements for the development ofunderground storage fields. While an alternative is theimportation and storage of LNG (surface or subsurface),this alternative faces land use and local siting barriers.1313131313
1212121212 EIA, Natural Gas Monthly, 1973-2003, shows estimated working gas capacity of 3.2 to 3.5 Tcf.
1313131313 In addition to the LNG import terminal at Everett, Mass., which has a storage capacity of 3.4 Bcf, there are 46 liquefaction and satellite storagetanks located in Connecticut, Maine, Massachusetts, New Hampshire and Rhode Island owned and operated by LDCs. The total combinedstorage of peak shaving and satellite storage is 15 Bcf. Cumulative vaporization capacity of these storage tanks, plus that from the Everett facility,is approximately 2.3 Bcfd, which can supply as much as 50 percent of the region’s peak day needs. In addition to the LNG storage, LDCs have260 propane tanks in New England with a total storage capacity of 1 Bcf of liquefied petroleum gas (LPG). Vaporization from LPG can meet 5percent of New England’s peak day needs. See also New England Natural Gas Infrastructure, Docket No. PL04-1-000, December 2003.

11Federal Energy Regulatory CommissionFederal Energy Regulatory CommissionFederal Energy Regulatory CommissionFederal Energy Regulatory CommissionFederal Energy Regulatory Commission ••••• Staff Report ••••• September 30, 2004
FERC Jurisdictional U.S. Storage by Type and Location
Depleted Gas Reservoir Aquifer Storage Field Salt Cavern Storage
Non-jurisdictional U.S. Storage by Type and Location
Source: Developed using Platts PowerMap and GasData
Depleted Gas Reservoir Aquifer Storage Field Salt Cavern Storage

12 Current State of and Issues Concerning Underground Natural Gas StorageUnderground Natural Gas StorageUnderground Natural Gas StorageUnderground Natural Gas StorageUnderground Natural Gas Storage
TTTTThe Che Che Che Che Commisommisommisommisommissionsionsionsionsion’’’’’s Role in Unders Role in Unders Role in Unders Role in Unders Role in Undergggggrrrrround Storageound Storageound Storageound Storageound Storage
Commission Certificates
The Commission has jurisdiction over any undergroundstorage project that is owned by an interstate pipelineand integrated into its system. Also, independentlyoperated storage projects that offer storage services ininterstate commerce are under the Commission’sjurisdiction. The chart below is based on staff ’scompilation of Commission orders and it shows that theannual number of new storage fields certificated by theCommission has decreased since the 1970s and early 1980s.Beginning in 2002, the new certificated storage fieldsmostly involved the development of small depleted gasfields and salt cavern storage fields.
FERC Certification of New Storage Fields by Year
Source: FERC filingsYear
Num
ber
of F
ield
s
0
1
2
3
4
5
6
7
8
9
10
1968
1969
1970
1971
1972
1973
1974
1975
1976
1977
1978
1979
1980
1981
1982
1983
1984
1985
1986
1987
1988
1989
1990
1991
1992
1993
1994
1995
1996
1997
1998
1999
2000
2001
2002
2003
2004
Likewise, based on our compilation of applications at theCommission, the number of applications to construct andmodify storage facilities has fluctuated from the 1970sthrough 2004. We attribute the large number ofapplications during the late 1970s and early 1980s to theindustry’s reaction to colder-than-normal winters. Thecurrent increase in the number of storage applicationsreflects modifications of existing storage fields (increasingcapacity and efficiency) as well as applications byindependent storage operators entering the natural gasmarket as a result of Order No. 636.
Current Commission Cases
Eleven major interstate storage projects (adding six newstorage fields) were certificated since 2002, authorizing

13Federal Energy Regulatory CommissionFederal Energy Regulatory CommissionFederal Energy Regulatory CommissionFederal Energy Regulatory CommissionFederal Energy Regulatory Commission ••••• Staff Report ••••• September 30, 2004
0
2
4
6
8
10
12
14
16
18
20
19701972
19741976
19781980
19821984
19861988
19901992
19941996
19982000
20022004
1968
Certificate Applications for Realignment of Storage
Year
Num
ber o
f App
licat
ions
Source: FERC filings
the development of 74.7 Bcf of new interstate workingstorage capacity for the U.S. Of the 74.7 Bcf of new storagecapacity, 17.9 Bcf has been delayed or put on hold whencompared to the applicant’s originally projected in-servicedate. Of the 11 storage projects, four projects would add12.2 Bcf of new storage capacity into the Northeast region,but it is these projects that have been delayed. Twoprojects have added 12.1 Bcf of new storage capacity in theMidwest and five projects added 50.4 Bcf of new storagecapacity in the Gulf Coast/Southeast.
Four storage projects are pending before the Commission;they have a projected capacity of 54 Bcf for the Northeast,
Midwest and Gulf Coast/Southeast regions. The presentpending and anticipated storage projects will be requiredto meet the increasing seasonal peak-day requirements.
Ten publicly announced storage projects are on thehorizon with potential storage capacity totaling 115.8 Bcf.Of this amount, 5 Bcf would be in the Northeast, 27 Bcfwould be in the Midwest, 53.6 Bcf would be in the GulfCoast/Southeast and 3.2 would be in the West.
The regional distribution of these approved, pending andon-the-horizon projects is shown on the map below.

14 Current State of and Issues Concerning Underground Natural Gas StorageUnderground Natural Gas StorageUnderground Natural Gas StorageUnderground Natural Gas StorageUnderground Natural Gas Storage
Current Developments Regarding UndergroundCurrent Developments Regarding UndergroundCurrent Developments Regarding UndergroundCurrent Developments Regarding UndergroundCurrent Developments Regarding UndergroundStorageStorageStorageStorageStorage
New Technologies
Current methods of improving storage field efficiency,such as mechanically removing debris, washing, injectingacids and creating new perforations in the well pipe oftenprovide only limited and temporary improvements. Newtechnologies are now being used to improve storage fieldefficiency:
• To unclog storage wells, a low-frequency/highfrequency sound wave device is being used thatvibrates the scale off the well pipe.
• There are innovative fracturing technologies, suchas injecting high pressure liquid carbon dioxideinstead of water or other liquids, to keep clays fromsticking and sealing off parts of the reservoir.
• In salt cavern development, operators can chill thenatural gas and condense its volume to reduce thesize of the storage field and the amount of brine thatneeds disposing.
• Operators can use “lined rock caverns” in storagefacilities, in which a steel tank has been installed in acavern that has been blasted into the rock of a hill.
• Freezing natural gas in the presence of water createshydrates, thus allowing for large quantities to bestored in same volumes.
• Operators can use the Bishop Process (TM byConversion Gas Imports) in which LNG is unloadedoffshore, warmed to 40 degrees Fahrenheit and thenstored as natural gas vapor in underground saltcaverns either onshore or offshore.
Recent Gas Storage Projects Capacity in Bcf; August 2004
Source: FERC filings and price industry reports
Egan(8.0)
SG Resources(12.0)
Seneca(0.8)
Dominion(5.6)
Gulf South(10.6)
Natural(10.7)
Wyckoff(6.0)
KM (6.0)
Caledonia(11.0)
Falcon Gas(20.0)
NUI
Tennessee(5.0)
Copper Eagle(3.2)
EnCana(8.0)
Bluewater(27.0)
Saltville(5.8)
Columbia(12.4)
Texas Gas(8.2)
Dominion(9.4)
Sempra(24.0)
Falcon Gas(3.0)
NGO(6.1)
Liberty Gas(17.0)
(11.6)
Copiah(3.3)
NGPL(10.0)
Certificated Since 2002 (11) On the Horizon (10) Currently Pending (4)

15Federal Energy Regulatory CommissionFederal Energy Regulatory CommissionFederal Energy Regulatory CommissionFederal Energy Regulatory CommissionFederal Energy Regulatory Commission ••••• Staff Report ••••• September 30, 2004
More on LNG and Underground Storage
Quantities of LNG imports into the United States haveincreased almost six-fold from 85 Bcf in 1998 to 507 Bcf in2003. Should LNG imports grow in the future as projected,more storage facilities (LNG tanks, salt cavern storage anddepleted offshore oil/gas reservoirs) will be needed. TheDOE is studying a novel method of unloading andregassifying LNG directly from ocean tankers for storagein underground salt caverns. Under the Bishop Process,LNG would be received directly from an offshore tanker,regasified, pressurized and warmed to 40 degrees F, theninjected into underground salt caverns. A DOE studyidentified more than two dozen potential sites that hadsuitable salt formations, sufficiently close proximity toexisting pipelines and navigable water.1414141414 This processwould eliminate the need to build expensive abovegroundcryogenic storage tanks. A combination of the BishopProcess with the construction or conversion of existingoffshore depleted gas fields, platforms and lines could alsobe a means to import, store and transport LNG. There aremany offshore depleted gas fields that could be used forthis purpose.
Problems with Underground Storage ProjectsProblems with Underground Storage ProjectsProblems with Underground Storage ProjectsProblems with Underground Storage ProjectsProblems with Underground Storage Projects
A few storage projects have been canceled, delayed orplaced on hold due to market concerns, environmental
issues and rate issues. Specifically, storage projects havebeen placed on hold until the market improves or havebeen cancelled due to a lack of market interests.Environmental concerns such as brine disposal used inthe development of salt caverns and land use have beenraised. Storage projects have incurred funding problemsand cost concerns, and some projects have been cancelledor delayed due to pipeline infrastructure problems. Withthe denial of market based rates for storage projects by theCommission, certain storage proponents believe cost-based rates may not provide adequate incentives to attractthe investment necessary to develop the proposed storagefacilities.
Need for More StorageNeed for More StorageNeed for More StorageNeed for More StorageNeed for More Storage
Estimations of the need for more storage first requireprojections of national and regional natural gas supplyand demand. Then one must estimate the futureexpansion of natural gas transmission and distributionto gauge how much more storage might be needed to meetseasonal and peak deliverability demands. The price ofnatural gas and the price volatility also affect the need forstorage and such factors also need to be estimated. TheNPC gas study and other sources have estimated a needfor additional storage in the United States and Canada ofup to 700 Bcf by 2025. This has been projected on a regionalbasis by work sponsored by The INGAA Foundation, asfollows below:
Source: Energy and Environmental Analysis Inc, At the Crossroads: Crisis or Opportunity for Natural Gas
Western Canada 30 Bcf 40 Bcf 70 BcfEastern Canada/Michigan 36 Bcf 74 Bcf 110 BcfMidwest – 60 Bcf 60 BcfNew York 10 Bcf 56 Bcf 66 BcfPennsylvania / West Virginia 33 Bcf 90 Bcf 123 BcfGulf Coast 72 Bcf 5 Bcf 77 BcfWest Coast 21 Bcf 78 Bcf 99 BcfOther 10 Bcf 37 Bcf 47 BcfTotal 212 Bcf 439 Bcf 651 Bcf
Incremental Working Gas Capacity in EEA Base Case 2004-2008 2009-2020 Total
New North American Gas Storage Requirements
1414141414 See http://www.fe.doe.gov/programs/oilgas/storage/index.html.

16 Current State of and Issues Concerning Underground Natural Gas StorageUnderground Natural Gas StorageUnderground Natural Gas StorageUnderground Natural Gas StorageUnderground Natural Gas Storage
S tS tS tS tS taff Oaff Oaff Oaff Oaff Obserbserbserbserbser vavavavavations on the Curtions on the Curtions on the Curtions on the Curtions on the Currrrrrent Stent Stent Stent Stent Staaaaate ofte ofte ofte ofte ofUnderground StorageUnderground StorageUnderground StorageUnderground StorageUnderground Storage
Natural gas storage is in better shape this year than last.From a national perspective, we have adequate storagevolumes in place in the United States at this time to covernormal conditions. The EIA’s “Weekly Natural GasStorage Report” divides U.S. underground gas storageinto three regions: East, West and Producing. As ofSeptember 9, the United States had 257 Bcf more in storagethan at this time last year and 183 Bcf more than the five-year average for this time of year. If storage injectioncontinues at its current pace, there should not be anyproblem in refilling working gas storage to the previousyear’s level (3,155 Bcf on October 31, 2003) and the storagefields should be full and pressurized to their designedlevels.
In recent years, however, relatively few new storage fieldshave been built. Also, there has been an abandonmentof a number of old, inefficient, and uneconomicallyoperated underground gas storage fields. Traditionally,underground storage fields were designed to meet peakseasonal demands. Today, especially with theproliferation of gas-fired electric plants, storage facilitiesare increasingly expected to meet rather dramatic daily oreven hourly swings. Thus, storage operations arechanging with changing market characteristics. The loadprofile has changed for natural gas customers over thepast few years, and gas supply now is required – sometimesquickly – throughout the year rather than merely meetingpeak seasonal demands. Therefore, storage fields withhigh injection and withdrawal capabilities are becomingthe main choice for many storage operators. Thetraditional marketplace now values highly diversifiedtypes of storage services and has increasingly soughtstorage that rewards flexibility, safety and reliability. Thisis the main reason why storage operators are re-engineering and conducting detailed studies of theirstorage fields to see how they can improve the performance
of existing storage facilities. Storage field re-alignmentsare being implemented to increase working gas capacitywithin existing fields and to reduce cushion gasrequirements, which results in increases in deliverability.
Since 1968, there have been many applications for therealignment of old storage fields. Storage operators havemodified old storage designs, incorporated new designprocedures and constructed surface and subsurfacefacilities. These modifications include drilling large-diameter wells, relocating wells within reservoirs,incorporating coil tubing drilling (CTD)1515151515 and horizontalwell drilling and completing larger diameter wells.Additionally, storage operators are adding compression,dehydration facilities, and new gathering lines.Operators are also using new technical procedures to betterunderstand reservoir geology, confinement and reservoirflow behaviors, abandoning uneconomical facilities andincorporating new storage operational procedures.
Storage field modifications have generally provided newoperational capability for storage operators to recycle moreworking gas efficiently. By cycling working gas duringboth injection and withdrawal seasons, the storageoperator is able to confine the storage gas, better definegeological parameters, reduce gas migration/loss, increaseefficiency and reduce operational cost. Finally, a fewstorage fields’ working gas volume has increased andcushion gas volume of those same fields were reduced.
On balance, through realignments or re-engineeringprocedures, injection/withdrawal capability has increasedwithout any significant increase in total storage operatingcapacity. In fact, data indicate that the total U.S. storageoperating capacity (jurisdictional and nonjurisdictional)has remained about the same over the past few years.Thus, the recent trend in storage field construction activityhas predominantly been the modification andrealignment of existing storage fields to meet changingmarket demands rather than a dramatic increase in
1515151515 CTD is used in existing storage reservoir when the conventional well enhancing techniques (hydraulic fracturing, acidizing and/or reperforating)
for enhancing well performance have not proved to be effective.
17Federal Energy Regulatory CommissionFederal Energy Regulatory CommissionFederal Energy Regulatory CommissionFederal Energy Regulatory CommissionFederal Energy Regulatory Commission ••••• Staff Report ••••• September 30, 2004
construction of new storage fields. During the past 10years, there has been a significant increase in the abilityto move gas in and out of storage.
It is the staff’s technical opinion that prudent operationalprocedures and realignment of storage facilities withinthe past few years by storage operators have resulted inbetter use of storage capacity. Storage operators havemodified their storage facilities and improved storagecapabilities with different types of storage operations andservices than offered in previous years. In staff’s view, inthe future, storage operators will construct a limitednumber of storage facilities on an as-needed basis.However, these projects will tend to be highly selective,taking advantage of particularly advantageous locationsor highly favorable geological characteristics.
Historical storage engineering and operational dataindicate that not all working gas has been recycled inmany storage fields. There are many old storage fieldsthat could and should be redesigned and realigned byincorporating new technology, reducing cushion gasvolume, increasing working gas volume and increasingefficiency of storage operation by recycling more workinggas. All these new designs and modifications will improveoperational capability and reduce operational costswithout necessarily increasing the total certificated storagecapacity. It is advantageous environmentally and alsomore cost effective to improve the cyclic capability ofexisting underground field than to construct a newdepleted oil/gas field. It is important to recognize thatsteadily increasing storage demands will not necessarilybe met with large investment in new storage fields in theUnited States.
The level of total gas storage capacity has been relativelyflat for a number of years. During the past few years wehave seen an average of only one or two new undergroundgas storage certificated per year. However, the NationalPetroleum Council’s projected need of up to 700 Bcf of
new working storage capacity by 2025 discussed abovecan be met by the construction of only 35 Bcf of workingcapacity per year over the next 20 years. The industryappears to be close to meeting or surpassing this goal basedon the storage projects that we have approved, havepending before us or are expecting to be filed in the nearfuture. While several old storage fields have beenabandoned, others have been sold for less-active localuses. However, over the past 10 years the Commissionhas authorized many storage realignment applications toimprove injection/withdrawal and operational capabilityof existing storage fields.

18 Current State of and Issues Concerning Underground Natural Gas StorageUnderground Natural Gas StorageUnderground Natural Gas StorageUnderground Natural Gas StorageUnderground Natural Gas Storage
Storage EconomicsStorage EconomicsStorage EconomicsStorage EconomicsStorage Economics
Successful storage infrastructure investments, as with allprivate sector capital expenditures, must provideattractive financial characteristics. Many investmentmeasures are used by industry to evaluate the commercialviability of projects including, although not limited to,net present value and internal rate of return. Thesetechniques provide different indicators of a project’s meritbut fundamentally each is a measure of cash flow benefitsrelative to capital expenditures and operating expenses.Independent, unregulated storage projects will generallybe expected to have returns on equity exceeding 20 percentwhile jurisdictional storage projects will typically haveequity returns between 12 percent and 15 percent. Thehigher return for unregulated projects, often salt-cavernbased, is due to the perceived market, geologic anddevelopment risks.
Capital costs and cash flow, and hence, the economicattractiveness of storage, depends upon the physicalcharacteristics and capabilities of a particular storage field,the services to be provided and to a lesser extent,regulatory regimes. Development costs vary greatly bythe type of storage and its performance characteristics.The projected revenue and cash flow benefits differ forfacilities designed to ensure seasonal supply reliabilityand meet daily or intra-day demand swings as comparedto capturing commodity arbitrage opportunities. Further,regulators can restrict the ability of storage projects torealize profits or, conversely, guarantee profits.
Consistent with the physical perspective that storageamounts nationally are generally adequate and therequirement for new storage is more of a chronic versusacute need, the economics for new storage developmentare not robust, with the exception of expansions ofexisting fields. In particular, high-deliverability storageprojects that could serve to mitigate price levels andvolatilities as seen during the price spikes of 2003 and2004 have particular challenges in matching value tocapital costs.
EEEEECONOMICSCONOMICSCONOMICSCONOMICSCONOMICS OFOFOFOFOF U U U U UNDERGROUNDNDERGROUNDNDERGROUNDNDERGROUNDNDERGROUND S S S S STORAGETORAGETORAGETORAGETORAGE
Storage Development CostsStorage Development CostsStorage Development CostsStorage Development CostsStorage Development Costs
Among the three types of storage fields (salt cavern,depleted reservoir and aquifer), salt caverns are generallythe most expensive to develop on a capacity basis.However, because salt cavern storage can be cycled manytimes (up to 12 times for some facilities), on adeliverability basis it can be less costly than other typesof storage facilities.
A typical 6-12 cycle Gulf Coast salt cavern can costsupwards of $10 million/Bcf of working gas capacity and ishigher in other regions, with Midwestern facilities thenext most expensive, followed by the Rockies, theNortheast and finally California and the PacificNorthwest. A typical 2-cycle depleted reservoir field cancost between $5 million and $6 million/Bcf.1 61 61 61 61 6 Thefollowing table summarizes broad ranges of developmentcosts.
1616161616 Industry sources
2-Cycle Reservoir
6-to-12 Cycle Salt Cavern
Gulf Coast
Northeast and West
Source: Industry sources
$10 - $12 million
As much as $25 million
Type Development Costs Per Bcf of Working
Gas Capacity
$5 - $6 million
Development Cost of Working Gas Storage

19Federal Energy Regulatory CommissionFederal Energy Regulatory CommissionFederal Energy Regulatory CommissionFederal Energy Regulatory CommissionFederal Energy Regulatory Commission ••••• Staff Report ••••• September 30, 2004
Generalizations aside, costs are site-specific based on:
• the quality and variability of the geologicstructure of the proposed site;
• the amount of compressive horsepowerrequired;
• the type of surface facilities needed;• the proximity to pipeline infrastructure; and• permitting and environmental issues.
Significant project development effort must be done beforea storage site is located and planned, increasing the riskof project delays and cost overruns.
The cost of base gas is one of the most expensive elementsof a storage project. As a rule of thumb, the total capacityof depleted reservoirs normally consists of 50 percent basegas. Expansions of existing reservoir storage, however,can significantly reduce the need for base gas. Total aquiferstorage field capacity is made up of between 50 percentand 80 percent base gas. A salt cavern storage field typicallyrequires 25 percent base gas. However, leaching and brinedisposal costs for salt caverns are high. This is due to thelarge amounts of water needed to leach a salt cavern andthe environmental problems associated with disposingof the brine during the leaching process.
The majority of recent storage projects involve re-workingand expanding older high-quality depleted reservoirs togenerate higher deliverability using new technologiessuch as horizontal drilling. These projects minimizedevelopment costs by leveraging the existing infrastructureand avoiding many environmental issues.1717171717 In addition,field performance is easier to judge because thecharacteristics are already known.
The table in he next column summarizes recent examplesof storage development costs.1818181818
1717171717 CBI Storage Conference, Houston, Texas, February 23-24, 2004.1818181818 Dominion Application, CBI Storage Conference, February 23-24, 2004.
TTTTThe Vhe Vhe Vhe Vhe Value of Storagealue of Storagealue of Storagealue of Storagealue of Storage
The value of storage will depend on what function storageprovides with different purposes, for instance, forreliability of supply, imbalance management, seasonalarbitrage and trading. Storage operators and customershave developed sophisticated techniques for valuingstorage based on option theory. Consistent with thevariety of storage uses are a range of valuation approachesthat include:
• Cost of Service Valuation;• Least Cost Planning;• Seasonal Valuation (Intrinsic); and• Option-Based Valuation (Extrinsic).
Cost of Service Valuation
Cost-of-service is used to value services offered byregulated storage providers such as interstate pipeline
Source: Dominion Resources, Inc, CBI Storage Conference, Feb. 23-24, 2004
Gulf Coast Salt
Cavern
Northeast Reservoir Storage
Capacity (BCF) 5 9.4
Deliverability 500 147(MMcfd) (est.)
Base Gas Cost ($ Millions) 12 3.2
Total Development Costs ($ Millions) 65 39.5
Gas Storage Development Costs

companies. It allows for recovery of costs and a return oncapital. Published rates and tariffs are maintained.Services priced in this manner include firm storageservice, no-notice storage service, interruptible storageand parking and lending services. Based on a review of20 storage operator tariffs, the median cost-of-service rateper Dth of annual working gas capacity for firm storageservice is $0.64.1919191919 A summary of the tariff rates is providedin Appendix A.
Most cost-of-service regulated storage is reservoir storage.A cost-of-service rate for high-deliverability salt cavernstorage would be much higher than traditional storage.As a hypothetical example:
– Capital cost = $60 million for a 5-Bcf Gulf Coast cavern– Annual Cost of service = $14.63 million2020202020
– Unit storage cost = $2.93 per Mcf per year
Seasonal Valuation
The seasonal valuation of storage is called the intrinsicvalue. It is the difference between the two prices in a pairof forward prices and does not include trading benefits.This strategy, based on locking-in forward spreads, issimple to execute, both financially and physically. Theseasonal spread for next winter is demonstrated in thefollowing table.2121212121
Source: Derived from New York Mercantile Exchange data
Delivery Month Forward Price
Jul-05 5.933Aug-05 5.955Sep-05 5.950Oct-05 5.985Nov-05 6.225Dec-05 6.438Jan-06 6.578Feb-06 6.538Mar-06 6.380
Monthly Contract Values for Natural Gas Futures
The differential for July 2005 to January 2006 is ($6.578-$5.933)/(1.05) = 62¢ as of September 3, 2004, and assumingone year of discounting at 5 percent (thus, thedenominator of 1.05). More conservatively, the seasonalspread assuming average values over the entire injectionand withdrawal periods would be approximately 47¢. Themore conservative estimate uses average prices for theseven-month injection and five-month withdrawalseason as compared with using the highest and lowestvalues.
While the spread is 47¢-62¢, for the 2005-05 winter thespread going into the current winter widened to $1.84 forOctober 2004 to January 2005. This differential was highby historical standards and was largely the result of fallingOctober prices rather than increasing January prices;January prices remained relatively stable during thisperiod. This appeared to reflect an adequate supply ofgas in the market due to a mild summer with reducedcooling demand. In terms of ability to store excessproduction, if more storage capacity were available at theseprices, it’s likely that gas would have been injected into itand prices wouldn’t have fallen so much. Eventually,this would have resulted in a reduction in January pricesunder “normal” weather expectations, or increasedreliability to handle extreme demand situations.However, with regard to the planning horizon for storagedevelopment, developers would look to next year’s pricesand beyond to economically justify projects as comparedto a short-term spread of three to four months.
Historical seasonal spreads for a variety of locations areshown in the following chart.2222222222
1919191919 Staff review of rates and tariffs as maintained on informational
postings.2020202020 Staff calculation assuming: return on equity of 13 percent, debt cost of
8 percent, 50/50 debt/equity ratio, 34 percent federal tax rate, 3 percent
state ad valorem tax, 20-year book life and 10-year tax life.2121212121 Staff analysis of September 3, 2004, settlements on the New York
Mercantile Exchange (Nymex).2222222222 Staff analysis of Gas Daily data, nominal values.
20 Current State of and Issues Concerning Underground Natural Gas StorageUnderground Natural Gas StorageUnderground Natural Gas StorageUnderground Natural Gas StorageUnderground Natural Gas Storage

Option-Based Valuation for High-Delivery Storage
High-deliverability storage provides trading benefits thatincrease with the number of turns, or cycles, per year.This is often referred to as the extrinsic value of the storageand is in addition to the intrinsic value.
The premium of extrinsic value is similar to a call optionon a time spread, increasingly so for a high delivery facility.
This gives storage holders the opportunity, although notthe obligation, to inject at one time and withdraw atanother time. Similar to any option, the value isproportional to forward prices, price volatility, strike priceand time to expiration.
The chart on the following page illustrates the differencebetween extrinsic and intrinsic values.
Average Gas Price Differentials Between Summer and Winter Seasons
Source: Derived from Platts Gas Daily data
Avg
. $/M
Mbt
u
-1
0
1
2
3
4
5
6
Period 1 (1998-1999)
Period 2 (1999-2000)
Period 3 (2000-2001) Period 4
(2001-2002)Period 5
(2002-2003)Period 6
(2003-2004)
Long Term Averages:Henry Hub $0.65
Dominion NP $1.10 Dominion SP $0.92
Northwest $1.57Chicago $0.72
Henry Hub Dominion North Point Dominion South Point Northwest Chicago
21Federal Energy Regulatory CommissionFederal Energy Regulatory CommissionFederal Energy Regulatory CommissionFederal Energy Regulatory CommissionFederal Energy Regulatory Commission ••••• Staff Report ••••• September 30, 2004

22 Current State of and Issues Concerning Underground Natural Gas StorageUnderground Natural Gas StorageUnderground Natural Gas StorageUnderground Natural Gas StorageUnderground Natural Gas Storage
If all opportunities for injection and withdrawal aresuccessfully exploited, the value of the multiple-turnfacility will be several times the value of a single-turnfacility with no opportunities to take advantage of marketprices. Current, average estimates of extrinsic values inthe Gulf Coast range from $1.00 for a three-turn facility to$1.30 for a nine-turn facility, resulting in total storage
valuation, including both seasonal arbitrage and extrinsictrading benefits, of approximately $1.60 to $1.90 for thethree-turn and nine-turn facilities, respectively.
The chart on the next page demonstrates the extrinsicvalue as compared to storage cycles.2323232323
2323232323 The extrinsic value is determined by not only the spread between future prices for injection periods and future prices for withdrawal periods, butalso by the volatility of prices along the natural gas futures curves curve and the degree to which the individual months move together as measuredby correlation. The more volatile and less correlated the prices for individual months are, the greater the probability that the spread between pricesfor an injection month and a withdrawal month will widen. This is in turn increases a storage facility’s potential profitability.
Difference Between Intrinsic and Extrinsic Value of Natural Gas Storage
Source: Based on New York Mercantile Exchange data
$/M
MB
tu
Nymex Gas Contracts, July 2003 and January 2004
4
4.5
5
5.5
6
6.5
7
3/1/03 4/1/03 5/1/03 6/1/03 7/1/03 8/1/03 9/1/03 10/1/03 11/1/03 12/1/03
Intrinsic value of storage =the difference between the cost of July '03 gas (here at contract expiration) and the value of Jan '04 gas sold the same day
Jan. '04contract
July '03contract
Opportunity for additional value on July-January spread
Cost of July gas in storage fixed after contract expiration

23Federal Energy Regulatory CommissionFederal Energy Regulatory CommissionFederal Energy Regulatory CommissionFederal Energy Regulatory CommissionFederal Energy Regulatory Commission ••••• Staff Report ••••• September 30, 2004
Extrinsic Value of Natural Gas Storage
Source: Analysis of New York Mercantile Exchange forward prices and Bloomberg data
Sto
rage
Val
uati
on
Turns (Cycles)1 2 3 4 5 6 7 8 9
High Correlation Low Correlation
$0.00
$0.20
$0.40
$0.60
$0.80
$1.00
$1.20
$1.40
$1.60
$1.80

24 Current State of and Issues Concerning Underground Natural Gas StorageUnderground Natural Gas StorageUnderground Natural Gas StorageUnderground Natural Gas StorageUnderground Natural Gas Storage
Least-Cost Planning
Least cost planning is storage valuation as typicallyperformed by local distribution companies and otherlarge-volume gas customers. Storage is valued byconsidering the savings resulting from not having to usea more expensive option. There is a wide range ofvaluations that are highly dependent upon a gasconsumers’ load profile. The following hypothetical loadduration curve illustrates least cost planning.
Using this evaluation technique and assuming theincremental storage capacity is priced relative to long haul
Pipeline Capacity
StorageCapacity
Interruption
Peak Shaving (LPG)
Incremental Storage Capacity
Least Cost Planning for Gas Storage
Source: Based on representative industry data
MM
cfd
of s
endo
ut
1 Days Per Year 365
pipeline capacity, the unit value for market area storagegiven a 50 percent load factor is 70¢ to $1.10.2424242424
Economic SummarEconomic SummarEconomic SummarEconomic SummarEconomic Summary and Cy and Cy and Cy and Cy and Conclusionsonclusionsonclusionsonclusionsonclusions
A summary of current, alternative valuations, dependingon use of the facilities, and based on the proceedinganalyses, is shown below. These approaches are notmutually exclusive, all of them are currently in use, andmost prudent customers will use some combination inquantifying value.
2424242424 Does not take into account additional transportation capacity to make storage comparable to pipeline delivery. Chart is an illustrative load duration
curve.

25Federal Energy Regulatory CommissionFederal Energy Regulatory CommissionFederal Energy Regulatory CommissionFederal Energy Regulatory CommissionFederal Energy Regulatory Commission ••••• Staff Report ••••• September 30, 2004
Source: Summary of industry and financial data cited in this report
Type $/Mcf of Working Gas
Storage Median Cost-of-Service $0.64
Storage Seasonal Spread (Intrinsic) for Winter 05/06 as of August 2004 $0.47 to $0.62
Least-Cost Planning (Generally Applies to Reservoir Storage) $0.70 to $1.10
Salt Cavern Hypothetical Cost-of-Service (Gulf Coast) $2.93
Salt Cavern Market Value (Intrinsic plus Extrinsic Gulf Coast) $1.60 to $1.90
Varying Costs of Gas Storage
Seasonal spreads, ranging from 47¢ to almost 62¢ for thewinter of 2005-06 as of September 2004, are comparable tothe cost expansions of reservoir storage, and indicatestorage supply and demand are reasonably in balance ona national level. However, storage may be the best wayof managing gas commodity price volatility under moreextreme weather conditions, so the long-term adequacyof storage investment depends on how much pricevolatility is considered “acceptable”. The public policyinterest in volatility mitigation may be different thanwholesale market valuations.
Although storage costing less than or near its intrinsic orseasonal arbitrage value will always be fully subscribed,the market value of storage relative to its costs currentlydoes not provide incentives for most independent storagedevelopment. Project economics are a challenge for saltcavern storage. At a market value of approximately $1.60to $1.90/Dth/year, it is difficult to justify developing saltcaverns outside of the low-cost Gulf Coast. Projectdevelopers are not likely to achieve a cost-of-servicecomparable returns that would require a rate approaching$3 in the Gulf Coast and much higher elsewhere wheredevelopment is more expensive.
The financial and regulatory circumstances of storagecustomers can hinder storage development. Even if aproposed new storage facility is economic, state regulatorypolicies may inhibit its development. Because stateregulators exercise prudence reviews for cost recovery of
new storage facilities, it may be easier for local distributioncompanies to simply purchase gas at index rather thaninvest in facilities to mitigate volatility. Thus, manylocal distribution companies do not see the value ofentering into storage contracts that reflect extrinsic value.The Arizona Corporation Commission (ACC) recentlyreleased a policy statement embracing the need for newstorage capacity and may be amenable to addressing thisproblem by altering the incentives to contract for storageservice.
The loss of a vibrant trading sector means fewer customerswill pay for the trading benefits of storage. For instance,one developer said he would be lucky to get $1 for storagevalued intrinsically and $1.60 extrinsically. The marketwill often only pay for 50 percent of the extrinsic value toaccount for the likelihood of not being able to realize thefull value.
Electric generators can use inexpensive pipelineimbalance management that makes third party storageless attractive as an alternative. Park and loan rates aretypically less than 20¢ per day and more palatable toindependent electric generators, especially given theirweak credit and inability to make long-term commitmentsto storage. Finally, at high gas prices, base gas becomes abarrier to entry for reservoir storage development andalso provides incentives to abandon existing fields to sellthe base gas.

26 Current State of and Issues Concerning Underground Natural Gas StorageUnderground Natural Gas StorageUnderground Natural Gas StorageUnderground Natural Gas StorageUnderground Natural Gas Storage
PPPPPOSOSOSOSOSSSSSSIIIIIBBBBBLLLLLEEEEE O O O O OPTPTPTPTPTIONIONIONIONIONSSSSS FFFFFOOOOORRRRR S S S S STTTTTIIIIIMMMMMUUUUULLLLLAAAAATTTTTIIIIINGNGNGNGNG
UUUUUNDERGROUNDNDERGROUNDNDERGROUNDNDERGROUNDNDERGROUND S S S S STORAGETORAGETORAGETORAGETORAGE D D D D DEVELOPMENTEVELOPMENTEVELOPMENTEVELOPMENTEVELOPMENT
In prior sections we discussed how underground naturalgas storage is a valuable resource that can ensure servicereliability, serve as a substitute for gas transmission andthereby reduce overall delivery costs, and through hedginghelp moderate gas commodity price volatility. By allaccounts, demand for the natural gas resource willcontinue to grow over the next 20 years, particularly withrespect to gas-fired electric generation. Gas storagedevelopment is an essential element of the infrastructurethat will be necessary to reliably and efficiently servethese new demands.
While current and projected storage development iskeeping pace with aggregate storage demands,underground storage development in some market areas,such as the Southwest and New England, has beenvirtually non-existent. Few new projects in the Southwesthave been proposed and several have failed or facesignificant opposition.2525252525 The geology in these areas isalso not favorable to large scale underground storagedevelopment, and competition from pipeline expansionsand LNG development may be dampening demand fornew underground gas storage. Further, state unbundlinginitiatives limit the ability of LDCs, the traditionalpurchasers of storage services, to renew or enter into newcontracts for long-term storage service, primarily due touncertainty over cost recovery at the local level and tostranded cost considerations. Additionally, in theSouthwest, until the Commission reformed services onthe El Paso Natural Company system to put in place firmcontract demand levels for all of its customers,2626262626 marketsignals for new storage services were virtually non-existent. Almost all gas service in the East-of-Californiamarket was provided on a full requirements basis and El
2525252525 The Red Lake storage project failed after being denied market-based rate authority for failing the Commission’s market power test. The Desert
Crossing storage and transportation project failed due to environmental issues and the contract support that did not materialize. The developers of
the Copper Eagle storage project failed to secure contractual support and have sold development rights to the project to El Paso Natural Gas Company
(El Paso). El Paso has yet to overcome local opposition to the project, secure contractual commitments and file for certificate authorization. Additionally,
no LDCs in these areas have pursued development of storage projects, which could be another indicator of demand for new storage.
2626262626 See El Paso Natural Gas Co., 99 FERC ¶ 61,244 (2002); El Paso Natural Gas Co., 100 FERC ¶ 61,285 (2002); El Paso Natural Gas Co., 104 FERC ¶ 61,045 (2003).
Paso had no daily penalties for service imbalances. As aresult, El Paso’s customers had no need to individuallycontract for storage services to meet peak demand orpipeline balancing requirements.
Some independent storage developers, such as Red Lake,assert that storage development is considerably more riskythan pipeline construction primarily because of theinability to secure similar long-term contractualcommitments. They assert that in contrast with newpipeline construction, where contract commitments aretypically in the 10 to 20 year range, contract commitmentsfor storage service exceeding a 1 to 5 year range are rare.They contend that traditional cost-based storage ratedesign will not encourage further development of storagedue to the evolving and risky nature of storage services,the fact that the primary users of these new services (e.g.,daily and intraday balancing, and commodity arbitrage)are often not the traditional creditworthy LDCs, and thattraditional cost-based rates do not reflect the value ofservice on peak, and do not reflect rates of return thatadequately account for the risky nature of theseinvestments. Additionally, they imply that affiliatedstorage development has subtle, and in some instances,tariff advantages over storage provided by independentthird parties, which may lead to increased costs and serviceinefficiency for all customers. According to Red Lake, thebest and preferred way to permit them to fairly competeand recover their costs is through the flexibility of market-based rates. Pricing schemes short of market-based ratesmay provide too little flexibility and shift too much riskto independent storage providers to encourage storagedevelopment.
27Federal Energy Regulatory CommissionFederal Energy Regulatory CommissionFederal Energy Regulatory CommissionFederal Energy Regulatory CommissionFederal Energy Regulatory Commission ••••• Staff Report ••••• September 30, 2004
It is not entirely clear as to why, but the paucity ofunderground storage project development in some areasof the country may simply be attributable to market forcesand alternative service options. Whether regulatorypolicies act as unnecessary barriers to further storagedevelopment is a question that merits further inquiry.Traditional cost-based storage service rate design, whichprices service on an average basis, may not accuratelyreflect the value of service in peak periods; and rates ofreturn on equity may not reflect today’s risk andshareholder expectations, or may no longer be appropriatefor new storage services at all. The Commission’s test forauthorizing market-based rates may not accurately captureor measure the market power of storage providersgenerally, or more narrowly of independent storageproviders. Also, pipeline services and tariff requirements,as well as certificate applications filing requirements andprocedures, may be seen as a barrier to entry anddevelopment.
Discussed below are various rate, service, tariff and policyapproaches the Commission could take to encourage thedevelopment of additional underground storage projects.These include: (1) options to traditionally developed cost-based rates and incentive rates, as well as options forperiodic cost and revenue review; (2) market-based ratesfor all new entrants; and (3) Commission policies toincrease service options or reduce costs.
CCCCCosososososttttt-Based R-Based R-Based R-Based R-Based Raaaaate Ote Ote Ote Ote Options for Storage Devptions for Storage Devptions for Storage Devptions for Storage Devptions for Storage Developmentelopmentelopmentelopmentelopment
Peak/Off-Peak Rates and Term Differentiated Rates
The current storage rate design policy was developed forstorage service with a single yearly cycle of injection and
withdrawal. This rate design policy is known as theEquitable method. Under this policy, 50 percent of aproject’s fixed costs are collected based on storagedeliverability and fifty percent are collected based onstorage capacity; no return on equity and related taxes arepermitted in the variable rate component (injection andwithdrawal charges). Furthermore, injection andwithdrawal charges are designed to recover only variablecosts. Potential storage providers fear that under this ratedesign, capital costs will not be recovered,2727272727 i.e., uniformmonthly rates do not adequately reflect variations ofservice value, and may result in underrecovery of costs inperiods of low demand.
In Order No. 6372828282828 the Commission recognized thattraditionally-designed rates with uniform maximumprices permit short-term service customers to purchasecapacity at prices that may be lower than the market valueof the capacity, while off-peak capacity may go unusedwithout discounting. The Commission found that flexiblepeak/off-peak or seasonal rates based on value of serviceconcepts (rather than specific costs), promotes allocativeefficiency by providing more efficient pricing signals.Under this approach, customers that value capacity morehighly should be expected to pay higher prices whencapacity is scarce. Conceptually, peak/off-peak or flexiblerates may be designed in any number of ways. Forexample, the value of service between peak/off-peak maybe determined using price differentials between specifiedpoints. Alternatively, load factors or other measures forattributing value may be used. However, under thisapproach, any increase in rates at peak must be offset bydecreases in off-peak rates, such that the annual revenuerequirement is not exceeded. This ensures that the ratesremain cost based.
2727272727 See supra note 5.
2828282828 Regulation of Short-Term Natural Gas Transportation Services and Regulation of Interstate Natural Gas Transportation Services, Order No. 637, FERC Stats. &
Regs., Regulations Preambles, 1996- 2000 ¶ 31,091 (2000), order on reh’g, Order No. 637-A, FERC Stats. & Regs., Regulations Preambles, 1996- 2000 ?
31,099 (2000), order denying reh’g, Order No. 637-B, 92 FERC ¶ 61,062 (2000), aff ’d in part and remanded in part, Interstate Natural Gas Association of America
v. FERC, 285 F.3d 18 (D.C. Cir. 2002), order on remand, 101 FERC ? 61,127 (2002).
28 Current State of and Issues Concerning Underground Natural Gas StorageUnderground Natural Gas StorageUnderground Natural Gas StorageUnderground Natural Gas StorageUnderground Natural Gas Storage
While an annual revenue cap would limit the rates thestorage service provider may charge, it should allowstorage providers considerable flexibility to develop ratesthat would allow full recovery of costs and encourage entryinto the market. Additionally, these flexible rates wouldserve as the recourse/backstop rates in any negotiatedrate program.2 92 92 92 92 9 Rates could be negotiated betweencustomers and the storage provider which are mutuallyefficient and beneficial. Further, increased revenues frompeak short-term services reduces the level of costs thatneed to be recovered from long-term customers, andreduces the need for rate discounts in off-peak periodsand the associated cost shifting that occurs through ratediscount adjustments.
Similarly, storage providers could develop term-differentiated rates, as contemplated in Order No. 637.Term-differentiated rates do not differentiate betweenseasons, as in the above discussion, but insteaddifferentiate based on the length of contract term. Ratesdesigned to reflect differences in contract terms recognizethat shorter term contracts subject the service provider tomore risk, and higher rates may be appropriate tocompensate the service provider for the additional risk.Conversely, long-term contracts would reflect lower ratesfor service on a comparable basis.
An alternative approach to flexibly marketing storageservices for storage operators would be through the use ofvoluntary auctions. Auctions can be used in both the cost(e.g., with an annual revenue cap) and market-based rateregimes. As discussed in Order No. 637, properly designedauctions can provide for efficient allocation of services,reduce transactions costs and provide for more accuratedissemination of relative pricing information to themarketplace.3030303030 Auctions also can be used as methods of
mitigating the effects of market power by limiting theability of sellers to withhold capacity, to pricediscriminate, or to show favoritism.
Cost of Service Adjustments
An additional cost-based rate option for encouraginginvestment in underground storage could be accomplishedthrough adjustments to the cost of service, i.e., the annualrevenue requirement of the project. For example, anequity return premium to reflect higher risks associatedwith storage development, or accelerated depreciationcould induce entry by allowing higher maximum rates.In this example higher rates would occur because (1) thenormal cost of equity would be increased by a premium toreflect higher risk or simply to incent development, and(2) the depreciable life of the storage project’s assets wouldbe shortened. Accelerated depreciation allows the fullcost of capital to be recovered more quickly.3131313131 It mayseem counter-intuitive to grant cost adjustments thatwould increase costs when storage developers argue theycannot recover costs under traditionally designed cost-based rates. However, the higher maximum rates allowmore revenue collection during periods of peak demand.Further, these cost adjustments could be coupled withflexible peak/off-peak, seasonal or other rate designmethods that reflect periodic differences in the value ofservice.
Additional rate policy options could be considered toaddress storage developer cost recovery concerns. Onesuch option would be to permit storage developers to useunit of throughput depreciation. Under this approach,accounting would follow revenues and storage developersmight avoid losses in the early years of a project.Alternatively, regulatory asset treatment could be
2929292929 Under the Commission’s negotiated rate policy, rates can be negotiated as long as customers can always choose service under an approved cost-of-
service recourse rate, also known as the recourse rate. Alternatives to Traditional Cost-of-Service Ratemaking for Natural Gas pipelines and Regulation of
Negotiated Transportation Services of Natural Gas Pipelines, 74 FERC ¶ 61,076 (1996), reh’g and clarification denied, 75 FERC ¶ 61,024 (1996) (Policy Statement).
3030303030 Minimum bid criteria could be established to ensure full cost recovery.
3131313131 Accelerated depreciation may require the Commission to waive its tax normalization policy regarding adjustments to the rate base.

29Federal Energy Regulatory CommissionFederal Energy Regulatory CommissionFederal Energy Regulatory CommissionFederal Energy Regulatory CommissionFederal Energy Regulatory Commission ••••• Staff Report ••••• September 30, 2004
conditioned for unrecovered costs in the short term.These unrecovered costs would be reflected in future rates.While such an option would deviate from traditionalCommission cost-based ratemaking policy, it would betterensure full recovery of storage development costs overthe long term and thereby incent development.
Modification of the Requirement for a Three-YearRevenue Review
Another approach for incenting development ofunderground storage would be to modify theCommission’s current certificate policy of requiring costand revenue studies to be filed within three years ofcertification of new projects. Elimination or modificationof this requirement would, at a minimum, delay orlengthen the maximum time for a review of a project’scosts and revenues. Under such an approach, storageproviders will be afforded greater certainty with respectto the initial rates, which could translate into additionalincentives to construct and operate storage projects. Asabove, this option maintains the Commission’s ability touse Section 5 of the Natural Gas Act to ensure that thecost-based recourse rate remains just and reasonable.
MarkeMarkeMarkeMarkeMarkettttt-Based R-Based R-Based R-Based R-Based Raaaaatestestestestes
The Commission’s authority to authorize market-basedrates is premised on the theory that the just and reasonablestandard of the Natural Gas Act, the Federal Power Actand the Interstate Commerce Act does not limit theCommission to any particular ratemaking methodology;rather, the Commission has flexibility in selecting ratemaking methods. The Commission has developed testsof competitiveness for the purpose of determining ifmarket-based rate authority should be granted. Thesetests are based on the market competitiveness analysis inthe U.S. Department of Justice and the Federal TradeCommission, Horizontal Merger Guidelines (1997).
In 1996, the Commission issued Alternatives to TraditionalCost-of-Service Ratemaking for Natural Gas Pipelines andRegulation of Negotiated Transportation Services of Natural GasPipelines (Policy Statement)3 23 23 23 23 2 which established aframework for analyzing market-based rate proposals ingas pipelines (which includes gas storage). The PolicyStatement’s framework addresses whether the applicanthas market power; that is, can the applicant: (1) withholdor restrict services to increase price a significant amountfor a significant period of time, or (2) discriminate undulyin terms of price or conditions. Before the Commissioncan conclude that a seller cannot exercise market power itmust either (1) find that there is a lack of market powerbecause customers have sufficient “good alternatives” or(2) mitigate the market power (i.e. ,permit market-basedpricing only if specified conditions are met that preventthe exercise of market power).
In Order No. 572, the Commission amended itsregulations to adopt filing requirements with respect toapplications for market-based rates by oil pipelines.3333333333 Theframework created by these required filings is essentiallythe same as described above for the competitive analysisof gas pipelines.
With respect to granting a public utility the authority tomake market-based sales of electric power, theCommission must determine that the applicant does nothave the ability to exercise market power in generation.3434343434
The Commission determined in Kansas City Power &Light Company3535353535 that it is no longer necessary to examinegeneration market power when considering market-basedrate applications for sales from new generation units. Thiswas codified in Order No. 888, section 35.273636363636 of theCommission’s regulations, providing, in relevant part,the following:
Notwithstanding any other requirements, any publicutility seeking authorization to engage in sales for resale
323232323274 FERC & 61,076 (1996), reh’g and clarification denied, 75 FERC & 61,024 (1996); see supra note 27.3333333333 Market-Based Ratemaking for Oil Pipelines, FERC Stats. & Regs., Regulations Preambles 1991-1996 ¶ 31,007 (1994) ; 18 C.F.R. § 348.3434343434 The other considerations are whether the applicant has transmission market power, whether the applicant can erect barriers to entry, and whether
there is potential for affiliate abuse and reciprocal dealing. See Order on Rehearing and Modifying Interim Generation Market Power Analysis and Mitigation
Policy, 107 FERC ¶ 61,018 (2004).3535353535 67 FERC ¶ 61,183 (1994).3636363636 18 C.F.R. § 35.27 (2003).

30 Current State of and Issues Concerning Underground Natural Gas StorageUnderground Natural Gas StorageUnderground Natural Gas StorageUnderground Natural Gas StorageUnderground Natural Gas Storage
of electric energy at market-based rates shall not berequired to demonstrate any lack of market power ingeneration with respect to sales from capacity for whichconstruction has commenced on or after July 9, 1996.3737373737
However, as the Commission stated in Order No. 888, itwill consider whether an applicant, properly citing section35.27, nevertheless possesses generation market power ifspecific evidence is presented by an intervenor.3838383838
As noted above, independent storage developers assertthat pricing schemes short of market-based rates mayprovide too little flexibility and shift too much risktherefore discouraging storage development. But, underthe Commission’s traditional tests for marketcompetitiveness, demonstrating lack of market power maynot be possible in all areas of the country. For example,conditions in western storage markets, particularly marketconcentration and entry conditions, make it impossiblefor significantly-sized storage projects to demonstrate thatthey lack market power under tests the Commission hasdeveloped to evaluate market competitiveness.3939393939
However, to the extent that it is desirable to encouragefurther storage development, the following options oralternatives for granting market based rate treatmentcould be considered.
Market-Based Rates for New Independent StorageProjects
In this first approach, Commission policy would bemodified to allow market-based rates for new independentstorage providers, subject to possible mitigation measures,on the grounds that new storage projects add incrementalcapacity to existing markets, thereby giving customersnew choices for services, and with the provision that all
market risks lie with the projects’ owners (i.e., no captivecustomers). The Commission could determine market-based rates for new independent storage projects to bejust and reasonable because customers are better off thanthey would be if the project was not built, and customerswill face additional service options because of the newinfrastructure provided by the new storage project.
Since the new project’s owners assume all market riskand have no captive customers to pass costs on to, theymust successfully sell storage in order to cover fixed costsand try to make a profit. Under this theory, customerscan always choose to not use the new project and act asthey would if the project had not been built.4040404040 As a result,project sponsors must price their services at rates that arelow enough to attract customers. That is, customers arebetter off paying the market-based rates than they wouldhave been if the project had not been built.
The rate flexibility provided by this option allows anunlimited upside for rates in periods when storage hashigh demand4141414141 to compensate for the periods when storagehas low demand and investment costs are not recouped.Further, to the extent the Commission is concerned withthe potential for high market-based storage service pricesin times of great scarcity, it could consider mitigationmeasures, such as requiring that capacity be sold throughopen and transparent auctions. While this requirementmay not mitigate prices under all supply and demandscenarios, it would ensure that the storage service providerdid not withhold capacity to drive up prices.Alternatively, the Commission could require periodicreview of market-based rate storage services. Again, thisapproach may not directly mitigate high prices in allsituations, but it would provide the Commission anopportunity to review rates and services.
3737373737 See 18 C.F.R. § 35.27 (2003).3838383838 See Promoting Wholesale Competition Through Open-Access Non-Discrimination Transmission Services by Public Utilities; Recovery of Stranded Costs by Public
Utilities, Order No. 888, FERC Stats. & Regs., Regulations Preambles 1991-1996 ¶ 31,036 (1996) .3939393939 See supra note 5.4040404040 The California Public Utility Commission largely authorized the construction and operation of the Wild Goose Storage Inc. project on this basis
(see Appendix B for full description).4141414141 This is, in part, what happened in California electricity and gas markets in 2000-2001.

31Federal Energy Regulatory CommissionFederal Energy Regulatory CommissionFederal Energy Regulatory CommissionFederal Energy Regulatory CommissionFederal Energy Regulatory Commission ••••• Staff Report ••••• September 30, 2004
Finally, the Commission might consider removing therate cap on capacity release transactions and other short-term and interruptible services. The theory behind thisalternative is that service providers and customers withexisting cost-based storage or transmission capacity wouldhave an incentive to compete with the storage provider,and thereby keeping storage prices down.
Reviewing the Market Power Test for Adequacy inStorage Markets
An alternative to granting market-based rates to all newindependent storage projects, would be to find that thecurrent test for market power does not accurately measureit. Some storage developers assert that they are unable tosecure long-term service agreements as pipelines do inconstruction applications. Accordingly, to the extent astorage provider could demonstrate an inability to securefirm service contracts for the entire capacity of its storagefield, for terms exceeding some specified time, such as 1,2 or 5 years, the Commission could find it lacked marketpower, and grant market-based rate authority. TheCommission would likely want to establish guidelines,in advance, for such capacity offerings to ensure they wereconducted on an open and transparent basis, and barriersto longer term contracts were not established.
The mitigation measures discussed in the previous sectioncould be applicable to these alternative approaches, aswell.
RevRevRevRevRevise or Wise or Wise or Wise or Wise or Waivaivaivaivaive Ce Ce Ce Ce Commisommisommisommisommission Psion Psion Psion Psion Policiesoliciesoliciesoliciesolicies
It has been suggested in informal discussions withcompanies that are considering storage projects, that entry
into storage would be assisted by waivers or exemptionsof certain environmental and certificate analyses, affiliaterules, open access requirements for offering firm andinterruptible service, and prohibitions against makingbundled sales. The Commission could consider initiatingan industry dialogue to explore possible improvementsto the current process for environmental review andcertificate authorization. For instance, the current blanketcertificate program is not available for storage relatedactivities except for initial testing and development.However, since the existing regulations have longindicated that certain types of storage projects are usuallynot major federal actions, and because the issues that areunique to the development of storage fields are verylimited, the Commission could consider revising itsregulations to add certification of storage projects to theblanket program. In addition, the industry is onlybeginning to avail itself of existing Commission programssuch as the Pre-Filing Process for storage fields. Either orboth of these possible avenues may assist in allowingstorage projects to be approved more quickly.
Further, storage providers have asserted that waivers ofvarious open-access requirements and limitations onoperators to engage in commodity arbitrage for their ownaccount limit their ability to maximize or capture the valueof their investment. To the extent the Commissionbelieves development of storage assets is essential forensuring service reliability in all markets, it could considerrevising open-access requirements to encourage storagedevelopment. The Commission could protect againstpotential market abuses by requiring the storageproviders to file periodic reports on their activities andrevoke any waivers after considering complaints bycustomers or potential customers.

32 Current State of and Issues Concerning Underground Natural Gas StorageUnderground Natural Gas StorageUnderground Natural Gas StorageUnderground Natural Gas StorageUnderground Natural Gas Storage
ANR $2.3999 $0.2449 $0.0084 $0.74 181.3 333.5 TX Depleted Reservoir
BLUE LAKE GAS STORAGE $1.8027 $0.0258 $0.0990 $0.58 42.0 49.0 MI Depleted Reservoir
COLUMBIA GAS TRANSMISSION $1.5080 $0.0290 $0.0153 $0.69 243.1 669.6 WV Depleted ReservoirDOMINION $1.7984 $0.0145 $0.0154 $0.56 382.2 755.8 WV Depleted Reservoir
MICHIGAN GAS STORAGE $0.8357 $0.0136 $0.0190 $0.21 34.0 109.5 MI Depleted Reservoir
MIDWEST GAS STORAGE $4.5272 $0.0463 $0.0056 $0.96 0.9 4.5 IL AquifierNATIONAL FUEL $2.1556 $0.0432 $0.0139 $0.47 149.3 317.9 NY Depleted Reservoir
NATURAL GAS PIPELINE CO $1.2900 $0.2881 $0.0197 $0.59 205.3 603.3 TX Depleted Reservoir and Aquifier
NGO TRANSMISSION $1.6373 $0.0320 $0.0726 $0.36 1.5 5.1 OH Depleted ReservoirNORTHERN NATURAL GAS CO $1.5874 $0.3854 $0.0225 $0.75 55.3 206.0 TX Depleted Reservoir and Aquifier
PANHANDLE $2.9700 $0.4246 $0.0385 $0.71 74.0 TX
QUESTAR $2.8533 $0.0238 $0.0105 $0.63 53.0 139.5 UT AquifierSOUTHWEST GAS STORAGE $2.8496 $0.3419 $0.0015 $0.91 57.1 165.5 TX Depleted Reservoir and Aquifier
TEXAS GAS TRANSMISSION $1.4318 $0.0304 $0.0166 $0.68 86.2 176.2 KY Depleted Reservoir and Aquifier
TRANSCO $2.7208 $0.0152 $0.0322 $0.78 182.7 312.9 TX Depleted Reservoir andSalt Cavern
TRUNKLINE GAS COMPANY $3.5985 $0.5767 $0.0005 $0.77 12.9 42.8 TX Depleted Reservoir
YOUNG GAS STORAGE $1.5620 $0.0590 $0.0200 $0.41 5.3 9.9 CO Depleted Reservoir
AAAAAPPENDIXPPENDIXPPENDIXPPENDIXPPENDIX A A A A A
Pipeline Company Max DailyDeliverability
MaxSeasonalCapacity
Gas Storage Tariff Rates
Injection /WithdrawalCommodity
Rate
Annual100% Load
Factor(60 storage days)
WorkingCapacity
(Bcf)
TotalCapacity
(Bcf)
FacilityState
Facility Type
[ Revised October 15, 2004 ]
Sources: Capacity data from Platts GASdat; tariff information from company filings with FERC.

33Federal Energy Regulatory CommissionFederal Energy Regulatory CommissionFederal Energy Regulatory CommissionFederal Energy Regulatory CommissionFederal Energy Regulatory Commission ••••• Staff Report ••••• September 30, 2004
AAAAAPPENDIXPPENDIXPPENDIXPPENDIXPPENDIX B B B B B
Example of State Regulatory Approach
In late June 1997, Wild Goose Storage Inc. becameCalifornia’s newest gas utility and the state’s firstindependent storage provider. The Wild Goose storagefield is located in the southwest corner of Butte County inCalifornia at the site of the depleted Wild Goose naturalgas field. It has a working gas volume capacity of 24 Bcf,a maximum injection rate of 450 MMcf/d, and a maximumwithdrawal rate of 480 MMcf/d. The field is connected tothe PG&E transmission system and can be used to manageimbalances and OFOs on the PG&E system.
The California PUC set out rules for independent naturalgas storage facilities which exempt independent gasstorage providers from traditional cost-of-serviceratemaking, but subjected them to the regulatoryjurisdiction of the PUC. The developers of the projectmust take the risks for its commercial performance withoutany direct recourse to the customer of the utility system.Finding that as a new entrant without market share WildGoose will lack market power, the CPUC authorized WildGoose to offer its storage services at market-based ratesunder tariffs that set rates within a rate window.
In order to prevent predatory pricing, the floor rate couldnot be set below Wild Goose’s short-run marginal cost,but Wild Goose had substantial freedom to set the ceilingrate, under the theory that its potential customers wouldnot be captive but may choose other storage providers.The CPUC was unable to determine that Wild Goose couldnot exercise market power. Neither could the CPUCdetermine that the potential for Wild Goose to exercisemarket power was fully mitigated by its lack of control ofthe transportation system or by other factors.
The CPUC revoked the relaxed reporting requirementsapproved in prior decisions. The CPUC placed reportingrequirements such as interactions between a utility andits affiliates, changes in status that would reflect adeparture from the characteristics the Commission reliedupon in approving market-based rates, and providingservice agreements for short-term transactions (one yearor less).