current austrlian economic trends and 2015 predictions
TRANSCRIPT
MatthewPearce EconomicsReport
ReportontheCurrentEconomicSituationinAustraliaandPredicted
Trendsfor2015
MatthewPearce
ExecutiveSummaryThisreportgivesadetailedanalysisoftheeconomicsituationfacingAustraliaat theendof2014.ByexaminingdatacollectedthroughtheReserveBankofAustraliaandtheAustralianBureauofStatistics, itconsidersthe factors thatcontribute to Gross Domestic Product (GDP) growth of Consumption (C),Investment(I),Government(G)andNetExport(NX)expendituresadheringtotheframework:
GDP(Y/E)=C+I+G+NXIt further suggestswhatGDP growth trends are expectedmoving into 2015andforecastifanymonetarytools(specificallyincashratemovements)canbeemployedtoencouragethisgrowth.Inconsideringall thedevelopmentsmoving into2015, thisreportwillarguethat the Australian economy is currently in a contraction phase of theeconomic cycle, with growth expectations set to be below trend in 2015.However the report concludes thatwhilemonetary policy is a viable tool tohelp grow the economy, at the present moment it is limited inwhat it canachieveoverthenext12monthsinAustralia.Giventhemanyvariablessuchasour already historically low interest rates and the downward trend of thedollar, the best action of the RBA in 2015 is to remain conservative in itsapproachtomonetarypolicyandnotchangethecashrate.Ratherthereportsuggeststhatgiventhealreadyvolatilestateoftheeconomy,aratecutcouldservetohampereconomicgrowthratherthanfacilitateit.
MatthewPearce EconomicsReport
IntroductionThe Australian economy has come off a year that has seen moderate growth
within its economy just below trend. It has been a year of unforeseeable
variablesandthiswouldseemtocontinueinto2015astheAustralianeconomy
transitions from the mining boom into a more sluggish economic phase.
Culminating in fluctuating commodity prices, lowering terms of trade and
stagnant business and consumer confidence brought on by global and local
uncertaintyallindicatorssuggestthatAustraliaiswithinacontractionphaseof
theeconomiccycle(Youngn.d.).
Theaimofthisreportistogiveanin-depthvaluationoftheAustralianeconomy
as it nears the end of 2014. The report will give an outline of what trends
Australiahasexperiencedparticularlywithinthe lastquarterbyexaminingthe
fourmaincomponentsthatcontributetoGrossDomesticProduct(GDP)growth
and aggregate expenditure, of consumer expenditure (C), business investment
(I),governmentexpenditure(G)andnetexportexpenditure(NX)(Equation1),
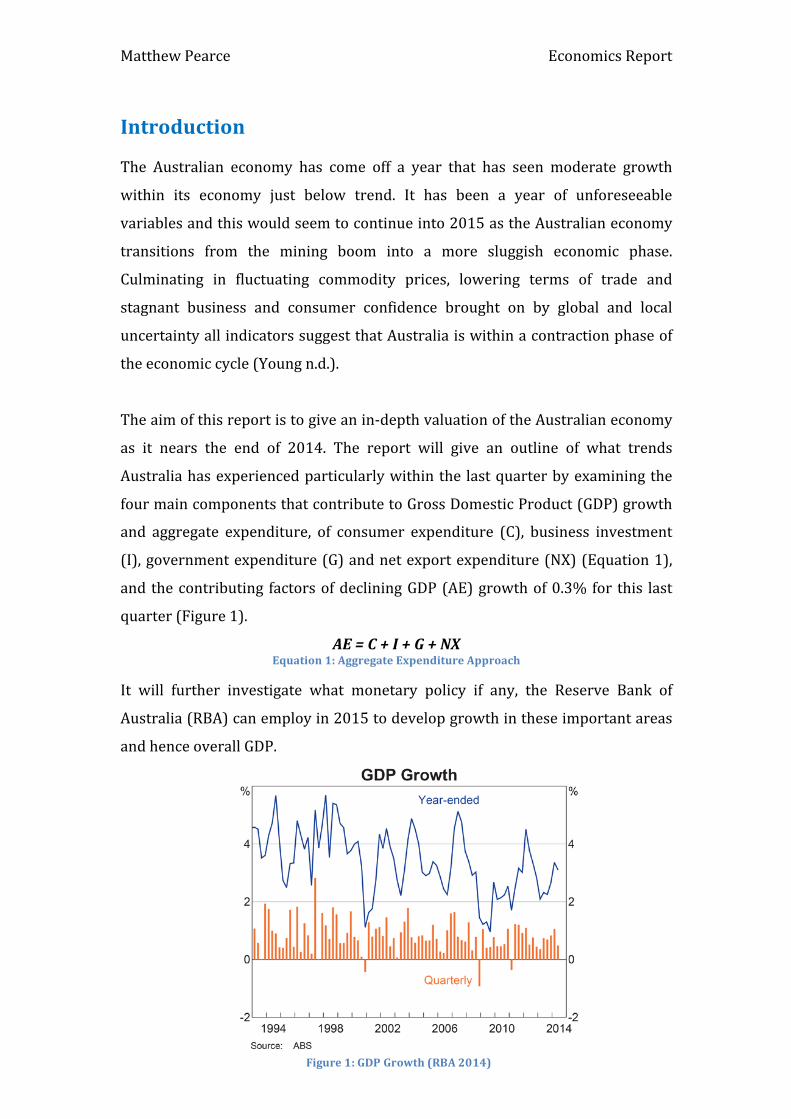
and thecontributing factorsofdecliningGDP(AE)growthof0.3%for this last
quarter(Figure1).
AE=C+I+G+NXEquation1:AggregateExpenditureApproach
It will further investigate what monetary policy if any, the Reserve Bank of
Australia(RBA)canemployin2015todevelopgrowthintheseimportantareas
andhenceoverallGDP.
Figure1:GDPGrowth(RBA2014)
MatthewPearce EconomicsReport
CurrentEconomicConditionTheAustralianeconomyatpresentisinacontractionphaseofthebusinesscycle
wheretheeconomyisstillgrowingbutataslowerratethantrend.Thegeneral
characteristicsareadeclineinprofits;investment,spendingandnationalincome
while there will be an increase in the unemployment rate (Young n.d.). GDP
growth for2014has finishedatanannualisedgrowthrateof3.1%(Figure1);
thisisdownslightlyfromnormaltrendof3.2%butabove2013growthfigures
of2.7%(RBA2014).Predictionsfor2015reportafurtherreductioningrowthto
2.5% (RBA 2014) suggesting that growth will remain under trend. This was
reinforced by the Australian treasurer who stated that growth, ‘will remain
around 2.5% but strengthen to 3% in 2016,’ due predominantly to the
continuousdropinthetermsoftradenumbers(Massola2014).
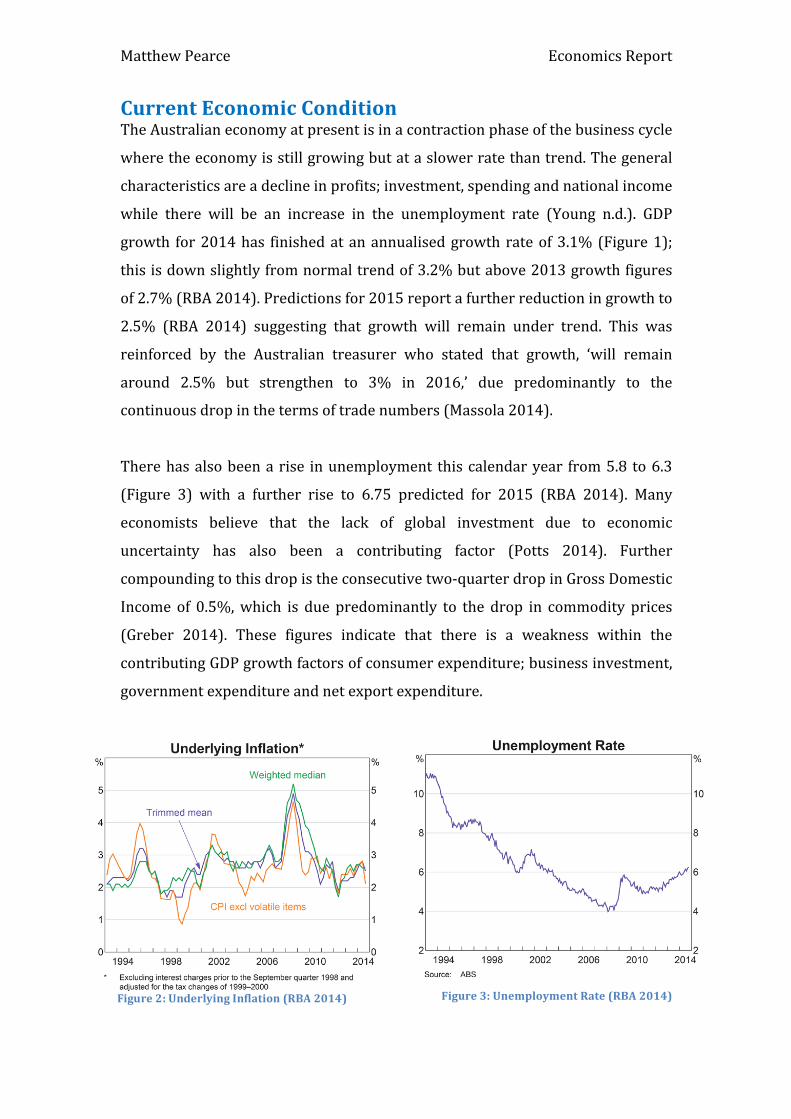
Therehasalsobeenarise inunemployment thiscalendaryear from5.8 to6.3
(Figure 3) with a further rise to 6.75 predicted for 2015 (RBA 2014). Many
economists believe that the lack of global investment due to economic
uncertainty has also been a contributing factor (Potts 2014). Further
compoundingtothisdropistheconsecutivetwo-quarterdropinGrossDomestic
Income of 0.5%,which is due predominantly to the drop in commodity prices
(Greber 2014). These figures indicate that there is a weakness within the
contributingGDPgrowthfactorsofconsumerexpenditure;businessinvestment,
governmentexpenditureandnetexportexpenditure.
Figure3:UnemploymentRate(RBA2014)Figure2:UnderlyingInflation(RBA2014)

MatthewPearce EconomicsReport
ConsumerExpenditureThis is the amount that consumers spend on durable, non-durable goods and
servicesinagivenperiodtherebycontributingtothegrowthofGDP(Farnham
2010).Thelevelofconsumptionexpenditureisinfluencedbyavarietyoffactors
suchasincome(Y),personaltaxes(Tp),interestrates(r),consumerconfidence
(CC),personalwealth levels(W),availablecredit(CR)andpersonaldebt levels
(D).
C=f(Y,Tp,r,CC,W,CR,D)(+)(-)(-)(+)(+)(+)(-)
Equation2:TheConsumptionFunction
Currently in Australia there has been a significant weakness within some of
these consumer function indicators. The rise in unemployment and weak
demand has led to a fifteen-year slump inwages growth of 2.6% (ABS 2014).
Addedtothisistheloweringofdispensableincome(Yd)dueto‘bracketcreep,’
whereannualinflationarypayrisespusheslowandmiddle-incomeearnersinto
higher tax brackets (Tp) without a real increase in income this is seen by
economist asneither efficientnor equitable (Sloan2014) and leads to a lower
dispensable income level (Yd= Y - Tp). Consumer confidence has also seen its
lowest recordings (Figure 4) since August 2011 with a 5.7% drop in the
Westpac-Melbourne Institute measure of consumer sentiment (‘Consumer
SentimentSlumpsto3yearLow’2014).
Figure4:ConsumerSentiment(RBA2014) Figure5:HouseholdWealth&Liabilities(RBA2014)
However therearepositivesignswithin thehouseholdwealth, creditanddebt
levelindicators.Nethouseholdwealthlevelsareclimbinggraduallytopre-Global

MatthewPearce EconomicsReport
Financial Crisis numbers as a percentage of household disposable income and
are amongst the highest by global standards, while debt is holding steady at
around150%ofdisposableincome(Figure5)whichJohnSuttonoftheBankof
Queensland states as ‘a verymanageable level’ (Potts 2014). Because of these
positivefiguresandafavourablecashrateof2.5%(RBA2014)creditavailability
for the housing and personal sectors is slowly rising as banksmake available,
‘low-interestandno-interest loans’(Potts2014).Overall though, thesepositive
factorshavenotbeenenough tobalance thenegative impact of low consumer
confidence, increased taxation and lowerwage growth creatingwhat Nicholas
MooreofMacquarieBankdescribesasaconsumer‘demanddeficit’(Durie2014,
p. 25).Thiswill in turnhaveanegativeaffecton consumeraggregatedemand
andwillthereforeshifttotheleftinthecomingyear(Graph1).
Graph1:ConsumerAggregateDemandPrediction2015
BusinessInvestmentBusiness investment levels determine how much the private business sector
invests in structures, equipment and technology to improve its capacity to
produce goods and meet consumer demand (Farnham 2010). Like the
consumptionfunctiontherearearangeofinfluencesonhowmuchbusinesswill
investintheseareassuchasincome(Y),interestrates(r),Taxationonbusiness
(Tb),profitexpectations(PR)andCapacityUtilization(CU).
AD1
AD2
SAS
Y
PL
Y1Y2
PL1
PL2
Positives:r,CR,W,D
Negatives:Y,Yp,CC

MatthewPearce EconomicsReport
I=f(Y,r,Tb,PR,CU)(+)(-)(-)(+)(+)
Equation3:TheInvestmentFunction
The lack of consumer demand therefore has had a negative affect on business
income and investment. The significant decline in investment in the mining
sector(Figure6)hascompoundedthisissue(RBA2014)astheindustrymoves
into its production phase. The RBA has also looked to moderate business
spendingwithinthehousinginvestmentmarketbyreducingtheamountofnon-
residentialbuildingapprovals(Figure7)(Greber2014).Consequentlytherehas
beennegativetrendinbusinessinvestmentthroughout2014(Figure8).
Figure8:TotalBusinessInvestment(RBA2014)
To counter the slowing in investment in the housing and mining sectors, the
federalgovernmentandtheRBAwill looktoprovideincreasedincome(Y)and
credittobusinessthroughaplannedcompanytaxcutof1.5%in2015(Tb)and
making available cheap credit (r) for non-mining business investment (Figure
10).Thishas led to an increase inbusiness confidenceandprofit expectations
Figure6:MiningandNon-MiningInvestment(RBA2014)
Figure7:Non-ResidentialBuildingApprovals(RBA2014)
MatthewPearce EconomicsReport
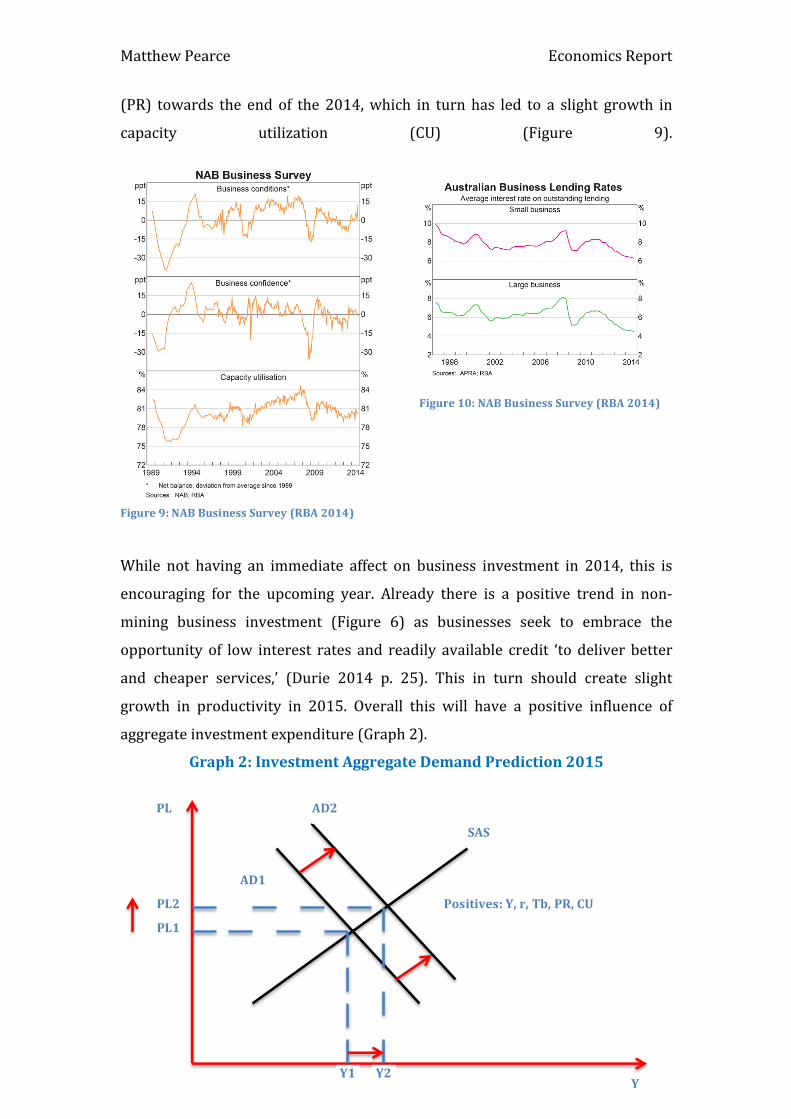
(PR) towards the end of the 2014,which in turn has led to a slight growth in
capacity utilization (CU) (Figure 9).
Figure10:NABBusinessSurvey(RBA2014)
While not having an immediate affect on business investment in 2014, this is
encouraging for the upcoming year. Already there is a positive trend in non-
mining business investment (Figure 6) as businesses seek to embrace the
opportunity of low interest rates and readily available credit ‘to deliver better
and cheaper services,’ (Durie 2014 p. 25). This in turn should create slight
growth in productivity in 2015. Overall this will have a positive influence of
aggregateinvestmentexpenditure(Graph2).
Graph2:InvestmentAggregateDemandPrediction2015
Figure9:NABBusinessSurvey(RBA2014)
AD2
AD1
SAS
Y
PL
Y2Y1
PL2
PL1
Positives:Y,r,Tb,PR,CU
MatthewPearce EconomicsReport
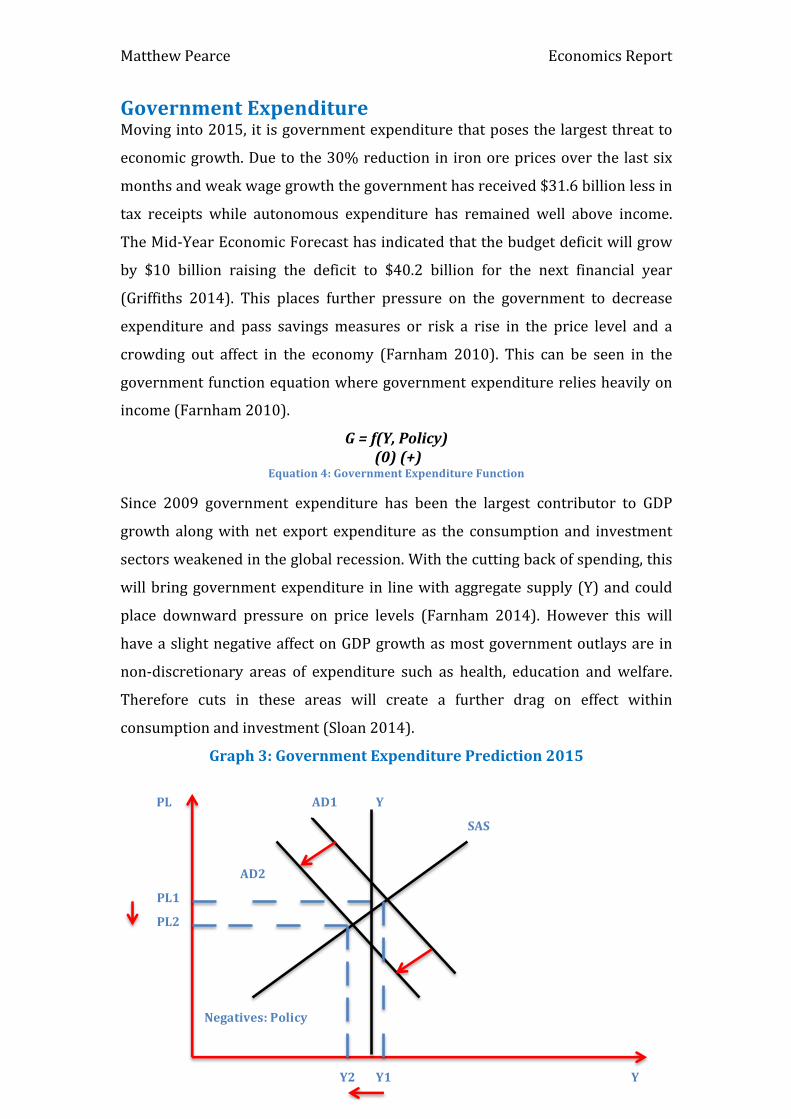
GovernmentExpenditureMovinginto2015,itisgovernmentexpenditurethatposesthelargestthreatto
economicgrowth.Duetothe30%reductionin ironorepricesoverthe lastsix
monthsandweakwagegrowththegovernmenthasreceived$31.6billionlessin
tax receipts while autonomous expenditure has remained well above income.
TheMid-YearEconomicForecasthasindicatedthatthebudgetdeficitwillgrow
by $10 billion raising the deficit to $40.2 billion for the next financial year
(Griffiths 2014). This places further pressure on the government to decrease
expenditure and pass savingsmeasures or risk a rise in the price level and a
crowding out affect in the economy (Farnham 2010). This can be seen in the
governmentfunctionequationwheregovernmentexpenditurereliesheavilyon
income(Farnham2010).
G=f(Y,Policy)(0)(+)
Equation4:GovernmentExpenditureFunction
Since 2009 government expenditure has been the largest contributor to GDP
growth alongwithnet export expenditure as the consumption and investment
sectorsweakenedintheglobalrecession.Withthecuttingbackofspending,this
willbringgovernmentexpenditure in linewithaggregatesupply(Y)andcould
place downward pressure on price levels (Farnham 2014). However this will
haveaslightnegativeaffectonGDPgrowthasmostgovernmentoutlaysare in
non-discretionary areas of expenditure such as health, education andwelfare.
Therefore cuts in these areas will create a further drag on effect within
consumptionandinvestment(Sloan2014).
Graph3:GovernmentExpenditurePrediction2015
AD1Y
AD2
SAS
Y
PL
Y1Y2
PL1
PL2
Negatives:Policy
MatthewPearce EconomicsReport
NetExportExpenditureThefallingpriceswithinthecommoditiesmarketplacesfurtherpressureonnet
export expenditure or termsof trade.Net export expenditure is the difference
between the costs of imports against export revenue (Equation 5). As such
overseas, income (GDP/Y*) and currency exchange (R) is a large factor in the
revenuereceivedfromexports(Farnham2010).
X=f(Y,Y*,R)(0)(+)(-)
Equation5:ExportExpenditure
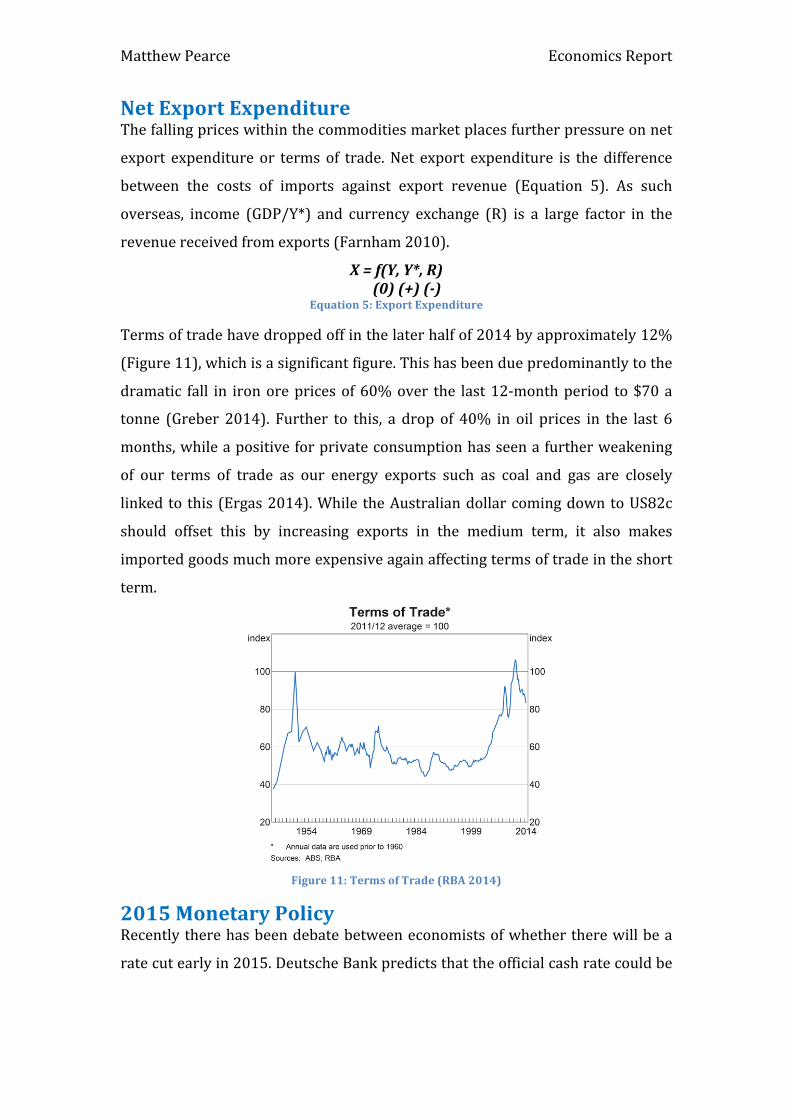
Termsoftradehavedroppedoffinthelaterhalfof2014byapproximately12%
(Figure11),whichisasignificantfigure.Thishasbeenduepredominantlytothe
dramatic fall in ironorepricesof60%over the last12-monthperiod to$70a
tonne (Greber 2014). Further to this, a drop of 40% in oil prices in the last 6
months,whileapositiveforprivateconsumptionhasseenafurtherweakening
of our terms of trade as our energy exports such as coal and gas are closely
linkedto this (Ergas2014).While theAustraliandollarcomingdowntoUS82c
should offset this by increasing exports in the medium term, it also makes
importedgoodsmuchmoreexpensiveagainaffectingtermsoftradeintheshort
term.
Figure11:TermsofTrade(RBA2014)
2015MonetaryPolicyRecentlytherehasbeendebatebetweeneconomistsofwhethertherewillbea
ratecutearlyin2015.DeutscheBankpredictsthattheofficialcashratecouldbe
MatthewPearce EconomicsReport
cut to 2% early in 2015 to curb the rising unemployment level and stagnant
householdincome(Greber2014).
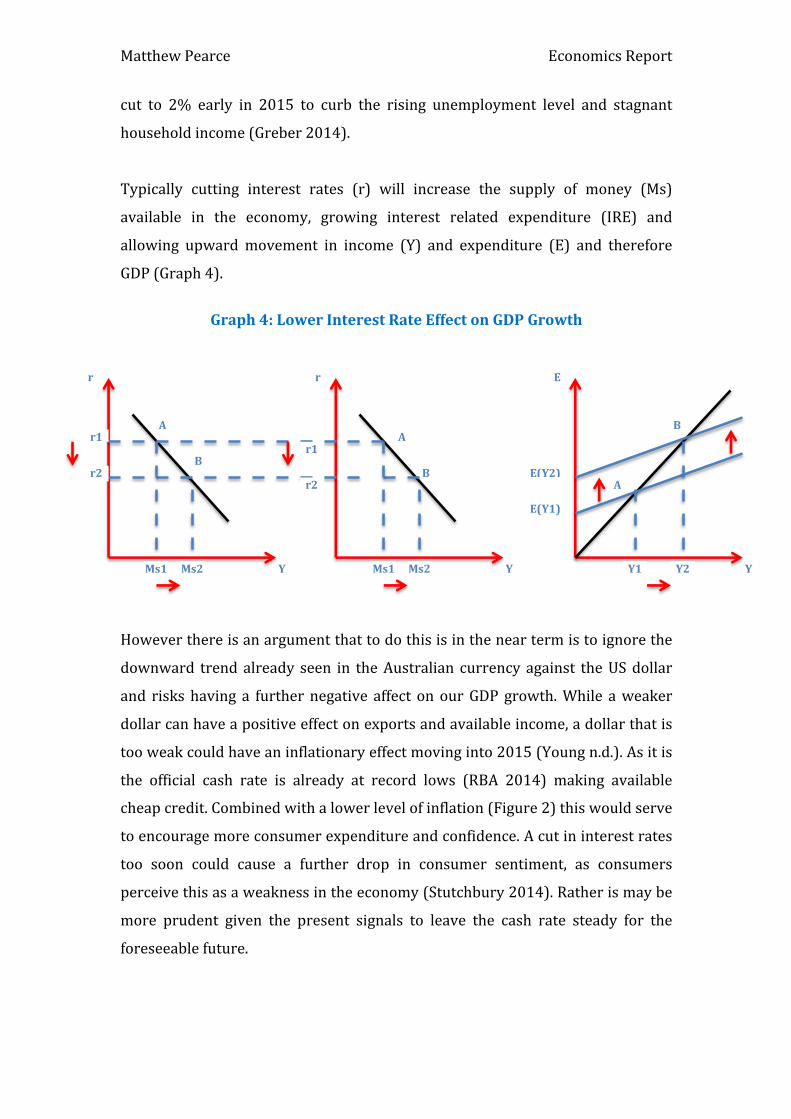
Typically cutting interest rates (r) will increase the supply of money (Ms)
available in the economy, growing interest related expenditure (IRE) and
allowing upwardmovement in income (Y) and expenditure (E) and therefore
GDP(Graph4).
Graph4:LowerInterestRateEffectonGDPGrowth
Howeverthereisanargumentthattodothisisintheneartermistoignorethe
downward trendalready seen in theAustralian currency against theUSdollar
and riskshaving a furthernegative affect onourGDPgrowth.While aweaker
dollarcanhaveapositiveeffectonexportsandavailableincome,adollarthatis
tooweakcouldhaveaninflationaryeffectmovinginto2015(Youngn.d.).Asitis
the official cash rate is already at record lows (RBA 2014) making available
cheapcredit.Combinedwithalowerlevelofinflation(Figure2)thiswouldserve
toencouragemoreconsumerexpenditureandconfidence.Acutininterestrates
too soon could cause a further drop in consumer sentiment, as consumers
perceivethisasaweaknessintheeconomy(Stutchbury2014).Ratherismaybe
more prudent given the present signals to leave the cash rate steady for the
foreseeablefuture.
r1
r2
r1
r2
Ms1 Ms2 Ms2Ms1 Y1 Y2
A
B
E(Y2)
E(Y1)
Y
Err
Y Y
AA
BB

MatthewPearce EconomicsReport
This argument is further supportedbyGlennStevens the governorof theRBA
who indicatedonDecember12th that therewouldn’tbeanear termcutas the
dollar is expected to fall to US75c independently. This reflects the downward
pressurethecontinuedgrowthoftheUSeconomyandtheweakeningofenergy
priceshasontheAustraliandollar(Stutchbury2014).Ratherfocusshouldbeon,
‘being more efficient and more productive, and using our labour and capital
resourcesinawaythatgetsmoreoutputperheadovertime,’(Stutchbury2014).
ConclusionOverallwhiletherearesomepositivesignsfor2015withinbusinessnon-mining
investment and a predicted increase in exports due to the lowering dollar.
However thiswillnotbeenough to counter theweaknesswithin consumption
demand and a cut to government expenditure. These two combinedwhile not
takingtheeconomyintorecessionwillkeepgrowthundertrend(Graph4).
Graph4:TotalAD/ASGraph
Whiletheconversationattheendof2014hasbeenaboutrepairing‘confidence’
in the economy, most economists agree that there should be a concerted
emphasisonbuildingcompetivenesswithinourstructuraleconomy.51of76top
Australian CEO’s when interviewed agreed that while the ‘economic base in
AD1
AD2
SAS
Y
PL
Y1Y2
PL1
PL2
LAS
Trend

MatthewPearce EconomicsReport
Australia is sound,’ (Durie 2014) there needs to be more focus on factors
affecting productivity within the economy such as tax reform, budget reform,
infrastructure investment, IR reform and federation reform. This can only be
achieved through government fiscal policy and therefore limits what effect
monetarypolicycanhave.