current world fertilizer trends to 2016
DESCRIPTION
FAO Report on World Fertilizer Market Outlook; published 2012.TRANSCRIPT

Current world fertilizer trends and outlook to 2016 FOOD AND AGRICULTURE ORGANIZATION OF THE UNITED NATIONS Rome, 2012

2
The designations employed and the presentation of material in this information product do not imply the expression of any opinion whatsoever on the part of the Food and Agriculture Organization of the United Nations (FAO) concerning the legal or development status of any country, territory, city or area or of its authorities, or concerning the delimitation of its frontiers or boundaries. The mention of specific companies or products of manufacturers, whether or not these have been patented, does not imply that these have been endorsed or recommended by FAO in preference to others of a similar nature that are not mentioned.

3
Contents Preface 6 Executive summary 7 The world fertilizer outlook 8
Background 8
Demand 12 Demand for fertilizer nutrients 12
Nitrogen 13 Phosphate 14 Potash 15 Total demand for primary nutrients 16
Supply 16 Nitrogen 17
Phosphate 18 Potash 19
Supply/demand balance 20 Nitrogen 21
Phosphate 21 Potash 21
The regional fertilizer situation 21 Africa 21 America 22 Asia 23 Europe 25 Oceania 26
Annexes
1. Explanatory notes on supply, demand and balance 29 2. World and regional nitrogen fertilizer demand forecast 30 3. World and regional phosphate fertilizer demand forecast 31 4. World and regional potash fertilizer demand forecast 32 5. World and regional nitrogen supply, demand and balance 33 6. World and regional phosphate supply, demand and balance 36 7. World and regional potash supply, demand and balance 40 8. Regional classification of countries and territories 43

4
List of tables
1. World Economic Outlook Projections 9
2. World production of major crops 10
3. Output and fertilizer input price indices 12
4. World demand for fertilizer nutrients, 2012-2016 13
5. World and regional growth in fertilizer demand, 2012-2016 13
6. World total demand for primary nutrients, 2012-2016 16
7. World supply of ammonia, phosphoric acid and potash, 2012-2016 17
8. World potential balance of nitrogen, phosphate and potash, 2012-2016 20
9. Africa fertilizer forecast, 2012-2016 22
10. America fertilizer forecast, 2012-2016 23
11. Asia fertilizer forecast, 2012-2016 24
12. Europe fertilizer forecast, 2012-2016 25
13. Oceania fertilizer forecast, 2012-2016 26
14. Regional and sub-regional potential balance of nitrogen, phosphate
and potash, 2012-2016 27

5
List of figures 1. Annual food price indices 11 2. Global nutrients (N+P2O5+K2O) consumption 12 3. Regional and sub-regional share of world increase
in nitrogen fertilizer consumption, 2012-2016 14
4. Regional and sub-regional share of world increase in phosphate fertilizer consumption, 2012-2016 15
5. Regional and sub-regional share of world increase in potash fertilizer consumption, 2012-2016 16
6. Regional and sub-regional share of world increase in ammonia supply, 2012-2016 17
7. Regional and sub-regional share of world increase in phosphoric acid supply, 2012-2016 19
8. Regional and sub-regional share of world increase in potash supply, 2012-2016 20
9. Regional nutrient balance in 2016 28

6
Preface This report presents the world nitrogen, phosphate and potassium fertilizer medium-term supply and demand projections for the period 2012-2016. The FAO/Fertilizer Organizations Working Group met in FAO, Rome in June 2012 to review the prospects for fertilizer demand and supply, and made the forecasts. The Working Group comprised: Fertilizers Europe FAI Fertiliser Association of India IFA International Fertilizer Industry Association IFDC International Center for Soil Fertility and Agricultural Development IMPHOS World Phosphate Institute K+S K+S KALI GmbH TFI The Fertilizer Institute FAO Food and Agriculture Organization of the United Nations Annex 1 presents explanatory notes on potential supply, demand and balance. Annexes 2, 3, and 4 present world and regional (listed in Annex 8) fertilizer demand forecasts for nitrogen, phosphate, and potash, respectively. Annexes 5, 6 and 7 present world and regional potential supply, demand and balance for the three primary nutrients. Name plate capacity, operating rates and demand for fertilizers vary from year to year. All references relating to fertilizers are in terms of three primary nutrients, viz., nitrogen (N), phosphate (P2O5) and potash (K2O). The fertilizer demand and supply data refer to the calendar year. FAO, in collaboration with experts from the Working Group dealing with fertilizer production, consumption and trade, annually provides five-year forecasts of world and regional fertilizer supply, demand and potential balance. The contributions made by the members of the Working Group are gratefully acknowledged. Preparation of the document by Mr. T. K. Chanda, Additional Director, The Fertiliser Association of India is sincerely acknowledged. Editing of the document by Dr. Christian Nolte, Senior Officer, FAO and collection of data and assistance in compilation by Ms. Christina Vella, Tomlin, FAO, Rome are gratefully acknowledged.

7
Executive summary The world economy has experienced financial turmoil followed by a slump in growth with intermittent recovery in the past four years. The global grain supply-demand balance in the 2012/13 marketing season may tighten significantly as a result of a anticipated fall in production of wheat and coarse cereals. World food prices may ease in 2012 after the peak level recorded in 2011. World fertilizer nutrient (N+P2O5+K2O) consumption is estimated to reach 180.1 million tonnes in 2012, up by 1.9 percent over 2011. World demand for total fertilizer nutrients is estimated to grow at 1.9 percent per annum from 2012 to 2016. The demand for nitrogen, phosphate, and potash is forecast to grow annually by 1.3, 2.0, and 3.7 percent, respectively, during the period. Over the next five years, the global capacity of fertilizer products, intermediates and raw materials will further increase. The global potential nitrogen balance (i.e., the difference between N available for fertilizers and N fertilizer demand) as a percentage of N fertilizer demand is expected to increase from 2 per cent in 2012 to 4-5 per cent in 2013 and 2014. Thereafter, it is expected to be around 8 per cent during the last two years of the forecast period, i.e, 2015 and 2016. The global potential balance of phosphate is expected to rise from 2.1 million tonnes in 2012 to 3.8 million tonnes in 2016 or from 5 per cent of total demand to 8 percent. The global potential balance of potassium is expected to rise significantly from 8 million tonnes in 2012 to 15.6 million tonnes in 2016 or from 25 per cent of total demand to 42 percent. The Africa region is likely to remain a major exporter of phosphate, followed by nitrogen, but would continue to depend solely on import of potash. North America would increasingly rely on nitrogen fertilizer import. Its phosphate export may come down slowly and the potash balance of the sub-region is expected to increase. Latin America & Caribbean is expected to become a potential supplier of nitrogen from 2015 while its dependence on import of phosphate and potash would continue during the forecast period. The dependence of East Asia on nitrogen import is expected to decline in 2015 and 2016 and the import of potash would grow significantly during the period. The sub-region would, however, continue to be a net exporter of phosphate during the period. West Asia has a surplus in all the three nutrients. It is a major contributor to the global nitrogen supply. The sub-region has a small surplus of phosphate for exports, which is expected to grow in the forecast period. South Asia would continue to remain deficit in all the three nutrients during the forecast period. The deficit balance in all the three nutrients is expected to rise during the forecast period. In Europe, the major contribution in the nitrogen, phosphate, and potash surplus is from East Europe & Central Asia. It has a large potential balance of nitrogen and potash. West Europe would continue to remain in surplus in potash and in deficit in nitrogen and phosphate. Central Europe would continue to be in deficit in phosphate and potash. The surplus balance of nitrogen in the sub-region will marginally decline. Oceania region would continue to be in deficit in all the three nutrients.

8
The world fertilizer outlook BACKGROUND The global economic growth and financial situation impacts various sectors, including agriculture. The world economy has experienced a financial turmoil followed by a slump in growth with intermittent recovery in the past four years. The world fertilizer outlook, therefore, needs to be viewed from the perspective of a reduced world economic growth. This report begins with a background of the world economic growth, followed by developments in agricultural production, input (fertilizer) output prices, and thereafter presents the details of regional and global supply, demand, and the potential balance of fertilizers in the coming years on a five year basis. According to the April 2012 World Economic Outlook report of the International Monetary Fund (IMF), the world economic activity suffered a major setback in 2011. The world output growth dropped from 5.3 per cent in 2010 to 3.9 per cent in 2011. Economic growth lost its momentum in the second half of 2011, caused by the euro crisis. A fall in business confidence and escalating financial stress were major factors in the contraction of the euro area economy. The real GDP in Japan was also affected due to weak demand and supply disruptions related to floods in Thailand. In the Middle East and North Africa, production and trade remained subdued due to social unrest and geo-political uncertainty. In emerging Asia and in Latin America, trade and production slowed due to cyclical factors, including policy tightening. In the United States, however, economic activity improved as consumption and inventory investment strengthened. In sub-Saharan Africa growth continued to sustain supported by favorable commodity prices. Some sign of recovery was noticed in global trade and production in the first quarter of 2012. Global growth increased to 3.6 percent during the period mainly due to temporary factors, including easing financial conditions and recovery in confidence in response to the European Central Bank’s longer-term refinancing operations. Unfortunately, developments during the second quarter of 2012 have been once again disappointing. There has been further escalation in financial market stress in the Euro area caused by increased political and financial uncertainty in Greece, banking sector problems in Spain, uncertainty about fiscal adjustment and reform and the extent of cooperation from partner countries. The momentum of growth has also slowed in various emerging market economies, mainly Brazil, China, and India. Many emerging market economies have also been hit by a drastic fall in investment due to uncertainty in the market. The July 2012 World Economic Outlook. The report indicates that global growth is projected to moderate to 3.5 percent in 2012 and to 3.9 percent in 2013. Growth in advanced economies is projected to increase by 1.4 percent in 2012 and 1.9 percent in 2013. Growth in emerging and developing economies may be around 5.6 percent in 2012 before picking up to 5.9 percent in 2013. Growth in the Euro area may fall by 0.3 per cent in 2012 before recovering to 0.7 per cent in 2013. Growth is projected to remain relatively weaker than in 2011 in regions connected more closely with the euro area, particularly, Central and Eastern Europe. However, the USA may maintain a growth of 2 per cent in 2012 and 2.3 per cent in 2013. Against the broad trends, growth in the Middle East and North Africa will be higher in 2012 compared to last year. Similarly, growth in sub-Saharan Africa is expected to remain strong in 2012–13, supported by the

9
region’s relative insulation from external financial shocks. Table 1 shows the world economic outlook projections in 2012 and 2013 compared to 2010 and 2011. Table 1 World Economic Outlook Projections (Percentage change) 2010 2011 2012 2013 World Output 5.3 3.9 3.5 3.9 Advanced Economies 3.2 1.6 1.4 1.9 United States 3.0 1.7 2.0 2.3 Euro Area 1.9 1.5 –0.3 0.7 Japan 4.4 –0.7 2.4 1.5 United Kingdom 2.1 0.7 0.2 1.4 Canada 3.2 2.4 2.1 2.2 Other Advanced Economies 1
5.8 3.2 2.4 3.4
Emerging and Developing Economies
7.5 6.2 5.6 5.9
Central and Eastern Europe 4.5 5.3 1.9 2.8 Commonwealth of Independent States
4.8 4.9 4.1 4.1
Developing Asia 9.7 7.8 7.1 7.5 China 10.4 9.2 8.0 8.5 India 10.8 7.1 6.1 6.5 ASEAN-5 2 7.0 4.5 5.4 6.1 Latin America and the Caribbean
6.2 4.5 3.4 4.2
Brazil 7.5 2.7 2.5 4.6 Mexico 5.6 3.9 3.9 3.6 Middle East & North Africa 5.0 3.5 5.5 3.7 Sub-Saharan Africa 5.3 5.2 5.4 5.3 South Africa 2.9 3.1 2.6 3.3 1 = Excludes the G7 and Euro area countries. 2 = Indonesia, Malaysia, Philippines, Thailand and Vietnam. Source: World Economic Outlook Update, July 16 2012, International Monetary Fund. According to IMF, global consumer price inflation is projected to ease in 2012 as demand is expected to soften and commodity prices may recede. Overall, headline inflation is expected to slip from 4.5 percent in the last quarter of 2011 to 3 to 3.5 percent in 2012–13. Agricultural outlook The World Food Situation, released by the FAO in early September 2012 forecasts a significant tightening of the global grain supply-demand balance in the 2012/13 marketing season. The world cereal production in 2012 is estimated to touch 2 295 million tonnes, down by 52 million tonnes, or 2.2 percent, from the record production in 2011. This is mainly due to declining prospects in maize production in the United States because of severe drought.

10
Global wheat production is anticipated to reach 663 million tonnes in 2012, down by 36 million tonnes (5 percent) compared to 2011. Most of the decline in wheat production is on account of the effect of drought on yields and production in CIS. Wheat output in the Russian Federation is forecast to decline by 29 percent over 2011. Production also appears to fall sharply in Kazakhstan and Ukraine, by 47 and 37 percent, respectively. In contrast, a number of other major producing countries may harvest more wheat. In the United States, wheat production is to increase by 13.5 percent to an above-average level of 61.7 million tonnes. In Canada, wheat output is expected to be above-average and 6 percent higher than in 2011. The wheat harvest in India may reach almost 94 million tonnes (8 percent above the previous year’s record). Likewise, in China, the wheat output may reach a new high of 118 million tonnes. In the EU, the latest projections indicate a small reduction from 2011. World production of coarse grains (i.e. maize, barley, sorghum, millet, rye and oats) is projected at 1 148 million tonnes in 2012, down 17 million tonnes (or 1.5 percent) from 2011. The anticipated fall is mainly attributed to a lower maize crop production, which is expected to decline to 864 million tonnes in 2012, 20 million tonnes less than in 2011. The maize crop in the United States may fall to 274 million tonnes, down 40 million tonnes (13 percent) vis-à-vis 2011. The global rice production is estimated at 483.3 million tonnes (milled basis) in 2012, up marginally (0.2 percent) from the 2011 level. The forecast has been revised from the earlier estimates of FAO. The revision is due to a reported deterioration in crop prospects in a number of Asian countries, mostly as a result of unfavourable climatic conditions. This has been particularly the case in India, where late and weak monsoon rains in June and July constrained the main Kharif crop plantings, leading to a 6 percent decline in this year’s production, to 98.5 million tonnes. Current prospects similarly point to less crop production in Cambodia, the Republic of Korea, the DPR Korea and Nepal although, on aggregate, the region is still expected to end the season with favourable results, largely due to the expectation of higher production in China (Mainland), Indonesia and Thailand. Table 2 presents the world production of major crops in recent years and forecast for 2012/13. Table 2 World production of major crops (million tonnes) 2009/10 2010/11 2011/12
(est.) 2012/13
(forecast)
Wheat 685.7 655.6 699.1 663.3Coarse grain 1 125.4 1 135.5 1 165.7 1 148.3Rice 455.1 468.3 482.3 483.3Total cereals 2 266.2 2 259.4 2 347.0 2 294.8Sugar 156.7 165.1 172.8 Oil seeds 456.7 468.0 450.9 Source: Various issues of Food Outlook, FAO, Rome

11
Input and output prices The Food Price Index of the Food and Agriculture Organization of the United Nations (FAO) showed a strong upward movement touching an all-time record of 228 points in 2011 and surpassing the earlier peak value of 200 in 2008. The index of cereals touched 247, diary 221, meat 177, oils & fats 252 and sugar 369 in 2011. The food price index started coming down from last quarter of 2011. The average food price index came down to 211 in the first half of 2012. The average index of cereals has come down to 224, of dairy to 190, of meat to 176, of oils & fat to 237 and of sugar to 321. Fig.1 shows the movement in annual food price indices from 2001 to the first half of 2012.
Besides this hike in food prices, energy prices also moved upward in 2011 as a result of higher demand outpacing supply. The average Brent crude price increased to US$ 111.26 per barrel in 2011, an increase of 40% over 2010. During the first half of 2012, the average price of Brent crude moved up further to US$ 113 per barrel with a peak price of US$ 125.44 per barrel in March 2012 and a low of US$ 95.16 per barrel in June 2012. The crude prices started moving up as of July 2012 and it crossed a little over US$ 113 per barrel in August/September 2012. High energy prices impact various cost segments, including fertilizer. The prices of fertilizer marked a significant increase in 2011. For instance, the index (2002-04 =100) of FOB prices for DAP increased from 264 in 2010 to 337 in 2011. Similar is the situation in respect to other fertilizers. In the first half of 2012, urea and MOP price indices increased further, whereas the price of DAP declined to a certain extent. Under the situation of high food prices, and high prices of fertilizers, a mixed scenario emerges. High agricultural commodity prices provide incentives for farmers in market-oriented economies to invest in fertilizers and other inputs for higher productivity. However, it is a disincentive for farmers to purchase fertilizers, particularly i P&K, having smallholdings and with the bulk of food production meant for family consumption. Table 3 shows output and fertilizer input price indices from 2008 to the first half of 2012.
93.3
89.9
97.7
112.4 117.3126.5
158.6
199.6
156.8
185.1
228
210.5
0
50
100
150
200
250
2001 2002 2003 2004 2005 2006 2007 2008 2009 2010 2011 2012*
Fig.1: Annual Food Price Indices(2002-2004 = 100)
* = Jan/June Source: FAO Food Price Index

Table 3 Output and fertilizer input price indices (2002-2004 =100) 2008 2009 2010 2011 2012
(January- June)
Output price index1 Cereals 238 174 183 247 224 Dairy 220 142 200 221 190 Meat 153 133 152 177 176 Oils & Fats 227 151 194 252 237 Sugar 182 257 302 369 321 Food 200 157 185 228 211 Fertilizer input price index2 Urea 362 184 208 308 310 DAP 537 176 264 337 291 MOP 573 542 296 388 408 Source: 1 World Food Situation: Food Prices Index, FAO, Rome, (http://www.fao.org/worldfoodsituation/FoodPricesIndex/en/) 2 Calculated from average FOB prices quoted in various Fertilizer Trade Journals. DEMAND Demand for fertilizer nutrients In light of the above background and keeping in view the factors which influence and likely impact in future, the demand for fertilizer nutrients have been projected for the coming five years. Total fertilizer nutrient (N+P2O5+K2O) consumption is estimated at 176.8 million tonnes in 2011 and is forecast to reach 180.1 million tonnes in 2012. With a successive growth of 1.9 percent per year, it is expected to reach 194.1 million tonnes by the end of 2016. Fig. 2 indicates the forecasts of world demand for total fertilizer nutrients from 2012 to 2016 against the actual consumption in the preceding four years.
150
160
170
180
190
200
2008 2009 2010 2011 2012 2013 2014 2015 2016
Mill
ion
MT
Fig 2: Global nutrients (N+P2O5+K2O) consumption

13
The forecasts of demand for three main plant nutrients in specific regions and the world for 2012 to 2016 are presented in Annexes 2, 3 and 4. The global demand for fertilizer nutrients are summarized in Table4. Table 4 World demand for fertilizer nutrients, 2012-2016 (thousand tonnes)
Year 2012 2013 2014 2015 2016 Nitrogen (N) 109 928 111 558 113 063 114 504 115 956Phosphate (P2O5) 41 525 42 731 43 487 44 251 45 013 Potash (K2O) 28 626 29 494 30 879 32 208 33 163 Total (N+ P2O5+K2O) 180 079 183 782 187 429 190 963 194 132
In 2012, the world demand for nitrogen, phosphate and potash is forecast to grow by 1.6, 2.4 and 2.0 percent, respectively, over the previous year. The world and regional annual growth rate in fertilizer demand between 2012 and 2016 is given in Table 5. The world demand for nitrogen, phosphate and potash is forecast to grow annually by 1.3, 2.0 and 3.7 percent, respectively, between 2012 and 2016. Table 5 World and regional growth in fertilizer demand, 2012 to 2016 Region Annual growth rate (Compound)
N P2O5 K2O Total (N+P2O5+K2O)
World 1.3% 2.0% 3.7% 1.9% Africa 2.6% 2.9% 3.3% 2.7% North Africa 2.3% 1.7% 1.2% 2.1% Sub-Saharan Africa 2.9% 3.7% 4.2% 3.3% America 1.3% 1.9% 1.9% 1.6% North America 0.6% 0.6% 0.6% 0.6% Latin America & Caribbean 2.7% 3.0% 2.9% 2.9% Asia 1.3% 2.0% 5.8% 2.0% West Asia 1.8% 3.3% 3.9% 2.3% South Asia 2.6% 3.0% 10.3% 3.5% East Asia 0.6% 1.2% 4.2% 1.2% Europe 1.3% 2.5% 2.0% 1.6% Central Europe 1.5% 2.4% 2.4% 1.8% West Europe -0.2% 1.2% 1.0% 0.3% East Europe & Central Asia 3.7% 4.3% 3.3% 3.8% Oceania 1.3% 2.0% 1.4% 1.6%
Nitrogen (N) The world nitrogen fertilizer demand increased from 108.2 million tonnes in 2011 to 109.9 million tonnes in 2012, at a growth rate of 1.6 per cent. It is expected to be around 116.0 million tonnes in 2016 at the annual growth of 1.3 percent. Of the overall increase in demand for 6 million tonnes nitrogen between 2012 and 2016, 60 percent would be in

Asia, 19 percent in America, 13 percent in Europe, 7 percent in Africa and 1 percent in Oceania. Among the Asian countries, the bulk of the increase of world demand for nitrogen is expected in India (30 percent) and China (7 percent), followed by Pakistan (6 percent), Indonesia (5 percent), Bangladesh (3 per cent), Vietnam (2 per cent) and Malaysia (1 per cent). In America, the major share of increase is expected in Latin America (14 percent), mainly in Brazil, Argentina, Colombia and Mexico. In North America the share of increase is expected to be around 5 per cent, contributed largely by USA and Canada. In Europe, major share of increase is expected in East Europe & Central Asia (11 per cent), mainly in Russia (5 per cent) and Ukraine (4 per cent). This is expected to be followed by Central Europe (3 percent). In West Europe, there may be a nominal decline in consumption during the period. The share of increase in North Africa is expected to be around 3 per cent, mainly in Egypt and Morocco. The share of increase in Sub-Saharan Africa is expected to be around 4 per cent, mainly in Nigeria, Kenya, Ethiopia, Malawi and South Africa. The share of increase in Oceania is expected to be around 1 per cent. Figure 3 shows the regional and sub-regional share of world increase in nitrogen consumption between 2012 and 2016.
Phosphate (P2O5) Phosphate fertilizer consumption/demand include H3PO4 (phosphoric acid) based fertilizer demand + non-H3PO4 fertilizer demand. The non-H3PO4 fertilizer demand includes P2O5 in single super phosphate, rock phosphate, etc. The world phosphate fertilizer demand increased from 40.6 million tonnes in 2011 to 41.5 million tonnes in 2012, at a growth rate of 2.4 per cent. It is expected to touch 45.0 million tonnes in 2016 at a growth rate of 2.0 percent per year. Of the overall increase in demand for 3.5 million tonnes P2O5 between 2012 and 2016, 58 percent would be in Asia, 24 percent in America, 11 per cent in Europe, 4 percent in Africa and 3 per cent in Oceania.
North Africa, 2.9%
Sub-Saharan Africa, 3.6% North America, 5.4%
Latin America & Caribbean, 14.0%
West Asia, 3.9%
South Asia, 39.8%
East Asia, 16.1%
Central Europe, 2.9%
West Europe, -0.8%
East Europe & Central Asia, 11.1%
Oceania, 1.3%
Fig 3: Regional and sub-regional share of world increase in nitrogen fertilizer consumption, 2012-2016

Among the Asian countries, about 25 percent of the growth in world demand of phosphate is expected in India, 14 percent in China, 4 percent in Pakistan, and 3 per cent in both, Indonesia and Bangladesh. West Asia accounts for 5 per cent of the increase in consumption, of which Turkey, Iran and Syria have the bulk of the share. Among the major countries in America, 14 percent of the growth in world demand is projected to be in Brazil, 3 per cent in Argentina and 2 percent in USA. The share of East Europe & Central Asia is expected to be 7 per cent, of which Russia accounts for a share of 4 per cent and Ukraine around 2 per cent. West Europe accounts for a share of 3 per cent and Central Europe 2 per cent of the world increase in consumption. The share of increase in Oceania is expected to be 3 per cent. In Sub-Saharan Africa, the increase is likely to be 3 per cent and in North Africa, it is expected to be around 0.9 per cent. Fig. 4 shows regional and sub-regional shares of world increase in phosphate consumption between 2012 and 2016.
Potash (K2O) Potassium fertilizer demand is estimated to increase from 28.1 million tonnes in 2011 to 28.6 million tonnes in 2012, indicating an increase of 2.0 percent. The world potash fertilizer demand is expected to be 33.2 million tonnes in 2016 with an annual per annum growth of 3.7 per cent over 2012. Of the overall increase in demand for 4.5 million tonnes potash between 2012 and 2016, 72 percent would be in Asia, 18 percent in America, 8 percent in Europe, 2 percent in Africa and 0.4 percent in Oceania. Among the Asian countries, about 32 percent of the growth in world demand for potash is expected in India, 25 percent in China, 5 per cent in Indonesia, 3 per cent in Thailand, 2 per cent in Vietnam, 1 per cent in Malaysia and the balance in the rest of Asia. In America, the major share of the growth of about 11 percent is projected to be in Brazil and 2 percent in USA. In Europe, about 5 per cent of the growth in world demand for potash is expected in East Europe & Central Asia (of which Russia 2 per cent, Ukraine & Belarus 1 per cent each). This is followed by 2 per cent in Central Europe and West
North Africa, 0.9%
Sub-Saharan Africa, 2.9%
North America, 3.0%
Latin America & Caribbean, 21.1%
West Asia, 4.7%
South Asia, 32.7%
East Asia, 20.3%
Central Europe, 2.0%
West Europe, 2.5%
East Europe & Central Asia, 6.9%
Oceania, 3.0%
Fig 4: Regional and sub-regional share of world increase in phosphate fertilizer consumption, 2012-2016

Europe each. Figure 5 shows regional and sub-regional shares of world increase in potash consumption during 2012 to 2016.
Total demand for primary nutrients The details of demand for primary nutrients for use as fertilizer have been discussed in the previous section. There is also some use of primary nutrients in industry. In addition, nitrogen and phosphate are reported to be used as feed for cattle, poultry, and fish. Table 6 shows the global total demand (fertilizer + non-fertilizer) for primary nutrients for 2012 to 2016. Table 6 World total demand for primary nutrients, 2012-2016 (thousand tonnes) Year 2012 2013 2014 2015 2016 1.Nitrogen (N) 137 726 140 340 142 882 145 035 147 131 2.Phosphate (P2O5)
a 47 376 48 901 49 831 50 715 51 547 3.Phosphate (P2O5)
b 41 525 42 731 43 487 44 251 45 013 4.Potash (K2O) 32 210 33 210 34 709 36 149 37 221 5.Total (N+ P2O5+K2O) (1+2+4)
217 312 222 451 227 422 231 899 235 899
a = Total P2O5 demand (H3PO4 based fertilizer + non-fertilizer, and non-H3PO4
fertilizer). b = Total H3PO4 demand (fertilizer + non-fertilizer) expressed as P2O5. Since, the major share of phosphate fertilizer is based on phosphoric acid (H3PO4), and its supply and demand is of commercial importance, the following sections on supply and supply/demand balance are based on H3PO4 (i.e., excluding non- H3PO4 source). SUPPLY The global total nutrient capacity (N+P2O5+K2O) was 256 million tonnes in 2011, out of which the total supply was 219 million tonnes. During 2012, the total capacity is
North Africa, 0.2% Sub-Saharan
Africa, 1.5%
North America, 2.5%
Latin America & Caribbean, 15.5%
West Asia, 0.9%
South Asia, 33.7%
East Asia, 37.3%
Central Europe, 1.5%
West Europe, 2.0%
East Europe & Central Asia,
4.5%Oceania, 0.4%
Fig. 5: Regional and sub-regional share of world increase in potash fertilizer consumption, 2012-2016

expected to increase by 4.9 per cent and supply would grow by 2.8 per cent. Over the next five years, global capacity and production of fertilizers would increase further. Table 7 shows world supply of ammonia, phosphoric acid and potash during 2012 to 2016. Region and sub-region wise detail information is given in Annex 5, 6 and 7. Table 7 World supply of ammonia, phosphoric acid and potash, 2012-2016 (thousand tonnes) Year 2012 2013 2014 2015 2016 Ammonia (as N) 140 760 146 400 149 729 156 307 158 463 Phosphoric acid (as P2O5)
44 312 45 857 47 392 48 776 49 835
Potash (as K2O) 40 196 43 467 45 682 48 561 52 817 Nitrogen (N) The world ammonia capacity was 161.3 million tonnes (as N) in 2011. With the expected addition in capacity of about 7.7 million tonnes, the total ammonia capacity is likely to be 169.0 million tonnes (as N) in 2012. With successive additions in capacity each year, total ammonia capacity is expected to rise to 182.2 million tonnes (as N) in 2015 and marginally reduce to 181.5 million tonnes in 2016. The main additions to capacity would occur in East Asia, South Asia, Africa, West Asia and Latin America. Of the total increase of 12.5 million tonnes from 2012 to 2016, nearly 18 percent is expected to be added in East Asia, 13 per cent in East Asia and 11 per cent in South Asia. About 23 percent of the increase in world ammonia capacity is expected in Africa, 9 per cent in Latin America & Caribbean, 21 per cent in East Europe and Central Asia, 3 per cent in North America and 2 per cent in Central Europe. No increase in ammonia capacity is expected in West Europe and Oceania. After taking into account operating rates, world supply of ammonia (as N) is estimated at 137.7 million tonnes in 2011 which would rise to 140.8 million tonnes in 2012. From 2012 to 2016, there would be a total addition in supply of 17.7 million tonnes. The total supply of ammonia (as N) would thereby rise to 158.5 million tonnes in 2016 (Table 7). Fig.6 shows the percentage contribution of various regions and sub-regions to the total increase in ammonia (as N) supply between 2012 and 2016.
Africa, 18.1%
North America, 3.7%
Latin America & Caribbean,
12.0%West Asia,
10.7%South Asia,
6.9%
East Asia, 32.9%
Central Europe, 1.5%
West Europe, 0%
East Europe & Central Asia,
13.8%Oceania, 0.5%
Fig 6: Regional and sub-regional share of world increase in ammonia (as N) supply, 2012-2016

18
According to the International Fertilizer Industry Association (IFA), Paris, there are delays in commissioning of several urea plants announced earlier. About 50 million tonnes of urea (product) capacity is expected to be added through large plants and 4 million tonnes will be contributed by expansion and revamp. Capacity changes are expected in some of the consuming countries, such as, Brazil and Vietnam. The additions in capacities proposed in India would depend upon announcement of investment policy and assurance of supply of feedstock (gas). The capacity changes in exporting countries include mainly Algeria, China, Indonesia, Qatar, Saudi Arabia and Venezuela. The bulk of the additions in world capacity of urea is expected in the above mentioned countries. Phosphate (P2O5) World phosphoric acid (as P2O5) capacity was about 51.5 million tonnes in 2011. A modest increase of 1.8 million tonnes is expected in 2012 with the total rising to 53.3 million tonnes. By 2016, it is expected to rise to 61.3 million tonnes. Of the total 8 million tonnes addition in world capacity between 2012 and 2016, 45 percent addition would take place in Asia, mainly in East Asia and West Asia About 35 percent capacity would be added in Africa, 13 percent in Latin America & Caribbean, 6 per cent in East Europe & Central Asia and 1 per cent in Oceania. No addition in capacity is expected in Central Europe, West Europe and in North America. According to IFA, between 2011 and 2016, close to 40 new acid units are planned for completion, of which 17 would be located in China. Outside China, the main projects that would mean a large increase in phosphoric acid capacity are in Morocco, Brazil, Jordan, Tunisia, Indonesia, Algeria and possibly in India. After taking into account operating rates, world supply of phosphoric acid (as P2O5) is estimated at 42.6 million tonnes in 2011, which is estimated to rise to 44.3 million tonnes in 2012. A modest increase is expected annually, and by 2016, the total supply will be 49.8 million tonnes (Table 7). Fig.7 shows the percentage contribution of various regions and sub-regions to the total increase in phosphoric acid (as P2O5) supply between 2012 and 2016.

According to IFA’s 2012 world capacity survey, over the next five years, close to 35 new units of MAP, DAP and TSP are planned to come on stream in ten countries between 2011 and 2016. China will account for half of these plants. Morocco and Brazil plan to add 6 new plants each. Five other plants are under construction or planned for completion before 2016. Potash (K2O) World potash capacity was estimated at 43.3 million tonnes (as K2O) in 2011. An increase of 2.9 million tonnes is expected in 2012 with the total rising to 46.2 million tonnes. By 2016, the total capacity is likely to be 61.4 million tonnes. Of the total increase in capacity of 15.2 million tonnes potash between 2012 and 2016, 48 percent would be in North America, 13 percent in Latin America & Caribbean, 32 percent in East Europe & Central Asia and 7 per cent in East Asia. According to IFA, between 2011 and 2016, about 68 per cent of additional capacity is expected to come from brown field projects in Canada, Russia and Belarus besides Chile and China. The remaining 32 per cent of capacity are expected in green field projects in Argentina, Canada and Russia. The bulk of new potash capacity will be in the form of MOP. After considering operating rates, world supply of potash (as K2O) is estimated at 38.8 million tonnes in 2011, which would rise to 40.2 million tonnes in 2012. A good increase is expected annually from 2012 and by 2016, the total supply may touch 52.8 million tonnes (Table 7). Fig.8 shows the percentage contribution of various regions and sub-regions to the total increase in potash supply between 2012 and 2016.
Africa, 48.3%
North America, 0%Latin America & Caribbean, 11.0%
West Asia, 15.1%
South Asia, 2.3%
East Asia, 22.5%
Central Europe, 0%
West Europe, 0%East Europe & Central Asia,
0.7%
Oceania, 0%
Fig 7: Regional and sub-regional share of world increase in phosphoric acid (as P2O5) supply, 2012-2016

SUPPLY / DEMAND BALANCE Table 8 presents the world potential balance of nitrogen, phosphate (H3PO4 based P2O5), and potash (K2O) for 2012 to 2016. The potential balance is derived from maximum availability (supply) over the projected total demand as shown below. (i) Potential balance = supply–non-fertilizer demand–fertilizer demand. (ii) Supply of each nutrient is referred as under: N = N through ammonia, P2O5 = P2O5 through phosphoric acid, and K2O = K2O through potash. Unforeseen factors, such as, feedstock/raw material limitations, logistic problems, unscheduled shut down due to technical reasons, natural calamities (earth quake, mine flooding, etc.) are not considered in the balance. Consumption/demand projections are based on agronomic considerations (e.g. cropped area and application rate of fertilizer), market feed back, estimates by industry associations, growth models; econometric models, expert advice, etc. Table 8 indicates the world potential balance of nitrogen, phosphate, and potash for 2012 to 2016. Table 8 World potential balance of nitrogen, phosphate and potash, 2012-2016 (thousand tonnes) Year 2012 2013 2014 2015 2016 Nitrogen (N) 3 034
(2.2) 6 061 (4.3)
6 847 (4.8)
11 272 (7.8)
11 332 (7.7)
Phosphate as P2O5 (H3PO4 based)
2 088 (5.0)
2 277 (5.3)
2 988 (6.9)
3 598 (8.1)
3 781 (8.4)
Potash (K2O) 7 986 (24.8)
10 258 (30.9)
10 973 (31.6)
12 411 (34.3)
15 596 (41.9)
( ) = Potential balance as % of projected total demand (fertilizer + non-fertilizer).
Africa, 0%North America,
56.0%
Latin America & Caribbean, 8.1%
West Asia, 0.6%
South Asia, 0%
East Asia, 8.9%
Central Europe, 0%
West Europe, -0.6%
East Europe & Central Asia,
27.0%
Oceania, 0%
Fig 8: Regional and sub-regional share of world increase in potash (as K2O) supply, 2012-2016

21
Nitrogen (N) The world nitrogen supply is expected to increase by 3 percent annually between 2012 and 2016, whereas demand is projected to increase by 1.3 percent in the same period. The potential balance of nitrogen is expected to be 3.0 million tonnes in 2012 as against 2.7 million tonnes in the previous year. There would be an addition in the potential balance by about 3 million tonnes in 2013 with a small increase in 2014. A sweeping increase over 4 million tonnes is expected in 2015, followed by a small increase in 2016. The total potential balance would be around 11.3 million tonnes by the end of 2016. The potential nitrogen balance as a percentage of global total demand is expected to increase from 2 per cent in 2012 to 4-5 per cent in 2013 and 2014. Thereafter, it is expected to be around 8 per cent during the last two years of the forecast period, i.e, 2015 and 2016 (Table 8). Any shortfall in supply due to slippage in commissioning in some of the projects or surge in demand could well be absorbed from the potential balance. Phosphate (P2O5) The world phosphate (H3PO4 based P2O5) supply is expected to increase by 3 percent per annum between 2012 and 2016, whereas demand is projected to increase by 2 percent in the same period. The potential balance of phosphate is expected to rise from 2.1 million tonnes in 2012 to 3.8 million tonnes in 2016. The ratio of potential phosphate balance (H3PO4 based) to global phosphate demand (H3PO4 based P2O5) is likely to grow from about 5 per cent in 2012 and 2013 to 7 to 8 per cent during the remaining period of the forecast period (Table 8). Potash (K2O) The world potash balance was 7.2 million tonnes in 2011, which increased to 8 million tonnes in 2012. The demand for potash is projected to increase by 3.8 percent between 2012 and 2016. The world potash supply is expected to increase by 7.1 percent during the same period. The potential balance is expected to rise significantly from 8 million tonnes in 2012 to 15.6 million tonnes in 2016. The potential potash (K2O) balance as a percentage of global total demand is expected to rise from 25 percent in 2012 to a high level of 42 percent in 2016 (Table 8). THE REGIONAL FERTILIZER SITUATION Africa Africa accounted for about 2.9 percent of world fertilizer consumption in 2011. Its share in world consumption of nitrogen is 3.3 percent, phosphate 2.6 percent and potash 1.8 percent. The growth rate in demand for nitrogen, phosphate, and potash for fertilizer is expected to be 2.6, 2.9, and 3.3 percent, respectively, between 2012 and 2016. The fertilizer nutrient supply/demand balance indicates that the region would remain a major exporter of phosphate, followed by nitrogen. For potash, the region would continue to depend solely on import. Table 9 indicates fertilizer forecast for Africa for 2012 to 2016.

22
Table 9 Africa fertilizer forecast, 2012-2016 (thousand tonnes) 2012 2013 2014 2015 2016 N Supply 5 673 7 368 7 970 8 771 8 871 Total demand 4 216 4 334 4 443 4 551 4 654 Fertilizer demand 3 630 3 729 3 827 3 924 4 019 Potential balance 1 457 3 034 3 527 4 220 4 217 P2O5 based on H3PO4
Supply 6 758 7 425 8 295 9 009 9 426 Total demand 1 426 1 536 1 581 1 612 1 644 Fertilizer demand 968 994 1 024 1 054 1 085 Potential balance 5 332 5 889 6 714 7 397 7 782 K2O Supply 0 0 0 0 0 Total demand 609 626 643 666 693 Fertilizer demand 530 545 559 580 605 Potential balance -609 -626 -643 -666 -693
North Africa The share of North Africa in world consumption of nitrogen is 1.7 percent, phosphate 1 percent and potash 0.5 percent. The growth rate in demand for nitrogen, phosphate and potash for fertilizer is expected to be 2.3, 1.7 and 1.2 percent, respectively, between 2012 and 2016. Egypt and Morocco have a major share in consumption in North Africa. Sub-Saharan Africa The share of Sub-Saharan Africa in world consumption of nitrogen is 1.6 percent, phosphate 1.6 percent and potash 1.3 percent. The growth rate in demand for nitrogen, phosphate and potash for fertilizer is expected to be 2.9, 3.7 and 4.2 percent, respectively, between 2012 and 2016. South Africa, Nigeria, Kenya, Ethiopia and Malawai are the major users of fertilizers in Sub-Saharan Africa. America Total fertilizer nutrient consumption in America is 23.7 per cent, of which North America constitutes 13.2 percent and Latin America & Caribbean 10.5 percent. The share of America in world consumption of nitrogen is 19.6 percent, phosphate 25.5 percent and potash 36.9 percent. The region would continue to remain in potash surplus, but in nitrogen and phosphate deficit during the forecast period. Table 10 presents fertilizer forecast for the America region for 2012 to 2016.
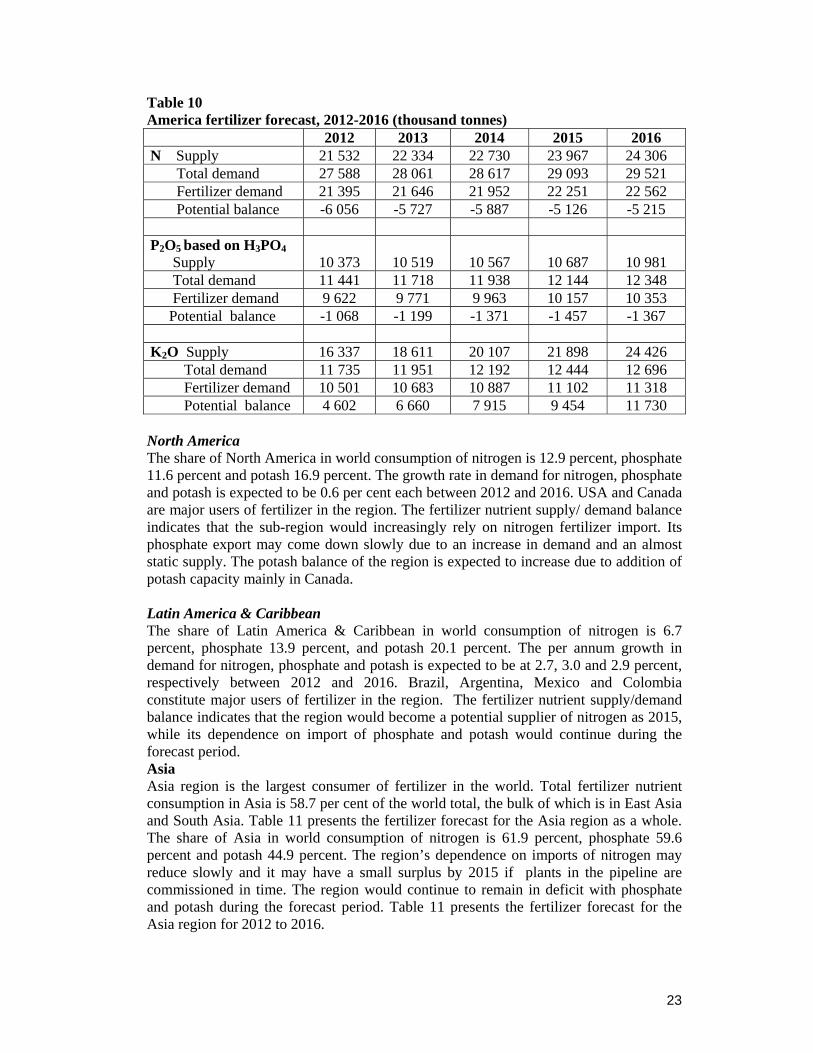
23
Table 10 America fertilizer forecast, 2012-2016 (thousand tonnes) 2012 2013 2014 2015 2016 N Supply 21 532 22 334 22 730 23 967 24 306 Total demand 27 588 28 061 28 617 29 093 29 521 Fertilizer demand 21 395 21 646 21 952 22 251 22 562 Potential balance -6 056 -5 727 -5 887 -5 126 -5 215 P2O5 based on H3PO4
Supply 10 373 10 519 10 567 10 687 10 981 Total demand 11 441 11 718 11 938 12 144 12 348 Fertilizer demand 9 622 9 771 9 963 10 157 10 353 Potential balance -1 068 -1 199 -1 371 -1 457 -1 367 K2O Supply 16 337 18 611 20 107 21 898 24 426 Total demand 11 735 11 951 12 192 12 444 12 696 Fertilizer demand 10 501 10 683 10 887 11 102 11 318 Potential balance 4 602 6 660 7 915 9 454 11 730 North America The share of North America in world consumption of nitrogen is 12.9 percent, phosphate 11.6 percent and potash 16.9 percent. The growth rate in demand for nitrogen, phosphate and potash is expected to be 0.6 per cent each between 2012 and 2016. USA and Canada are major users of fertilizer in the region. The fertilizer nutrient supply/ demand balance indicates that the sub-region would increasingly rely on nitrogen fertilizer import. Its phosphate export may come down slowly due to an increase in demand and an almost static supply. The potash balance of the region is expected to increase due to addition of potash capacity mainly in Canada. Latin America & Caribbean The share of Latin America & Caribbean in world consumption of nitrogen is 6.7 percent, phosphate 13.9 percent, and potash 20.1 percent. The per annum growth in demand for nitrogen, phosphate and potash is expected to be at 2.7, 3.0 and 2.9 percent, respectively between 2012 and 2016. Brazil, Argentina, Mexico and Colombia constitute major users of fertilizer in the region. The fertilizer nutrient supply/demand balance indicates that the region would become a potential supplier of nitrogen as 2015, while its dependence on import of phosphate and potash would continue during the forecast period. Asia Asia region is the largest consumer of fertilizer in the world. Total fertilizer nutrient consumption in Asia is 58.7 per cent of the world total, the bulk of which is in East Asia and South Asia. Table 11 presents the fertilizer forecast for the Asia region as a whole. The share of Asia in world consumption of nitrogen is 61.9 percent, phosphate 59.6 percent and potash 44.9 percent. The region’s dependence on imports of nitrogen may reduce slowly and it may have a small surplus by 2015 if plants in the pipeline are commissioned in time. The region would continue to remain in deficit with phosphate and potash during the forecast period. Table 11 presents the fertilizer forecast for the Asia region for 2012 to 2016.

24
Table 11 Asia fertilizer forecast, 2012-2016 (thousand tonnes) 2012 2013 2014 2015 2016 N Supply 77 745 80 659 82 676 85 342 86 683 Total demand 80 694 82 217 83 649 84 828 86 040 Fertilizer demand 68 269 69 251 70 172 71 015 71 870 Potential balance -2 949 -1 558 -973 514 643 P2O5 based on H3PO4
Supply 22 363 23 070 23 673 24 222 24 569 Total demand 24 677 25 514 25 944 26 427 26 990 Fertilizer demand 22 019 22 750 23 104 23 455 23 960 Potential balance -2 314 -2 444 -2 271 -2 205 -2 421 K2O Supply 7 176 7 521 7 750 8 139 8 371 Total demand 14 595 15 218 16 357 17 419 18 109 Fertilizer demand 12 919 13 465 14 545 15 550 16 182 Potential balance -7 419 -7 697 -8 607 -9 280 -9 738
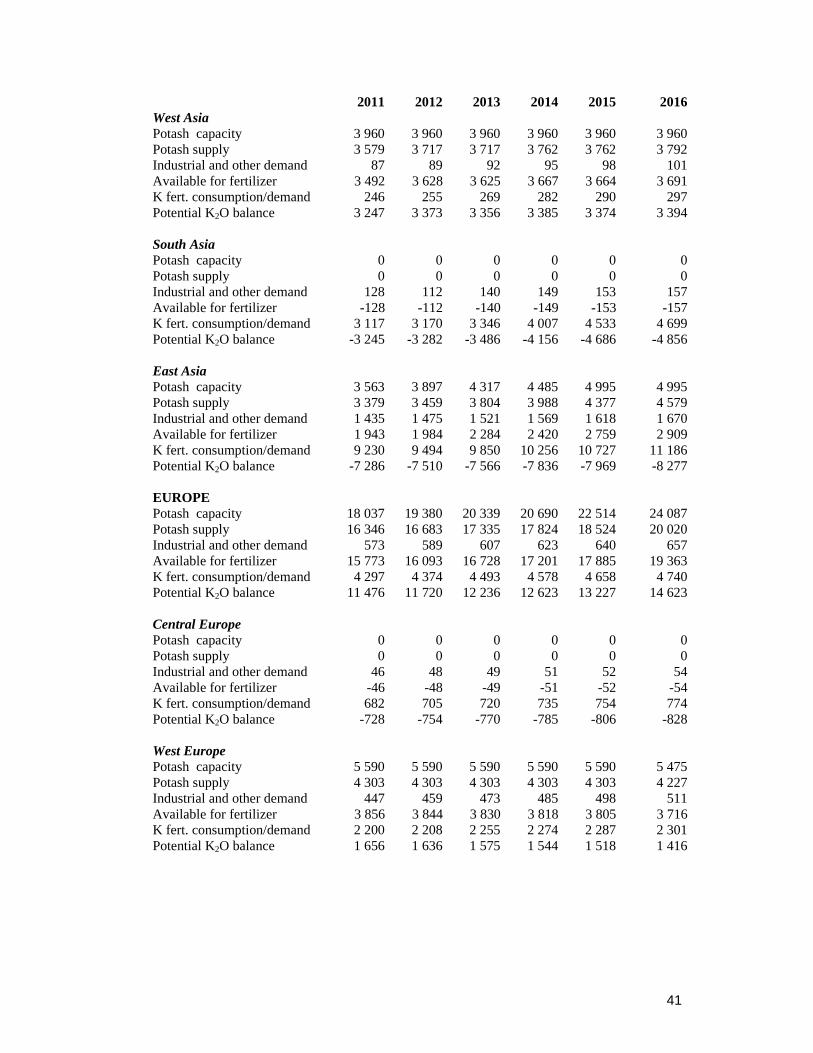
West Asia The share of West Asia in world consumption of nitrogen is 3.0 percent, phosphate 3.0 percent and potash 0.9 percent. Total fertilizer consumption in West Asia is forecast to grow by 2.3 percent per year from 2012 to 2016. The demand for nitrogen, phosphate and potash is expected to grow by 1.8, 3.3 per cent and 3.9 per cent, respectively, during the period. The sub-region is in surplus in all the three nutrients. It is a major contributor to the global nitrogen supply. South Asia Fertilizer consumption in South Asia has been increasing at a fast pace. It is the second largest fertilizer consuming region in the world. Its share in world consumption of nitrogen, phosphate and potash is 20.1, 21.9 and 11.1 percent, respectively. Nitrogen and phosphate consumption is expected to grow at 2.6 and 3.0 percent, respectively, per annum during 2012 to 2016. Potash consumption declined significantly in 2011 and may remain depressed in 2012 and 2013. Thereafter, the rate of growth is expected to be resumed at the normal level. The sub-region would continue to remain in deficit in all the three nutrients during the forecast period. The deficit balance of all the three nutrients is expected to rise during the forecast period. East Asia The East Asia sub-region is the largest fertilizer producing and consuming region in the world. Any development in East Asia and South Asia in regard to fertilizer application affects the global demand/supply situation significantly. The share of East Asia in global consumption of total fertilizer nutrients is 37.1 percent. The share of the sub-region in nitrogen consumption is 39 percent, phosphate 34.9 percent and potash 32.9 percent. Nitrogen, phosphate and potash consumption is expected to grow at 0.6, 1.2 and 4.2 percent, respectively, per annum during 2012 to 2016. With the growth in nitrogen capacity in the sub-region, the dependence on nitrogen import is expected to decline in 2015 and 2016. The potash supply in the region is far lower than the demand. With the increasing demand for potash, import demand would grow significantly during the

25
period. The sub-region would, however, continue to be a net exporter of phosphate during the period. Europe Table 12 presents fertilizer forecast for the Europe region as a whole. Europe’s share in global consumption of total fertilizer nutrients is about 13 percent. The share of the region in nitrogen fertilizer consumption is 13.9 percent, phosphate 9.2 percent and potash 15.3 percent. Nitrogen, phosphate and potash consumption is expected to grow in the region at 1.3, 2.5 and 2.0 percent, respectively, per annum during 2012 to 2016. The region has sufficient exportable surplus of nitrogen and potash while the potential balance of phosphate is very small. The potential balance of nitrogen is expected to increase from 11.4 miilion tonnes in 2012 to 12.7 million tonnes in 2016 with marginal reduction in 2013 and 2014. The potential balance of phosphate may reduce from 389 thousand tonnes in 2012 to 98 thousand tonnes in 2016. The potential balance of potash is expected to rise consistently from 11.7 million tonnes in 2012 to 14.6 million tonnes in 2016. Table 12 Europe fertilizer forecast, 2012-2016 (thousand tonnes) 2012 2013 2014 2015 2016 N Supply 34 142 34 286 34 599 36 472 36 848 Total demand 22 792 23 221 23 534 23 846 24 143 Fertilizer demand 15 115 15 381 15 555 15 736 15 905 Potential balance 11 350 11 065 11 065 12 626 12 705 P2O5 based on H3PO4
Supply 4 338 4 364 4 378 4 378 4 378 Total demand 3 949 4 057 4 174 4 215 4 280 Fertilizer demand 3 049 3 155 3 218 3 284 3 347 Potential balance 389 307 204 163 98 K2O Supply 16 683 17 335 17 824 18 524 20 020 Total demand 4 963 5 099 5 201 5 297 5 397 Fertilizer demand 4 374 4 493 4 578 4 658 4 740 Potential balance 11 720 12 236 12 623 13 227 14 623
Central Europe The share of Central Europe in nitrogen consumption is 2.5 percent, phosphate 1.7 percent and potash 2.4 percent. Nitrogen, phosphate and potash consumption is expected to grow in the sub-region at 1.5, 2.4 and 2.4 percent, respectively, per annum during 2012 to 2016. The sub-region will continue to have exportable surplus of nitrogen of about 1.5 to 1.7 million tonnes during the forecast period. However, it will continue to depend on imports of phosphate and potash. West Europe The share of West Europe in nitrogen consumption is 7.6 percent, phosphate 4.4 percent and potash 7.8 percent. The consumption of nitrogen in the sub-region is expected to

26
decline marginally by the terminal year of the forecast period. The consumption of phosphate and potash is expected to grow in the sub-region at 1.2 and 1 per cent, respectively, per annum during 2012 to 2016. The sub-region has an exportable surplus of potash of about 1.6 million tonnes, which is expected to decline marginally by the end of the forecast period. However, it will continue to depend on imports of nitrogen and phosphate. East Europe & Central Asia The share of East Europe & Central Asia in nitrogen consumption is 3.8 percent, phosphate 3.1 percent and potash 5 percent. The consumption of nitrogen, phosphate and potash is expected to grow in the sub-region at 3.7, 4.3 and 3.3 percent, respectively, per annum during 2012 to 2016. The sub-region will continue to remain in surplus in all the three nutrients during the forecast period. The surplus of nitrogen may increase from about 13 million tonnes in 2012 to 15 million tonnes in 2016. Similarly, the surplus of potash is anticipated to rise from 11 million tonnes in 2012 to 14 million tonnes in 2016. The phosphate surplus in the sub region would remain at around 2 million tonnes during the forecast period. Oceania The share of Oceania in world consumption of total fertilizer nutrients is 1.7 per cent only. The share of the sub-region in nitrogen consumption is 1.4 percent, phosphate 3.0 percent and potash 1.0 percent. Nitrogen, phosphate and potash consumption is likely to grow in the region by 1.3, 2.0 and 1.4 percent, respectively, per year during 2012 to 2016. The region would continue to be in deficit of nitrogen, phosphate and potash during the forecast period. (Table 13) Table 13 Oceania fertilizer forecast, 2012-2016 (thousand tonnes) 2012 2013 2014 2015 2016 N Supply 1 669 1 754 1 754 1 754 1 754 Total demand 2 437 2 509 2 639 2 716 2 773 Fertilizer demand 1 519 1 550 1 557 1 578 1 600 Potential balance -768 -755 -885 -962 -1 019 P2O5 based on H3PO4
Supply 480 480 480 480 480 Total demand 731 754 766 779 792 Fertilizer demand 716 740 751 764 776 Potential balance -251 -274 -286 -299 -312 K2O Supply 0 0 0 0 0 Total demand 308 315 316 323 326 Fertilizer demand 302 309 310 317 319 Potential balance -308 -315 -316 -323 -326 Table 14 presents the summary of regional potential balance of nitrogen, phosphate (H3PO4 based) and potash during 2012 to 2016.

27
Table 14 Regional and sub-regional potential balance of nitrogen, phosphate (P2O5 based on H3PO4) and potash (K2O), 2012-2016 (thousand tonnes) Region Nutrient 2012 2013 2014 2015 2016 Africa N 1 457 3 034 3 527 4 220 4 217 P2O5 5 332 5 889 6 713 7 396 7 782 K2O -609 -626 -643 -666 -693 North America N -5 712 -5 586 -5 494 -5 716 -5 900 P2O5 2 951 2 944 2 908 2 875 2 843 K2O 8 927 11 165 12 419 13 941 15 761 Latin America & N -344 -141 -393 591 686 Caribbean P2O5 -4 019 -4 143 -4 279 -4 332 -4 211 K2O -4 326 -4 504 -4 504 -4 487 -4 032 West Asia N 9 205 9 988 10 600 10 801 10 781 P2O5 1 212 1 527 1 778 1 868 1 894 K2O 3 373 3 356 3 385 3 374 3 394 South Asia N -8 185 -8 071 -8 490 -8 953 -9 473 P2O5 -6 764 -7 220 -7 377 -7 518 -7 671 K2O -3 282 -3 486 -4 156 -4 686 -4 856 East Asia N -3 969 -3 474 -3 084 -1 334 -666 P2O5 3 237 3 249 3 328 3 445 3 356 K2O -7 510 -7 566 -7 836 -7 969 -8 277 Central Europe N 1 579 1 550 1 528 1 656 1 610 P2O5 -234 -245 -260 -276 -292 K2O -754 -770 -785 -806 -828 West Europe N -3 559 -3 672 -3 718 -3 770 -3 815 P2O5 -1 638 -1 685 -1 749 -1 736 -1 744 K2O 1 636 1 575 1 544 1 518 1 416 East Europe & Central Asia N 13 330 13 187 13 256 14 740 14 910 P2O5 2 261 2 237 2 213 2 174 2 135 K2O 10 837 11 430 11 865 12 515 14 035 Oceania N -768 -755 -885 -962 -1 019 P2O5 -251 -274 -286 -299 -312 K2O -308 -315 -316 -323 -326

Fig.9 indicates the regional potential N, P2O5 and K2O balance situation in the terminal year of the forecast period, i.e., 2016.
-10000
-5000
0
5000
10000
15000
20000
North America
Latin America & Caribbean
West Asia
South Asia
CentralEurope
West EuropeOceaniaAfrica
East Asia
EastEurope & Central
Asia
'00
0 M
TFig. 9: Regional nutrient balance in 2016
N P2O5 K2O

29
Annex 1 Explanatory notes on supply, demand and balance In October 2006, the FAO/Fertilizer Organizations Working Group adopted a new protocol for the preparation of nutrient supply/demand balances based on the work of IFA’s Production and International Trade Committee in 2005/06. The main objectives of the revised protocol were to take into account the resilient surplus between production and consumption and to update the parameters used for the computation of supply and losses. i) All fertilizer references are in terms of plant nutrients: nitrogen (N), phosphate (P2O5)
and potash. (K2O). Even if for convenience P and K are stated, they actually refer to P2O5 and K2O, respectively.
ii) Fertilizer demand and supply data refer to the calendar year. iii) Definitions of the terms used and their relative criteria are listed below: Capacity: name-plate capacity. Supply: effective capacity, representing the maximum achievable production. Supply is computed from the “name-plate capacity” (theoretical capacity), multiplied by the highest operating rate achieved in the previous 5 years. For new plants, a ramp up of the operating rates was established for the first 3 years of operation, ranging from 85 to 100 percent. Demand: Fertilizer demand is the ability or the willingness of farmers to buy fertilizer at a given point in time. It is calculated on the basis of the probable consumption in one calendar year, taking into account the merge between two agricultural years. Non-fertilizer demand: consumption for non-fertilizer use, referred to as industrial use. Net non-fertilizer demand excludes the use of products that are recovered as by-products from industrial processes and then used as fertilizers. Total demand: Fertilizer demand + non-fertilizer demand. Losses: The unavoidable losses during the life cycle of a product, from production to final consumption. The extent of loss is estimated as a percentage (between 2 and 3 percent) of total fertilizer and non-fertilizer demand. Unspecified usage: Unspecified usage account for the historical residual tonnage from the production/consumption balances. The tonnage could be used either in fertilizer or in non-fertilizer products and equate to 4 per cent of other uses. Potential balance: is the difference between supply and total demand (fertilizer demand + non-fertilizer demand). Regional balance is a medium-term indicator of potential changes in fertilizer nutrient demand and supply in the region. Changes in installed supply capacity, operating rates and demand vary annually.
30
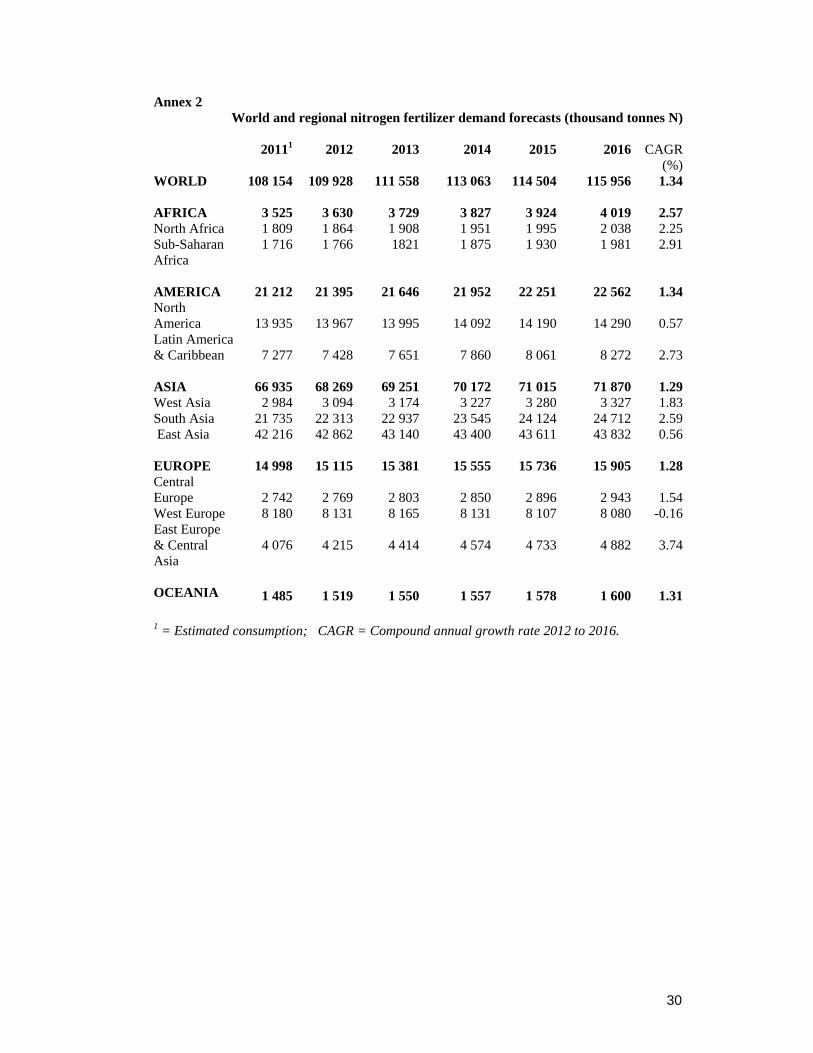
Annex 2 World and regional nitrogen fertilizer demand forecasts (thousand tonnes N)
20111 2012 2013 2014 2015 2016 CAGR
(%)WORLD 108 154 109 928 111 558 113 063 114 504 115 956 1.34 AFRICA 3 525 3 630 3 729 3 827 3 924 4 019 2.57North Africa 1 809 1 864 1 908 1 951 1 995 2 038 2.25Sub-Saharan Africa
1 716 1 766 1821 1 875 1 930 1 981 2.91
AMERICA 21 212 21 395 21 646 21 952 22 251 22 562 1.34North America 13 935 13 967 13 995 14 092 14 190 14 290 0.57Latin America & Caribbean 7 277 7 428 7 651 7 860 8 061 8 272 2.73 ASIA 66 935 68 269 69 251 70 172 71 015 71 870 1.29West Asia 2 984 3 094 3 174 3 227 3 280 3 327 1.83South Asia 21 735 22 313 22 937 23 545 24 124 24 712 2.59 East Asia 42 216 42 862 43 140 43 400 43 611 43 832 0.56 EUROPE 14 998 15 115 15 381 15 555 15 736 15 905 1.28Central Europe 2 742 2 769 2 803 2 850 2 896 2 943 1.54West Europe 8 180 8 131 8 165 8 131 8 107 8 080 -0.16East Europe & Central Asia
4 076 4 215 4 414 4 574 4 733 4 882 3.74
OCEANIA 1 485 1 519 1 550 1 557 1 578 1 600 1.31 1 = Estimated consumption; CAGR = Compound annual growth rate 2012 to 2016.

31
Annex 3
World and regional phosphate fertilizer demand forecasts (thousand tonnes P2O5) 20111 2012 2013 2014 2015 2016 CAGR
(%)WORLD 40 566 41 525 42 731 43 487 44 251 45 013 2.04 AFRICA 1 065 1 099 1 130 1 163 1 198 1 233 2.90North Africa 423 441 447 455 463 472 1.71Sub-Saharan Africa 642 659 683 709 735 761 3.67 AMERICA 10 355 10 489 10 663 10 882 11 105 11 329 1.95North America 4 708 4 712 4 719 4 754 4 786 4 817 0.56Latin America & 5 647 5 777 5 944 6 128 6 319 6 512 3.04Caribbean ASIA 24 188 24 865 25 687 26 086 26 481 26 876 1.96West Asia 1 153 1 182 1 239 1 279 1 312 1 346 3.29South Asia 8 882 9 036 9 543 9 753 9 965 10 177 3.02East Asia 14 152 14 647 14 906 15 055 15 204 15 353 1.18 EUROPE 3 740 3 815 3 953 4 038 4 127 4 213 2.51Central Europe 692 711 725 742 761 781 2.38West Europe 1 788 1 776 1 828 1 840 1 854 1 864 1.21East Europe & Central Asia
1 260 1 328 1 401 1 456 1 513 1 569 4.26
OCEANIA 1 218 1 257 1 298 1 318 1 340 1 362 2.03 1 = Estimated consumption; CAGR = Compound annual growth rate 2012 to 2016.

32
Annex 4
World and regional potash fertilizer demand forecasts (thousand tonnes K2O) 20111 2012 2013 2014 2015 2016 CAGR (%) WORLD 28 064 28 626 29 494 30 879 32 208 33 163 3.75 AFRICA 514 530 545 559 580 605 3.34North Africa 145 149 152 152 154 156 1.15Sub-Saharan Africa 369 381 393 407 426 449 4.16 AMERICA 10 366 10 501 10 683 10 887 11 102 11 318 1.89North America 4 735 4 742 4 750 4 786 4 822 4 858 0.60Latin America & Caribbean 5 631 5 759 5 933 6 101 6 281 6 460 2.91 ASIA 12 593 12 919 13 465 14 545 15 550 16 182 5.79West Asia 246 255 269 282 290 297 3.90South Asia 3 117 3 170 3 346 4 007 4 533 4 699 10.34East Asia 9 230 9 494 9 850 10 256 10 727 11 186 4.18
EUROPE 4 297 4 374 4 493 4 578 4 658 4 740 2.03Central Europe 682 705 720 735 754 774 2.36West Europe 2 200 2 208 2 255 2 274 2 287 2 301 1.03East Europe & Central Asia
1 415 1 460 1 517 1 569 1 616 1 665 3.34
OCEANIA 294 302 309 310 317 319 1.41 1 = Estimated consumption; CAGR = Compound annual growth rate 2012 to 2016.

33
Annex 5
World and regional nitrogen supply demand and balance (thousand tonnes N)
2011 2012 2013 2014 2015 2016 WORLD NH3 Capacity (as N) 161 255 168 989 174 262 176 543 182 174 181 458 NH3 Supply Capability (as N) 137 715 140 760 146 400 149 729 156 307 158 463 N Other Uses 26 844 27 798 28 782 29 819 30 531 31 176 N Available for Ferts. 110 871 112 962 117 618 119 910 125 776 127 287 N Fert. Consumption 108 154 109 928 111 558 113 063 114 504 115 956 Potential N Balance 2 717 3 034 6 061 6 847 11 272 11 332 AFRICA NH3 Capacity (as N) 5 884 7 069 8 804 9 021 9 886 9 886 NH3 Supply Capability (as N) 5 274 5 673 7 368 7 970 8 771 8 871 N Other Uses 570 586 605 616 627 635 N Available for Ferts. 4 704 5 087 6 763 7 354 8 144 8 236 N Fert. Consumption 3 525 3 630 3 729 3 827 3 924 4 019 Potential N Balance 1 179 1 457 3 034 3 527 4 220 4 217 AMERICA NH3 Capacity (as N) 22 416 23 778 24 106 24 168 25 339 25 339 NH3 Supply Capability (as N) 21 065 21 532 22 334 22 730 23 967 24 306 N Other Uses 6 002 6 193 6 414 6 665 6 842 6 959 N Available for Ferts. 15 063 15 339 15 920 16 065 17 125 17 347 N Fert. Consumption 21 212 21 395 21 646 21 952 22 251 22 562 Potential N Balance -6 149 -6 056 -5 727 -5 887 -5 126 -5 215 North America NH3 Capacity (as N) 13 327 13 805 14 133 14 185 14 185 14 185 NH3 Supply Capability (as N) 12 711 12 896 13 208 13 552 13 552 13 552 N Other Uses 4 502 4 641 4 799 4 954 5 079 5 163 N Available for Ferts. 8 209 8 255 8 409 8 598 8 474 8 390 N Fert. Consumption 13 935 13 967 13 995 14 092 14 190 14 290 Potential N Balance -5 726 -5 712 -5 586 -5 494 -5 716 -5 900 Latin America &Caribbean NH3 Capacity (as N) 9 089 9 973 9 973 9 983 11 154 11 154 NH3 Supply Capability (as N) 8 354 8 636 9 125 9 178 10 415 10 754 N Other Uses 1 500 1 552 1 615 1 711 1 764 1 797 N Available for Ferts. 6 854 7 084 7 510 7 467 8 651 8 957 N Fert. Consumption 7 277 7 428 7 651 7 860 8 061 8 272 Potential N Balance -423 -344 -141 -393 591 686

34
2011 2012 2013 2014 2015 2016 ASIA NH3 Capacity (as N) 93 284 98 296 101 343 102 878 104 444 103 490NH3 Supply Capability (as N) 75 645 77 745 80 659 82 676 85 342 86 683 N Other Uses 11 947 12 425 12 965 13 477 13 813 14 170 N Available for Ferts. 63 698 65 319 67 694 69 199 71 529 72 513 N Fert. Consumption 66 935 68 269 69 251 70 172 71 015 71 870 Potential N Balance -3 236 -2 949 -1 558 -973 514 643 West Asia
NH3 Capacity (as N) 12 742 13 935 14 478 15 403 15 555 15 555 NH3 Supply Capability (as N) 11 826 12 999 13 865 14 534 14 837 14 898 N Other Uses 689 699 703 707 756 791N Available for Ferts. 11 137 12 300 13 162 13 828 14 080 14 108 N Fert. Consumption 2 984 3 094 3 174 3 227 3 280 3 327 Potential N Balance 8 153 9 205 9 988 10 600 10 801 10 781 South Asia NH3 Capacity (as N) 16 873 17 215 18 170 18 290 18 631 18 579 NH3 Supply Capability (as N) 15 187 15 502 16 266 16 481 16 623 16 717 N Other Uses 1 358 1 375 1 400 1 426 1 452 1 478 N Available for Ferts. 13 829 14 127 14 866 15 055 15 171 15 239 N Fert. Consumption 21 735 22 313 22 937 23 545 24 124 24 712 Potential N Balance -7 906 -8 185 -8 071 -8 490 -8 953 -9 473 East Asia NH3 Capacity (as N) 63 668 67 146 68 695 69 185 70 259 69 356 NH3 Supply Capability (as N) 48 632 49 244 50 528 51 661 53 883 55 068 N Other Uses 9 900 10 351 10 862 11 344 11 605 11 901 N Available for Ferts. 38 732 38 893 39 666 40 316 42 277 43 166 N Fert. Consumption 42 216 42 862 43 140 43 400 43 611 43 832 Potential N Balance -3 483 -3 969 -3 474 -3 084 -1 334 -666 EUROPE NH3 Capacity (as N) 37 983 38 028 38 191 38 657 40 686 40 925 NH3 Supply Capability (as N) 34 100 34 142 34 286 34 599 36 472 36 848 N Other Uses 7 520 7 677 7 839 7 978 8 110 8 238 N Available for Ferts. 26 580 26 465 26 447 26 620 28 362 28 610 N Fert. Consumption 14 998 15 115 15 381 15 555 15 736 15 905 Potential N Balance 11 582 11 350 11 065 11 065 12 626 12 705 Central Europe
NH3 Capacity (as N) 6 348 6 348 6 391 6 437 6 654 6 654 NH3 Supply Capability (as N) 5 203 5 203 5 235 5 272 5 458 5 471 N Other Uses 826 855 882 895 906 917 N Available for Ferts. 4 377 4 348 4 353 4 377 4 552 4 553 N Fert. Consumption 2 742 2 769 2 803 2 850 2 896 2 943 Potential N Balance 1 635 1 579 1 550 1 528 1 656 1 610

35
2011 2012 2013 2014 2015 2016 West Europe
NH3 Capacity (as N) 10 028 10 028 10 028 10 028 10 028 10 028 NH3 Supply Capability (as N) 9 396 9 396 9 396 9 396 9 396 9 396 N Other Uses 4 759 4 824 4 903 4 983 5 060 5 132 N Available for Ferts. 4 637 4 572 4 493 4 413 4 337 4 265 N Fert. Consumption 8 180 8 131 8 165 8 131 8 107 8 080 Potential N Balance -3 543 -3 559 -3 672 -3 718 -3 770 -3 815 East Europe and Central Asia NH3 Capacity (as N) 21 607 21 652 21 772 22 192 24 004 24 243 NH3 Supply Capability (as N) 19 501 19 542 19 654 19 930 21 617 21 981 N Other Uses 1 935 1 997 2 054 2 100 2 144 2 189 N Available for Ferts. 17 566 17 545 17 601 17 830 19 473 19 792 N Fert. Consumption 4 076 4 215 4 414 4 574 4 733 4 882 Potential N Balance 13 490 13 330 13 187 13 256 14 740 14 910 OCEANIA NH3 Capacity (as N) 1 688 1 818 1 818 1 818 1 818 1 818NH3 Supply Capability (as N) 1 631 1 669 1 754 1 754 1 754 1 754 N Other Uses 805 917 959 1 082 1 138 1 173 N Available for Ferts. 826 751 795 672 616 581 N Fert. Consumption 1 485 1 519 1 550 1 557 1 578 1 600 Potential N Balance -659 -768 -755 -885 -962 -1 019

36
Annex 6 World and regional phosphate supply demand and balance (thousand tonnes P2O5)
2011 2012 2013 2014 2015 2016
WORLD
H3PO4 capacity 51 502 53 338 56 222 58 118 59 358 61 323H3PO4 supply capability 42 569 44 312 45 857 47 392 48 776 49 835H3PO4 industrial demand 5 539 5 850 6 170 6 344 6 463 6 534H3PO4 available for fertilizer 37 030 38 462 39 687 41 048 42 312 43 301P Fert. consumption/demand 40 566 41 525 42 731 43 487 44 251 45 012H3PO4 Fert. demand 35 274 36 374 37 410 38 060 38 714 39 520Non-H3PO4 Fert. demand 5 291 5 151 5 321 5 428 5 537 5 493Potential H3PO4 balance 1 755 2 088 2 277 2 988 3 598 3 781 AFRICA H3PO4 capacity 7 638 8 088 9 348 10 308 10 308 10 903H3PO4 supply capability 7 165 6 758 7 425 8 295 9 009 9 426H3PO4 industrial demand 361 459 542 558 558 559H3PO4 available for fertilizer 6 803 6 299 6 883 7 737 8 450 8 867P Fert. consumption/demand 1 065 1 099 1 130 1 163 1 198 1 233H3PO4 Fert. demand 937 968 994 1 024 1 054 1 085Non-H3PO4 Fert. demand 128 132 136 140 144 148Potential H3PO4 balance 5 866 5 332 5 889 6 713 7 396 7 782 AMERICA H3PO4 capacity 12 261 12 381 12 381 12 501 12 741 13 406H3PO4 supply capability 10 531 10 373 10 519 10 567 10 687 10 981H3PO4 industrial demand 1 753 1 819 1 947 1 975 1 986 1 996H3PO4 available for fertilizer 8 779 8 554 8 572 8 592 8 701 8 985P Fert. consumption/demand 10 355 10 489 10 663 10 882 11 105 11 329H3PO4 Fert. demand 9 508 9 622 9 771 9 963 10 157 10 353Non-H3PO4 Fert. demand 847 867 892 919 948 977Potential H3PO4 balance -729 -1 068 -1 199 -1 371 -1 457 -1 367 North America H3PO4 capacity 9 861 9 581 9 581 9 581 9 581 9 581H3PO4 supply capability 8 892 8 619 8 619 8 619 8 619 8 619H3PO4 industrial demand 909 957 957 958 958 959H3PO4 available for fertilizer 7 983 7 663 7 663 7 662 7 661 7 661P Fert. onsumption/demand 4 708 4 712 4 719 4 754 4 786 4 817H3PO4 Fert. demand 4 708 4 712 4 719 4 754 4 786 4 817Non-H3PO4 Fert. demand 0 0 0 0 0 0Potential H3PO4 balance 3 275 2 951 2 944 2 908 2 875 2 843

37
2011 2012 2013 2014 2015 2016 Latin America &Caribbean H3PO4 capacity 2 400 2 800 2 800 2 920 3 160 3 825H3PO4 supply capability 1 639 1 754 1 899 1 947 2 067 2 362H3PO4 industrial demand 844 862 990 1 017 1 028 1 037H3PO4 available for fertilizer 795 891 909 930 1 039 1 325P Fert. onsumption/demand 5 647 5 777 5 944 6 128 6 319 6 512H3PO4 Fert. demand 4 800 4 911 5 052 5 208 5 371 5 535Non-H3PO4 Fert. demand 847 867 892 919 948 977Potential H3PO4 balance -4 005 -4 019 -4 143 -4 279 -4 332 -4 211 ASIA H3PO4 capacity 24 400 25 646 27 235 28 032 29 032 29 257H3PO4 supply capability 19 675 22 363 23 070 23 673 24 222 24 569H3PO4 industrial demand 2 556 2 658 2 765 2 840 2 972 3 030H3PO4 available for fertilizer 17 119 19 705 20 305 20 833 21 250 21 539P Fert.consumption/demand 24 188 24 865 25 687 26 086 26 481 26 876H3PO4 Fert. demand 21 137 22 019 22 750 23 104 23 455 23 960Non-H3PO4 Fert. demand 3 051 2 846 2 937 2 982 3 026 2 916Potential H3PO4 balance -4 019 -2 314 -2 444 -2 271 -2 205 -2 421 West Asia H3PO4 capacity 3 741 3 818 4 338 4 398 4 398 4 623H3PO4 supply capability 1 752 2 669 3 037 3 324 3 446 3 503H3PO4 industrial demand 364 369 370 370 371 372H3PO4 available for fertilizer 1 388 2 300 2 667 2 954 3 075 3 131P Fert.consumption/demand 1 153 1 182 1 239 1 279 1 312 1 346H3PO4 Fert. demand 1 061 1 088 1 140 1 176 1 207 1 238Non-H3PO4 Fert. demand 92 95 99 102 105 108Potential H3PO4 balance 327 1 212 1 527 1 778 1 868 1 894 South Asia H3PO4 capacity 2 170 2 170 2 170 2 345 2 895 2 895H3PO4 supply capability 1 591 1 550 1 550 1 585 1 637 1 677H3PO4 industrial demand 268 272 277 282 286 290H3PO4 available for fertilizer 1 323 1 278 1 273 1 303 1 351 1 387P Fert.consumption/demand 8 882 9 036 9 543 9 753 9 965 10 177H3PO4 Fert. demand 7 905 8 042 8 493 8 680 8 869 9 058Non-H3PO4 Fert. demand 977 994 1 050 1 073 1 096 1 119Potential H3PO4 balance -6 582 -6 764 -7 220 -7 377 -7 518 -7 671

38
2011 2012 2013 2014 2015 2016 East Asia H3PO4 capacity 18 489 19 657 20 726 21 288 21 738 21 738H3PO4 supply capability 16 331 18 144 18 484 18 764 19 139 19 389H3PO4 industrial demand 1 924 2 017 2 118 2 188 2 314 2 368H3PO4 available for fertilizer 14 407 16 127 16 366 16 576 16 824 17 021P Fert.consumption/demand 14 152 14 647 14 906 15 055 15 204 15 353H3PO4 Fert. demand 12 171 12 889 13 117 13 248 13 379 13 664Non-H3PO4 Fert. demand 1 981 1 758 1 789 1 807 1 824 1 689Potential H3PO4 balance 2 236 3 237 3 249 3 328 3 445 3 356
Europe H3PO4 capacity 6 603 6 623 6 658 6 678 6 678 7 078H3PO4 supply capability 4 719 4 338 4 364 4 378 4 378 4 378H3PO4 industrial demand 855 900 902 956 932 933H3PO4 available for fertilizer 3 863 3 438 3 462 3 422 3 446 3 445P Fert. consumption/demand 3 740 3 815 3 953 4 038 4 127 4 213H3PO4 Fert. demand 2 998 3 049 3 155 3 218 3 284 3 347Non-H3PO4 Fert. demand 742 766 798 820 843 866Potential H3PO4 balance 866 389 307 204 163 98 Central Europe H3PO4 capacity 1 022 1 022 1 022 1 022 1 022 1 022H3PO4 supply capability 521 425 425 425 425 425H3PO4 industrial demand 40 76 76 77 77 77H3PO4 available for fertilizer 481 349 349 348 348 348P Fert. consumption/demand 692 711 725 742 761 781H3PO4 Fert. demand 568 583 594 608 624 640Non-H3PO4 Fert. demand 125 128 130 134 137 141Potential H3PO4 balance -87 -234 -245 -260 -276 -292 West Europe H3PO4 capacity 565 565 565 565 565 565H3PO4 supply capability 491 467 467 467 467 467H3PO4 industrial demand 547 542 543 597 571 572H3PO4 available for fertilizer -56 -75 -76 -129 -104 -104P Fert.consumption/demand 1 788 1 776 1 828 1 840 1 854 1 864H3PO4 Fert. demand 1 574 1 563 1 609 1 619 1 631 1 640Non-H3PO4 Fert. demand 215 213 219 221 222 224Potential H3PO4 balance -1 630 -1 638 -1 685 -1 749 -1 736 -1 744

39
2011 2012 2013 2014 2015 2016 East Europe & Central Asia H3PO4 capacity 5 016 5 036 5 071 5 091 5 091 5 491H3PO4 supply capability 3 707 3 446 3 471 3 486 3 486 3 486H3PO4 industrial demand 268 282 282 283 284 284H3PO4 available for fertilizer 3 439 3 164 3 189 3 203 3 202 3 202P Fert.consumption/demand 1 260 1 328 1 401 1 456 1 513 1 569H3PO4 Fert. demand 857 903 953 990 1 029 1 067Non-H3PO4 Fert. demand 403 425 448 466 484 502Potential H3PO4 balance 2 582 2 261 2 237 2 213 2 174 2 135 OCEANIA H3PO4 capacity 600 600 600 600 600 680H3PO4 supply capability 480 480 480 480 480 480H3PO4 industrial demand 14 14 15 15 15 16H3PO4 available for fertilizer 466 466 465 465 465 464P Fert.consumption/demand 1 218 1 257 1 298 1 318 1 340 1 362H3PO4 Fert. demand 694 716 740 751 764 776Non-H3PO4 Fert. demand 524 540 558 567 576 586Potential H3PO4 balance -228 -251 -274 -286 -299 -312

40
Annex 7 World and regional potash supply demand and balance (thousand tonnes K2O) 2011 2012 2013 2014 2015 2016WORLD Potash Capacity 43 350 46 222 49 821 52 690 58 409 61 427Potash Supply Capability 38 815 40 196 43 467 45 682 48 561 52 817Industrial and other demand 3 506 3 584 3 716 3 830 3 942 4 058Available for Fertilizer 35 309 36 612 39 752 41 852 44 619 48 759Consumption/demand 28 064 28 626 29 494 30 879 32 208 33 163Potential K2O Balance 7 245 7 986 10 258 10 973 12 411 15 596
AFRICA Potash Capacity 0 0 0 0 0 0Potash Supply Capability 0 0 0 0 0 0Industrial and other demand 76 78 81 83 86 88Available for Fertilizer -76 -78 -81 -83 -86 -88Consumption/demand 514 530 545 559 580 605Potential K2O Balance -590 -609 -626 -643 -666 -693 AMERICA Potash Capacity 17 790 18 985 21 205 23 555 26 940 28 385Potash Supply Capability 15 511 16 337 18 611 20 107 21 898 24 426 Industrial and other demand 1 202 1 234 1 269 1 304 1 341 1 379Available for Fertilizer 14 309 15 103 17 343 18 803 20 557 23 047 Consumption/demand 10 366 10 501 10 683 10 887 11 102 11 318Potential K2O Balance 3 943 4 602 6 660 7 915 9 454 11 730 North America Potash Capacity 16 030 17 225 19 445 20 055 23 140 24 585Potash Supply Capability 13 998 14 736 17 011 18 332 19 921 21 810Industrial and other demand 1 038 1 067 1 096 1 127 1 158 1 191Available for Fertilizer 12 960 13 670 15 915 17 206 18 763 20 619Consumption/demand 4 735 4 742 4 750 4 786 4 822 4 858Potential K2O Balance 8 225 8 927 11 165 12 419 13 941 15 761 Latin America & Caribbean Potash Capacity 1 760 1 760 1 760 3 500 3 800 3 800Potash Supply Capability 1 513 1 601 1 601 1 775 1 977 2 617Industrial and other demand 164 168 173 177 183 188Available for Fertilizer 1 349 1 433 1 428 1 597 1 794 2 429Consumption/demand 5 631 5 759 5 933 6 101 6 281 6 460Potential K2O Balance -4 282 -4 326 -4 504 -4 504 -4 487 -4 032 ASIA Potash Capacity 7 523 7 857 8 277 8 445 8 955 8 955Potash Supply Capability 6 958 7 176 7 521 7 750 8 139 8 371Industrial and other demand 1 649 1 676 1 753 1 813 1 868 1 928Available for Fertilizer 5 308 5 500 5 768 5 938 6 270 6 444Consumption/demand 12 593 12 919 13 465 14 545 15 550 16 182Potential K2O Balance -7 284 -7 419 -7 697 -8 607 -9 280 -9 738
41
2011 2012 2013 2014 2015 2016West Asia Potash capacity 3 960 3 960 3 960 3 960 3 960 3 960Potash supply 3 579 3 717 3 717 3 762 3 762 3 792Industrial and other demand 87 89 92 95 98 101Available for fertilizer 3 492 3 628 3 625 3 667 3 664 3 691K fert. consumption/demand 246 255 269 282 290 297Potential K2O balance 3 247 3 373 3 356 3 385 3 374 3 394 South Asia Potash capacity 0 0 0 0 0 0Potash supply 0 0 0 0 0 0Industrial and other demand 128 112 140 149 153 157Available for fertilizer -128 -112 -140 -149 -153 -157K fert. consumption/demand 3 117 3 170 3 346 4 007 4 533 4 699Potential K2O balance -3 245 -3 282 -3 486 -4 156 -4 686 -4 856 East Asia Potash capacity 3 563 3 897 4 317 4 485 4 995 4 995Potash supply 3 379 3 459 3 804 3 988 4 377 4 579Industrial and other demand 1 435 1 475 1 521 1 569 1 618 1 670Available for fertilizer 1 943 1 984 2 284 2 420 2 759 2 909K fert. consumption/demand 9 230 9 494 9 850 10 256 10 727 11 186Potential K2O balance -7 286 -7 510 -7 566 -7 836 -7 969 -8 277 EUROPE Potash capacity 18 037 19 380 20 339 20 690 22 514 24 087Potash supply 16 346 16 683 17 335 17 824 18 524 20 020Industrial and other demand 573 589 607 623 640 657Available for fertilizer 15 773 16 093 16 728 17 201 17 885 19 363K fert. consumption/demand 4 297 4 374 4 493 4 578 4 658 4 740Potential K2O balance 11 476 11 720 12 236 12 623 13 227 14 623 Central Europe Potash capacity 0 0 0 0 0 0Potash supply 0 0 0 0 0 0Industrial and other demand 46 48 49 51 52 54Available for fertilizer -46 -48 -49 -51 -52 -54K fert. consumption/demand 682 705 720 735 754 774Potential K2O balance -728 -754 -770 -785 -806 -828 West Europe Potash capacity 5 590 5 590 5 590 5 590 5 590 5 475Potash supply 4 303 4 303 4 303 4 303 4 303 4 227Industrial and other demand 447 459 473 485 498 511Available for fertilizer 3 856 3 844 3 830 3 818 3 805 3 716K fert. consumption/demand 2 200 2 208 2 255 2 274 2 287 2 301Potential K2O balance 1 656 1 636 1 575 1 544 1 518 1 416

42
2011 2012 2013 2014 2015 2016East Europe and Central Asia Potash capacity 12 447 13 790 14 749 15 100 16 924 18 612Potash supply 12 043 12 380 13 032 13 521 14 221 15 793Industrial and other demand 79 82 85 87 90 93Available for fertilizer 11 964 12 297 12 947 13 434 14 131 15 700K fert. consumption/demand 1 415 1 460 1 517 1 569 1 616 1 665Potential K2O balance 10 548 10 837 11 430 11 865 12 515 14 035 OCEANIA Potash capacity 0 0 0 0 0 0Potash supply 0 0 0 0 0 0Industrial and other demand 6 6 6 6 6 7Available for fertilizer -6 -6 -6 -6 -6 -7K fert. consumption/demand 294 302 309 310 317 319Potential K2O balance -300 -308 -315 -316 -323 -326

43
Annex 8
Regional classification of countries and territories AFRICA North Africa
Algeria Egypt Libya, Arab Jam Morocco Sudan Tunisia
Sub-Saharan Africa
Angola Benin Burkina Faso
Burundi
Cameroon Congo, Dem. Rep. Congo, Rep. of
Côte d'Ivoire
Eritrea
Ethiopia
Gabon
Gambia
Ghana
Guinea
Kenya
Madagascar
Malawi
Mali
Mauritius
Mozambique
Namibia
Niger
Nigeria
Rwanda
Senegal
Seychelles
South Africa Tanzania, United Rep of Togo
Uganda
Zambia
Zimbabwe AMERICA Latin America & Caribbean
Antigua and Barbuda Argentina
Barbados
Belize
Bolivia
Brazil
Chile
Colombia
Costa Rica
Cuba
Dominica Dominican Republic Ecuador
El Salvador
Guatalemala
Guyana
Honduras Jamaica
Mexico
Nicaragua
Panama
Paraguay
Peru
St Kitts and Nevis Suriname
Trinidad & Tobago
Uruguay Venezuela
North America
Canada United States of America
ASIA East Asia
Brunei Darussalam
Cambodia
China Hong Kong
China Macao
China Mainland
Indonesia
Japan
Korea Rep
Malaysia
Mongolia
Myanmar
Philippines Singapore
Taiwan Province of China
Thailand Viet Nam
South Asia
Bangladesh
Bhutan
India
Maldives
Nepal
Pakistan
Sri Lanka West Asia
Afghanistan
Bahrain
Cyprus Iran, Islamic Rep of Iraq
Israel
Jordan
Kuwait
Lebanon
Oman
Qatar
Saudi Arabia
Syria, ArabRep.
Turkey United Arab Emirates Yemen
EUROPE Central Europe
Albania
Bosnia and Herzegovina
Bulgaria
Croatia Czech Republic Hungary Macedonia Montenegro Poland
Romania
Serbia
Slovakia
Slovenia
Eastern Europe and Central Asia
Armenia
Azerbaijan
Belarus
Estonia
Georgia
Kazakhstan
Kyrgyzstan
Latvia Lithuania Moldova Russian Fed Tajikistan Ukraine Uzbekistan
Western Europe
Austria
Denmark
Finland
France
Germany
Greece
Iceland
Ireland
Italy
Luxembourg
Malta
Netherlands
Norway
Portugal
Spain
Sweden
Switzerland
United Kingdom OCEANIA
Australia Cook Islands Fiji French Polynesia New Caledonia
New Zealand Papua New Guinea Samoa Tonga