custom report creation
TRANSCRIPT

Page 1 of 12
11465 Sunset Hills Rd, Suite 200 Reston, VA 20190 (703) 714-1966 [email protected]
Custom Reports
Lab Objective: We will see how to create basic Custom Reports and we will go through LTE specific Custom Reports.
What is Custom Report?
The Custom Report functionality allows the user to create custom templates of their own including different
Statistics and KPI Plots.
These reports can then be accessed as shown below from Report Open Custom Reports menu.
What is in the Custom Report?
Open provided empty template
The template report includes nine green Tabs as shown below for different functionalities. The Most
important ones are EventData, MetricData and ImageData which are used to define KPIs needed in the report.
Other user created Tabs can be added to display the extracted information in a format determined by the user
using Excel functionalities.
MetricData Tab is filled by user with the list metrics that need to be extracted for the custom report. The
initial view of the Metric Data Tab is as below:
Row 1 through Row 4 contains the headings. User can start defining metrics from Row 5.
Column A through Column H can be filled with user commands and the result of those commands
will be generated in Column I and onwards if applicable.
In the template refer to Tab “Description” to get the definition of each column and the way to use it.

Page 2 of 12
11465 Sunset Hills Rd, Suite 200 Reston, VA 20190 (703) 714-1966 [email protected]
'Title' Column Description
Shows the tilte of the selected row. It can be Event or Metric depends on what user wants to see.
'Technology' Column Description
Shows the name of the technology for metric which user wants too see. The Description of technolology is little bit different in MetricData and EventData sheets.
Technology Name MetricData Technology Column
CDMA/EVDO CDMA
UMTS UMTS
GSM GSM
LTE LTE
WiMAX WIMAX
iDEN iDEN
Technology Name EventData Technology Column
CDMA/EVDO CDMA
UMTS UMTS
GSM GSM
LTE LTE
WiMAX WIMAX
iDEN iDEN
Metric/Event Column Description
Shows the Metric name is MetricData Sheet and Event name in EventData Sheet. User can get the exact Metric or Event name from Metric List or Event List sheet.
'Type' Column Description
Type Description
Avg Shows the Average value of selected metric
Min Shows the Minimum value of selected metric
Max Shows the Maximum value of selected metric
Sum Shows the Sum of all the bins for the selected metric
Count Shows the Count of the Bins where the selected metric has valid data.
Std Shows the Standard Deviation of the selected metric
Mode Shows the Mode of the selected metric
Median Shows the Median of the selected metric
Histogram Shows the Histogram of the selected metric in the range mentioned under columns MinRange and MaxRange. The result is the percentage of the data available in the selected range.
Value Creates a new sheet and shows the Bin Time, Latitude, Longitude and Metric values for all the bins where the Metic has valid data.
AllValue Creates a new sheet and shows the Bin Time, Latitude, Longitude and Metric values for all the bins even if there is no value for the selected metric in the bin.
RawValue Creates a new sheet and shows the Metric values only for all the bins even if there is no value for the selected metric in the bin.
MultiMetric Creates a new sheet and shows the Bin Time, Latitude, Longitude and Metric values for the metrics defined in MultiMetric Sheet
'MinRange' Column Description
Works in combination with Histogram under 'Type' Column. Shows the Minimum range of the histogram percentage. For Example, if a user wants to put a Minimum range of Less Than equal to -95dBm it should display as <=-95.
'MaxRange' Column Description

Page 3 of 12
11465 Sunset Hills Rd, Suite 200 Reston, VA 20190 (703) 714-1966 [email protected]
Works in combination with Histogram under 'Type' Column. Shows the Maximum range of the histogram percentage. For Example if a user wants to put a Maximum range of Greater Than -95dBm it should display as >-95.
'WhereKPI' Column Description
Metric Name Shows the Metric/Event name whose condition has to be applied.
filter If a user wants to put multiple conditions it can be done in "Conditions" sheet. In that case user will write "filter" in this column.
groupby If a user wants to group one metric wrt other for example group Dominant PN EcIo by PN, this can be done by difing a groupby metric in GroupBy sheet.. In that case user will write "groupbyr" in this column.
'WhereCondition' Column Description
Metric Value Shows the Metric/Event value as a condition for example if user wants to see Rx power geater than -95dBm, "Rx Power" needs to be input in "WhereKPI" Column and ">-95" needs to input in "WhereCondition" column..
Condition Name Where user has input "filter" in "WhereKPI" column to obtain the multiple conditions from "Conditions" Sheet, "WhereConditions" Column would contain the Condition name from "Conditions" Table.
Groupby Name Where user has input "groupby" in "WhereKPI" column to group one metric wrt other, "WhereConditions" Column would contain the GroupBy name from "GroupBy" Table.
Capturing Images
Image captures can be configured using the ImageData Tab, which refers to Thresholds and Options on respective Tabs. On the Image Tab, the user needs to define the Device ID and the range of cells to use for the Image capture in columns I onwards. The metric, thresholds, options and any conditions for data selection is defined in rows 5 onwards.
Create a Basic Custom Report
Open empty template available at \Lab6\Custom Report Templates and go to MetricData Sheet
In Cell A5 define the title as “Metric”
In Cell B5 define the Technology as “LTE”
Now in Cell C5 we need to define the name of the metric to be populated. Refer to Sheet “Metric
List” to see the comprehensive list of all the Metrics available for different technologies. Since we are
focused on LTE technology lets get a metric for LTE; for example “Dominant RSRP” and put it in Cell
C5.
In Cell D5 define the type of statistic needed for metric defined in Cell C5 for example to get the
average of a metric put “avg”. More statistical functions are defined in the list mentioned above.
After doing all this your Row will appear as shown in below:
Page 4 of 12
11465 Sunset Hills Rd, Suite 200 Reston, VA 20190 (703) 714-1966 [email protected]
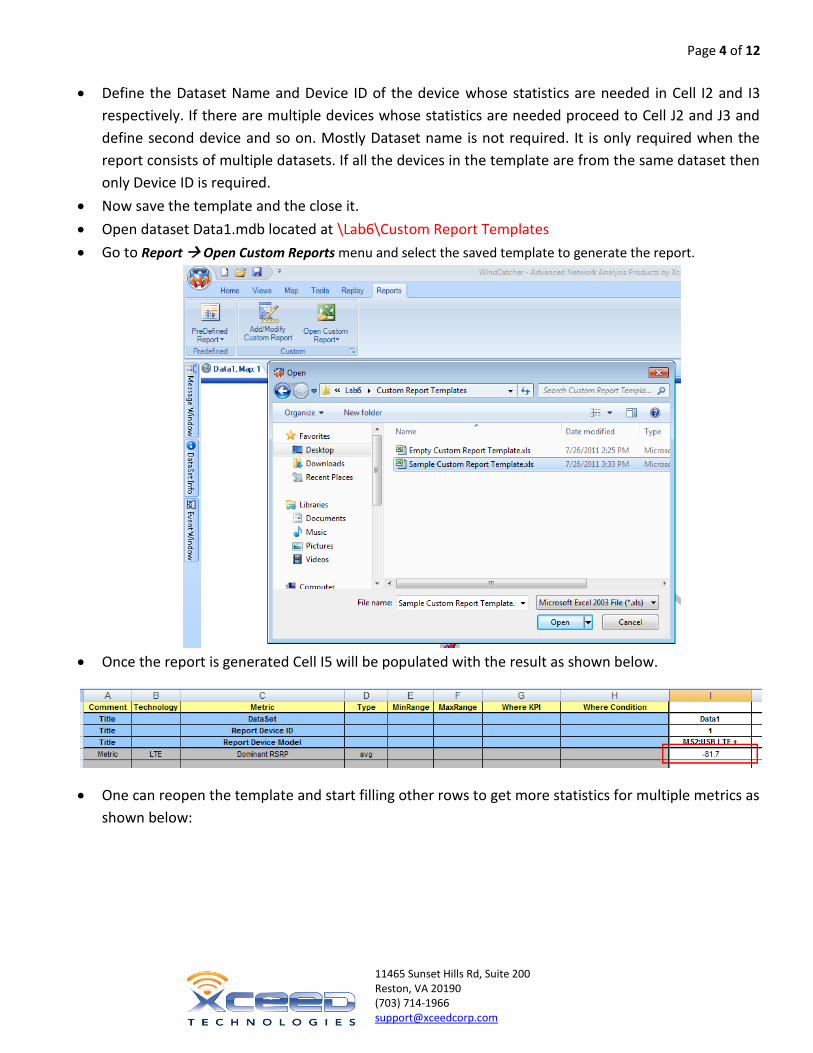
Define the Dataset Name and Device ID of the device whose statistics are needed in Cell I2 and I3
respectively. If there are multiple devices whose statistics are needed proceed to Cell J2 and J3 and
define second device and so on. Mostly Dataset name is not required. It is only required when the
report consists of multiple datasets. If all the devices in the template are from the same dataset then
only Device ID is required.
Now save the template and the close it.
Open dataset Data1.mdb located at \Lab6\Custom Report Templates
Go to Report Open Custom Reports menu and select the saved template to generate the report.
Once the report is generated Cell I5 will be populated with the result as shown below.
One can reopen the template and start filling other rows to get more statistics for multiple metrics as
shown below:

Page 5 of 12
11465 Sunset Hills Rd, Suite 200 Reston, VA 20190 (703) 714-1966 [email protected]
Apply a filter
To apply the filter to any metric first that filter is needed to be defined in Conditions sheet.
Open the template again and go to the Conditions Sheet.
Let us assume that we want to apply a condition to consider that data only where Dominant RSRP > -
90 dBm and Dominant RSRQ > -10 dB.
Define a Condition Name as “condition1” in Cell A2. In Cells B2 and C2 define first metric name and
condition. In Cell E2 define “AND” or “OR” operator whichever is required in the condition. In Cell F2
and G2 define second metric name and its condition. You can go on and define third metrics in the
same condition if needed.
One condition can be used in another condition as shown below. “condition2” has “condition1”
embedded in it.

Page 6 of 12
11465 Sunset Hills Rd, Suite 200 Reston, VA 20190 (703) 714-1966 [email protected]
Now to apply these filters add new Metrics in “Metric Data” Sheet. Put “filter” in column “G” and the
name of condition in column “H”. For example if the count and average of “Dominant RSRP” is
needed with “condition1” it will be defined as shown in the snap below:
Get the Dump of a Metric per Bin
If the per bin dump of any metric is needed, it is achieved by RawValue, Value and AllValue. One of
these is needed to be defined in “Type” column in MetricData Sheet for any metric as shown below:
Once the report is generated from this template a new sheet will be created which will give the
dump of per bin value for “Dominant RSRP”as shown below:
Create a new sheet in the template and copy the name of this new sheet created in the generated
report; in this case “LTE_Dominant RSRP_value_37”. Next time with the report is generated a new
sheet will not be created; rather same sheet “LTE_Dominant RSRP_value_37” will be populated.

Page 7 of 12
11465 Sunset Hills Rd, Suite 200 Reston, VA 20190 (703) 714-1966 [email protected]
Get the Dump of Multiple Metrics per Bin
To get the Dump of Multiple Metrics together “Multimetric” is used.
Open the template and go to sheet MultiMetric.
In Cell A2 define any name for the MultiMetric for example “Multi1”.
In C2 mention the first metric; “Dominant RSRP” in our case.
In D2 define the condition name, if any condition is needed.
In E2 and F2 define second metric and its condition.
After all this the MultiMetric Sheet will look as shown in snap below:
More metrics can be added in this MultiMetric if needed.
After this move to sheet MetricData.
To plot this MultiMetric, The metric name will be “Multi1” and Type will be “multimetric” as shown
below:
Close the template and generate the report. A new sheet will be created in the generated report
with the dump per bin values of metrics as shown below:

Page 8 of 12
11465 Sunset Hills Rd, Suite 200 Reston, VA 20190 (703) 714-1966 [email protected]
Create a new sheet in the template and copy the name of this new sheet created in the generated
report; in this case “LTE_Multi1_multimetric_38”. Next time with the report is generated a new sheet
will not be created; rather same sheet “LTE_Multi1_multimetric_38” will be populated.
Get the Event Count
Getting The Event count is same as getting the metric count. The only difference is that it will be
populated in EventData Sheet.
In Cell A5 define the title as “Event”
In Cell B5 define the Technology as “LTE”
Now in Cell C5 we need to define the name of the event to be populated. Refer to Sheet “Event List”
to see the comprehensive list of all the Eventss available for different technologies. Since we are
focused on LTE technology lets get some events for LTE; for example “LTE RRC Connection Request”
and “LTE RRC Connection Dropped” and put it in Cell C5.
In Cell D5 define the type as “count”.
Select Dataset name and Device ID in Cells I2 and I3. Now save and then close the template.
Once the report is generated it will show event counts as shown below:
Plotting the Image
To Plot a metric move to sheet ImageData.
The Metric we are going to plot is “Dominant RSRP”.
In Cell A5 define the title as “Metric”
In Cell B5 define the Technology as “LTE”
Now in Cell C5 we need to define the name of the metric to be populated. In our example “Dominant
RSRP” and put it in Cell C5.
In Cell D5 Threshold name is needed to be defined for different ranges of metric to be plotted.
In sheet Threshold different thresholds are Pre Defined. Column A contains the threshold’s name.
The color between to numbers is the color for that range. These colors and ranges can be changed by
user. Any new threshold can be defined by the user.
Page 9 of 12
11465 Sunset Hills Rd, Suite 200 Reston, VA 20190 (703) 714-1966 [email protected]
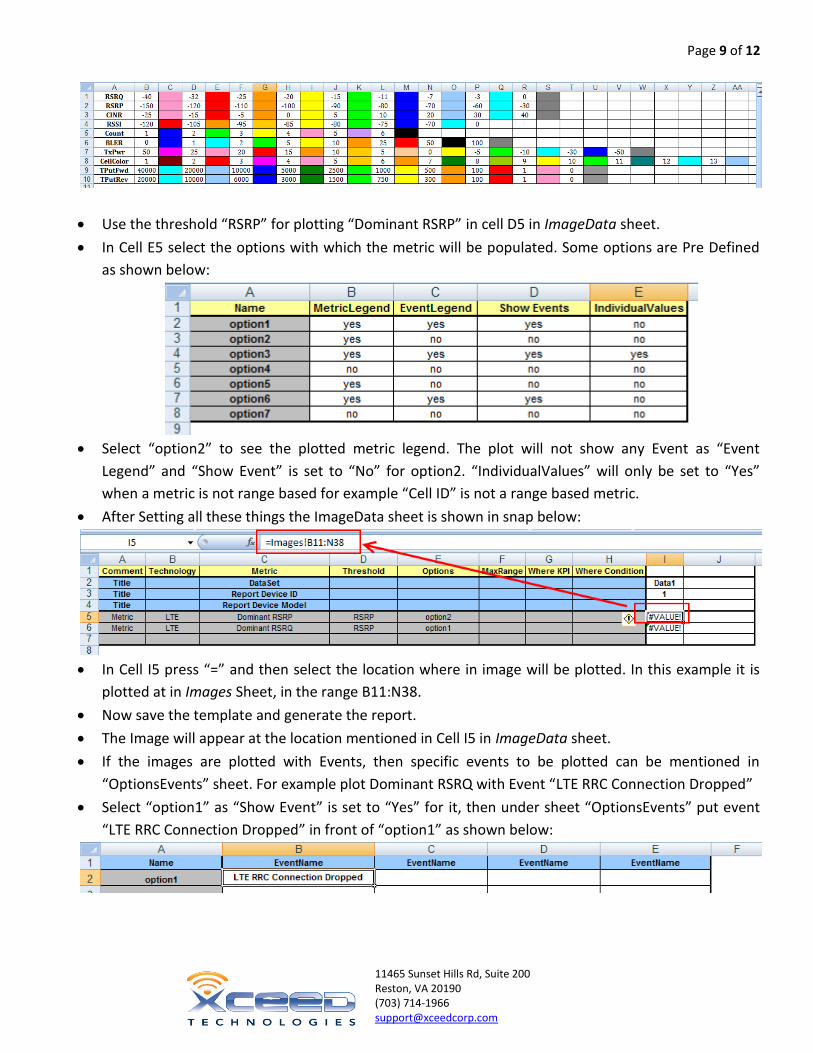
Use the threshold “RSRP” for plotting “Dominant RSRP” in cell D5 in ImageData sheet.
In Cell E5 select the options with which the metric will be populated. Some options are Pre Defined
as shown below:
Select “option2” to see the plotted metric legend. The plot will not show any Event as “Event
Legend” and “Show Event” is set to “No” for option2. “IndividualValues” will only be set to “Yes”
when a metric is not range based for example “Cell ID” is not a range based metric.
After Setting all these things the ImageData sheet is shown in snap below:
In Cell I5 press “=” and then select the location where in image will be plotted. In this example it is
plotted at in Images Sheet, in the range B11:N38.
Now save the template and generate the report.
The Image will appear at the location mentioned in Cell I5 in ImageData sheet.
If the images are plotted with Events, then specific events to be plotted can be mentioned in
“OptionsEvents” sheet. For example plot Dominant RSRQ with Event “LTE RRC Connection Dropped”
Select “option1” as “Show Event” is set to “Yes” for it, then under sheet “OptionsEvents” put event
“LTE RRC Connection Dropped” in front of “option1” as shown below:

Page 10 of 12
11465 Sunset Hills Rd, Suite 200 Reston, VA 20190 (703) 714-1966 [email protected]
Now “Dominant RSRQ” will be plotted with event ““LTE RRC Connection Dropped” as shown in snap
below:
If the Map Routes and Cell Sites are loaded on the map, the images will come with them.
LTE Acceptance Report
Before you run this report you need to check the configuration of the report. This is to make sure
that the report runs for your project and for the correct device. To do this, open LTE Acceptance
Report Template from C:\Documents and Settings\[Local User]\My Documents\Xceed Technologies,
Inc\CustomReport
This report is created for one UE and Scanner device.
If you want to run the report on the currently active project, then you only need to provide
Device ID.
Click on “Layer Control” icon in the map menu and note the Device ID. Make sure that the Device ID
that is configured in “LTE Acceptance Report” is correct in “Device Configuration”.
Under “Device Configuration” filters can be applied by checking the “Filter Check”.

Page 11 of 12
11465 Sunset Hills Rd, Suite 200 Reston, VA 20190 (703) 714-1966 [email protected]
Acceptance Thresholds can be changed under “Settings” tab. Thresholds value and target value can
be changed .
Once all the changes are done, save the template.
In WindCatcher®PLUS, go to Reports Menu and run “LTE Acceptance Report” by double-clicking the
report from “Open Custom Report”.
Page 12 of 12
11465 Sunset Hills Rd, Suite 200 Reston, VA 20190 (703) 714-1966 [email protected]
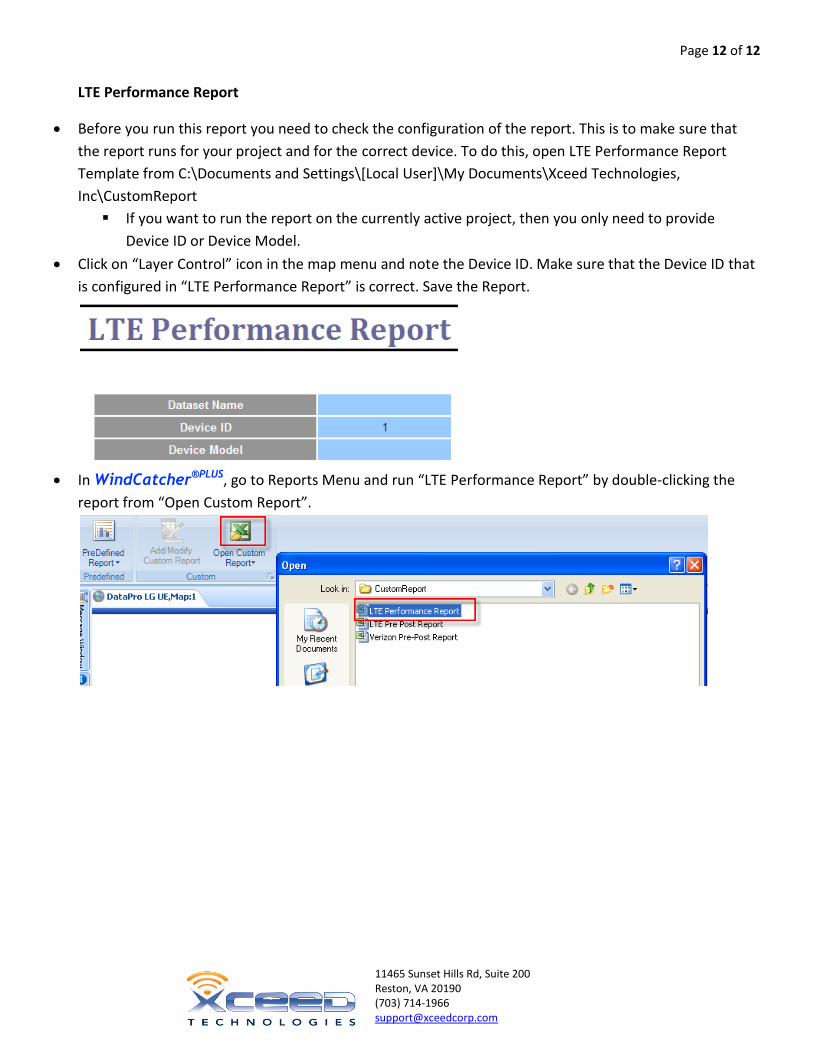
LTE Performance Report
Before you run this report you need to check the configuration of the report. This is to make sure that
the report runs for your project and for the correct device. To do this, open LTE Performance Report
Template from C:\Documents and Settings\[Local User]\My Documents\Xceed Technologies,
Inc\CustomReport
If you want to run the report on the currently active project, then you only need to provide
Device ID or Device Model.
Click on “Layer Control” icon in the map menu and note the Device ID. Make sure that the Device ID that
is configured in “LTE Performance Report” is correct. Save the Report.
In WindCatcher®PLUS, go to Reports Menu and run “LTE Performance Report” by double-clicking the
report from “Open Custom Report”.