customer effort: help or hype? - amazon s3 · pdf filecustomer effort: help or hype? 2 help or...
TRANSCRIPT

Professor Moira Clark and Andrew BryanThe Henley Centre for Customer ManagementApril 2013
Customer Effort: Help or hype?

2
Help or Hype
Table of contents1. Executive summary 3
2. Customer effort: the theory 5
2.1. What is customer effort? 5
2.2. Defining effort 6
2.2.1. Cognitive effort 7
2.2.2. Time effort 7
2.2.3. Emotional effort 7
2.2.4. Physical effort 7
2.3. Effort, involvement and risk 7
3. Customer effort: in practice 8
3.1. The research approach 8
3.2. Key findings 9
3.2.1. Why did you decide to invest in customer effort? 9
3.2.2. How do companies measure customer effort? 10
3.2.3. How to design customer experiences with customer effort in mind? 12
3.2.4. Is it a good metric or just hype and what is the impact on loyalty? 14
3.2.5. How does it fit with other measures such as ‘right first time’? 16
3.2.6. What are the benefits and what is the business case for customer effort? 17
3.2.7. What lessons can be learned from companies using customer effort? 18
4. Conclusions 19

3
Help or Hype
Executive summaryEffort is not new but its application to drive customer loyalty is.Customer effort research has been around since the 1940s but it wasn’t until the 2010 article ‘Stop Trying to Delight Your Customers’ in Harvard Business Review (HBR) [1] that the debate on effort began to gain some momentum. In particular, the HBR paper raised interest in how customer effort (CE) and, in particular, customer effort scores (CES) could be used as an indicator of customer loyalty.
Effort is worth the effort – it’s a key measure for loyalty, voice of the customer and actionable insight but is a stronger driver on negative experiences than the positive.The HBR article claimed that 94% of the customers who reported low effort expressed an intention to repurchase and 88% said they would increase their spending [1]. Conversely, 81% of customers who had a hard time solving their problems reported an intention to spread negative word of mouth.
This article has generated considerable debate and the purpose of this paper is to establish how measurement of effort is being used by early adopting companies. It was a drive to see how CE could be used to increase loyalty that motivated all the companies interviewed for this report. An attractive feature of CE over other established measures such as customer satisfaction (CSat) or net promoter score (NPS) is that it is not prescriptive but it does provide actionable insight. One of the strengths of CES is that it can be used throughout the customer experience journey to identify actions that need to be taken to make it easier for customers – from the overall experience to specifics like the website, contact centre and IVR.
‘Easy’ does it – rather than ‘effort’.Companies found that while CES is understandable to both customers and employees, more accurate results were achieved by phrasing the question as ‘how easy was it’ rather than ‘how much effort was needed’.
There are differences in emphasis between B2B and B2C companies – with B2C focused on service performance and B2B more on broader, continuous process improvement.For B2C (business to consumer) companies, implementation was focused on improving customer services whereas B2B (business to business) companies had a broader view of making their company easy to do business with. In both B2C and B2B companies, it was felt that using the term ‘easy’ was a lot more intuitive and understandable than ‘effort’, and an approach based on these questions was a good way to capture the voice of the customer.
Help or Hype
4
Help or Hype
B2B companies added effort questions to their existing customer service questionnaires. As business surveys are less frequent and based on smaller samples than B2C, B2B companies also introduced complaint tracking in order to support their aim to be easy to do business with.
It’s not a choice of CSat or NPS or CES, they all measure different things so the best answer is ‘measure all of them’.There was also a view that the question is not whether CES is better or worse than CSat or NPS as they measure different things. The answer was felt to be to ‘measure all of them’ and then be smart about interpreting the results!
A significant advantage of the CES approach is the ability to produce actionable data that can be used to help design customer experiences. Companies use NPS to provide a comparison of their company against others but they saw CES as an approach to drive improvements in services to customers. The B2C companies felt that the effort questions gave them a clear focus on their shortcomings. The B2B companies introduced effort questions as a key part of continuous improvement initiatives, starting in customer services before spreading through the company’s functions.
Effort and loyalty are correlated: it isn’t just hype!The B2C companies had data analysis to prove that the CES is a strong indicator of loyalty, particularly where there are high-effort experiences.
To quote BT, who have pioneered a customer “net easy score” in their organisation: ‘The rate of customer loss for the “easy” scores was found to be significantly less than for the others and showed a 40% reduction in their propensity to churn.’ Company C2 had similar findings: ‘It makes more sense to invest in the lower end of recommendation scores, minimising the “no” and “unlikely” responses, rather than moving customers from “probably” to “definitely”.’
In the B2B companies, effort questions added to annual surveys identified ‘trapped’ customers, i.e. those who indicated they would remain customers but were at risk if another supplier was available. These customers had previously been assumed to be loyal but the CES provided another view that they were unhappy and prepared to defect.
By looking at the findings of the B2C companies, it can be seen that the benefits from increasing loyalty by improving poor CE scores can be significant. None of the companies had to produce a financial case to justify investing in CE but it would not be difficult to measure how changes in CES reduce churn and then relate that to customer lifetime values.
In the B2B companies it was more difficult to assess churn and attribute changes to the CES but the companies believed that the benefits from their ‘easy to do business with’ programmes were significant and had specific examples where customer defections were prevented.
From ‘stop trying to delight your customers’ to ‘delight them where they value it’.There were many lessons learned by the early adopting companies and many of these are specific to the company’s circumstances. However, it was clear that the assertion in the original HBR article that companies should ‘stop trying to delight your customers’ [1] is partially true. The findings in this report suggest that it should be modified to ‘delight them where they value it’. The highest returns can be found by focusing in on areas where customers expect things to be easy but are finding them hard.

5
Help or Hype
2. Customer effort: the theory2.1. What is customer effort?Everyone, it seems, is talking about effort! But is effort worth the effort?
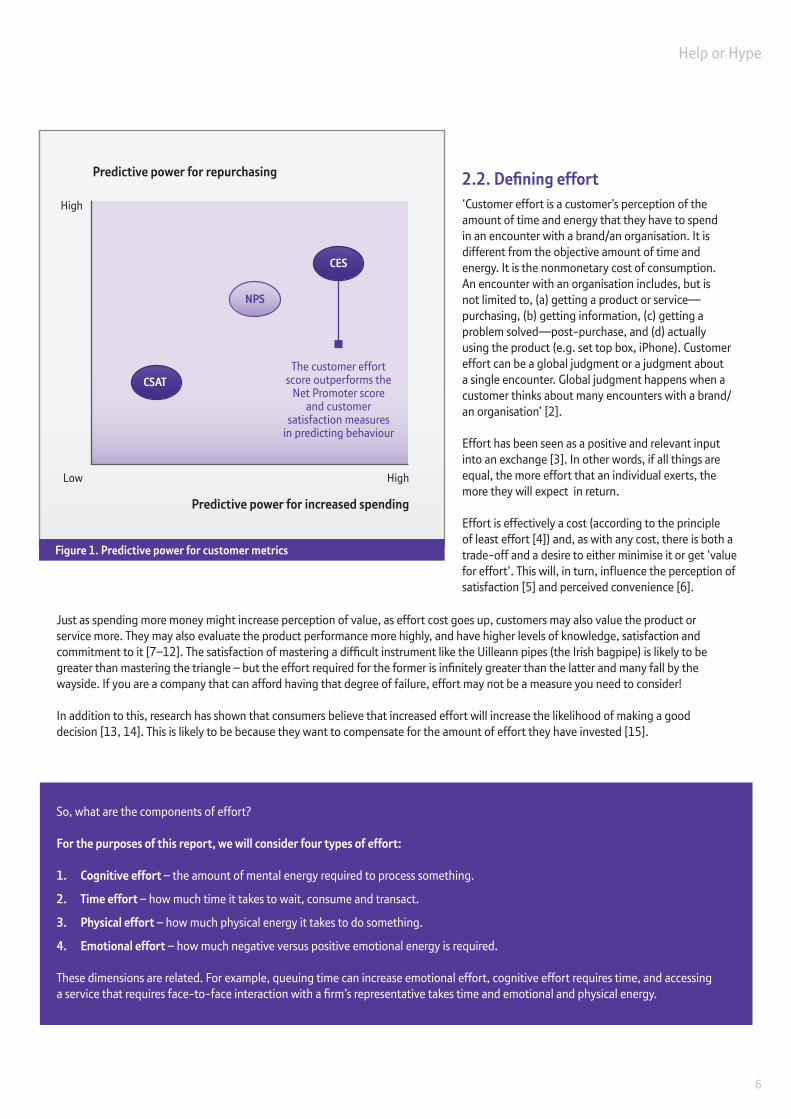
The discussion started after an article in Harvard Business Review (HBR) in 2010 [1] showed that reducing customer effort, i.e. the work customers must do to get their problems solved, was a better predictor of customer loyalty than trying to delight customers. Since it was published, this research has been met with great interest from those searching for the Holy Grail of how to build customer loyalty and profitability in these difficult economic times. The research findings were compelling. In a survey of 75,000 B2C and B2B customers, they found that the customer effort score (CES) outperformed the net promoter score (NPS) and customer satisfaction (CSat) measures in predicting the power of repurchasing and the power of increased spending. 94% of the customers who reported low effort, expressed an intention to repurchase, and 88% said they would increase their spending. However, of the customers who had a hard time solving their problems, 81% reported an intention to spread negative word of mouth (Figure 1, page 6). For this research CES is measured by one single question: ‘How much effort did you personally have to put forth to handle your request?’ This is measured on a scale from 1, ‘very low effort’ to 5, ‘very high effort’.But what is ‘effort’? What is the academic theory behind it? Who is using it? Is it worth the effort?
The research for this report is based on two sources of information:
• A literature review identifying the key academic views on CE (see section 2.2).
• Primary research with companies that have experience of applying CE scores or measurements within their businesses (see section 3).
6
Help or Hype
Just as spending more money might increase perception of value, as effort cost goes up, customers may also value the product or service more. They may also evaluate the product performance more highly, and have higher levels of knowledge, satisfaction and commitment to it [7–12]. The satisfaction of mastering a difficult instrument like the Uilleann pipes (the Irish bagpipe) is likely to be greater than mastering the triangle – but the effort required for the former is infinitely greater than the latter and many fall by the wayside. If you are a company that can afford having that degree of failure, effort may not be a measure you need to consider!
In addition to this, research has shown that consumers believe that increased effort will increase the likelihood of making a good decision [13, 14]. This is likely to be because they want to compensate for the amount of effort they have invested [15].
2.2. Defining effort ‘Customer effort is a customer’s perception of the amount of time and energy that they have to spend in an encounter with a brand/an organisation. It is different from the objective amount of time and energy. It is the nonmonetary cost of consumption. An encounter with an organisation includes, but is not limited to, (a) getting a product or service—purchasing, (b) getting information, (c) getting a problem solved—post-purchase, and (d) actually using the product (e.g. set top box, iPhone). Customer effort can be a global judgment or a judgment about a single encounter. Global judgment happens when a customer thinks about many encounters with a brand/an organisation’ [2].
Effort has been seen as a positive and relevant input into an exchange [3]. In other words, if all things are equal, the more effort that an individual exerts, the more they will expect in return.
Effort is effectively a cost (according to the principle of least effort [4]) and, as with any cost, there is both a trade-off and a desire to either minimise it or get ‘value for effort’. This will, in turn, influence the perception of satisfaction [5] and perceived convenience [6].
So, what are the components of effort? For the purposes of this report, we will consider four types of effort: 1. Cognitive effort – the amount of mental energy required to process something.
2. Time effort – how much time it takes to wait, consume and transact.
3. Physical effort – how much physical energy it takes to do something.
4. Emotional effort – how much negative versus positive emotional energy is required.
These dimensions are related. For example, queuing time can increase emotional effort, cognitive effort requires time, and accessing a service that requires face-to-face interaction with a firm’s representative takes time and emotional and physical energy.
Predictive power for repurchasing
Predictive power for increased spending
High
HighLow
CSAT
NPS
The customer effortscore outperforms the
Net Promoter scoreand customer
satisfaction measures in predicting behaviour
Figure 1. Predictive power for customer metrics
CES

7
Help or Hype
2.2.1. Cognitive effortCognitive effort is simply the amount of mental energy required to process information. If things aren’t simple, there is too much uncertainty or there is simply too much choice, and cognitive effort can be high. Cognitive or mental effort has been extensively researched in economic, psychology, marketing and decision theory [16]. Consumers are consistently described as having limited cognitive resources and are ‘cognitive misers’ who strive to reduce the amount of cognitive effort associated with decision making [17, 18]. For example, research has shown that individuals are willing to settle for imperfect decision accuracy in return for a reduction in effort [16, 19] – in other words, they don’t necessarily want the best answer, they often want the one that incurs the least decision cost and works [20]. This is particularly true when complexity is high, where there are numerous alternatives and/or where things are difficult to compare [21, 22]. It is this point that advice seeking occurs – whether this takes the form of ‘people like me like’ decision tools, comparison tools or simply asking an expert or a knowledgeable friend (or similar stranger, if social media are used).
2.2.2. Time effortTime effort is concerned with the amount of time that consumers think that it will take to do something (i.e. it is a perception rather than a reality – studies have shown that consumers significantly overestimate the time they spend waiting [23]). Queuing is one of the things that commonly come up as a major issue where time effort is concerned [24, 25]. This is often a design issue, with studies on the factors that influence consumers’ reactions to waiting showing that service, physical environment, distractions, perceived fairness, customer state of mind and availability of information can all be used to influence consumer perceptions of time [24, 26, 27]. This means that understanding time effort is not just about measuring the number of minutes taken to answer – it’s about perception.
2.2.3. Emotional effortAnxiety, stress, anger, fear, boredom and frustration are all psychological costs related to emotional effort [27, 28, 29]. These can be the result of:
• A problem with staff or other customers.
• The inability to access the right people, processes or procedures.
• Complaints not being properly dealt with.
• Failures in technology.
• Feelings of personal risk due to safety and security.
2.2.4. Physical effortPhysical effort is simply about the amount of physical energy that needs to be exerted to do something (e.g. lugging bulky goods around, having to walk long distances, having to physically go to the bank to verify identity instead of being able to do it through more convenient remote channels).
All these dimensions can be used to design easier customer journeys after the CES has been analysed and key drivers of effort identified from the data.
2.3. Effort, involvement and riskResearch has also shown a relationship between effort and involvement. The majority of purchases are low value and involvement and high frequency and familiarity. The decision process, therefore, is usually very simple and straightforward demanding very little in terms of time and effort. However, if customers are attempting to get to a goal that really matters to them and they have a high level of identification with that particular brand, they have both a higher level of involvement [30] and are also likely to have a higher perception of risk,especially if the product or service is complex, e.g. buying a car or getting a mortgage, or time dependent e.g. buying presents, going on holiday. It is important to mention that expense is not directly related to the amount of perceived risk. Choosing the correct toothpaste can represent a risk as huge as choosing a new television to some consumers [31]. An individual’s propensity to take or avoid risks can influence how much effort consumers are willing to invest and how satisfied they are [32].

8
Help or Hype
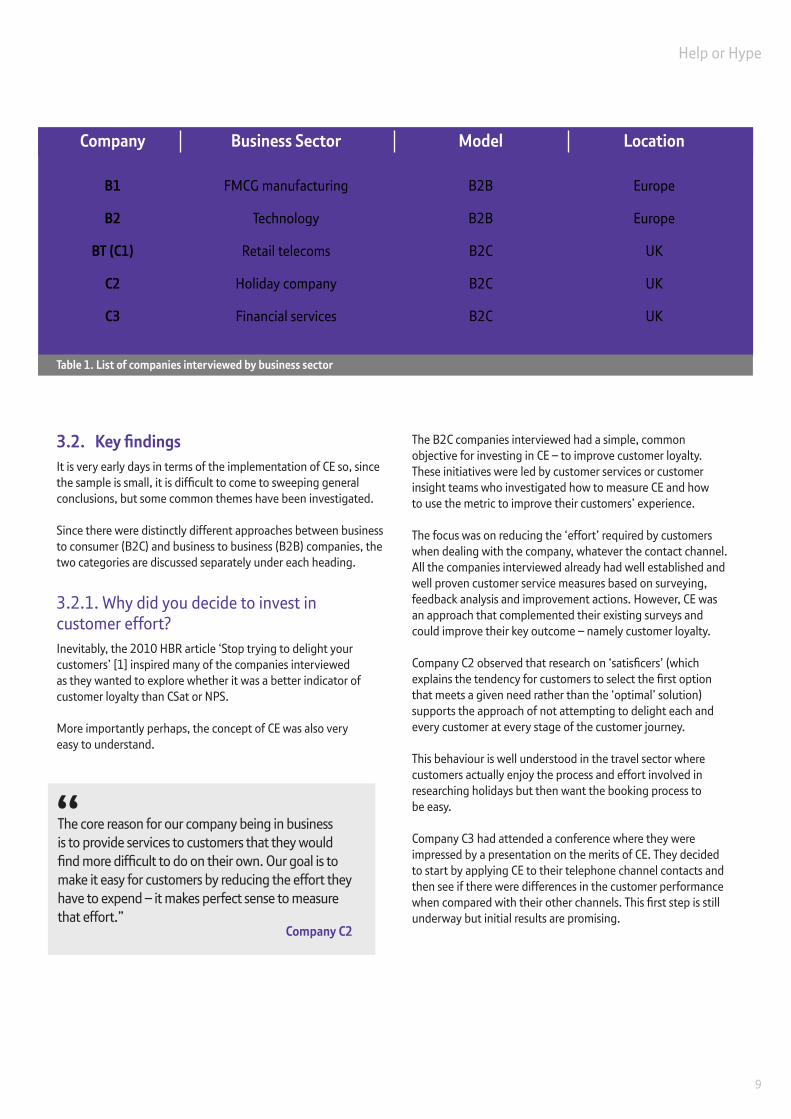
3. Customer effort: in practice3.1. The research approachThere are an increasing number of articles on the merits and application of customer effort (CE). These primarily relate CE to established customer service measures such as customer satisfaction (CSat) and net promoter score (NPS) and are largely opinions or thought pieces rather than objective research. Rather than include these, the approach taken in this paper was to interview companies who have practical experience of implementing CE within their organisation. These companies were interviewed using a semi-structured questionnaire and the results analysed to assess key learning points and to also provide insight and advice to companies considering adopting CE. BT was one of these companies and has elected to be identified in this study. However, the other companies involved have asked to remain anonymous. All the companies under study are listed in Table 1.
9
Help or Hype
3.2. Key findingsIt is very early days in terms of the implementation of CE so, since the sample is small, it is difficult to come to sweeping general conclusions, but some common themes have been investigated. Since there were distinctly different approaches between business to consumer (B2C) and business to business (B2B) companies, the two categories are discussed separately under each heading.
3.2.1. Why did you decide to invest in customer effort?Inevitably, the 2010 HBR article ‘Stop trying to delight your customers’ [1] inspired many of the companies interviewed as they wanted to explore whether it was a better indicator of customer loyalty than CSat or NPS. More importantly perhaps, the concept of CE was also very easy to understand.
The core reason for our company being in business is to provide services to customers that they would find more difficult to do on their own. Our goal is to make it easy for customers by reducing the effort they have to expend – it makes perfect sense to measure that effort.”
“
The B2C companies interviewed had a simple, common objective for investing in CE – to improve customer loyalty. These initiatives were led by customer services or customer insight teams who investigated how to measure CE and how to use the metric to improve their customers’ experience. The focus was on reducing the ‘effort’ required by customers when dealing with the company, whatever the contact channel. All the companies interviewed already had well established and well proven customer service measures based on surveying, feedback analysis and improvement actions. However, CE was an approach that complemented their existing surveys and could improve their key outcome – namely customer loyalty. Company C2 observed that research on ‘satisficers’ (which explains the tendency for customers to select the first option that meets a given need rather than the ‘optimal’ solution) supports the approach of not attempting to delight each and every customer at every stage of the customer journey. This behaviour is well understood in the travel sector where customers actually enjoy the process and effort involved in researching holidays but then want the booking process to be easy.
Company C3 had attended a conference where they were impressed by a presentation on the merits of CE. They decided to start by applying CE to their telephone channel contacts and then see if there were differences in the customer performance when compared with their other channels. This first step is still underway but initial results are promising.
Company
B1
B2
BT (C1)
C2
C3
Business Sector
FMCG manufacturing
Technology
Retail telecoms
Holiday company
Financial services
Model
B2B
B2B
B2C
B2C
B2C
Location
Europe
Europe
UK
UK
UK
Table 1. List of companies interviewed by business sector
Company C2

10
Help or Hype
The B2B companies’ expectations were that becoming ‘easier’ would have a positive impact on customer loyalty or, conversely, being seen as ‘difficult’ would have a negative effect. Both companies were conducting continuous improvement initiatives that were based on internal perspectives of process effectiveness. What they lacked was input from their customers and the CE approach seemed like a good way to capture the voice of the customer (VoC). At company B1, a cross-functional initiative was started with the objective of being easier to do business with. They had already refined processes to meet operational key performance indicators (KPIs) but wanted to move the focus externally to the things that mattered to their customers. Measuring CE was attractive as it provided a way of identifying the things that caused problems for their customers and, importantly, what changes needed to be applied to resolve them. Company B1 created an internal focus on being ‘easy’ and generated real brand equity for this programme across the organisation. In the way that most employees understand the need to check regulatory and legal considerations, B1’s aim was to get ‘easy’ into the same thought process.
The challenge was to establish a way of measuring effort, identify where improvements were needed and then measure the outcomes; they concluded that using a CE approach was the best way of bringing these aspects together.
Company B2 also had a corporate initiative aimed at being easy to do business with and identified CE as the most relevant measure to support this. The company already had an extensive customer satisfaction measurement process in place and CE questions were added to this. Both companies B1 and B2 found that it made more sense to phrase questions around ‘how easy is it to do business with us’ rather than ‘how much effort was required’. Rather than using the term ‘customer effort’ both companies used ‘easy’, because it was simple and easy to understand.
We realised that customers want transactions to be as easy as possible and this was not always the case.”
“
3.2.2. How do companies measure customer effort?Companies did not want to replace one metric with another or simply add another overall metric that did not provide actionable insight. Each company spent some time trialling and reviewing how an approach to customer effort would work for them.
The main considerations included:
• Consistent measurement to allow comparability across multiple channels.
• Defining the scope of the CE application – is it company-wide, applicable only to a specific function such as customer services or focused on a specific channel such as the telephone?
• How it fits alongside existing customer measures such as CSat and NPS.
• Ensuring outcomes are actionable.
• Establishing benchmarks in order to assess the impact of actions.
• Whether the 5-point scale used in the HBR article [1] was the most effective or whether other scales worked better.
The B2C companies interviewed recognised the need to ask CE questions at each customer touch point.
Company B1

11
Help or Hype
There is always a trade-off between the most effective scale and the accuracy of data collection. It is all too easy, for a start, to get the scales the wrong way around – comparing the scores with verbatim comments can reveal if people have mistakenly done this. The 7-point scale above was originally used by BT in places where the range of questions could be easily managed, e.g. on the website. However, the 7-point scale proved too unwieldy to use on the IVR system, so a simple three-question survey was used instead, i.e. easy, difficult or neither.
BT is also shifting their metrics away from internal process measurements to the things customers say they are concerned about. These are easily identified by simply asking customers ‘why?’ they have given the scores and analysing the verbatim comments. Customer response rates are good, with about 50% of those who take the survey also leaving a comment.
C3 introduced CE for their telephone channel contacts by capturing a single CES measure from customers at the end of each call. This is supported by an open question on why they gave that score. Their intention is to follow this up with further data analysis in order to identify significant issues and to track why changes occur. The measure is used to supplement their existing NPS and CSat scores.
Company C2 is still assessing how to measure CE and are looking at CES scales in relation to their existing survey questions and the insight they are looking for.
The B2B companies have incorporated ‘easy’ questions into their existing customer service questionnaires, using their existing 5-point scales. In their experience, NPS data were not actionable enough but did provide external benchmarks against competitors or ‘best in class’ companies. The favoured approach has been a combination of NPS and ‘easy’ (over ‘effort’ for the same reasons cited by the B2C companies).
Company B1 also tracked complaints as a rich source of information on ‘easy’ issues. They had been on a long journey to understand complaints by conducting root cause analysis. The complaints are reviewed monthly to see what problems are occurring. They then identify the causes and design solutions. Solutions to some complaints can have significant impact across the company but many are about smaller issues that can be resolved through incremental improvements. B1 realised that they had to change the way people think so that the impact of their processes on customers became a primary consideration.
We recognised that the customer effort approach provides a measurable basis, using our VoC insight, for driving the continuous improvement programme.”
“Company B1
Overall, how easy was it to get the help you wanted today?
Extremelyeasy
% easy % difficult Net easy score
Veryeasy
Fairlyeasy
Fairlydifficult
Verydifficult
ExtremelydifficultNeither
1 2 3 4 5 6 7
How wecalculate‘net easy’
Figure 2: BT’s net easy score
BT (C1) has developed their own ‘net easy’ metric, which is similar in structure to the NPS scale. They can apply this across all contact channels, including voice, web chat, online, email, social media, white mail and IVR.

12
Help or Hype
3.2.3. How to design customer experiences with customer effort in mind?The ability to capture actionable data was one benefit of the CE approach outlined in the HBR article [1], and this was emphasised by all the companies interviewed. Some of the companies are still in the process of figuring out how to apply the CE metrics and how to gain meaningful insight, but their clear intention is to use CE metrics to improve customer loyalty. BT (C1) started by understanding how customer journeys differ and how their respective effort scores also change relative to each other. This required the ability to cut and analyse the results by the types of experience being measured. For example, they conducted an analysis of the routes a customer took through the IVR system. By using natural language analysis, 200 distinct routes relating to what customers were trying to do were identified along with how easy it was to do it. The verbatim comments were then cross-referenced with each instance of a journey to produce trend insights.
Interviewees did make the point that the CE scores may not provide the whole answer. Companies need to go to all the other sources of data such as single contact resolution, success rates for transactions, process failure and repeat calls and triangulate these to ensure they understand the problems.
Company C2 use customer satisfaction questionnaires (CSQ) to collect customer data including the likelihood that they will recommend and the likelihood of a repeat holiday purchase. They survey at each step of the customer journey, from researching a holiday through to a post-holiday survey.
Outputs are collated to give average recommend and average repeat booking scores. Whilst this provides an indication of customer intentions, C2 recognise that ‘satisfaction’ scores alone do not provide actionable data and are not a great indicator of future customer behaviours.
Accordingly, C2 are currently exploring how CE could be incorporated in the questionnaires and how it can be used to provide more effective insight on CE at the various touch points. This insight will then be used to drive improvement to the customer experience across the contact channels. The same approach is being taken by C3 as they expect the ability to identify and improve problem areas to be the greatest benefits from implementing CES. The B2B companies were focused on improving their customer experience by being easy to do business with. The adoption of CE (or ‘easy’) was the approach that provided the insight to the areas where customers found processes difficult and therefore where the improvements should be made.
The best thing to measure is everything, and then be really intelligent about how you use what you have got.”
“
If customers who are calling to change the date of their bill are reporting poor net easy scores, the IVR performance can be checked and if, say, 40% of customers are breaking out to speak to an advisor as they wanted to do something else, Net Easy really helps home in on the areas to look at.”
“
BT (C1)
BT (C1)

13
Help or Hype
At B1, the ‘easy to do business’ programme was a company-wide programme, evangelised and led by Customer Services. The programme first identified where improvements were needed for each part of the organisation. They started with the supply chain processes and moved back through manufacturing to design so that eventually ‘easy’ became a key driver of process design decisions. Areas for change are now driven by customer feedback and could be anywhere in the company. The key to implementing CE improvements is to ensure cross-functional support. This is not always a natural response as organisations can operate in silos with their own objectives and metrics. It requires the whole organisation to commit to a customer-centric model for continuous improvement initiatives so that any conflicts between internal process and CE insight can be resolved.
One of the recommendations in the HBR article is to empower staff to resolve customer issues [1]. B1 have tried to include this but it is not as simple as saying ‘you are now empowered’ to their people. Changing behaviours from following a set of rules to allowing employees to decide for themselves what action to take is a lengthy process that requires training and support. The challenge is how to empower people to say ‘yes’.
Company B2 did not undertake customer research to such a granular level as B1 but they too were committed to producing actionable data. Their annual customer satisfaction programme is centrally defined and managed through a third-party agency. It is sophisticated and provides considerable data on ‘high risk’ customers, defined as those likely to either reduce spend or defect to the competition. A CE question has been introduced more recently and analysis conducted to assess how CE scores relate to customer loyalty. However, there are also ‘trapped’ customers who don’t currently have a choice about staying! These situations could be masked by the retention questions and analysis of the verbatim comments is likely to be the only way to understand why customers are staying with the company. Segmentation of customers by their risk of defection has been made possible through the combination of CE metrics and analysis of answers to ‘easy’ questions.
Ask a simple question like “Why shouldn’t we want to get every customer order delivered in full?”. The initial reaction was that it’s an unrealistic target while there are other initiatives around such as inventory reduction. Now the Supply Chain Director has an On Time In Full (OTIF) target. We have made “Easy” a philosophy that has been brought to life with ideas, responses and cross-silo working.”
“
We want to be effortless and easy to do business with, where every agent is empowered to say “yes”. We aim to get to the point where saying ‘no’ is almost a failure. I would prefer to forgive people for doing the right thing for the customer rather than not doing something.”
“
Company B1
Company B1

14
Help or Hype
BT (C1) also tested how much better CE is as a predictor of behaviour than customer satisfaction and the results were clear, particularly as an indicator of negative behaviours. The correlation between ‘satisfied’ or ‘extremely satisfied’ customers and those stating ‘it was easy’ was close (loyalty outcomes were similar). For ‘unsatisfied’ customers and those who found it ‘difficult’, the effort rating was a much better predictive factor on advocacy than those who were just disgruntled. In other words, a customer who assesses the company as ‘difficult’ is much more likely to defect than a customer who is ‘dissatisfied’. This makes CE a very powerful indicator. Further analysis by BT found that CE was also a key driver of Value for Money (VfM), which in turn is also a key driver for advocacy. This makes sense as if you think that service is a key aspect of ‘what you get for what you pay’; so if the service you are getting makes it easy, it bolsters the impression of VfM. BT found that of those who had a difficult experience only 5% felt the company offered good VfM. This means that it is almost impossible to foster a positive VfM attitude with customers who experience high effort. Accordingly, this makes these customers more susceptible to churn when another supplier offer comes along. Again, this makes CE a very powerful metric.
The impact of CE on loyalty has also been demonstrated. BT developed a model using six months of data to show net easy scores and the likelihood of still being a customer in six months’ time. This was based on actual retention data rather than customer future intentions (as tracked by NPS).
C2 wanted to understand value and relevance of the CES as part of their pre-implementation study. They analysed historical data from their CSQ surveys to identify how the ‘recommend’ score related to customers actual future bookings. The findings showed that the level of re-bookings flattened out at much lower ‘recommend’ scores than anticipated, indicating that delivering service levels that make people recommend strongly don’t have the same positive impact on increased spend (see Figure 3, page 15).
3.2.4. Is it a good metric or just hype and what is the impact on loyalty?The consensus of the B2C companies is that the claim made in the HBR article [1] that CES is a better indicator of customer loyalty than CSat and NPS is reasonable and supported by their own analysis. BT (C1) found that the initial premise of CE being a better predictor of loyalty is absolutely true and this was backed by their data analysis. After BT had been asking their net easy question for a while, all the data were taken from existing brand surveys that drive their NPS work. They analysed the data to identify which drivers are fuelling the advocacy score and identified those with most power to explain movements in advocacy. From this analysis, CE was equal first (along with brand warmth) for positive influence and clearly first for negative advocacy. This analysis provided the evidence that they were onto something.
The rate of customer loss for the “Easy” scores was found to be significantly less than for the others and showed a 40% reduction in their propensity to churn when compared to the “Difficult” scores.”
“
It is definitely not hype!”“ BT (C1)
BT (C1)

15
Help or Hype
This finding fits well with work conducted by Stewart & Clark Associates (S&C) into customer effort journey mapping. S&C have mapped customer expectations of effort at touch points on a customer journey against the actual effort experienced. Gaps between expectations and experiences are opportunities to either:
• Reduce CE where it is too high.
• Reduce service levels, and costs, where they exceed expectations.
This suggests that the title of the HBR article should really be ‘Delight your customers but only where they value it’ rather than ‘Stop trying to delight your customers’.
The B2B companies recognised that low effort is a driver of higher retention. However, their emphasis is more on continuous improvement of the customer experience and less on the CE score as an indicator of future behaviours. Even though B2 was surveying 100,000 customers globally, B2B companies typically have a smaller customer sample size than B2C. Nevertheless, the B2B companies believed that there was real value in using the CE metric, whether it is called ‘CE’ or ‘easy’, as it could be used to identify what customers were most concerned about. B2 have used their CSQ data to test the relationship between CE and loyalty, where loyalty is defined as increased purchases or recommendations. They have demonstrated that customers who rate the company as easy to do business with have a much greater intention to increase their share of wallet with B2 than customers who do not find the company easy to deal with. This means that customers who expect to increase their technology spend are unlikely to spend more with difficult companies, opting to increase spend with competitors considered easier to do business with. Again, the negative consequences of high-effort experiences are greater than the positive.
This analysis seemed to agree with the conclusion of the HBR article that customers mainly want the basics done well and not the bells and whistles. This finding was controversial as the company was striving for ever higher service levels. C2’s research showed that although enhanced service levels may lead to higher recommendation scores, once you reach the point where people are fairly satisfied the percentage of re-bookings does not substantially increase. This analysis gave the company momentum to continue to look into CE as an approach that would provide insight on where to focus their customer service improvements.
It makes more sense to invest in the lower end of recommendation scores, minimising the “No” and “Unlikely” responses, rather than moving customers from “Probably” to “Definitely.”
“Company C2
Figure 3. Relationship between recommend scores and revenue
Would you recommend us to friends and family?
No Unlikely Possibly Probably Definitely
Aver
age
reve
nue
from
subs
eque
nt b
ooki
ngs

16
Help or Hype
3.2.5. How does it fit with other measures such as ‘right first time’?Many companies have been running right first time (RFT) or continuous improvement (CI) initiatives over the last decade and there is clear evidence to support investment in this area to make sure that products and services do what they claim. It is about getting the basics right, and if these are not in place designing low-effort experiences will not help. There has been a shift in customer service metrics away from quantitative measurements (how fast, how many) to qualitative measurement (how well). Improvements driven by these approaches often showed improved NPS but not as much as was expected.
Another measure often targeted was one contact resolution (OCR) but this and RFT are measures of process performance and not customer experience, hence there was always a disconnect when trying to improve loyalty. This is where CE (or ‘easy’) comes in as companies recognised it as a better indicator of advocacy and loyalty than satisfaction. The other advantage of CE is its actionability. Companies could use VoC measures such as VfM or satisfaction but none are as actionable as CE for customer service organisations.
For example, if a satisfaction measure is used it could be well correlated to KPIs but it would not tell you what to do.
At C2, customer service teams have operational measures like first call resolution (FCR) that serve their operational purposes.
From a service perspective at B1, brand equity has helped ‘easy’ to be adopted across the organisation, and the next step is to get to the point where things are signed off by the ‘easy’ team.
In B1, customer services had started a customer-facing initiative focused on being easy to do business with. This was linked with a corporate initiative called ‘getting work out’, based on LEAN process improvements. These two programmes were brought together to identify process changes that reduce CE. Customers were invited to workshops and asked where the company was not easy to do business with and this gave lots of good insights, which enabled process improvements to be prioritised.
We had a lot of effort and investment into RFT, made great strides by eliminating failures and improving the customer experience but didn’t make as much impact as we expected on our key measure – advocacy.”
“
Net easy feels like the best measure as it has a good correlation with advocacy and can be trusted in good times and bad.”
“BT (C1)
BT (C1)

17
Help or Hype
3.2.6. What are the benefits and what is the business case for customer effort?None of the companies interviewed had prepared a formal business case that included a rigorous investment appraisal. Investment in CE was generally considered to be within their strategic objective to grow revenue by retaining existing customers as well as winning new customers. All the companies interviewed were already investing time and resources in improving their customer experience scores and adopting the CE approach was seen as a helpful addition. Some business cases were prepared in order to assess how CE could be adopted and the implications for the organisation but these were not financially driven.
The availability of customer service data at the B2C companies has enabled them to analyse customer behaviour in some detail. BT (C1) can now calculate a clear ROI from these figures by applying average lifetime value of customers to the changes in retention gained from CE improvements.
Company C3 did not prepare a business case as they felt the justification was clear and implementation was relatively low cost and risks were also low.
At the B2B companies the CE approach was part of an ongoing corporate initiative to be easy to do business with and there was no single business case. Where areas for improvement are found the remedial actions are identified and approved on a case by case basis.
At company B2, the annual customer satisfaction programme captures CE scores for the main customer-facing processes and functions. B2 now analyse these data in order to reveal the areas they need to improve. These could be functions such as ‘technical support’ or processes such as ‘time and effort to order’. Having identified poor CE scores for a specific function or process, an initiative is then put in place to identify the cause and implement a solution. As B2 is a global company with many global processes, their approach to changing processes to reduce CE is also global.
An example was credit control – 5% of orders held for credit checking were delayed by one day and this was not helping customers. A member of the credit department established a way of protecting the company by credit checking while ensuring we remained Easy. The number dropped from 5% to a tiny figure. The key to resolving this was recognising that the credit hold could jeopardise a consignment making the shipment date and ensuring that didn’t happen by looking across the organisation rather than within a department.”
“
Company B1

18
Help or Hype
3.2.7. What lessons can be learned from companies using customer effort? Each of the companies interviewed were asked to share the lessons they had learned in implementing customer effort. For the B2C companies, the lessons were:
• Analysis of the CE metrics can be a great attention getter and can target where customers are finding things less than easy so that practical improvements can be made.
• Be prepared to evolve how to measure CE/‘easy’ and how to make it more effective – even simple things like whether a 3-, 5- or 7-point scale is appropriate.
• If CE is to be used as a measure to target individual performance or measure performance between teams, then it has to be seen to be fair and entirely within their control. In particular, there needs to be a distinction between how easy it was to interact with the contact centre adviser versus how easy it was to navigate through the processes associated with the contact.
• Effort initiatives need to be effectively communicated internally in order for everyone to understand their potential impact on the business.
• Suggesting that people should ‘stop trying to delight your customers’ might be counter-intuitive, especially since many companies have emphasised the importance of customer service excellence over the past few years. The challenge now is to identify where customers expect low or high effort experiences and deliver against these expectations.
B2B companies:
• In the B2B world, customers can interact with many different parts of a supplier company. This means that functions like accounts and logistics need to be as easy to interact with as the account teams. Effectively, the CE approach requires the B2B companies to design their processes around their customers’ needs rather than for their own internal functional needs. This is often referred to as being a ‘customer-centric’ company although the phrase used to drive process improvements was ‘being easy to do business with’.
• Since ‘easy’ needs to be a cross-departmental initiative, the way that it is branded and communicated internally is really important in order to get buy-in and support. It needs to start as a change programme but transform into the way the company does business.
• Reinforce ‘easy’ philosophies by marketing successes both internally and externally.
• Ensure there is an ‘easy’ champion to provide the vision and direction of the programme so people see the value in it.
• Top level support and buy-in is essential and decision-making points require stakeholders with the authority to say ‘yes’ or ‘no’ to implementing solutions.
• Challenge clashes with other initiatives, especially where some run in opposite directions, such as cost cutting. Try to ensure they do not erode each other.
• Look at how to incorporate insight on effort into customer surveys with a particular emphasis on identifying process changes that can reduce effort.
• Involve customers in the process. Get their input into possible solutions and keep them informed on what you are doing about the things they raise.
• Use customer feedback to demonstrate the impact of the changes.
• Looking at customer comments at a global level requires analytics in order to find comments on specific topics and ensure they are actionable.
It’s about being able to identify where to put in effort that the customer will appreciate and where it makes no difference. An example of this is an IVR experience survey that includes rating the music played while on hold – this is the wrong question and is always scored low whatever the music!”
“
Company C2

19
Help or Hype
4. ConclusionsThe findings of this research point strongly towards ‘effort’ (or ‘easy’) being a good indicator of customer loyalty.
The companies that have applied it are finding that ‘effort’ is providing them with loyalty data that goes beyond customer intention (which is where NPS works) and into actual customer behaviour. The data also show that the negative consequences of high effort experiences are greater than the positive. A customer who assesses a company as ‘difficult’ is much more likely to defect than a customer who is ‘dissatisfied’. However, the positive impact of ‘low-effort’ experiences has similar prediction accuracy to CSat and NPS. This is possibly due to the fact that customers often expect ‘easy’ experiences.
However, it also points towards the fact that ‘customer delight’ may not add a huge amount to loyalty behaviours. The HBR article [1] suggested that we should ‘stop trying to delight customers’. This research suggests that the better strategy might be ‘delight your customers, but only where they value it’. This may run as counter-intuitive to many customer service excellence strategies. The challenge now is to identify where customers expect low- or high-effort experiences and deliver against these expectations.
Effort also links into perceptions of value for money – as it is almost impossible for customers to believe that they are getting VfM if they have to expend a great deal of effort to get to their goals. Customers are unlikely to spend more with difficult companies, opting to increase spend with competitors considered easier to do business with. Another common view across the companies interviewed is that the question ‘how easy is it …’ is much more effective than ‘how much effort …’. Not only is this a more positive question, it was also easier for customers to understand.The examples of areas for focus suggested by the original HBR paper, including things like better trained and more knowledgeable staff, are certainly relevant. However, the advantage of the CE approach is that it is not prescriptive and allows companies to identify and correct the issues that are applicable to them. One size doesn’t fit all in implementing a CE approach. Effort can be used to help identify changes that are required to individual channels, such as the contact centre, the website or IVR, but can also be used as a company-wide continuous improvement programme.
The conclusion of all the companies interviewed was that customer effort is worth the effort and produces tangible benefits. These benefits could be seen by direct measures, such as changes in customer retention figures, or by indirect measures such as reduction in complaints or increase in positive word of mouth.

20
Help or Hype
References[1] Dixon, M, Freeman, K & Toman, N (2010) STOP trying to delight your customers. Harvard Business Review, 88 (7/8), 116–22
[2] Clark, M (2012) Customer Effort. Henley Centre for Customer Management report. Henley Business School, University of Reading
[3] Oliver, R L & Swan, J E (1989) Consumer perception of interpersonal equity and satisfaction in transactions: a field survey approach. Journal of Marketing, 53 (2), 21–35
[4] Zipf, G K (1949) Human Behavior and the Principle of Least Effort. Cambridge, MA: Addison-Wesley
[5] Lovelock, C H (1994) Product Plus: How Product + Service = Competitive Advantage. New York: McGraw-Hill
[6] Seiders, K & Berry, L L & Gresham, L (2000) Attention retailers: how convenient is your convenience strategy? Sloan Management Review, 49 (3), 79–90
[7] Cardozo, R N (1964) Customer satisfaction: laboratory study and marketing action. Proceedings, Educators Conference. American Marketing Association
[8] Cardozo, R N (1965) An experimental study of customer effort, expectation, and satisfaction. Journal of Marketing Research, 2 (3), 244–9
[9] Cardozo, R & Bramel, D (1969) The effect of effort and expectation on perceptual contrast and dissonance reduction. Journal of Social Psychology, 79, 55–62
[10] Woodside, A G (1972) Positive disconfirmation of expectation and the effect of effort on evaluation. Proceedings of the 80th Annual Convention. American Psychological Association, pp743–4
[11] Kruger, J, Wirtz, D, van Boven, L & Altermatt, T W (2004) The effort heuristic. Journal of Experimental Social Psychology, 40 (1), 91–8
[12] Hanna, N (1978) Can effort/satisfaction theory explain price/quality relationships?” Journal of the Academy of Marketing Science, 6 (1), 91–100
[13] Bechwati, N N & Xia, L (2003) Do computers sweat? The impact of perceived effort on online decision aids on consumers’ satisfaction with the decision process. Journal of Consumer Psychology, 13 (1&2), 139–48
[14] Todd, P & Benbasat, I (1999) Evaluating the impact of DSS, cognitive effort and incentives on strategy selection. Information Systems Research, 10 (4), 356–74
[15] Labroo, A A & Kim, S (2009) The ‘instrumentality’ heuristic: why metacognitive difficulty is desirable during goal pursuit. Psychological Science, 20 (1), 127–34
[16] Bettman, J R, Johnson, E J & Payne, J W (1990) A componential analysis of cognitive effort in choice. Organizational Behavior and Human Decision Processes, 45 (February), 111–39
[17] Shugan, S M (1980) The cost of thinking. Journal of Consumer Research, 7 (2), 99–111
[18] Fennema, M G & Kleinmuntz, D N (1995) Anticipations of effort and accuracy in multiattribute choice. Organizational Behavior and Human Decision Processes, 63 (July), 21–32
[19] Johnson, E J & Payne, J W (1985) Effort and accuracy in choice. Management Science, 31 (4), 395–414
[20] Haubl, G & Trifts, V (2000) Consumer decision making in online shopping environments: the effects of interactive decision aids. Marketing Science, 19 (1), 4–21
[21] Payne, J W, Bettman, J R & Johnson, E J (1993) The Adaptive Decision Maker. Cambridge: Cambridge University Press
[22] Estelami, H (2003) The effect of price presentation tactics on consumer evaluation effort of multi-dimensional prices. Journal of Marketing Theory and Practice, 11 (2), 1–15
[23] Hornik, J (1984) Subjective vs. objective time measures: a note on the perception of time in consumer behaviour. Journal of Consumer Research, 11 (1), 615–18
[24] Durrande-Moreau, A & Usunier, J-C (1999) Time styles and the waiting experience. Journal of Service Research, 2 (2), 173–86
[25] Katz, K L, Larson, B M & Larson, R C (1991) Prescription for the waiting-in-line blues: entertain, enlighten, and engage. Sloan Management Review, 32 (2), 44–53
[26] Pruyn, A & Smidts, A (1998) Effects of waiting on the satisfaction with the service: beyond objective time measures. International Journal of Research in Marketing, 15 (4), 321–34
[27] Taylor, S (1994) Waiting for service: the relationship between delays and evaluations on service. Journal of Marketing, 58 (2), 56–69
[28] Dubé-Rioux, L, Schmitt, B H & Leclerc, F (1989) Consumers’ reaction to waiting: when delays affect the perception of service quality. In: T S Srull (ed) Advances in Consumer Research, 16. Provo, UT: Association for Consumer Research, pp112–25
[29] Kumar, P, Kalwani, M U & Dada, M (1997) The impact of waiting time guarantees on consumer waiting experiences. Marketing Science, 16 (4), 295–314
[30] Engel, J F, Blackwell, R D & Miniard, P W (1995) Consumer Behaviour, 8th ed. Orlando, FL: The Dryden Press, pp441–2
[31] Schiffman, L G & Kanuk, L L (1997) Comportamento do Consumidor, 6th ed. (Tradução: Vicente Abrosio) Rio de Janeiro: LTC
[32] Sitkin, S B & Pablo, A L (1992) Reconceptualizing the determinants of risk behaviour. Academy of Management Review, 17 (1), 9–39
Thanks to: Joanna Howard, Warren Buckley and Nicola Millard from BT and the other respondents who preferred to remain anonymous.

21
Help or Hype
About the Henley Centre for Customer ManagementThe primary objective of the Henley Centre for Customer Management (HCCM) is to promote customer focus and service excellence best practice. It does this by observing practice in leading companies and synthesising this into useful knowledge that helps members to improve their own customer management and customer service plans and implementations. The Centre, under the directorship of Professor Moira Clark, provides a genuine opportunity to harness the forward thinking that could put you ahead of your competition. It brings together business practitioners, industry thought leaders and experts/academics to help organisations to tackle today’s business challenges through an ongoing programme of workshops and highly focused research projects.
This Centre is one of a number of successful centres of excellence run by Henley Business School, one of Europe’s leading business schools with a global reputation for applied management research and an unparallelled reputation in UK board rooms. They align with the aim of Henley Business School to deliver high quality contributions to thought leadership, through research into the management of organisations.
Benefits of membership include involvement in the research programme, early access to the results, access to the members-only website, reports and papers and attendance for up to three delegates at a series of hands-on workshops.To find out more about the Centre, please visit www.hccmsite.co.uk
DisclaimerHCCM has taken all reasonable care and skill in the compilation of this report; however, HCCM shall not be under any liability for loss or damage (including consequential loss) whatsoever or howsoever arising as a result of errors or omissions or the use of this publication by the customer, his servants, agents or any third party.
The analysis and views expressed within are those of the authors based on their experience and recent discussions in the marketplace relating to the implementation of customer management. These views are, by their very nature, evolving on a constant basis.

Offices worldwide
The telecommunications services described in this publication are subject to availability and may be modified from time to time. Services and equipment are provided subject to British Telecommunications plc’s respective standard conditions of contract. Nothing in this publication forms any part of any contract.
© British Telecommunications plc 2012 Registered office: 81 Newgate Street, London EC1A 7AJ Registered in England No: 1800000
Bringing it all together