customer influence value and purchase acceleration in...
TRANSCRIPT

Vol. 31, No. 2, March–April 2012, pp. 236–256ISSN 0732-2399 (print) � ISSN 1526-548X (online) http://dx.doi.org/10.1287/mksc.1110.0701
© 2012 INFORMS
Customer Influence Value and PurchaseAcceleration in New Product Diffusion
Teck-Hua HoNational University of Singapore, Singapore 119077; and University of California, Berkeley, Berkeley, California 94720,
Shan LiPhilips Research North America, Briarcliff Manor, New York 10510, [email protected]
So-Eun ParkHaas School of Business, University of California, Berkeley, Berkeley, California 94720, [email protected]
Zuo-Jun Max ShenDepartment of Industrial Engineering and Operations Research, University of California, Berkeley, Berkeley, California 94720,
When social influence plays a key role in the diffusion of new product, the value of a customer often goesbeyond her own product purchase. We posit that a customer’s value (CV) comes not only from her pur-
chase value (PV) but also from her influence value (IV) (i.e., CV = PV+ IV). Therefore, a customer’s value can befar greater than her purchase value if she exerts a considerable influence on others. Building on a two-segmentinfluential–imitator asymmetric influence model, we develop a model framework to derive closed-form expres-sions for PV, IV, and CV by customer segment as well as time of adoption, and we examine their comparativestatics with respect to the diffusion parameters. A key parameter of our model framework is the social appor-tioning parameter, �, which determines the credit a customer receives by influencing other potential adopters.We develop an endogenous method for determining � as a function of the new product diffusion parameters.Our model framework allows us to investigate how a firm might accelerate product purchases by providingintroductory discount offers to a targeted group of potential adopters at product launch. We find that purchaseacceleration frequently leads to a significant increase in total customer value.
Key words : new product diffusion; purchase value; influence value; purchase accelerationHistory : Received: April 15, 2010; accepted: November 26, 2011; Eric Bradlow and then Preyas Desai served as
the editor-in-chief and Christophe Van den Bulte served as associate editor for this article. Published online inArticles in Advance February 16, 2012.
1. IntroductionNew product diffusion is central to marketing. Mar-keting scientists have been interested in investigatinghow the diffusion of new product actually occurs andhow firms can actively influence it. It is well knownthat social contagion plays a key role in how rapidlya new product diffuses. As a consequence, the value afirm derives from a specific customer goes beyond herown individual product purchase (Libai et al. 2009).To understand the precise role of social contagion,we develop a new model framework for quantifyingthe value of a customer in new durable product cat-egories where social contagion is prevalent. Specifi-cally, we posit that a customer’s value (CV) is the sumof her purchase value (PV) and influence value (IV).Formally stated, we have
CV = PV + IV0
Positive social contagion in the diffusion of newproduct has two distinct benefits. First, it could poten-tially increase the total number of adopters for a new
product. Customers who otherwise would not havebought the product might now change their mindbecause of the positive feedback. Second, positivefeedback may dramatically reduce potential adopters’timing of adoption. Uncertainty about the new prod-uct’s benefits may be reduced by social contagion,and as a consequence, potential buyers may speedup their adoption process. This uncertainty reduc-tion leads to purchase acceleration that in turn com-presses the new product’s life cycle. In this paperwe focus exclusively on the second benefit and ana-lyze the effect of social contagion on the timingof new product adoption and total customer value.We will characterize PV, IV, and CV in the contextof the asymmetric influence model (Van den Bulteand Joshi 2007), where the total number of potentialadopters is fixed but customer heterogeneity is explic-itly modeled.
Following the asymmetric influence model byVan den Bulte and Joshi (2007), we divide potentialadopters into two distinct segments: the influentials
236
Ho et al.: Customer Influence Value and Purchase Acceleration in New Product DiffusionMarketing Science 31(2), pp. 236–256, © 2012 INFORMS 237
and the imitators segments. Each segment of potentialadopters has its own respective within-segment inno-vation and imitation parameters, and it experiences aBass-type diffusion process. In addition, the influen-tials segment can exert a cross-segment influence onthe imitators segment, but not vice versa. We use thisasymmetric influence model for three reasons:
1. A diffusion process that comprises a mixture ofinfluentials and imitators appears to be consistent withseveral extant theories in sociology and new productdiffusion research (Van den Bulte and Joshi 2007).
2. A diffusion structure with asymmetric interac-tion between two customer segments is not onlygeneral but also analytically tractable. It can cap-ture the traditional symmetric-around-the-peak bellshape, asymmetric bell shapes, and a dip or “chasm”between the early and later parts of the diffusioncurve (Muller and Yogev 2006, Peres et al. 2010).As a consequence, the diffusion structure has a wideapplicability.
3. The proposed diffusion structure is an elegantway to incorporate heterogeneity and allows us toanalytically investigate how a firm might allocatescarce promotion dollars to different customer seg-ments at product launch in order to accelerate productpurchases for profit maximization.
We use the above asymmetric influence model tocharacterize the dynamics of PV, IV, and CV by cus-tomer segment. These characterizations yield insightson how purchase and influence values interact overtime. Our model framework shows that a natu-ral way to increase CV is to amplify social conta-gion by offering introductory discounts to a targetedgroup of potential adopters at product launch (Marksand Kamins 1988, Van Ackere and Reyniers 1995,Jain et al. 1995, Lehmann and Esteban-Bravo 2006).Indeed, such purchase acceleration strategy is quiteprevalent. For example, publishers sometimes offerintroductory discounts on new college textbooks inorder to accelerate their diffusion processes. Similarly,when Hasbro launched a new handheld video gamecalled POX in 2001, they chose 1,600 kids to be theiragents of social contagion, each armed with a back-pack filled with samples of games to be distributed totheir friends (Godes and Mayzlin 2009). Other exam-ples include the widespread use of sending a new CDto a selected group of individuals for free when theCD is released.
This paper makes three contributions:1. This paper posits that CV = PV + IV and devel-
ops a model framework for determining the value ofa customer where social contagion plays an impor-tant role in new product adoption. Building on therecent asymmetric influence model by Van den Bulteand Joshi (2007), we derive closed-form expressionsfor PV, IV, and CV by customer segment and time
of adoption. To the best of our knowledge, this is thefirst attempt to develop formal metrics for a firm toexplicitly apportion a part of a customer’s purchasevalue to her influencer and to formally quantify a cus-tomer’s influence value over a product’s life cycle.
2. We show that PV, IV, and CV always decrease ina convex manner with adoption time. Hence an earlyadopter is much more valuable than a late adopter.We show that if the influentials segment has a highcross-segment influence on the imitators segment, theCV of the latter segment drops.
3. We show how a firm can significantly increasethe total CV of its entire customer base by offer-ing introductory price discounts to a targeted groupof customers at product launch. We characterize theoptimal size of invited customers in terms of the levelof price discount, innovation parameters, and imita-tion parameters. The total CV increases because thefirm frequently gains more from increased IV than itloses from PV as a result of introductory discounts.As a consequence, invited early adopters becomeeven more valuable.
The remainder of this paper is organized as fol-lows. Section 2 describes the proposed modelingframework. Section 3 analyzes the influence of pur-chase acceleration on the total customer value. Sec-tion 4 summarizes and discusses potential directionsfor future research. All proofs are presented in theappendix.
2. The ModelConsider a firm that introduces a new product to afixed pool of potential adopters. We categorize poten-tial adopters into two distinct segments: influentialsand imitators (Van den Bulte and Joshi 2007). We usetype 1 to denote the influentials segment and type 2to denote the imitators segment. Each segment fol-lows its own Bass-type diffusion process. Moreover,type 1 can exert cross-segment influence on type 2,but not vice versa. Figure 1 shows the social influencestructure.
We use subscripts 1 and 2 to denote each typeof potential adopters, respectively, and subscript mto denote the combined population. �1 is the pro-portion of type 1 potential adopters (0 ≤ �1 ≤ 1),and �2 = 1 − �1 is the proportion of type 2 potential
Figure 1 Influentials and Imitators
Influentials(Type 1)
Imitators(Type 2)

Ho et al.: Customer Influence Value and Purchase Acceleration in New Product Diffusion238 Marketing Science 31(2), pp. 236–256, © 2012 INFORMS
adopters in the combined population. fi4t5 and Fi4t5denote the instantaneous adoption rate and cumula-tive adoption for type i at time t, respectively. Theinstantaneous adoption rates for each type and thecombined population are captured by the followingequations:
f14t5= 4p1 + q1F14t5541 − F14t551 (1)
f24t5= 4p2 + qcF14t5+ q2F24t5541 − F24t551 (2)
fm4t5= �1f14t5+ �2f24t50
Parameters pi and qi (i = 112; p1 > 0, p2 ≥ 0, andq11 q2 ≥ 0) are type i’s innovation and within-segmentimitation parameters, respectively. As type 2’s adop-tion behavior can also be influenced by type 1, we useqc 4≥ 05 to denote the cross-segment imitation param-eter. Equation (1) suggests that an influential’s like-lihood of adopting at time t given that she has notadopted before t is determined by her intrinsic moti-vation and the within-segment social influence at thattime. Equation (2) indicates that an imitator’s likeli-hood of adopting at t given that she has not adoptedbefore t depends on her intrinsic motivation as well asthe social influence from both the influentials segmentand the imitators segment at that time (Goldenberget al. 2009).
Note that when �1 = 0 or �1 = 1, all potentialadopters fall into a single segment, and the model isreduced to the traditional Bass diffusion model (Bass1969). When 0 < �1 < 1 and qc = 0, the two segmentsof potential adopters are disconnected, and each seg-ment experiences its own Bass-type diffusion process.
If there are no prerelease purchases (i.e., F1405 =
F2405 = 0), the cumulative adoption at t can bewritten as
F14t5=1 − e−4p1+q15t
1 + 4q1/p15e−4p1+q15t
1 (3)
F24t5= 1 +
(
e−4p2+q2+qc5t
(
1 +q1
p1e−4p1+q15t
)−qc/q1)
·
(
q2
∫ t
0e−4p2+q2+qc5s
(
1+q1
p1e−4p1+q15s
)−qc/q1
ds
−
(
1 +q1
p1
)−qc/q1)−1
1 (4)
Fm4t5= �1F14t5+ �2F24t50
The instantaneous and cumulative adoption func-tions for the asymmetric influence model arepresented in Figures 2(a) and 2(b), respectively. Thefigures are plotted using the average parametric val-ues of the annual data presented in Van den Bulte
and Joshi (2007); i.e., p1 = 0006, q1 = 0065, p2 = 0002,q2 = 1003, qc = 0062, and �1 = 0054. In this averagescenario, the imitators segment has a lower innova-tion parameter but a higher within-segment imitationparameter than the influentials segment (i.e., p1 > p2
and q1 < q2). Figure 2(a) shows that the diffusion pro-cesses are all bell shaped, each with a single peak.The instantaneous adoption rate of the combined pop-ulation exhibits a clear skew to the right. In Fig-ure 2(b), the imitators’ cumulative adoption is alwayshigher than the influentials’ cumulative adoption atany time t because the former has a faster diffusionprocess as a result of both within- and cross-segmentsocial contagion.
2.1. The Social Influence ChainOur model implies a social influence chain. Considera potential adopter, Betty, who buys at time t. Bettyplays two roles in the social influence chain of thediffusion process. On one hand, she might have been
Figure 2 Instantaneous and Cumulative Adoption Functions for theAsymmetric Influence Model
00
0.05
0.10
0.15
0.20
0.25
0.30
0.35
0.40
f(t)
F(t
)
2 4 6 8 10 12 14
Influentials
Imitators
Total
16 18 20
t
00
0.1
0.2
0.3
0.4
0.5
0.6
0.7
0.8
0.9
1.0(b)
(a)
2 4 6 8 10 12 14 16 18 20
t
Note. p1 = 0006, q1 = 0065, p2 = 0002, q2 = 1002, qc = 0062, and �1 = 0054.

Ho et al.: Customer Influence Value and Purchase Acceleration in New Product DiffusionMarketing Science 31(2), pp. 236–256, © 2012 INFORMS 239
influenced by a previous adopter, and thereby she isan influencee. On the other hand, she can exert socialinfluence after her purchase and become an influencerof others. Consequently, she will have her own influ-encees. We assume that an individual can have mul-tiple influencees but can only be influenced by atmost one influencer (i.e., she may adopt the prod-uct without others’ influence). As a consequence ofheterogeneity and asymmetric social influence, thereare three types of contagion processes: (1) influenceris type 1 and influencee is type 1, (2) influencer istype 1 and influencee is type 2, and (3) influencer istype 2 and influencee is type 2. We determine theexpected number of influencees of a potential adopterwho purchases the new product at time t for the threecontagion scenarios as follows.
2.1.1. Type 1 Influencer and Type 1 Influencee.Let us take a close look at Betty’s role as an influ-encer if she is a type 1 adopter who purchases theproduct at time t. Consider another type 1 potentialadopter, Amy, who buys at time s 4s > t5. She haseither been self-motivated or been influenced by atype 1 adopter who has made a purchase previously(note that type 2 adopters cannot exert influence ontype 1 potential adopters). Let Ni be the size of type ipotential adopters. Multiplying both sides of Equa-tion (1) by N1, we obtain
f14s5N1 = p141 − F14s55N1 + q1F14s541 − F14s55N10 (5)
From Equation (5), we know that f14s5N1 type 1potential adopters make their purchases at time s.Among them, p141 − F14s55N1 are self-motivated, andq1F14s541 − F14s55N1 have been influenced by othertype 1 adopters. Amy, as one of the f14s5N1 type 1adopters at s, can either be one of the p141 − F14s55N1self-motivated adopters or be one of the q1F14s5·41 − F14s55N1 influencees. Thus, the probability of herbeing an influencee can be written as
�6Amy is a type 1 influencee � Amy buys at s7
=q1F14s5
p1 + q1F14s50 (6)
An implicit assumption in the Bass diffusion modelis that “at any point in the process, all individualswho are yet to adopt have the same probability ofadopting in a given time period, so that differencesin individual adoption times are purely stochastic”(Chatterjee and Eliashberg 1990, p. 1058). Therefore,at any moment in time, each type 1 individual whois buying is equally likely to be an influencee of anyprevious type 1 buyer, and each previous type 1 buyeris equally likely to be the influencer of any type 1individual who is buying.
At s, there are F14s5N1 type 1 customers who havealready adopted. Given that Amy is a type 1 influ-encee and she can only be influenced by previoustype 1 adopters, each of them has equal probabilityof influencing her. Applying Equation (6), the proba-bility that Amy is Betty’s influencee is given by
�6Amy is Betty’s influencee � Amy buys at s7
=�6Amy is an influencee � Amy buys at s7
F14s5N1
=q1/N1
p1 + q1F14s50
As we have f14s5N1 type 1 buyers at time s, the num-ber of type 1 buyers at s who are influenced byBetty follows a binomial distribution with parame-ters f14s5N1 and q1/N1/4p1 +q1F14s55. It follows that theexpected number of type 1 customers buying at s whohave been influenced by Betty is
Ɛ6Number of Betty’s type 1 influencees at time s7
=q1f14s5
p1 + q1F14s50
Therefore, during the product life cycle, the expectedtotal number of Betty’s type 1 influencees is
Ɛ6Total number of Betty’s type 1 influencees7
=
∫ �
t
q1f14s5
p1 + q1F14s5ds0 (7)
2.1.2. Type 1 Influencer and Type 2 Influencee.Let us return to Betty as a type 1 influencer who pur-chases the new product at time t. Now consider atype 2 potential adopter, Cindy, who buys at time s4s > t5. Her adoption behavior can be motivated byherself, by a previous type 1 buyer, or by a previoustype 2 buyer. In the latter two cases, Cindy’s adoptionis due to the social contagion process. Conditional onCindy being influenced by a type 1 buyer, each previ-ous type 1 buyer is equally likely to influence Cindy.Hence the probability of her being Betty’s influenceeis given by
�6Cindy is Betty’s influencee � Cindy buys at s7
=qc/N1
p2 + qcF14s5+ q2F24s50
As there are f24s5N2 type 2 buyers at time s, thenumber of type 2 buyers at s who are influencedby Betty follows a binomial distribution with param-eters f24s5N2 and qc/N1/4p2 + qcF14t5 + q2F24t55. Thusthe expected number of Betty’s type 2 influencees attime s is
Ɛ6Number of Betty’s type 2 influencees at time s7
=qc�̄f24s5
p2 + qcF14s5+ q2F24s51

Ho et al.: Customer Influence Value and Purchase Acceleration in New Product Diffusion240 Marketing Science 31(2), pp. 236–256, © 2012 INFORMS
where �̄ =N2/N1 = �2/�1. Therefore, the expected totalnumber of Betty’s type 2 influencees over the productlife cycle is
Ɛ6Total number of Betty’s type 2 influencees7
=
∫ �
t
qc�̄f24s5
p2 + qcF14s5+ q2F24s5ds0 (8)
Combining Equations (7) and (8), the expected totalnumber of Betty’s influencees is given by
Ɛ6Total number of Betty’s influencees7
=
∫ �
t
q1f14s5
p1 + q1F14s5ds +
∫ �
t
qc�̄f24s5
p2 + qcF14s5+ q2F24s5ds0 (9)
2.1.3. Type 2 Influencer and Type 2 Influencee.Applying the same logic, the expected total numberof influencees of a type 2 customer, Debby, who buysat time t can be determined as
Ɛ6Total number of Debby’s influencees7
=
∫ �
t
q2f24s5
p2 + qcF14s5+ q2F24s5ds0 (10)
2.2. Customer Lifetime ValueWithout loss of generality, we normalize the prod-uct profit margin to one. We shall determine PV,IV, and CV by customer type and by time of adop-tion. Consider Betty, a type 1 adopter at time t.There is a probability p1/4p1 + q1F14t55 that she isdriven by her intrinsic motivation and a probability4q1F14t55/4p1 + q1F14t55 that she is influenced by others.When she is driven by her intrinsic motivation, herPV is the present value of the firm’s profit derivedfrom her (i.e., e−rt , where r is the discount rate). Whenshe is influenced by others, her PV is 41−�5e−rt , wherethe remaining � fraction is credited back to her influ-encer. Hence, Betty’s PV is
PV14t5 = e−rt
(
p1
p1 + q1F14t5+
q1F14t5
p1 + q1F14t541 − �5
)
= e−rt
(
1 −�q1F14t5
p1 + q1F14t5
)
0 (11)
As discussed above, Betty also acts as an influ-encer and has her own influencees. She is credited a� fraction of the present value of the resulting profitbrought in by each influencee of hers. SubstitutingEquations (1) and (2) into Equation (9), Betty’s IV is
IV14t5 = �∫ �
te−rs q1f14s5
p1 + q1F14s5ds
+ �∫ �
te−rs qc�̄f24s5
p2 + qcF14s5+ q2F24s5ds
= �
[
q1
∫ �
te−rs41 − F14s55 ds
+ qc�̄∫ �
te−rs41 − F24s55 ds
]
0 (12)
Now consider Debby, a type 2 adopter, who pur-chases at time t. She is driven by her intrinsicmotivation with probability p2/4p2 + qcF14t5 + q2F24t55or by social influence with probability 4qcF14t5 +
q2F24t55/4p2 + qcF14t5+ q2F24t55. In the former, her PV issimply e−rt ; in the latter, her PV is 41 − �5e−rt . Hence,Debby’s PV is
PV24t5 = e−rt
(
p2
p2 + qcF14t5+ q2F24t5
+qcF14t5+ q2F24t5
p2 + qcF14t5+ q2F24t541 − �5
)
= e−rt
(
1 −�4qcF14t5+ q2F24t55
p2 + qcF14t5+ q2F24t5
)
0 (13)
After her purchase, Debby becomes an influencerof future buyers. Note that a type 1 adopter can influ-ence a type 2 potential adopter, but not vice versa.As a result, Debby, a type 2 adopter, can only havetype 2 influencees. She is credited a � fraction of thepresent value from each of her influencees. ApplyingEquations (2) and (10), Debby’s IV is
IV24t5 = �∫ �
te−rs q2f24s5
p2 + qcF14s5+ q2F24s5ds
= �q2
∫ �
te−rs41 − F24s55 ds0 (14)
For each type of customer, the CV is simply the sumof his or her PV and IV as follows:
CVi4t5= PVi4t5+ IVi4t5 4i = 11250
Proposition 1 characterizes a customer’s PV, IV,and CV by customer type and time of adoption.
Proposition 1. The PV, IV, and CV of the influentialsand imitators segments at adoption time t are characterizedin Table 1.
Note that Table 1 explicitly decomposes the firm’stotal profit into individual customer values by cus-tomer type and time of adoption. Also, the total CVfrom the entire customer base equals the firm’s totalprofit:
2∑
i=1
�i
∫ �
t=0CVi4t5fi4t5 dt =
2∑
i=1
�i
∫ �
t=0e−rtfi4t5 dt0 (15)
Table 1 suggests that it may be possible to increase thefirm’s profit by trading off purchase value with influ-ence value. We shall show how this can be accom-plished by the so-called “purchase acceleration” or“product life cycle compression” in §3.
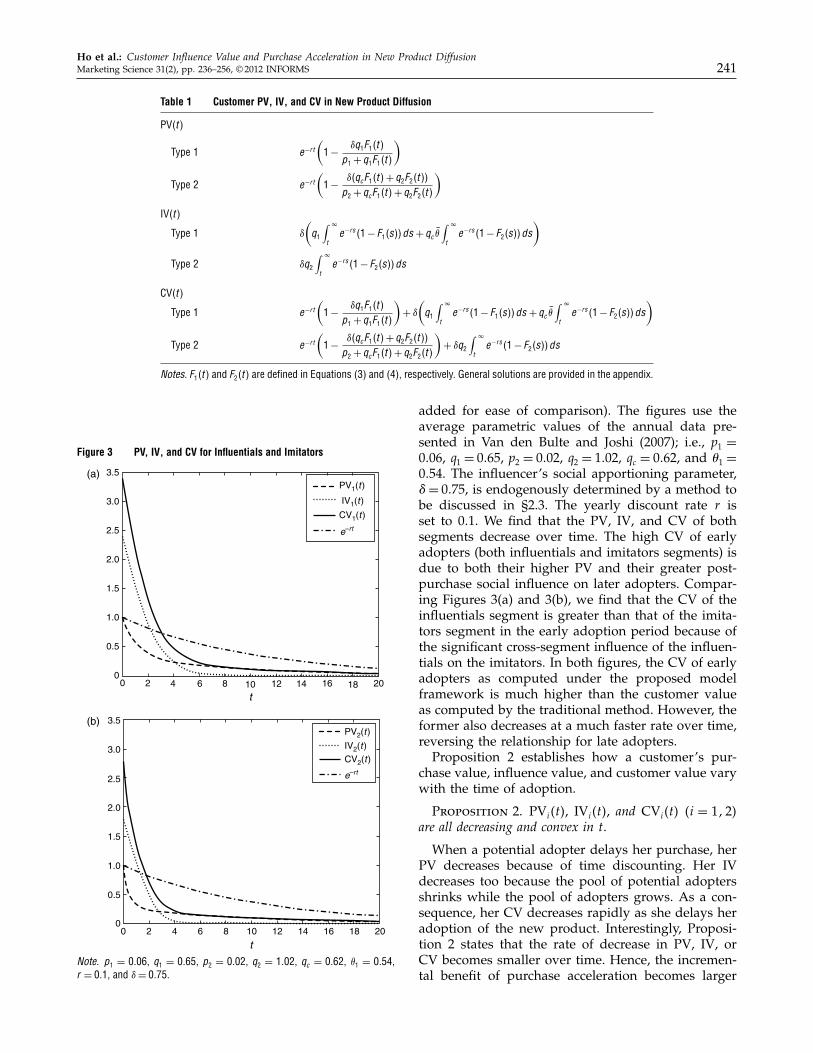
Figures 3(a) and 3(b) plot the PV, IV, and CV foreach customer segment by time of adoption (withcustomer value computed by the traditional method
Ho et al.: Customer Influence Value and Purchase Acceleration in New Product DiffusionMarketing Science 31(2), pp. 236–256, © 2012 INFORMS 241
Table 1 Customer PV, IV, and CV in New Product Diffusion
PV4t5
Type 1 e−r t
(
1 −�q1F14t5
p1 + q1F14t5
)
Type 2 e−r t
(
1 −�4qcF14t5+ q2F24t55
p2 + qcF14t5+ q2F24t5
)
IV4t5
Type 1 �
(
q1
∫ �
te−rs41 − F14s55 ds+ qc �̄
∫ �
te−rs41 − F24s55 ds
)
Type 2 �q2
∫ �
te−rs41 − F24s55 ds
CV4t5
Type 1 e−r t
(
1 −�q1F14t5
p1 + q1F14t5
)
+ �
(
q1
∫ �
te−rs41 − F14s55 ds+ qc �̄
∫ �
te−rs41 − F24s55 ds
)
Type 2 e−r t
(
1 −�4qcF14t5+ q2F24t55
p2 + qcF14t5+ q2F24t5
)
+ �q2
∫ �
te−rs41 − F24s55 ds
Notes. F14t5 and F24t5 are defined in Equations (3) and (4), respectively. General solutions are provided in the appendix.
Figure 3 PV, IV, and CV for Influentials and Imitators
201816141210t
864200
0.5
1.0
1.5
2.0
2.5
3.0
3.5
0
0.5
1.0
1.5
2.0
2.5
3.0
3.5
PV1(t)
IV1(t)
CV1(t)
e–rt
PV2(t )
IV2(t)
CV2(t )
e–rt
(a)
(b)
201816141210
t86420
Note. p1 = 0006, q1 = 0065, p2 = 0002, q2 = 1002, qc = 0062, �1 = 0054,r = 001, and �= 0075.
added for ease of comparison). The figures use theaverage parametric values of the annual data pre-sented in Van den Bulte and Joshi (2007); i.e., p1 =
0006, q1 = 0065, p2 = 0002, q2 = 1002, qc = 0062, and �1 =
0054. The influencer’s social apportioning parameter,�= 0075, is endogenously determined by a method tobe discussed in §2.3. The yearly discount rate r isset to 001. We find that the PV, IV, and CV of bothsegments decrease over time. The high CV of earlyadopters (both influentials and imitators segments) isdue to both their higher PV and their greater post-purchase social influence on later adopters. Compar-ing Figures 3(a) and 3(b), we find that the CV of theinfluentials segment is greater than that of the imita-tors segment in the early adoption period because ofthe significant cross-segment influence of the influen-tials on the imitators. In both figures, the CV of earlyadopters as computed under the proposed modelframework is much higher than the customer valueas computed by the traditional method. However, theformer also decreases at a much faster rate over time,reversing the relationship for late adopters.
Proposition 2 establishes how a customer’s pur-chase value, influence value, and customer value varywith the time of adoption.
Proposition 2. PVi4t5, IVi4t5, and CVi4t5 4i = 1125are all decreasing and convex in t.
When a potential adopter delays her purchase, herPV decreases because of time discounting. Her IVdecreases too because the pool of potential adoptersshrinks while the pool of adopters grows. As a con-sequence, her CV decreases rapidly as she delays heradoption of the new product. Interestingly, Proposi-tion 2 states that the rate of decrease in PV, IV, orCV becomes smaller over time. Hence, the incremen-tal benefit of purchase acceleration becomes larger

Ho et al.: Customer Influence Value and Purchase Acceleration in New Product Diffusion242 Marketing Science 31(2), pp. 236–256, © 2012 INFORMS
as the product life cycle is shortened. Note that thissame result continues to hold even if the productprofit margin decreases (perhaps resulting from lowerprices) over time. If the product margin declines overtime, early adopters become more important becausethey will have even higher PV and IV compared withlater adopters.
Figure 4 illustrates the proportion of IV as a com-ponent of CV over time. For both influentials and imi-tators segments, IV accounts for a greater part of CVfor early adopters than for late adopters. Ho et al.(2002) show that it may be optimal to preproducethe new product before launching it in the marketso as to avoid losing early adopters. Our result pro-vides a rationale for this result from a customer valueperspective. Given the significant influence of earlyadopters, the firm might wish to increase postpur-chase customer service early in the product life cyclebecause such a strategy would increase customer sat-isfaction, which in turn will accelerate the positivesocial contagion process.
It is worthwhile to determine the half-life of CV(i.e., the time it takes for CV to decrease by half).Figures 5(a) and 5(b) show the half-life of CV for theinfluentials and imitators segments, respectively. Notethat for both segments, the half-life of CV is quiteshort (e.g., the total time it takes for CV to drop byhalf twice is less than three years for both segments).In addition, we observe that the half-life of the imi-tators segment is shorter than that of the influentialssegment because of the faster diffusion process in theformer (note that in Figure 2(b), the cumulative adop-tion for the imitators segment is always higher).
Figure 4 Proportion of IV for Influentials and Imitators
0 2 4 6 8 10 12 14 16 18 200
0.1
0.2
0.3
0.4
0.5
0.6
0.7
0.8
t
IV1(t )/CV1(t )
IV2(t )/CV2(t )
Note. p1 = 0006, q1 = 0065, p2 = 0002, q2 = 1002, qc = 0062, �1 = 0054,r = 001, and �= 0075.
Figure 5 Half-Life of CV for Influentials and Imitators
20
200
25
25
50
50
100
100
(%)
(%)
(a)
(b) CV2(t )
CV1(t )
12.5
12.5
6.25
6.25
0.9 2 3 4.7
6.3t
t
4.22.81.50
Note. p1 = 0006, q1 = 0065, p2 = 0002, q2 = 1002, qc = 0062, �1 = 0054,r = 001, and �= 0075.
2.3. An Endogenous Method of Determining �The modeling framework assumes that for each newproduct adoption that is driven by social influence,a � fraction of the profit margin derived from eachinfluencee is being credited to her influencer. Hence,� plays a central role in determining a customer’s PV,IV, and CV. It is therefore natural to ask how � canbe determined theoretically and empirically. In thissubsection, we describe an endogenous method fordetermining �.
Our asymmetric influence model consists of a setof innovation parameters, p = 4p11 p25, and imitationparameters, q = 4q11 q21 qc5. Let the total customervalue of the combined population be CVm4p1q5.We then create a hypothetical population by suppress-ing social influence (i.e., by setting imitation param-eters to zero; q = 4q11 q21 qc5 = 0). Let us denote thetotal customer value of this hypothetical populationby CVm4p105. Clearly, CVm4p1q5 > CVm4p105, and theincremental value as a result of the social contagionprocess equals CVm4p1q5 − CVm4p105. Let IVm4p1q5be the total influence value of the combined popula-tion. From Equations (12) and (14), we have
IVm4p1q5=
2∑
i=1
�i
∫ �
t=0IVi4t5fi4t5 dt0

Ho et al.: Customer Influence Value and Purchase Acceleration in New Product DiffusionMarketing Science 31(2), pp. 236–256, © 2012 INFORMS 243
Note that IVm4p1q5 = CVm4p1q5 − CVm4p105. There-fore, one can endogenously determine � by the fol-lowing equation:
2∑
i=1
�i
∫ �
t=0IVi4t5fi4t5 dt = CVm4p1q5− CVm4p1050 (16)
Applying the closed-form expressions of PV, IV, andCV defined in §2.2, Equation (16) leads to the follow-ing proposition.
Proposition 3. The social apportioning parameter 0 ≤
�≤ 1 is uniquely and endogenously determined by the fol-lowing equation:
�1p1
p1 + r+
�2p2
p2 + r
= �1
∫ �
t=0e−rt41 − F14t554p1 + 41 − �5q1F14t55 dt
+ �2
∫ �
t=0e−rt41 − F24t554p2 + 41 − �5
·(
qcF14t5+ q2F24t55)
dt0 (17)
Note that given a set of innovation and imitationparameters 4p1q5, we can uniquely determine �.In the special case of simple Bass diffusion model(i.e., �2 = 0), one can derive a closed-form expressionfor � as follows:
� =
[
−1
b+ ab41 + b5+
a+ 1a+ 2 2F1411 a+ 23a+ 33−b5
+1 − ab
4a+ 15b 2F1411 a+ 13a+ 23−b5
]
·
[
a+ 1a+ 2 2F1411 a+ 23a+ 33−b5
−a
a+ 1 2F1411 a+ 13a+ 23−b5
]−1
1
where a = r/4p1 + q15, b = q1/p1, and 2F14x11x23y3z5 isthe Gaussian hypergeometric function.
In general, there is no closed-form expression for �.We numerically compute � under various paramet-ric conditions. Table 2 summarizes the result. We usethe average parametric values of the annual data inVan den Bulte and Joshi (2007) as the base case, andwe systematically vary each diffusion parameter tostudy the sensitivity of � with respect to it. Under thisaverage diffusion scenario, we find that � decreases inp1, p2, and q1, and it increases in q2 and qc. The resultsimply that each influencer should be given morecredit when the imitators segment’s within-segmentimitation parameter or the cross-segment imitationparameter increases, but less credit when either seg-ment’s innovation parameter or the influentials seg-ment’s within-segment imitation parameter increases.
Table 2 Sensitivity Analysis of �
p1 0004 0006 0008 0010 0012 0014� 0079 0075 0072 0070 0068 0067
p2 00002 00005 00010 00020 00030 00040� 0082 0081 0078 0074 0070 0067
q1 002 004 006 008 100 102� 0078 0076 0075 0074 0074 0074
q2 001 003 005 007 100 200� 0074 0074 0075 0075 0075 0075
qc 001 003 005 008 100 200� 0074 0075 0075 0075 0075 0075
Note. p1 = 0006, q1 = 0065, p2 = 0002, q2 = 1002, qc = 0062, �1 = 0054, andr = 001.
To gain further managerial insight, we examinethe distribution of � for 32 products from Van denBulte and Joshi (2007).1 Figure 6 shows the frequencyplot of � for this sample of 32 products. Note thatthere are 17 products with � greater than 0.9 and25 products with � greater than 0.8. The very high� value in a significant majority of these productsindicates that a large fraction of the profit generatedby each product adoption should be credited to thecorresponding influencer. This result highlights theimportance of social contagion and the significanceof customer influence value in most new productdiffusions. We also observe that a low value of � istypically associated with a very small cross-segmentimitation parameter (e.g., the three products that havethe smallest � values all have their cross-segment imi-tation parameters less than 1050 · 10−5). In summary,as � does vary across products, it is important for thefirm to understand what its new product’s � value isso that it can correctly determine the CV for each of itscustomers and properly allocate its limited marketingresources.
2.4. Comparative StaticsIn this section, we study how the PV, IV, and CVof the influentials and imitators segments vary withinnovation and imitation (both within-segment andcross-segment) parameters. For each dependent vari-able of interest, we break down the comparative stat-ics into two parts: the direct effect and indirect effect.The direct effect refers to the effect a diffusion param-eter directly has on the dependent variable of inter-est, whereas the indirect effect refers to the effect adiffusion parameter indirectly has on the dependentvariable of interest “through” the social apportioningparameter �, which is endogenously determined in§2.3. The total effect of a diffusion parameter on thedependent variable of interest is defined as the sum
1 We excluded one product whose data are neither weekly noryearly. Parametric values estimated to be 0.000 are set to 0.0005 forthis investigation.

Ho et al.: Customer Influence Value and Purchase Acceleration in New Product Diffusion244 Marketing Science 31(2), pp. 236–256, © 2012 INFORMS
Figure 6 Frequency Analysis of � in 32 Products
0 0.1 0.2 0.3 0.4 0.5 0.6 0.7 0.8 0.9 1.00
2
4
6
8
10
12
14
16
18
�
Fre
quen
cy
of the direct effect and indirect effect. Stated formally,we have
¡Y 4x1�4x55
¡x︸ ︷︷ ︸
Total effect
=¡Y 4x1�5
¡x︸ ︷︷ ︸
Direct effect
+¡�4x5
¡x·¡Y 4x1�5
¡�︸ ︷︷ ︸
Indirect effect
1
where Y ∈ 8PV11PV21 IV11 IV21CV11CV29 is a depen-dent variable of interest, and x ∈ 8p11 p21 q11 q21 qc9 is adiffusion parameter.
We provide comparative statics results for both thedirect and total effects for two reasons. First, thedirect effect varies in a more straightforward mannerwith respect to each diffusion parameter and hencegives us a sharper view as to the likely directionalchange of the dependent variable of interest. Second,because the indirect effect represents the effect a diffu-sion parameter has “through” the social apportioningparameter, which typically varies very little locally,the total effect frequently has the same directionalchange as the direct effect. This decomposition analy-sis, therefore, helps us to understand the incrementaleffect each parameter “indirectly” has on the depen-dent variable of interest via the social apportioningparameter.
2.4.1. Comparative Statics—Direct Effects.
Proposition 4. The direct effects with respect to inno-vation parameters (p1 and p2) are2
(a) PV14t5 increases with p1; PV24t5, IV14t5, IV24t5, andCV24t5 all decrease with p1; and CV14t5 decreases with p1for all t < t1, where
t1 = min{
t2 e−rt 41 − 4p1t + q1t + 15e−4p1+q15t5
4p1 + q152
=
∫ �
te−rs ¡F14s5
¡p1ds +
qc�̄
q1
∫ �
te−rs ¡F24s5
¡p1ds
}
0
2 ti = �4i = 1125 if no such minimum exists.
(b) PV14t5 is independent of p2; PV24t5 increases withp2; IV14t5, IV24t5, and CV14t5 all decrease with p2; andCV24t5 decreases with p2 for all t < t2, where
t2 = min{
t2e−rt44qc/q25F14t5+ F24t5− p24¡F24t5/¡p255
4p2 + qcF14t5+ q2F24t552
=
∫ �
te−rs ¡F24s5
¡p2ds
}
0
Proposition 4(a) suggests that if the influentials seg-ment has a higher innovation parameter, the segmentwill have a higher PV. This is so because a high inno-vation parameter means that many potential adopterspurchase the new product on their own without beinginfluenced by others. Also, the influentials segment’sIV decreases as its innovation parameter increasesfor the same reason. The net effect of the innovationparameter p1 on the influentials segment’s CV, as aconsequence, depends on the relative size of increasein PV and decrease in IV. Because early adopters aremore valuable than late adopters (see Proposition 2),the loss from IV surpasses the gain from PV dur-ing the early period of the adoption process. As aresult, the CV of the influentials segment’s adopterswho buy before t1 decreases as its innovation parame-ter increases. We also observe that the PV, IV, and CVof the imitators segment decrease as the influentialssegment’s innovation parameter increases, suggestingthat faster diffusion as a result of higher innovationin the influentials segment makes the imitators seg-ment more likely to adopt via cross-segment socialcontagion rather than via the imitators segment’s owninnovation or within-segment social influence.
Proposition 4(b) states that the PV of the imitatorssegment increases as the segment’s innovation param-eter increases. The IV for the imitators segment, how-ever, decreases with its innovation parameter. As aresult, the CV of early adopters who adopt before t2in the imitators segment decreases with its innova-tion parameter, because the loss in IV is greater thanthe gain in PV for these adopters. Because imitatorscannot influence influentials, the PV of the influen-tials segment does not depend on the imitators seg-ment’s innovation parameter. The IV and thus the CVof the influentials segment decrease as the imitatorssegment’s innovation parameter increases, as the rel-ative importance of cross-segment influence becomessmaller.
Proposition 5. The direct effects with respect to imi-tation parameters (q11 qc, and q2) are
(a) PV14t5, PV24t5, IV24t5, and CV24t5 all decreasewith q1; and IV14t5 and CV14t5 both decrease with q1 fort > t3, where t3 is defined as3
t3 =max{
t2∫ �
te−rs
(
1−F14s5−q1¡F14s5
¡q1−qc �̄
¡F24s5
¡q1
)
ds=0}
0
3 t3 = 0 if no such maximum exists.
Ho et al.: Customer Influence Value and Purchase Acceleration in New Product DiffusionMarketing Science 31(2), pp. 236–256, © 2012 INFORMS 245
(b) PV14t5 is independent of qc; PV24t5, IV24t5, andCV24t5 all decrease with qc; and IV14t5 and CV14t5 bothdecrease with qc if
∫ �
te−rs
(
1 − F24s5− qc¡F24s5
¡qc
)
ds < 00
(c) PV14t5 is independent of q2; PV24t5, IV14t5, andCV14t5 all decrease with q2; and IV24t5 and CV24t5 bothdecrease with q2 if
∫ �
te−rs
(
1 − F24s5− q2¡F24s5
¡q2
)
ds < 00
Proposition 5(a) suggests that the PV for both seg-ments decreases as the influentials segment’s within-segment imitation parameter (q1) increases becausemore potential adopters purchase the new productas a result of either within- or cross-segment socialinfluence. Interestingly, the IV for the imitators seg-ment decreases as q1 increases as more purchase valuein the imitators segment is being credited to theinfluentials segment. CV 4=PV + IV5 for the imitatorssegment, as a result, decreases. The IV and CV for theinfluentials segment decrease as q1 increases when thetiming of adoption is sufficiently large. This is becauseconditional on a large time of adoption, few poten-tial adopters remain. As a result, the IV and henceCV decrease.
Proposition 5(b) states that the PV, IV, and CVfor the imitators segment all decrease as the cross-segment imitation parameter (qc) increases. This is sobecause a higher cross-segment imitation parameterindicates that imitators are more likely to adopt asa result of cross-segment social influence rather thanwithin-segment innovation or social influence. The PVfor the influentials segment is independent of qc. Boththe IV and CV of the influentials segment decrease
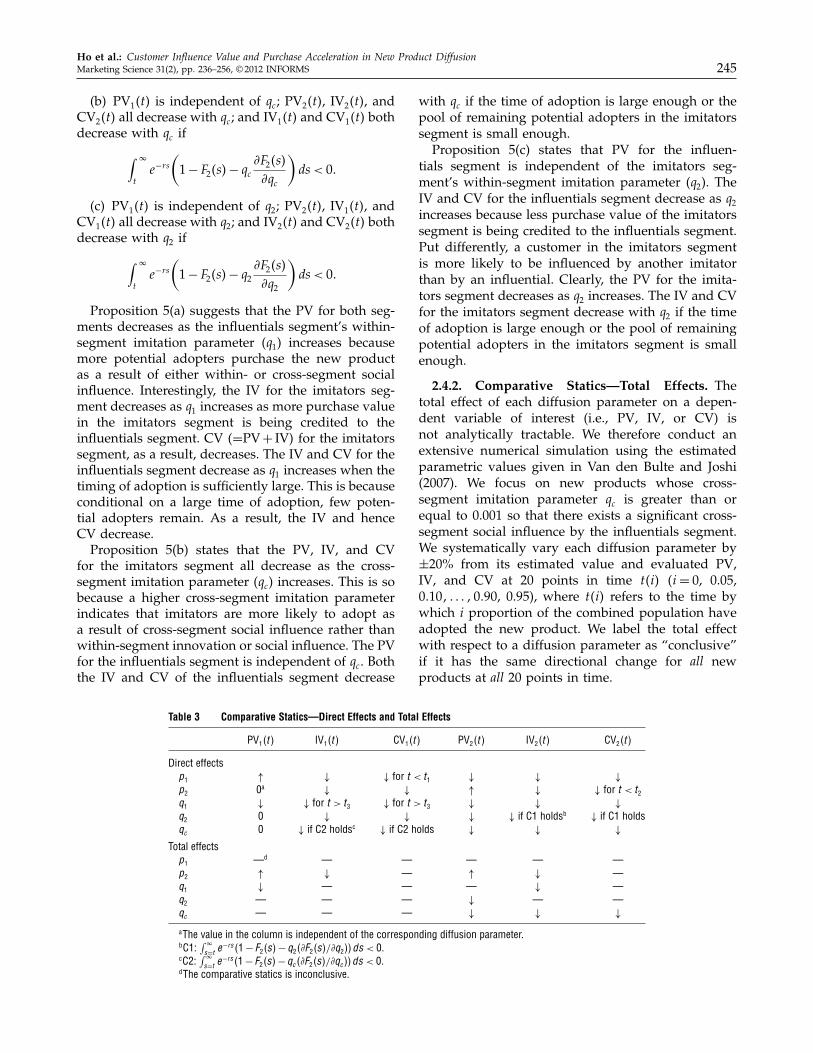
Table 3 Comparative Statics—Direct Effects and Total Effects
PV14t5 IV14t5 CV14t5 PV24t5 IV24t5 CV24t5
Direct effectsp1 ↑ ↓ ↓ for t < t1 ↓ ↓ ↓
p2 0a ↓ ↓ ↑ ↓ ↓ for t < t2q1 ↓ ↓ for t > t3 ↓ for t > t3 ↓ ↓ ↓
q2 0 ↓ ↓ ↓ ↓ if C1 holdsb ↓ if C1 holdsqc 0 ↓ if C2 holdsc ↓ if C2 holds ↓ ↓ ↓
Total effectsp1 —d — — — — —p2 ↑ ↓ — ↑ ↓ —q1 ↓ — — — ↓ —q2 — — — ↓ — —qc — — — ↓ ↓ ↓
aThe value in the column is independent of the corresponding diffusion parameter.bC1:
∫ �
s=te−rs41 − F24s5− q24¡F24s5/¡q255 ds < 0.
cC2:∫ �
s=te−rs41 − F24s5− qc4¡F24s5/¡qc55 ds < 0.
dThe comparative statics is inconclusive.
with qc if the time of adoption is large enough or thepool of remaining potential adopters in the imitatorssegment is small enough.
Proposition 5(c) states that PV for the influen-tials segment is independent of the imitators seg-ment’s within-segment imitation parameter (q2). TheIV and CV for the influentials segment decrease as q2
increases because less purchase value of the imitatorssegment is being credited to the influentials segment.Put differently, a customer in the imitators segmentis more likely to be influenced by another imitatorthan by an influential. Clearly, the PV for the imita-tors segment decreases as q2 increases. The IV and CVfor the imitators segment decrease with q2 if the timeof adoption is large enough or the pool of remainingpotential adopters in the imitators segment is smallenough.
2.4.2. Comparative Statics—Total Effects. Thetotal effect of each diffusion parameter on a depen-dent variable of interest (i.e., PV, IV, or CV) isnot analytically tractable. We therefore conduct anextensive numerical simulation using the estimatedparametric values given in Van den Bulte and Joshi(2007). We focus on new products whose cross-segment imitation parameter qc is greater than orequal to 0.001 so that there exists a significant cross-segment social influence by the influentials segment.We systematically vary each diffusion parameter by±20% from its estimated value and evaluated PV,IV, and CV at 20 points in time t4i5 4i = 0, 0.05,00101 0 0 0 10090, 0.95), where t4i5 refers to the time bywhich i proportion of the combined population haveadopted the new product. We label the total effectwith respect to a diffusion parameter as “conclusive”if it has the same directional change for all newproducts at all 20 points in time.

Ho et al.: Customer Influence Value and Purchase Acceleration in New Product Diffusion246 Marketing Science 31(2), pp. 236–256, © 2012 INFORMS
Table 3 summarizes the comparative statics resultsfor both the direct and total effects. The total effectshave 10 conclusive cases, 9 of them having the samedirectional change as those in the direct effects. Theonly conclusive case of the total effects that does notcoincide with that of the direct effects is the com-parative statics result on the influentials segment’sPV with respect to the imitators segment’s innovationparameter p2. This is because the imitators segment’sinnovation parameter imposes no direct effect on theinfluentials segment’s PV, but it exerts indirect influ-ence on the influentials segment’s PV via the socialapportioning parameter.
It is worth highlighting several conclusive resultsand discussing their implications. First, the PV, IV,and CV of the imitators segment tend to decrease asthe cross-segment imitation parameter (qc) increases.As a result, the imitators segment may become lessvaluable compared with the influentials segment.
Figure 7 Customer Value of Four CDs
504540353025
9
8
7
6
5
4
3
2
1
00
20151050
0
1
2
3
4
5
6
(a) Blind Melon (b) Adam Ant
(d) DINK(c) Everclear
t50454035302520151050
0
0.5
1.0
1.5
2.0
2.5
3.0
3.5
4.0
CV1(t )
CV2(t )
t
504540353025201510500.4
0.6
0.8
1.0
1.2
1.4
1.6
1.8
2.0
2.2
2.4
t5045403530252015105
t
Notes. In (a), p1 = 0021, q1 = 3029, p2 = q2 = 0, qc = 00073, �1 = 0024, r = 00005, and � = 0079. In (b), p1 = 0006, q1 = p2 = 0, q2 = 0033, qc = 0004,�1 = 0063, r = 00005, and �= 1. In (c), p1 = 0002, q1 = 0027, p2 = 0, q2 = 0019, qc = 00004, �1 = 0005, r = 00005, and �= 0096. In (d), p1 = 0002, q1 = 0016,p2 = q2 = 0, qc = 0001, �1 = 0067, r = 00005, and �= 0046.
Therefore, the firm may wish to gradually divertresources away from the imitators segment as qcincreases. Second, the PV for both segments tendsto increase, and the IV for both segments tends todecrease as the imitators segment’s innovation param-eter (p2) increases. Put differently, p2 reduces the rel-ative importance of social contagion. Therefore, earlyadopters may be less valuable when p2 is high.
2.5. Empirical AnalysisIn this subsection, we investigate the dynamics of cus-tomer value using the diffusion parameters of fourCDs from Van den Bulte and Joshi (2007). Because peo-ple normally do not buy two identical CDs for them-selves, music CDs are like durable goods. (Van denBulte and Joshi 2007, p. 411) show that these CDs cap-ture four typical diffusion paths: (1) “a rather smoothdecline” for Blind Melon, (2) an “early dip followed
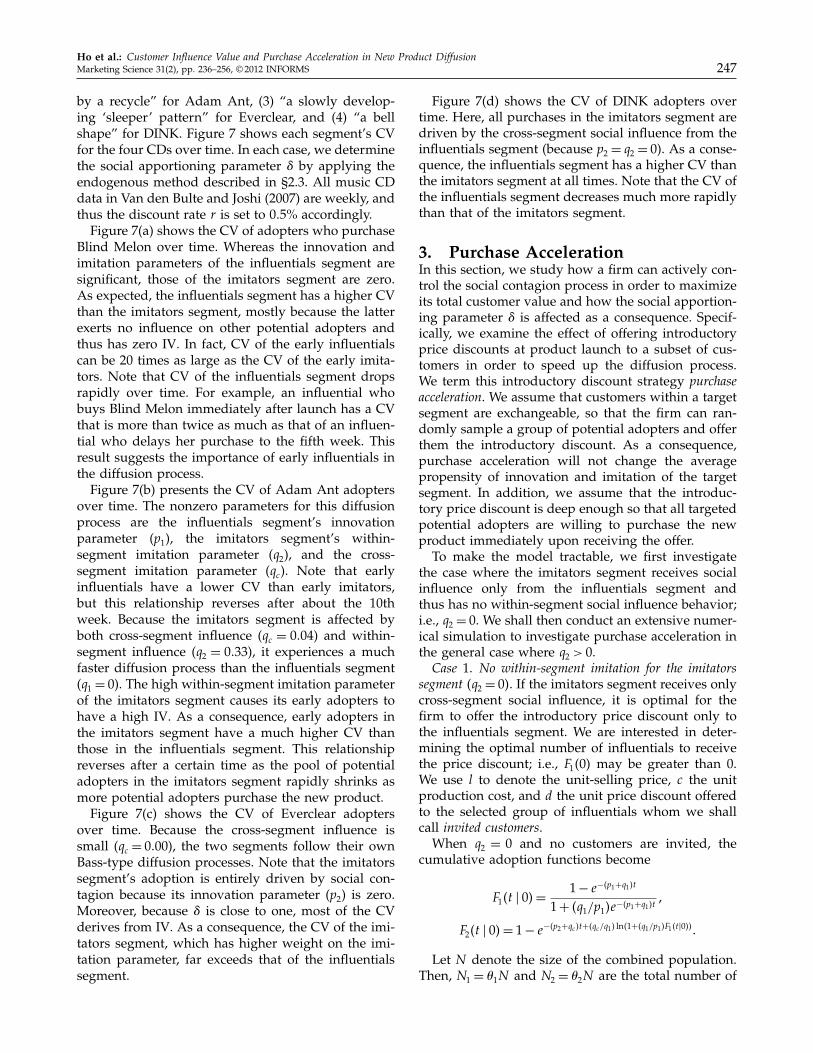
Ho et al.: Customer Influence Value and Purchase Acceleration in New Product DiffusionMarketing Science 31(2), pp. 236–256, © 2012 INFORMS 247
by a recycle” for Adam Ant, (3) “a slowly develop-ing ‘sleeper’ pattern” for Everclear, and (4) “a bellshape” for DINK. Figure 7 shows each segment’s CVfor the four CDs over time. In each case, we determinethe social apportioning parameter � by applying theendogenous method described in §2.3. All music CDdata in Van den Bulte and Joshi (2007) are weekly, andthus the discount rate r is set to 005% accordingly.
Figure 7(a) shows the CV of adopters who purchaseBlind Melon over time. Whereas the innovation andimitation parameters of the influentials segment aresignificant, those of the imitators segment are zero.As expected, the influentials segment has a higher CVthan the imitators segment, mostly because the latterexerts no influence on other potential adopters andthus has zero IV. In fact, CV of the early influentialscan be 20 times as large as the CV of the early imita-tors. Note that CV of the influentials segment dropsrapidly over time. For example, an influential whobuys Blind Melon immediately after launch has a CVthat is more than twice as much as that of an influen-tial who delays her purchase to the fifth week. Thisresult suggests the importance of early influentials inthe diffusion process.
Figure 7(b) presents the CV of Adam Ant adoptersover time. The nonzero parameters for this diffusionprocess are the influentials segment’s innovationparameter (p1), the imitators segment’s within-segment imitation parameter (q2), and the cross-segment imitation parameter (qc). Note that earlyinfluentials have a lower CV than early imitators,but this relationship reverses after about the 10thweek. Because the imitators segment is affected byboth cross-segment influence (qc = 0004) and within-segment influence (q2 = 0033), it experiences a muchfaster diffusion process than the influentials segment(q1 = 0). The high within-segment imitation parameterof the imitators segment causes its early adopters tohave a high IV. As a consequence, early adopters inthe imitators segment have a much higher CV thanthose in the influentials segment. This relationshipreverses after a certain time as the pool of potentialadopters in the imitators segment rapidly shrinks asmore potential adopters purchase the new product.
Figure 7(c) shows the CV of Everclear adoptersover time. Because the cross-segment influence issmall (qc = 0000), the two segments follow their ownBass-type diffusion processes. Note that the imitatorssegment’s adoption is entirely driven by social con-tagion because its innovation parameter (p2) is zero.Moreover, because � is close to one, most of the CVderives from IV. As a consequence, the CV of the imi-tators segment, which has higher weight on the imi-tation parameter, far exceeds that of the influentialssegment.
Figure 7(d) shows the CV of DINK adopters overtime. Here, all purchases in the imitators segment aredriven by the cross-segment social influence from theinfluentials segment (because p2 = q2 = 0). As a conse-quence, the influentials segment has a higher CV thanthe imitators segment at all times. Note that the CV ofthe influentials segment decreases much more rapidlythan that of the imitators segment.
3. Purchase AccelerationIn this section, we study how a firm can actively con-trol the social contagion process in order to maximizeits total customer value and how the social apportion-ing parameter � is affected as a consequence. Specif-ically, we examine the effect of offering introductoryprice discounts at product launch to a subset of cus-tomers in order to speed up the diffusion process.We term this introductory discount strategy purchaseacceleration. We assume that customers within a targetsegment are exchangeable, so that the firm can ran-domly sample a group of potential adopters and offerthem the introductory discount. As a consequence,purchase acceleration will not change the averagepropensity of innovation and imitation of the targetsegment. In addition, we assume that the introduc-tory price discount is deep enough so that all targetedpotential adopters are willing to purchase the newproduct immediately upon receiving the offer.
To make the model tractable, we first investigatethe case where the imitators segment receives socialinfluence only from the influentials segment andthus has no within-segment social influence behavior;i.e., q2 = 0. We shall then conduct an extensive numer-ical simulation to investigate purchase acceleration inthe general case where q2 > 0.
Case 1. No within-segment imitation for the imitatorssegment 4q2 = 05. If the imitators segment receives onlycross-segment social influence, it is optimal for thefirm to offer the introductory price discount only tothe influentials segment. We are interested in deter-mining the optimal number of influentials to receivethe price discount; i.e., F1405 may be greater than 0.We use l to denote the unit-selling price, c the unitproduction cost, and d the unit price discount offeredto the selected group of influentials whom we shallcall invited customers.
When q2 = 0 and no customers are invited, thecumulative adoption functions become
F14t � 05=1 − e−4p1+q15t
1 + 4q1/p15e−4p1+q15t
1
F24t � 05= 1 − e−4p2+qc5t+4qc/q15 ln41+4q1/p15F14t�0550
Let N denote the size of the combined population.Then, N1 = �1N and N2 = �2N are the total number of

Ho et al.: Customer Influence Value and Purchase Acceleration in New Product Diffusion248 Marketing Science 31(2), pp. 236–256, © 2012 INFORMS
influentials and the total number of imitators, respec-tively. We shall target M1 potential adopters in theinfluentials segment. If no introductory price discountis offered, the total PV of type i is
4l− c5Ni
(
∫ �
0PVi4t � 05fi4t � 05 dt
)
1
where PVi4t � 05 follows from Equations (11) and (13)when no influentials are offered introductory pricediscounts at product launch (i.e., F1405= 0).
Similarly, the total IV of type i is given by
4l− c5Ni
(
∫ �
0IVi4t � 05fi4t � 05 dt
)
0
Let us assume that M1 influentials are selected andoffered an introductory price discount d at productlaunch. Their immediate adoption of the new productstarts the new product diffusion process with a poolof M1 adopters. With F1405 = M1/N1, the cumulativeadoption functions of the two segments become
F14t �M15=1 −Ae−4p1+q15t
1 + 4q1/p15Ae−4p1+q15t1 (18)
F24t �M15= 1 − e−4p2+qc5t+4qc/q15 ln44p1+q1A5/4p1+q1Ae−4p1+q15t 551(19)
where A = 4p14N1 − M155/4p1N1 + q1M15. The corre-sponding instantaneous adoption rate of each seg-ment is
f14t �M15=4N1 −M154p1N1 + q1M154p1 + q15
2e−4p1+q15t
4p1N1 + q1M1 + q14N1 −M15e−4p1+q15t52
1
(20)
f24t �M15= e−4p2+qc5t+4qc/q15 ln44p1+q1A5/4p1+q1Ae−4p1+q15t 55
·
(
p2 + qc −qc4p1 + q15Ae−4p1+q15t
p1 + q1Ae−4p1+q15t
)
0 (21)
With a unit price discount d, the firm sells to eachinvited customer at a price l − d and thus collects amargin of l− d− c from each sale. Note that l− d− cmay not be positive (e.g., each invited customer isgiven a free product; l − d = 0). A negative value ofl− d− c indicates that the firm has to incur a loss foreach invited customer. As the discount is offered atproduct launch, the PV of each invited customer isthe profit (or loss) she brings in (i.e., l−d− c). Hence,the total PV of the targeted M1 influentials is
4l− d− c5M10 (22)
The M1 adopters start the social influence process atproduct launch. Thus, their total IV is
4l− c5M1IV140 �M151 (23)
where
IV14t �M15 = �
(
q1
∫ �
te−rs41 − F14s �M155 ds
+ qc�̄∫ �
te−rs41 − F24s �M155 ds
)
0
The above equation follows directly from Equa-tion (12) by substituting Fi4t5 with Fi4t � M15 (i = 112)from Equations (18) and (19).
The total PV of the noninvited influentials is
4l− c5N1
∫ �
0PV14t �M15f14t �M15 dt1 (24)
and the total PV of the imitators segment is
4l− c5N2
∫ �
0PV24t �M15f24t �M15 dt1 (25)
where
PV14t �M15= e−rt
(
1 −�q1F14t �M15
p1 + q1F14t �M15
)
1
PV24t �M15= e−rt
(
1 −�qcF14t �M15
p2 + qcF14t �M15
)
0
Note that the above two equations are derivedfrom Equations (11) and (13) by replacing Fi4t5 withFi4t �M15 (i = 112). Similarly, the total IV of the nonin-vited influentials is
4l− c5N1
∫ �
0IV14t �M15f14t �M15 dt0 (26)
Finally, the IV of the imitators segment is alwayszero because imitators do not exert social influenceon others. Table 4 provides a summary of the PV, IV,and CV by customer type with or without purchaseacceleration via the introductory discount. We areinterested in determining the optimal number ofinfluentials to target and invite. Our optimizationproblem is formally stated as follows:
4P5 �∗
0 = max0≤M1≤N1
4l− c5N∫ �
0e−rt4�1f14t �M15
+ �2f24t �M155 dt + 4l− d− c5M11 (27)
where f14t � M15 and f24t � M15 are Equations (20)and (21), respectively. The objective of the optimiza-tion problem is the total profit, or total customervalue, from the entire customer base (the summa-tion of Equations (22)–(26)). The firm wishes to maxi-mize its total profit subject to the diffusion dynamicsdescribed in Equations (18) and (19) with an initialpool of M1 influentials as invited customers at prod-uct launch. Proposition 6 characterizes the solution tothe optimization problem (P).

Ho et al.: Customer Influence Value and Purchase Acceleration in New Product DiffusionMarketing Science 31(2), pp. 236–256, © 2012 INFORMS 249
Table 4 Customer PV, IV, and CV With and Without Purchase Acceleration When q2 = 0
No purchase acceleration Purchase acceleration
Type 1PV 4l − c5N1
∫ �
0 PV14t � 05f14t � 05 dt 4l − c5N1
∫ �
0 PV14t �M15f14t �M15 dt + 4l − d − c5M1
IV 4l − c5N1
∫ �
0 IV14t � 05f14t � 05 dt 4l − c54N1
∫ �
0 IV14t �M15f14t �M15 dt + IV140 �M15M15
Type 2PV 4l − c5N2
∫ �
0 PV24t � 05f24t � 05 dt 4l − c5N2
∫ �
0 PV24t �M15f24t �M15 dt
IV 0 0
TotalPV 4l − c5N
∑
i �i∫ �
0 PVi 4t � 05fi 4t � 05 dt 4l − c5N∑
i �i∫ �
0 PVi 4t �M15fi 4t �M15 dt + 4l − d − c5M1
IV 4l − c5N�1
∫ �
0 IV14t � 05f14t � 05 dt 4l − c54N�1
∫ �
0 IV14t �M15f14t �M15 dt + IV140 �M15M15
CV 4l − c5N∑
i �i∫ �
0 e−r t fi 4t � 05 dt 4l − c5N∑
i �i∫ �
0 e−r t fi 4t �M15 dt + 4l − d − c5M1
Proposition 6. We define
G4t1M15= e−rtN
(
�1¡F14t �M15
¡M1+ �2
¡F24t �M15
¡M1
)
1
where
¡F14t �M15
¡M1=
N14p1 + q152e−4p1+q15t
4p1N1 + q1M1 + q14N1 −M15e−4p1+q15t52
1
(28)
¡F24t �M15
¡M1= e−4p2+qc5t+4qc/q15 ln44p1+q1A5/4p1+q1Ae−4p1+q15t 55
×qcp
214p1 + q15N141 − e−4p1+q15t5
4p1 + q1A54p1 + q1Ae−4p1+q15t54p1N1 + q1M1520 (29)
Then the optimal solution M∗1 for (P) is uniquely deter-
mined as follows:1. M∗
1 = 0 if∫ �
0 G4t105 dt ≤ d/44l− c5r502. M∗
1 =N1 if∫ �
0 G4t1N15 dt ≥ d/44l− c5r503. 0 < M∗
1 < N1 satisfies∫ �
0 G4t1M∗1 5 = d/44l − c5r5
otherwise.
To illustrate Proposition 6, we use the average para-metric values of the annual data from Van den Bulteand Joshi (2007) and artificially set q2 to zero. Apply-ing Proposition 3, we obtain � = 00739. We conducta numerical experiment to determine M∗
1 . We findthat it is optimal to invite 5.4% of the total potentialadopters (i.e., M∗
1 /N = 00054). Moreover, under pur-chase acceleration, � increases to 0.742, which sug-gests that more purchase value is credited to theinfluencers under purchase acceleration. Next, weevaluate the total PV and IV of each type of cus-tomer depending on whether purchase acceleration isimplemented by offering price discounts to M∗
1 poten-tial adopters at product launch. Using the formulaspresented in Table 4, we obtain the results as shownin Table 5.4
4 In the numerical results in Table 5, N is normalized to 1 becausethe ratio of the optimal number of invited customers to the sizeof the combined population (M∗
1 /N ) stays constant regardless ofthe size of N . In addition, we assume that the firm sells the newproduct at its unit production cost (i.e., l− d = c).
Table 5 Customer PV, IV, and CV With and Without PurchaseAcceleration
No purchase acceleration Purchase acceleration
InfluentialsPV 34.10 29.47IV 82.52 90.78
ImitatorsPV 19.93 20.53IV 0 0
TotalPV 54.03 50.00IV 82.52 90.78CV 136.55 140.78
Note. p1 = 0006, q1 = 0065, p2 = 0002, q2 = 0, qc = 0062, �1 = 0054, r = 001,N = 1, M∗
1 = 00054, l − d = 200, and c = 200.
Table 5 reveals several insights. First, the total PV ofthe influential segment decreases but its IV increases.The net effect is a slight increase in its CV. Sec-ond, the PV (and hence CV) of the imitators segmentincreases because they adopt the new product fasterbecause of greater social influence by the influentialssegment. Third, the firm increases its total customervalue by 301% (from 136.55 to 140.78) through pur-chase acceleration.
Under purchase acceleration, the firm loses in theinfluentials segment’s PV but gains from its increasedIV as well as the imitators segment’s increased PV.We illustrate this insight further by examining thevalue of a customer who adopts at the mean timeof adoption. We use T̂ to denote the time when theproduct is adopted. We define
ƐT̂ =
∫ �
t=0tfm4t �M15 dt1
where fm4t �M15 derives from Equations (20) and (21).We compare the PV, IV, and CV at the mean time ofadoption with and without purchase acceleration inTable 6. Our result shows a boost in the PV, IV, andCV of the customer who adopts at the mean adoptiontime if the firm implements purchase acceleration.

Ho et al.: Customer Influence Value and Purchase Acceleration in New Product Diffusion250 Marketing Science 31(2), pp. 236–256, © 2012 INFORMS
Table 6 Customer PV, IV, CV, and Firm Profit at Mean Time ofAdoption
No purchase Purchaseacceleration acceleration Increase (%)
� 00739 00742 —M∗
1 /N (%) 0 504 —Profit 136055 140078 3010ƐT̂ 4004 2098 —PVm4ƐT̂ 5 44018 48032 9037IVm4ƐT̂ 5 46000 49063 7089CVm4ƐT̂ 5 90018 97095 8062
Note. p1 = 0006, q1 = 0065, p2 = 0002, q2 = 0, qc = 0062, �1 = 0054, r = 001,N = 1, l − d = 200, and c = 200.
Case 2. Positive within-segment imitation for the imita-tors segment 4q2 > 05. We now consider the general casewhere the imitators segment has a positive within-segment imitation parameter (i.e., q2 > 0). We use twonew product diffusion scenarios to illustrate how thepromotion dollars should be allocated to the influen-tials and the imitators segments. We first classify the11 product categories of annual data with positive q2from Van den Bulte and Joshi (2007) into two clus-ters using the estimated parametric values and usethe cluster mean to investigate each cluster’s prod-uct diffusion scenario. Tables 7 and 8 show how theoptimal number of invitees from both segments (M∗
1and M∗
2 ) and the total profit vary with the level ofprice discount offered in these two product diffusionscenarios.
In both Tables 7 and 8, we find that a more costlyprice discount (i.e., higher discount to margin ratio)reduces the number of invited potential adopters andthe amount by which the total profit increases. Thisis to be expected because offering an introductoryprice discount has two competing effects: (1) an accel-eration effect and (2) a cannibalization effect (Bawaand Shoemaker 2004). On one hand, offering intro-ductory price discounts to more potential adopterswill accelerate the spread of social contagion, and thuspotential adopters are likely to make purchases ear-lier than they would otherwise have. On the otherhand, this strategy also reduces the number of poten-tial adopters who would have bought the new prod-uct at the regular price. The number of invitees isdetermined so that the cannibalization effect does notoverride the acceleration effect, hence yielding themaximum profit for the firm.
Table 7 shows that most of the invited poten-tial adopters come from the influentials segment innew product diffusion scenario 1. Specifically, noneof the imitators segment should be invited if the dis-count/margin ratio exceeds 90%. Because the cross-segment imitation parameter is almost zero, the twosegments experience their own Bass-type diffusionprocesses. Note that the influentials segment in this
Table 7 Product Diffusion Scenario 1
Discount/margin Type 1 invitees Type 2 invitees Profit increase(%) (%) (%) (%)
60 1303 003 520570 1102 002 490980 906 001 470890 805 0 4509
100 705 0 4403110 608 0 4208120 601 0 4105130 506 0 4003150 408 0 3802170 401 0 3604200 305 0 3400
Note. p1 = 0000, q1 = 0083, p2 = 0010, q2 = 2063, qc = 0000, �1 = 0085,r = 001, and l − c = 200.
scenario is the majority, and its within-segment imi-tation parameter is significant (q1 = 0083) whereasits innovation parameter is almost zero (p1 = 0000).Hence, it is optimal for the firm to spend more oninfluentials than on imitators. Our model confirmsthis intuition by suggesting that the firm should allo-cate most of the discount dollars to the influentialssegment in order to maximize the total customervalue.
Table 8 shows that potential adopters should beinvited from both segments in new product diffusionscenario 2. Compared with new product diffusionscenario 1, the number of invitees from the imi-tators segment is significant. Indeed, the numberof invited customers from the imitators segment isabout half the number from the influentials seg-ment. This is because the proportion of the imita-tors in the combined population is about the same asthat of the influentials (�1 = 0046). Because the cross-segment imitation parameter is significant (qc = 0021),the influentials segment plays a more important rolein spreading social contagion. Our model thereforereveals that it is optimal for the firm to allocate itslimited promotion dollars more to the influentials
Table 8 Product Diffusion Scenario 2
Discount/margin Type 1 invitees Type 2 invitees Profit increase(%) (%) (%) (%)
40 1302 700 100850 908 500 80360 705 308 60470 508 300 50080 406 204 30990 306 200 300
100 208 107 202110 201 104 107210 0 0 0
Note. p1 = 0008, q1 = 0062, p2 = 0000, q2 = 0078, qc = 0021, �1 = 0046,r = 001, and l − c = 200.
Ho et al.: Customer Influence Value and Purchase Acceleration in New Product DiffusionMarketing Science 31(2), pp. 236–256, © 2012 INFORMS 251
segment while not completely ignoring the imitatorssegment.
One might be tempted to conjecture that it is alwaysoptimal to allocate more discount dollars to the influ-entials segment because it is connected with morepotential adopters. However, this is not the case. Forinstance, when we artificially set the proportion of theinfluentials to a low level (e.g., �1 = 001) in new prod-uct diffusion scenario 1, we find that it is optimal toinvite fewer potential adopters from the influentialssegment than from the imitators segment. In sum,our model suggests that, depending on the diffusionparameters, the firm should invite potential adoptersfrom either segment in a way such that the accelera-tion effect and the cannibalization effect are optimallybalanced.
Purchase acceleration also influences the socialapportioning parameter �. To better explain the rela-tionship, we examine two competing effects purchaseacceleration has on �. First, because the product lifecycle is compressed under purchase acceleration, atany point in time, the remaining pool of potentialadopters is smaller, and the discounted profit gener-ated by a customer is shared by more influencers whohave previously adopted the product. We call thiseffect the decreased share effect, which works towarddecreasing �. On the other hand, from an influencer’sperspective, each influencee on average adopts earlierand generates a higher discounted profit for the influ-encer to share. We call this effect the increased valueeffect, which works toward increasing �.
To see how � responds to the interplay between thedecreased share and increased value effects, we com-pare � before and after purchase acceleration in eachof the 32 products in Van den Bulte and Joshi (2007).Among the 20 products where it is optimal to invitenonzero customers from either segment, � increases in13 products and decreases in 7 products. Interestingly,all seven products in which � decreases as a resultof purchase acceleration have a very small influen-tials segment’s innovation parameter (p1 ≤ 00001). Thisresult suggests that when the diffusion process of theinfluentials segment is primarily driven by social con-tagion, the decreased share effect is stronger than theincreased value effect and as a result � decreases.When p1 is large, the increased value effect over-rides the decreased share effect, and hence � increasesunder purchase acceleration.
4. ConclusionIn this paper, we develop a model framework forquantifying the value of a customer in the diffusionof new product where social contagion is prevalent.Stated formally, we posit that CV = PV + IV. Ourmodel is able to decompose a customer value into herpurchase and influence values by her type (whether
the influentials or imitators segment) and by her timeof adoption. We believe this explicit account of a cus-tomer’s influence value is crucial to developing adeeper understanding of new product adoption, espe-cially in the Web 2.0 world, where social contagion iswidespread and managing it is a firm’s key priority.
Our model allows for customer heterogeneityby building on the two-segment influential–imitatorasymmetric influence model by Van den Bulte andJoshi (2007). We derive closed-form expressions forthe PV, IV, and CV for each segment. In addition, wedevelop a new endogenous method of apportioningcustomer value so that proper credits can be given toinfluencers over the course of the product life cycle.We investigate how the PV, IV, and CV vary withthe diffusion parameters and demonstrate the dynam-ics of CV for each segment under various new prod-uct diffusion scenarios reported in Van den Bulte andJoshi (2007).
Our model can be used to determine the optimalnumber of potential adopters to offer introductoryprice discounts in order to maximize firms’ total cus-tomer value. We show that firms can often increasetheir total customer value by trading lower PV withhigh IV for the total customer base. The purchaseacceleration strategy also has an interesting effecton the social apportioning parameter �. It tends todecrease � when the influentials segment has a verysmall innovation parameter and increase � when thereverse is true.
Our CV = PV + IV framework yields two usefulinsights on managing new product diffusion. First,firms should pay more attention and allocate moreresources to early adopters, because their CVs aresignificantly higher than the discounted profits theygenerate. Second, our model reveals that offeringintroductory discounts to a selected group of poten-tial customers is a direct and powerful way to accel-erate product purchases and boost firms’ total cus-tomer value.
Our model paves the way for several future researchdirections. First, our model can be extended to studythe impact of other marketing mix variables (such asprice and product) on the dynamics of the PV, IV,and CV in new product diffusion. Second, it will beworthwhile to investigate these dynamics in a compet-itive setting when our model is extended to captureactive rivalry (e.g., Savin and Terwiesch 2005). Third, itwill be interesting to examine how customer purchaseand influence values vary over time in a repeated pur-chase setting where existing customers may leave andswitch to other firms. Finally, our modeling frame-work can be generalized to incorporate settings wherethe number of potential adopters can either grow ordecline over time.

Ho et al.: Customer Influence Value and Purchase Acceleration in New Product Diffusion252 Marketing Science 31(2), pp. 236–256, © 2012 INFORMS
AcknowledgmentsThe authors thank the editor, the area editor, and twoanonymous Marketing Science reviewers for helpful com-ments and suggestions.
AppendixGeneralized solutions to F14t5 and F24t5 are given by
F14t �M11M25=1 −Ae−4p1+q15t
1 + 4q1/p15Ae−4p1+q15t1
F24t �M11M25= 1 +
(
e−4p2+q2+qc 5t
(
1 +q1
p1Ae−4p1+q15t
)−qc/q1)
·
[
q2
∫ t
0 e−4p2+q2+qc 5s
(
1+q1
p1Ae−4p1+q15s
)−qc/q1
ds
−41 + 4q1/p15A5−qc/q1
1 −M2/N2
]−1
1
where F140 � M11M25 = M1/N1, F240 � M11M25 = M2/N2, andA= p14N1 −M15/4p1N1 + q1M15.
Solution for F14t � M11M25. To simplify notation, wehereafter omit the time argument from functions and writeFi instead of Fi4t � M11M25 4i = 1125. f1 = 4p1 + q1F1541 − F15can be written as dF1/dt = 4p1 + q1F1541 − F15. The solution tothis differential equation is
F1 = 1 +e−4p1+q15t
−4q1/4p1 + q155e−4p1+q15t +C
0
Since F1405 = M1/N1, we derive C = q1/4p1 + q15 −
1/41 −M1/N15. Substituting C, we have
F1 =1 −Ae−4p1+q15t
1 + 4q1/p15Ae−4p1+q15t1
where A= p14N1 −M15/4p1N1 +q1M15. Note that A= 1 whenM1 = 0.
Solution for F24t �M11M25. We have
dF2
dt= 4p2 + qcF1 + q2F2541 − F25
=
(
p2 + qc1 −Ae−4p1+q15t
1 + 4q1/p15Ae−4p1+q15t
)
+
(
q2 − p2 − qc1 −Ae−4p1+q15t
1 + 4q1/p15Ae−4p1+q15t
)
F2 − q2F2
2 0 (30)
Equation (30) is a Ricatti equation of the general formdF2/dt = P4t5+Q4t5F2 +R4t5F 2
2 , with
P4t5= p2 + qc1 −Ae−4p1+q15t
1 + 4q1/p15Ae−4p1+q15t1
Q4t5= q2 − p2 − qc1 −Ae−4p1+q15t
1 + 4q1/p15Ae−4p1+q15t1
R4t5= −q20
We observe that F2 = 1 is a potential solution. Letz= 1/4F2 − 15. Then F2 = 1+1/z and dF2/dt = −41/z254dz/dt5.Equation (30) now becomes
−1z2
dz
dt= P4t5+Q4t5
z+ 1z
− q24z+ 152
z21
dz
dt= 4−P4t5−Q4t5+ q2
25z2−Q4t5z+ 2q2z+ q21 (31)
dz
dt=
(
q2 + p2 + qc1 −Ae−4p1+q15t
1 + 4q1/p15Ae−4p1+q15t
)
z+ q20
Equation (31) is of the form dz/dt + P14t5z=Q14t5, with
P14t5= −
(
q2 + p2 + qc1 −Ae−4p1+q15t
1 + 4q1/p15Ae−4p1+q15t
)
1
Q14t5= q20
Since F2 is continuous in 60117, z is continuous in 4−�1−17.Thus the general solution for Equation (31) is
z4t5=
∫ t
−�R4s5Q14s5 ds +C
R4t51 (32)
where R4t5= e∫
P14t5 dt . Since∫
P14t5 dt = −4p2 + q2 + qc5t −qcq1
ln(
1 +q1
p1Ae−4p1+q15t
)
1
we get
R4t5= e−4p2+q2+qc 5t
(
1 +q1
p1Ae−4p1+q15t
)−qc/q1
0
Hence,∫ t
−�
R4s5Q14s5 ds
= q2
∫ t
−�
e−4p2+q2+qc 5s
(
1 +q1
p1Ae−4p1+q15s
)−qc/q1
ds0
Substituting back into Equation (32), we obtain
z4t5=
q2
∫ t
−�e−4p2+q2+qc 5s
(
1 + 4q1/p15Ae−4p1+q15s
)−qc/q1
ds +C
e−4p2+q2+qc 5t−4qc/q15 ln41+4q1/p15Ae−4p1+q15t 50
Transforming z back to F2, we get
F2 = 1 +e−4p2+q2+qc 5t41 + 4q1/p15Ae−4p1+q15t5−qc/q1
q2
∫ t
−�e−4p2+q2+qc 5s41 + 4q1/p15Ae−4p1+q15s5−qc/q1 ds +C
0
As F240 �M11M25=M2/N2, we have
M2
N2= 1+
e−4qc/q15 ln41+4q1/p15A5
q2
∫ 0−�
e−4p2+q2+qc 5s41 + 4q1/p15Ae−4p1+q15s5−qc/q1 ds +C0
Then,
C = −e−4qc/q15 ln41+4q1/p15A5
1 −M2/N2
− q2
∫ 0
−�
e−4p2+q2+qc 5s
(
1 +q1
p1Ae−4p1+q15s
)−qc/q1
ds0
Thus,
F2 = 1 +
(
e−4p2+q2+qc 5t
(
1 +q1
p1Ae−4p1+q15t
)−qc/q1)
·
[
q2
∫ t
0e−4p2+q2+qc 5s
(
1 +q1
p1Ae−4p1+q15s
)−qc/q1
ds
−41 + 4q1/p15A5−qc/q1
1 −M2/N2
]−1
1
where A= p14N1 −M15/4p1N1 + q1M150

Ho et al.: Customer Influence Value and Purchase Acceleration in New Product DiffusionMarketing Science 31(2), pp. 236–256, © 2012 INFORMS 253
Proof of Equation (15).∫ �
t=0PV14t5f14t5 dt
=
∫ �
t=0e−rt
(
1 −�q1F14t5
p1 + q1F14t5
)
4p1 + q1F14t5541 − F14t55 dt
=
∫ �
t=0e−rt4p1 + 41 − �5q1F14t5541 − F14t55 dt1 (33)
∫ �
t=0IV14t5f14t5 dt = �q1
∫ �
t=0
∫ �
s=te−rs41 − F14s55f14t5 ds dt
+ �qc �̄∫ �
t=0
∫ �
s=te−rs41 − F24s55f14t5 ds dt
= �q1
∫ �
s=0
∫ s
t=0f14t5 dte
−rs41 − F14s55 ds
+ �qc �̄∫ �
s=0
∫ s
t=0f14t5 dte
−rs41 − F24s55 ds
=
∫ �
t=0e−rt41 − F14t554�q1F14t55 dt
+
∫ �
t=0e−rt41 − F24t554�qc �̄F14t55 dt1 (34)
∫ �
t=0PV24t5f24t5 dt
=
∫ �
t=0e−rt
(
1 −�4qcF14t5+ q2F24t55
p2 + qcF14t5+ q2F24t5
)
· 4p2 + qcF14t5+ q2F24t5541 − F24t55 dt
=
∫ �
t=0e−rt4p2 + 41 − �54qcF14t5+ q2F24t55541 − F24t55 dt1 (35)
∫ �
t=0IV24t5f24t5 dt = �q2
∫ �
t=0
∫ �
s=te−rs41 − F24s55f24t5 ds dt
= �q2
∫ �
s=0
∫ s
t=0f24t5 dte
−rs41 − F24s55 ds
=
∫ �
t=0e−rt41 − F24s554�q2F24t55 dt0 (36)
We multiply Equations (33) and (34) with �1 and multiplyEquations (35) and (36) with �2; then we add these equa-tions side by side. Equation (15) follows. �
Proof of Proposition 2. It suffices to show that PV14t5,PV24t5, IV14t5, and IV24t5 are all decreasing and convex in t.The claim for CV14t5 and CV24t5 follows since CVi4t5 =
PVi4t5+ IVi4t5 (i = 112).To prove that PV14t5 is decreasing and convex in t, we
need to show that PV′
14t5 < 0 and PV′′
14t5 > 0. We have
PV′
14t5= −e−rt
(
r
(
1 −�q1F14t5
p1 + q1F14t5
)
+�p1q141 − F14t55
p1 + q1F14t5
)
< 01
because both terms inside the bracket are positive.Moreover,
PV′′
14t5= r4−PV′
14t55+ e−rt �p1q1f14t54r + p1 + q1�5
4p1 + q1F14t552
> 00
Hence, PV14t5 is decreasing and convex in t. Similarly forPV24t5, we have
PV′
24t5 = −e−rt
(
r
(
1 −�4qcF14t5+ q2F24t55
p2 + qcF14t5+ q2F24t5
)
+�p24qcf14t5+ q2f24t55
4p2 + qcF14t5+ q2F24t552
)
< 01
and PV′′
24t5 > 0, proving that PV24t5 is decreasing and con-vex in t.
Next, IV14t5 is decreasing and convex in t because
IV′
14t5= −e−rt�q141 − F14t55− e−rt�qc �̄41 − F24t55 < 01
and
IV′′
14t5 = re−rt�q141 − F14t55+ e−rt�q1f14t5
+ re−rt�qc �̄41 − F24t55+ e−rt�qc �̄f24t5 > 00
Finally, IV24t5 is decreasing and convex in t because
IV′
24t5= −e−rt�q241 − F24t55 < 01
and
IV′′
24t5= re−rt�q241 − F24t55+ e−rt�q2f24t5 > 00 �
Proof of Proposition 3. Note that
CVm4p1q5 =
2∑
i=1
�i
∫ �
t=0PVi4t5fi4t5 dt
+
2∑
i=1
�i
∫ �
t=0IVi4t5fi4t5 dt0 (37)
From Equation (15), we know that
CVm4p105=
2∑
i=1
�i
∫ �
t=0e−rtfi4t � p105 dt1 (38)
where fi4t � p105 (i = 112) is the instantaneous adoptionfunction for type i in the hypothetical population obtainedby suppressing social influence. From Equations (3) and (4),fi4t � p105 (i = 112) are determined as
f14t � p105= p1e−p1t1 (39)
f24t � p105= p2e−p2t 0 (40)
Substituting Equations (37)–(40) into Equation (16), wehave
�1p1
p1 + r+
�2p2
p2 + r=
2∑
i=1
�i
∫ �
t=0PVi4t5fi4t5 dt0 (41)
Substituting the right-hand side (RHS) of Equation (41) withEquations (11) and (13), we show that � is determined byEquation (17).
Next we need to show that such � uniquely exists withinthe range of 60117. Note that the left-hand side (LHS) ofEquation (17) in Proposition 3 is independent of � and theRHS is decreasing in �. When � = 0, the RHS becomes�1
∫ �
t=0 e−rtf14t5 dt + �2
∫ �
t=0 e−rtf24t5 dt, where f14t5 and f24t5
are, respectively, the instantaneous adoption rates of types 1and 2 segments with social contagion. As purchase is accel-erated in the presence of social influence, LHS ≤ RHS.
When �= 1, the RHS becomes �1
∫ �
t=0 e−rtp141 − F14t55 dt +
�2
∫ �
t=0 e−rtp241 − F24t55 dt, where F14t5 and F24t5 are, respec-
tively, the cumulative adoption functions of types 1 and 2segments in the presence of social influence. The LHS is infact equal to
�1
∫ �
t=0e−rtp141 − F̂14t55 dt + �2
∫ �
t=0e−rtp241 − F̂24t55 dt1

Ho et al.: Customer Influence Value and Purchase Acceleration in New Product Diffusion254 Marketing Science 31(2), pp. 236–256, © 2012 INFORMS
where F̂14t5 and F̂24t5 are, respectively, the cumulative adop-tion functions of types 1 and 2 segments in the hypotheticalpopulation. Because F14t5 ≥ F̂14t5 and F24t5 ≥ F̂24t5 for all t,we have LHS ≥ RHS when �= 1.
Therefore, given a set of innovation parameters (p),imitation parameters (q), and other parameters (�1, �2,and r), the social apportioning parameter � can be uniquelyand endogenously determined by Equation (17) within thedesired range of 60117. �
Proof of Proposition 4. (1) To show that PV14t5 in-creases with p1, it suffices to show that ¡PV14t5/¡p1 > 0 forall t > 0. We know that
¡PV14t5
¡p1= e−rt q1�R4t5
4p1 + q1521 (42)
where R4t5 = 1 − 4p1t + q1t + 15e−4p1+q15t . Note that R405 = 0.Moreover, R′4t5= t4p1 + q15
2e−4p1+q15t > 0 for t > 0. ThereforeR4t5 > 0 for all t > 0. It follows that ¡PV14t5/¡p1 > 0 for allt > 0.
To show that PV24t5 decreases with p1, we first let Y 4t5=
qcF14t5+ q2F24t5. Then Equation (13) can be written as
PV24t5= e−rt
(
1 −�Y 4t5
p2 +Y 4t5
)
0
Its derivative with respect to p1 is
¡PV24t5
¡p1= −�e−rt ¡
¡p1
(
Y 4t5
p2 +Y 4t5
)
= −�e−rt ¡
¡Y 4t5
(
Y 4t5
p2 +Y 4t5
)
·¡Y 4t5
¡p10
It is obvious that both F14t5 and F24t5 increase with p1 fromEquations (1) and (2). (Intuitively, the higher the influen-tials segment’s innovation is, the faster the diffusion pro-cess becomes in either segment.) Hence, ¡Y 4t5/¡p1 > 0. Also,4¡/¡Y 4t554Y 4t5/4p2 + Y 4t555 = p2/4p2 + Y 4t552 > 0. It followsthat ¡PV24t5/¡p1 < 0.
We can show that both IV14t5 and IV24t5 decrease with p1because
¡ IV14t5
¡p1= −�q1
∫ �
te−rs ¡F14s5
¡p1ds
− �qc �̄∫ �
te−rs ¡F24s5
¡p1ds < 01 (43)
and
¡ IV24t5
¡p1= −�q2
∫ �
te−rs ¡F24s5
¡p1ds < 00
It follows that CV24t5 decreases with p1 because CV24t5 =
PV24t5+ IV24t5.To show how CV14t5 varies with p1, we let H4t5 =
¡CV14t5/¡p1 = ¡PV14t5/¡p1 + ¡ IV14t5/¡p1, where ¡PV14t5/¡p1 and ¡ IV14t5/¡p1 are from Equations (42) and (43). IfH4t5= 0, we must have
e−rt 1 − 4p1t + q1t + 15e−4p1+q15t
4p1 + q152
=
∫ �
te−rs ¡F14s5
¡p1ds +
qc �̄
q1
∫ �
te−rs ¡F24s5
¡p1ds0 (44)
We use R14t5 to denote the LHS and R24t5 to denote theRHS of Equation (44). Now we want to show that R14t5 isunimodal in t with a unique interior maximizer. Taking thefirst derivative with respect to t, we obtain
R′
14t5= e−rtq1
(
te−4p1+q15t − r1 − 4p1t + q1t + 15e−4p1+q15t
4p1 + q152
)
0
Thus R′14t5 = 0 if and only if 4p1 + q154p1 + q1 + r5t + r =
re4p1+q15t , the number of solutions of which is two; i.e., t = 0and t = ts for some ts > 0. Since R′
14t5 > 0 for t ∈ 401 ts5 andR′
14t5 < 0 for t ∈ 4ts1�5, R14t5 is unimodal in t with a uniqueinterior maximizer ts . Hence, R14t5 increases with t for t < tsand decreases thereafter. Note, on the other hand, that R24t5is strictly decreasing in t.
Since R1405 = 0 and R2405 > 0, H4t5 = R14t5−R24t5 startsoff at t = 0 from a negative value and eventually convergesto zero because limt→� R14t5= 0 and limt→� R24t5= 0. Thushow H4t5 behaves over time depends on the number ofintersections between R14t5 and R24t5. We define t1 such that
t1 = min{
t2 e−rt 1 − 4p1t + q1t + 15e−4p1+q15t
4p1 + q152
=
∫ �
te−rs ¡F14s5
¡p1ds +
qc �̄
q1
∫ �
te−rs ¡F24s5
¡p1ds
}
0
Then for all t < t1, H4t5 is negative and thus CV14t5decreases.
(2) First, it is clear that PV14t5 is independent of p2 be-cause Equation (11) is not a function of p2. Next, the firstderivative of PV24t5 with respect to p2 is given by
¡PV24t5
¡p2= e−rt�
qcF14t5+ q2F24t5− q2p24¡F24t5/¡p25
4p2 + qcF14t5+ q2F24t552
0 (45)
Thus PV24t5 increases with p2 if F24t5/p2 ≥ ¡F24t5/¡p2. This istrue if F24t5 increases and is concave in p2 for all t. Becausewe already showed that F24t5 is an increasing function of p2,it suffices to show that F24t5 is concave in p2 for all t. LetF24t5= 1 +N4t5/D4t5, where
N4t5= e−4p2+q2+qc 5t · 41 + 4q1/p15Ae−4p1+q15t5−qc/q1
and
D4t5= q2
∫ t
0e−4p2+q2+qc 5s41 + 4q1/p15Ae−4p1+q15s5−qc/q1
· ds − 41 + 4q1/p15A5−qc/q1/41 −M2/N250
Hence, N4t5/D4t5 is the second term on the RHS of Equa-tion (4). Then,
¡2F24t5
¡p22
=1
D4t52
[
D4t5¡2N4t5
¡p22
−N4t5¡2D4t5
¡p22
− 2¡D4t5
¡p2
¡N4t5
¡p2
+ 2N4t5
D4t5
(
¡D4t5
¡p2
)2]
0
It is easy to show that N4t5 > 0, D4t5 < 0, ¡N4t5/¡p2 < 0,¡D4t5/¡p2 < 0, ¡2N4t5/¡p2
2 > 0, and ¡2D4t5/¡p22 > 0. There-
fore, ¡2F24t5/¡p22 < 0 and F24t5 is concave in p2 for all t > 0
as desired.

Ho et al.: Customer Influence Value and Purchase Acceleration in New Product DiffusionMarketing Science 31(2), pp. 236–256, © 2012 INFORMS 255
F24t5 increases with p2 from Equation (2), and therebyIV14t5 and IV24t5 both decrease with p2 because
¡ IV14t5
¡p2= −�qc �̄
∫ �
te−rs ¡F24s5
¡p2ds < 01
and
¡ IV24t5
¡p2= −�q2
∫ �
te−rs ¡F24s5
¡p2ds < 00 (46)
It follows that CV14t5 decreases with p2.From Equations (45) and (46), we have ¡CV24t5/¡p2 = 0 if
and only if
e−rt44qc/q25F14t5+ F24t5− p24¡F24t5/¡p255
4p2 + qcF14t5+ q2F24t552
=
∫ �
te−rs ¡F24s5
¡p2ds0 (47)
In Equation (47), LHS = 0 at t = 0 and limt→� LHS = 0.On the other hand, RHS > 0 at t = 0 and limt→� RHS = 0.Hence there exists a nonzero cutoff time such that CV24t5decreases with p2 for all t < t2. Such a cutoff time isdefined as
t2 = min{
t2e−rt44qc/q25F14t5+ F24t5− p24¡F24t5/¡p255
4p2 + qcF14t5+ q2F24t552
=
∫ �
te−rs ¡F24s5
¡p2ds
}
0 �
Proof of Proposition 5. (1) To prove PV14t5 decreaseswith q1, it suffices to show that ¡PV14t5/¡q1 < 0 for all t > 0:
¡PV14t5
¡q1= e−rt p1�4R4t5− 15
4p1 + q152
1
where R4t5 = 41 − q1t − q21 t/p15e
−4p1+q15t . Note that¡PV14t5/¡q1 < 0 if and only if R4t5 < 1. Moreover,
R′4t5=1p1
4q1t − 154p1 + q152e−4p1+q15t 0
Now observe that R′4t5 < 0 for t < 1/q1 and R′4t5 ≥ 0 there-after. Thus R4t5 has a unique minimizer at t = 1/q1 and hasits maximum at either t = 0 or t = �. Note that R405= 1 andlimt→� R4t5= 0. Hence, R4t5 < 1 for all t > 0. It follows that¡PV14t5/¡q1 < 0 for all t > 0.
To show that PV24t5 decreases with q1, we first let Y 4t5=
qcF14t5+ q2F24t5. Then Equation (13) can be written as
PV24t5= e−rt
(
1 −�Y 4t5
p2 +Y 4t5
)
1
and thus
¡PV24t5
¡q1= −�e−rt ¡
¡q1
(
Y 4t5
p2 +Y 4t5
)
= −�e−rt ¡
¡Y 4t5
(
Y 4t5
p2 +Y 4t5
)
·¡Y 4t5
¡q10
It is clear from Equations (1) and (2) that F14t5 and F24t5 bothincrease with q1. (Intuitively, the higher the influentials seg-ment’s within-segment imitation parameter is, the faster thediffusion process is in either segment.) Hence ¡Y 4t5/¡q1 > 0.
Also, 4¡/¡Y 4t554Y 4t5/4p2 +Y 4t555= p2/4p2 +Y 4t552 > 0. It fol-lows that ¡PV24t5/¡q1 < 0.
IV24t5 decreases with q1 because
¡IV24t5
¡q1= −�q2
∫ �
te−rs ¡F24s5
¡q1ds < 00
It follows that CV24t5 decreases with q1 because PV24t5 andIV24t5 both decrease with q1.
To see how IV14t5 varies with q1, we investigate
¡IV14t5
¡q1= �
∫ �
s=te−rs
(
1 − F14s5− q1¡F14s5
¡q1
)
ds
+ �qc �̄∫ �
s=te−rs
(
−¡F24s5
¡q1
)
ds0 (48)
Let H4s5 = 1 − F14s5 − q14¡F14s5/¡q15. Equating H4s5 to 0yields
q21
p1e−4p1+q15s + 2q1 + p1 = p1q1s + q2
1s0 (49)
Note that the LHS of Equation (49) is decreasing in s,whereas the RHS is increasing in s. Moreover, when s = 0,the LHS is greater than the RHS (i.e., H405 > 0), and theRHS exceeds the LHS (i.e., H4s5 < 0) for large enough s.Thus H4s5 decreases from positive to negative and hits zeroexactly once. Therefore, in Equation (48), the term inside thefirst integral is positive for small s and negative for large s.Thus the maximum value of the first integral is achievedat t = 0. Thus, the left term on the RHS of Equation (48)decreases, then becomes negative for sure (even if it startsoff as positive at t = 0), and then converges to zero fromnegative as t → �. Since we know ¡F24s5/¡q1 > 0 for all s > 0,the right term on the RHS of Equation (48) starts off as neg-ative, increases in t, and converges to zero from negativeas t → � (note that it is never positive). Therefore, theremust exist a cutoff time t3 (which may be zero) such thatIV14t5 decreases with q1 for all t > t3. The cutoff time t3 isdefined as
t3 = max{
t2∫ �
te−rs
(
1 − F14s5− q1¡F14s5
¡q1
− qc �̄¡F24s5
¡q1
)
ds = 0}
0
As a consequence, when t > t3, CV14t5 decreases with q1because PV14t5 and IV14t5 both decrease with it.
(2) PV14t5 is independent of qc because Equation (11) isnot a function of qc . To show that PV24t5 decreases withqc , we let Y 4t5= qcF14t5+ q2F24t5. Then Equation (13) can bewritten as
PV24t5= e−rt
(
1 −�Y 4t5
p2 +Y 4t5
)
1
and thus
¡PV24t5
¡qc= −�e−rt ¡
¡qc
(
Y 4t5
p2 +Y 4t5
)
= −�e−rt ¡
¡Y 4t5
(
Y 4t5
p2 +Y 4t5
)
·¡Y 4t5
¡qc0
F24t5 increases with qc because higher cross-segment imita-tion speeds up the diffusion process. Thus ¡Y 4t5/¡qc > 0.
Ho et al.: Customer Influence Value and Purchase Acceleration in New Product Diffusion256 Marketing Science 31(2), pp. 236–256, © 2012 INFORMS
Moreover, 4¡/¡Y 4t554Y 4t5/4p2 + Y 4t555 = p2/4p2 + Y 4t552 > 0.It follows that ¡PV24t5/¡qc < 0.
IV24t5 decreases with qc because
¡ IV24t5
¡qc= −�q2
∫ �
te−rs ¡F24s5
¡qcds < 00
As a consequence, CV24t5 decreases with qc .To see how IV14t5 changes with qc , we differentiate IV14t5
with respect to qc . We have
¡ IV14t5
¡qc= ��̄
∫ �
s=te−rs
(
1 − F24s5− qc¡F24s5
¡qc
)
ds0
Thus IV14t5 and CV14t5 decrease with qc if the above equa-tion is negative.
(3) The proofs are similar to those in part (2). �
Proof of Proposition 6. We first rewrite the optimiza-tion problem (P) (see Equation (27)) as
�∗
0 = max0≤M1≤N1
4l−c5N
(
e−rt�1F14t �M15∣
∣
t=�−e−rt�1F14t �M15
∣
∣
t=0
+ r∫ �
0e−rt�1F14t �M15 dt
)
+ 4l− c5N
(
e−rt�2F24t �M15∣
∣
t=�− e−rt�2F24t �M15
∣
∣
t=0
+ r∫ �
0e−rt�2F24t �M15 dt
)
+ 4l− d− c5M1
= max0≤M1≤N1
4l− c5N
(
r∫ �
0e−rt4�1F14t5+ �2F24t55 dt −
M1
N1�1
)
+ 4l− d− c5M11
where F14t � M15 and F24t � M15 are Equations (18) and (19),respectively. Taking the first-order condition with respect toM1, we obtain
∫ �
0G4t1M15 dt =
d
4l− c5r1
where
G4t1M15= e−rtN
(
�1¡F14t �M15
¡M1+
�2¡F24t �M15
¡M1
)
0
It is easy to show that �∗0 is concave in 0 ≤M1 ≤N1. Hence
Proposition 6 naturally follows. �
ReferencesBass, F. M. 1969. A new product growth for model consumer
durables. Management Sci. 15(5) 215–227.Bawa, K., R. Shoemaker. 2004. The effects of free sample promotions
on incremental brand sales. Marketing Sci. 23(3) 345–363.Chatterjee, R., J. Eliashberg. 1990. The innovation diffusion process
in a heterogeneous population: A micromodeling approach.Management Sci. 36(9) 1057–1079.
Godes, D., D. Mayzlin. 2009. Firm-created word-of-mouth com-munication: Evidence from a field test. Marketing Sci. 28(4)721–739.
Goldenberg, J., O. Lowengart, D. Shapira. 2009. Zooming in: Self-emergence of movements in new product growth. MarketingSci. 28(2) 274–292.
Ho, T.-H., S. Savin, C. Terwiesch. 2002. Managing demand and salesdynamics in new product diffusion under supply constraint.Management Sci. 48(2) 187–206.
Jain, D., V. Mahajan, E. Muller. 1995. An approach for determiningoptimal product sampling for the diffusion of a new product.J. Product Innovation Management 12(2) 124–135.
Lehmann, D., M. Esteban-Bravo. 2006. When giving some awaymakes sense to jump-start the diffusion process. Marketing Lett.17(4) 243–254.
Libai, B., E. Muller, R. Peres. 2009. Sources of social value in word ofmouth programs. Marketing Science Institute Working Paper10-103, MSI, Cambridge, MA.
Marks, L. J., M. A. Kamins. 1988. The use of product samplingand advertising: Effects of sequence of exposure and degree ofadvertising claim exaggeration on consumers’ belief strength,belief confidence and attitudes. J. Marketing Res. 25(3) 266–281.
Muller, E., G. Yogev. 2006. When does the majority become amajority? Empirical analysis of the time at which main marketadopters purchase the bulk of our sales. Tech. Forecasting Soc.Change 73(9) 1107–1120.
Peres, R., E. Muller, V. Mahajan. 2010. Innovation diffusion andnew product growth models: A critical review and researchdirections. Internat. J. Res. Marketing 27(2) 91–106.
Savin, S., C. Terwiesch. 2005. Optimal product launch times in aduopoly: Balancing life-cycle revenues with product cost. Oper.Res. 53(1) 26–47.
Van Ackere, A., D. J. Reyniers. 1995. Trade-ins and introductoryoffers in a monopoly. RAND J. Econom. 26(1) 58–74.
Van den Bulte, C., Y. V. Joshi. 2007. New product diffusion withinfluentials and imitators. Marketing Sci. 26(3) 400–421.