customer-perceived value in residential developments: the
TRANSCRIPT
Customer-perceived value in residential developments: the case of Hornsberg Strand, Sweden
Berndt, Lundgren
Associate Professor in the Department of Building and Construction Management, Division
of Building and Real Estate Economics, Royal Institute of Technology, Stockholm, contact:
Abstract This paper presents a new model using the structural equation technique. This model
integrates productivity theory and customer-perceived value to identify those key features
which residential customers are looking for when making their decision to buy or to rent a
residential apartment. The theoretical structural equation model was confirmed using a
dataset from 283 respondents, being potential tenants of an ongoing residential construction
project in Sweden consisting of 402 rental apartments. Our results show that expectations of
being able to relax in the immediate neighborhood as well to feel safe in the neighborhood
had a high impact on customer perceived value. Moreover, analysis of a two bedroom
apartment, used as a show apartment, shows that an apartment with plenty of natural daylight
and a well proportional layout had the highest impact on customer perceived value.
Professional developers and municipalities could use the proposed residential customer
perceived value model (RCPV-model) to increase their understanding of customer-perceived
values by verifying key drivers in successful residential projects and acting on those when
planning new development projects.
Key words:
Customer perceived value, productivity analysis, structural equation modeling, residential
construction project.

2
1 Introduction The use of the customer value hierarchy model to improve organizations’ understanding of
how to deliver increased customer value has been demonstrated by Woodruff (1997). The
customer value hierarchy model provides a framework for exploring the linkage between
customers’ desired value, evaluation of received value and overall customer satisfaction. The
concept of customer-perceived value has been widely discussed in the marketing literature
(Zeithaml, 1988; Patterson & Spreng, 1997; Woodruff, 1997; Ulaga & Chacour, 2001; Lin,
Sher & Shih, 2005). Despite the importance of customer-perceived value, there has been
relatively little empirical research to develop an in-depth understanding of the concept
(Sweeney & Soutar, 2001). The aim of this paper is to present a theoretically grounded
structural equation model (SEM) (Bollen, 1989), implemented using LISREL (Jöreskog &
Sörbom, 1993) which can be used to identify those locational and physical attributes that
effects customer-perceived value in a residential development project. If we can validate
direct and indirect relationships in the SEM-model using empirical data, we have made a first
test in developing a reusable model. The SEM model is based on productivity theory
(Ratcliff, 1961; Lancaster, 1966) and the customer value hierarchy model (Woodruff, 1997).
Before advancing to confirmatory factor analysis using the conceptual SEM-model,
exploratory factor analysis is used to reduce 31 items derived from a qualitative study to a
number of factors. Since productivity theory predicts that locational and physical attributes
have an effect on the attractiveness of a residential development the theoretical SEM-model
is used to search for those items that maximize the nomological value of the model. Items
used in the SEM-model were entered into a second factorial analysis (principal component
analysis, varimax rotation) to verify that they load only on the locational and the physical
attributes constructs respectively. Using this approach those items that have the highest effect
on customer-perceived value were identified.

3
2 Background The object in this study is an ongoing multi-family housing project having three main
buildings, comprising 402 rental apartments in located in the western part of Kungsholmen,
within the vicinity of the City of Stockholm, see figure 1 and 2.
Figure 1. Overview of the project site Hornsberg Strand, Stockholm.
Figure 2. Illustration of the completed project by Familjebostäder.

4
The project, Hornsberg Strand, is part of a new neighborhood close to the waterfront of the
lake Ulvsundasjön as well as to the highway, Essingeleden, which conducts most of the
traffic passing from the northern to the southern parts of Stockholm. Retail stores, small cafés
and restaurants are established in the neighborhood which had previously been dominated by
industrial and office buildings. When Hornsberg Strand is completed in 2014, nearly 20,000
new residents will be living in the neighborhood. All of the rental apartments a high-quality
kitchen and bathroom, a balcony facing the court-yard or towards the local street, see figure 3.
Figure 3. Illustration of the show room apartment used in this study.
However, it is well recognized that real estate is different from other commodities in several
aspects since each parcel of land is unique in its location and composition, land is physically
immobile and durable, the cost of ownership is high and the search process in itself is
complex. The decision-making process for consumers looking for land to buy or an
apartment to rent differs from that used for other commodities, such as a can of Coca Cola or
a car. Consumers looking for a new build apartment have ex-ante limited information on how
the development will look when completed and have to sign a contract before moving in.
However, a detailed understanding of the search process for residential construction

5
customers is still missing and residential customers tend to develop a mixture of objective
and subjective beliefs about the completed development due to complexity of the product
(Forsythe, 2007).
It is likely that the residential customer develops an overall value judgment as to whether or
not this property could be considered, regarding the physical and social dimensions related to
the location of the property, and reflects upon whether the price or rent in relation to the
standard of the home and amenities in the neighborhood provide them with good value for
money (VFM). For example, if the property is located in an area where crime is known to be
high that would, in most cases, lower their interest in becoming buyers or tenants, if the price
for occupancy did not compensate them for the inconvenience. A potential buyer or tenant
may found his decision on what he discovers from a showroom at the site, his previous
experiences, drawings, animations or pictures to imagine how it is going to be to live in the
new development when completed. During the completion of the development, his
expectations will develop based on what he observes and is informed about. Factors that may
contribute to the development of his expectations are, for example, the image of the
neighborhood (Clow et al, 1997), location of the development, public amenities such as parks
and town squares, public transportation and services such as restaurants and retail service, the
existence of waterfronts and access to leisure activities, and the quality of schools.
Some important insights are raised by Woodruff (1997) which may improve our
understanding of how to deliver customer value to potential residents: firstly, what exactly do
customers value; secondly, of all the things customers value, on which ones should we focus
to achieve advantage; thirdly, how well do customers think we deliver value and, lastly, how
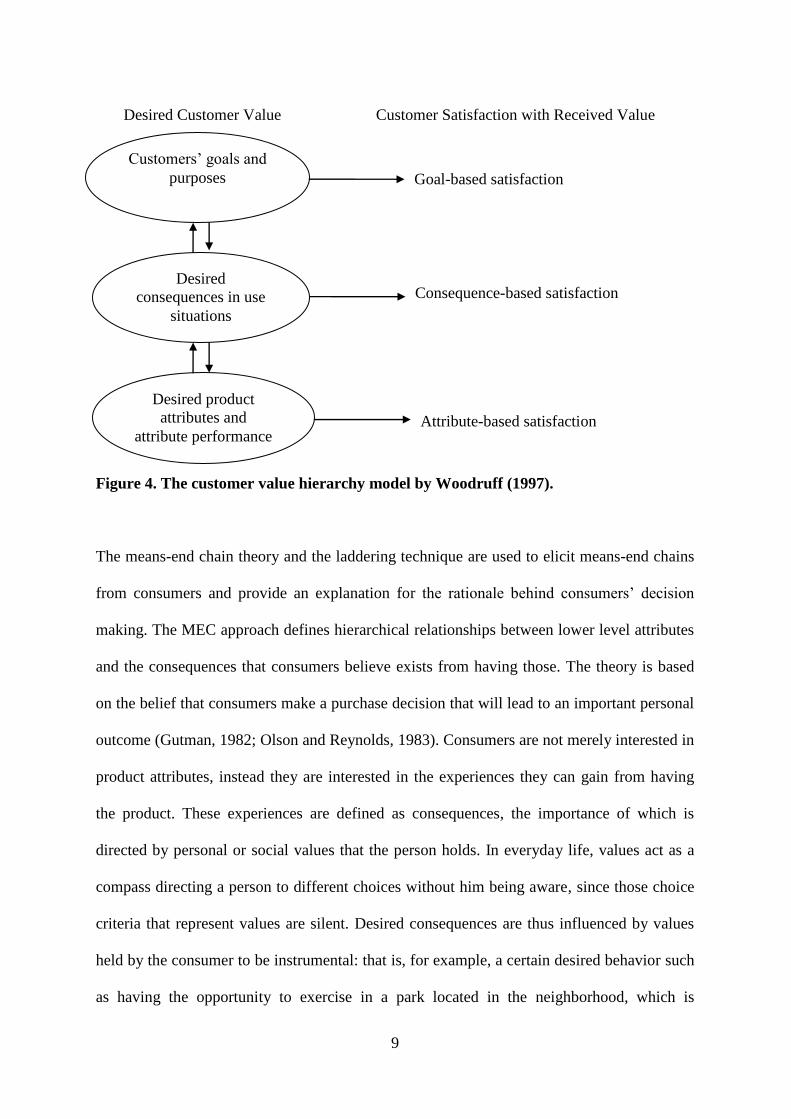
will what customers value change in the future? The customer value hierarchy model, in
figure 4, accounts for psychological effects on value statements through desired

6
consequences in use situations and shows how these factors are related to customers’ goals
and values. According to Woodruff (1997), consequences in use situations are far more
important to consumers than product attributes and should therefore be in focus to achieve
customer value.
In real estate theory, productivity theory provides a framework for the analysis of factors that
are important for real estate value. Productivity analysis includes the psychological
satisfaction which is generated by amenity factors such as a scenic view or other natural
features (Fanning, 2005). Both a qualitative and a quantitative study were undertaken to
investigate factors affecting customer-perceived value. The study began with qualitative
laddering interviews which is an interview technique used for capturing beliefs about benefits
and disadvantages which potential tenants believe exist in the residential construction project
Hornsberg Strand. Potential tenants’ beliefs about the development were used to identify
product attributes, functional and psychological consequences and personal values, according
to the customer value hierarchy model. The results from the laddering study were
successively used in the design of a quantitative survey to investigate structural relationships
between latent constructs representing physical and locational features which, according to
productivity theory, have an effect on people’s decision making.
By using a structural equation modeling approach we identified key features and the relative
importance of physical and locational attributes that potential tenants believe are important
for providing perceived value. However, market studies of residential developments are not
without obstacles as a housing project is a truly multidimensional product and the difficulties
in acquiring useable information from consumers as input to developers in the conceptual
design phase are well known. Bookout (1994) provides an example of the difficulties
developers face: “One of the most interesting and consistent findings is the inability of

7
tenants and residents to isolate the design feature they value highly”. Residents and tenants
almost universally perceive a residential project as a whole, not as a series of parts that could
be measured and rated individually. A similar idea has been presented by Psilander (2004),
who refers to consumers’ inability to separate the characteristics of a housing project into its
different parts, instead interpreting the project as a complete whole. An important question
for real estate market analysis is thus to increase our capability in identifying those design
features separated from the whole that create value to different customer segments and help
managers improve their understanding of their customers.
3 Literature review and hypotheses
Real estate is certainly a high involvement product which we need to consider while
specifying the theoretical structural equation model. In specifying the SEM model, a theory
that connects real estate with its users – productivity theory – was used. This theory rests on
the belief that the productivity of a property depends on how different attributes are
combined and how potential customers react to those attributes (Ratcliff, 1961; Lancaster,
1966). Analysis of productivity involves an examination of how the market perceives
physical, legal and locational dimensions of a property. Physical attributes are categorized as
man-made or natural, which are located either off- or on-site. The legal dimension exercises
control by zoning, for example over negative external effects such as traffic noise, as well as
for the location of building structures, roads and green areas such as parks. Locational
attributes are static or dynamic features. Static features include linkage and land use
associations where linkage refers to the movement of people and includes roads and utilities
and land use associations define how land use supports a development. Dynamic locational
features refer to changes of the growth direction of a city (Ratcliff, 1961; Fanning, 2005).
The value construct has been widely researched in different disciplines such as economics,
accounting, finance, strategy, production management and marketing (Wilson & Swanti,

8
1997). However, customer-perceived value is a concept found within the discipline of market
research (Zeithaml, 1988; Monroe, 1991; Patterson & Spreng, 1997; Woodruff, 1997;
McDougall & Levesque, 2000; Ulaga & Chacour, 2001; Lin, Sher & Shih, 2005). Since
value is a multipurpose construct there is no universal single agreement on the definition of
value, thus the definition of value varies depending on the specific research discipline
(Sweeney, 1994). To make the concept of value even more complex respondents tend to vary
as well in their own personal interpretation of perceived value, as discussed by (Zeithaml,
1988), who found four different categories of perceived value: “value is low price”, “value is
whatever I want in a product”, “value is the quality I get for the price I pay” and “value is
what I get for what I give”.
The definition finally defined by Zeithaml implies that consumers make a trade-off between
the perceived benefits of having a product or receiving a service vis-à-vis the perceived costs
for acquiring the same. Value for money is the relationship between the costs and quality of a
product and the perception of perceived value directly influences willingness to buy (Doods,
Monroe, and Grewal, 1998). The perceived value construct is operationalized as a value-for-
money statement in this study, which is common when investigating perceived value (Grewal,
Monroe, and Krishnan, 1998; Sweeney, Soutar, & Johnson, 1999). The definition of
customer value used in this study is adopted from Woodruff (1997): “Customer value is a
customer’s perceived preference for and evaluation of those product attributes, attribute
performances, and consequences arising from use that facilitates (or blocks) achieving the
customer’s goals and purposes in use situations”. This definition follows the means-end
chain model (Gutman, 1982; Woodruff & Gardial, 1996) and is anchored in the conceptual
framework (see figure 4).
9
Figure 4. The customer value hierarchy model by Woodruff (1997).
The means-end chain theory and the laddering technique are used to elicit means-end chains
from consumers and provide an explanation for the rationale behind consumers’ decision
making. The MEC approach defines hierarchical relationships between lower level attributes
and the consequences that consumers believe exists from having those. The theory is based
on the belief that consumers make a purchase decision that will lead to an important personal
outcome (Gutman, 1982; Olson and Reynolds, 1983). Consumers are not merely interested in
product attributes, instead they are interested in the experiences they can gain from having
the product. These experiences are defined as consequences, the importance of which is
directed by personal or social values that the person holds. In everyday life, values act as a
compass directing a person to different choices without him being aware, since those choice
criteria that represent values are silent. Desired consequences are thus influenced by values
held by the consumer to be instrumental: that is, for example, a certain desired behavior such
as having the opportunity to exercise in a park located in the neighborhood, which is
Desired Customer Value
Customer Satisfaction with Received Value
Customers’ goals and
purposes
Desired
consequences in use
situations
Desired product
attributes and
attribute performance
Goal-based satisfaction
Consequence-based satisfaction
Attribute-based satisfaction

10
triggered by a terminal value, that is, a desired end state such as well-being or a long, healthy
life. For an elaborate presentation of the means-end chain approach and the laddering
technique in a real estate context see Lundgren (2010) and Coolean & Hoekstra (2001).
A concept related to customer-perceived value is customer satisfaction, which focuses on
obtaining competitive advantage in the market place (Cronin & Taylor, 1992). The
dominating paradigm within customer satisfaction research is the disconfirmation model
which measures the difference between the performance of a product or service vis-à-vis
consumers’ expectations. The disconfirmation paradigm is used in different sectors such as
the service industry (Parasuraman, Zeithaml and Barry, 1988; Cronin & Taylor, 1994) or to
evaluate product performance (Oliver, 1977, 1980, 1997). Customer satisfaction is also
measured within industry sectors using a customer satisfaction barometer (Fornell, 1992;
Fornell et.al, 1997).
Customer satisfaction in residential construction has been studied for example by Forsythe
(2007, 2008). In Patterson & Spreng (1997), the authors show that customer-perceived value
has a strong causal impact on customer satisfaction. However, customer satisfaction (CS)
measures consumers’ evaluation of a product or service ex-post when customers have
acquired experience by using the product or the service provided, which make the customer
satisfaction construct less suitable for ex-ante studies. In reviewing the existing literature no
studies were found that empirically investigate perceived value using the customer value
hierarchy in a residential construction project.
An established theory can a priori define latent variables having causal relationships and a
hypothesis can be tested by specifying causal relationships in a structural equation model
using empirical data (Bollen, 1989; Hayduk, 1987; Jöreskog and Sörbom, 1993). A structural
equation model in LISREL is represented by indicators, relationships and latent variables.

11
Indicators are often numerical expressions that capture a measurement of an attitude or a
number which represents for example a profit margin, or a sales figure. Indicators are part of
a latent variable or constructs which represent the latent, common properties of the indicators.
A latent variable is thus an abstract entity that, defined by its indicators, represents a specific
phenomenon in the real world.
In our study of customer-perceived value, perceived value is an example of a construct,
representing a value-for-money statement from the perspective of a customer. Lastly,
relationships between constructs represent a causal consequence between two latent variables.
LISREL derives causal structures by analyzing both regular correlation and error covariances.
By using LISREL, it is possible to analyze both direct and indirect causal relations
simultaneously (Jöreskog & Sörbom, 1993). The first option in specifying customer-
perceived value in a SEM-context is to define the construct as a unidimensional and global
measure of overall customer value perception (Baker et al, 2002; Sweeney et al, 1999,
Grewal et al, 1998; Cronin et al 1997; Patterson & Spreng, 1997, Varki & Colgate, 2001), or
as a formative and reflective second-order construct (Lin, Sher & Shih, 2005). The latter
authors criticize the former approach for not taking into account the complex nature of the
perceived value construct. However, the authors approve the use of a unidimensional first
order construct when the objective is to access overall value perceptions at the component
level of a product.. A description of how to use SEM and LISREL in a strategic theory
testing is found in Kotha, Vadlamani & Nair (1997).
3.1 Formulation of hypotheses
The starting point for the formulation of hypotheses is the argument that potential residential
tenants’ perceived value of the location of the property and physical features of the home can
be represented by attributes, consequences and goals perceived, and held by residential

12
customers according to the customer hierarchical value model Woodruff (1997). As has been
discussed in relation to the customer hierarchical value model, it is likely that customers first
of all formulate an overall judgment concerning whether the location is acceptable or not; if
not, the search process will continue until a match between their needs, expectations and
budget constraints are met. If the location is accepted the apartment has to be acceptable as
well, if not the search process for a substitute apartment within the neighborhood is likely to
start again. I hypothesize that, using the SEM-model in figure 5, the overall value construct
serves as a mediating construct of the location attributes construct, as well as of the physical
attributes construct on perceived value. I also hypothesize that a positive evaluation of the
locational attributes and the physical attributes construct will cause a positive direct effect on
both overall value and customer perceived value.
13
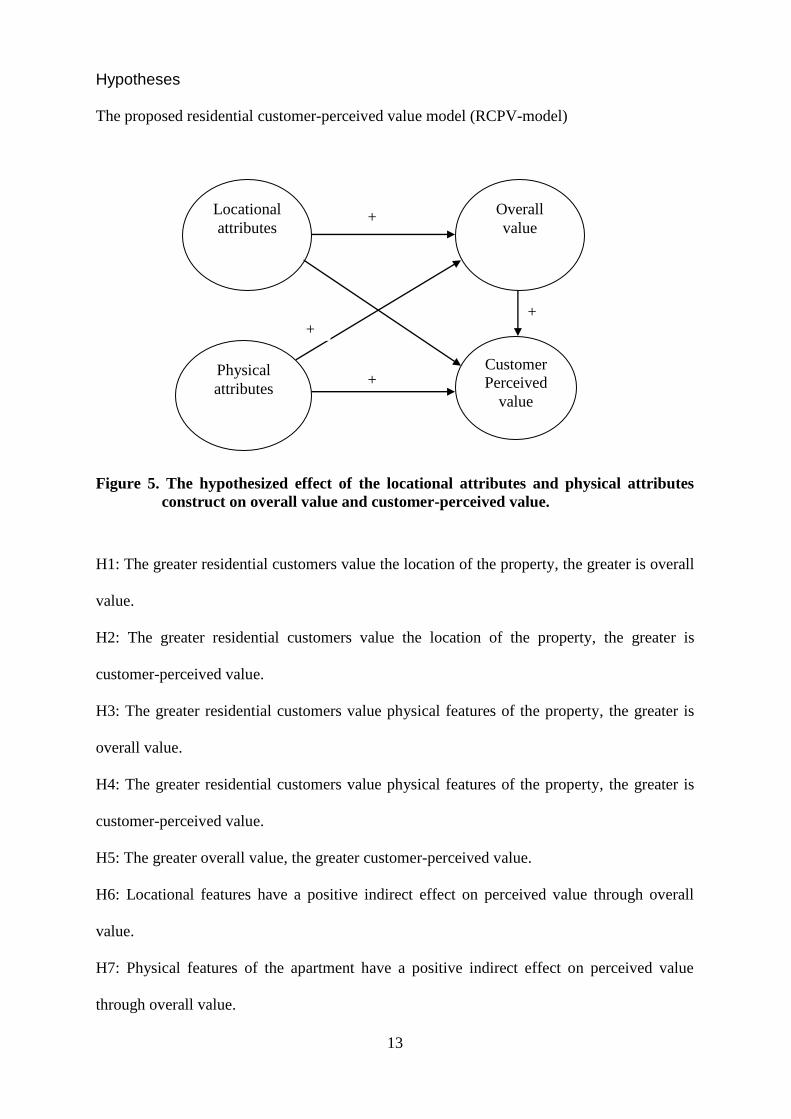
Hypotheses
The proposed residential customer-perceived value model (RCPV-model)
Figure 5. The hypothesized effect of the locational attributes and physical attributes
construct on overall value and customer-perceived value.
H1: The greater residential customers value the location of the property, the greater is overall
value.
H2: The greater residential customers value the location of the property, the greater is
customer-perceived value.
H3: The greater residential customers value physical features of the property, the greater is
overall value.
H4: The greater residential customers value physical features of the property, the greater is
customer-perceived value.
H5: The greater overall value, the greater customer-perceived value.
H6: Locational features have a positive indirect effect on perceived value through overall
value.
H7: Physical features of the apartment have a positive indirect effect on perceived value
through overall value.
Locational
attributes
Physical
attributes
Overall
value
Customer
Perceived
value
+
+
+
+

14
4 Method
Laddering study and analysis
The data collection for the laddering study was made during a period of three weeks from
late September to mid-October 2010. The group of potential tenants asked to participate
consisted of 32 respondents aged 28–62 who been randomly selected by the residential
agency Stockholm Stads Bostadsförmedling. This agency is a non-profit organization owned
by Stockholm municipality and acts as a broker of residential apartments in Stockholm. The
respondents were selected before and soon after their actual decision to sign a contract. 20
respondents accepted the request to be participants in the study and were asked to perform a
walk-through evaluation (Ambrose & Dyregaard, 1993) of the residential site and its
surroundings (approximately 400 meters from the buildings), as well as visiting the two-
bedroom apartment used as a show apartment (see figure 3). In the walk-through evaluation
the respondents were asked to write down three positive and three negative observations and
indicate their importance.
These observations were later used as the starting point in the laddering interviews, which
were held during a telephone interview conducted by the author shortly after the walk-
through evaluation of the development. A total of 20 walk-through surveys were handed out
and 16 were subsequently returned in a prepaid envelope, making a response rate of 50
percent. The answers from the respondents were then classified into a certain type according
to the means-end chain theory and the customer hierarchical value model (attributes,
functional or psychological consequences, instrumental or terminal values). The laddering
analysis resulted in 102 ladders, which rendered six hierarchical value maps covering the
means-end chains of potential tenants. Hierarchical value maps were made using
MECanalyst software, version 1.0.14. For an explanation of hierarchical value maps see
Lundgren (2010).

15
The questionnaire
The most frequent beliefs found in the hierarchical value maps and analysis of respondents’
answers in the laddering interviews were used in the creation of 34 cognitive attitude
statements. These statements were pre-tested using 6 staff members (4 male and 2 female)
from the School of Architecture and the Built Environment, The Royal Institute of
Technology, Stockholm. 31 attitude statements were included in the final questionnaire; 3
statements were discarded because of a high correlation with other statements. The
questionnaire consisted of street maps and photos for each of the locations in Hornsberg
Strand, 31 statements and a final section with questions to capture perceived-value
statements, as well as questions to obtain contact information, socio-economic and socio-
demographic information (see appendix). Respondents were informed of the monthly rent of
the two-bedroom apartment, which standard was representative for other apartments in the
development, as well as of additional costs such as electricity and insurance. The perceived
value construct is operationalized as a value-for-money statement instead of asking if the
show apartment was affordable, since potential tenants might believe that the apartment is
affordable but does not provide good value for money. The strength of the respondents’
beliefs was measured using both positively and negatively formulated statements on a seven-
point scale Likert scale (1 = disagree absolutely to 7 = agree absolutely).
Data collection
The recruitment of respondents for the quantitative survey was made at two open showings
of the show apartment arranged by the developer, Familjebostäder. Only potential tenants
who had been pre-registered, indicating their interest in an apartment in the 402-apartment
project were invited. Each open showing was visited by approximately 500 people per day.
In total 523 individuals accepted the request to participate in our study as they left the
apartment and a survey was sent by mail to these respondents. 297 surveys were received by

16
mail and, after review, 15 surveys were excluded as incomplete, resulting in 283 valid
questionnaires and a response rate of 54%. 254 females (91%) and 24 males (9%) answered
the questionnaire. The mean age of the respondents was 45 and the standard deviation was
14.8 years.
The structural equation model
The RCPV-model that is presented in figure 5 defines two independent unidimensional latent
first-order constructs such as the locational construct and the physical features construct
adopted from productivity theory. Two second-order dependent latent constructs are defined
as the overall value construct and the perceived value construct. Standardized solutions are
presented in the model. Listwise deletion was used to treat missing values and estimates were
made using the robust maximum likelihood method, LISREL version 8.7.
Constructs and items
The Kaiser-Mayer-Olkin test of the suitability of the correlation matrix for factor analysis
showed that the data set was factorable, value 0.85, which is greater than the minimum level
of 0.60 (Worthington & Whittaker, 2006). The internal-consistency reliability of the sub-
scales from the current sample was investigated using Cronbach’s Alpha which varies
between 0.73 and 0.90. The cumulative variation of the locational dimensions (maximum
likelihood, varimax rotation) by five sub-factors where, 55.3 percent. The cumulative
variation of the physical feature dimension is by two sub-factors, 56.9 percent. Seven factors
was derived from the exploratory factor analysis, five factors relating to locational attributes
and two factors relating to physical attributes, see appendix, table 2.
In order to identify which items among the set of seven factors that maximize the
nomological value of the conceptual SEM-model each item were subsequently entered into
17
the SEM-model. If it failed to increase the nomological value of the model an item was
discharged and replaced with another item until the nomological value reached a maximum,
see appendix, table 3. Seven items was finally selected and entered into an additional
explorative factor analysis (maximum likelihood, varimax rotation) to confirm that those
items load only on the locational and the physical attribute construct. The explorative factor
analysis confirmed that this was the case. This result was confirmed also by analysis of
discriminant validity which was performed using LISREL. The correlation matrix for
independent variables is presented in the appendix, see table 4.
The location construct consist of four items and the physical features construct of three items
derived from exploratory factor analysis. The overall value construct and the perceived value
construct are items specially designed for this study alone and consist of three items
measuring an overall attitude to the neighborhood: the first item capturing an overall
impression of the neighborhood, the second capturing word-of-mouth – whether the
respondent could recommend Hornsberg Strand to their friends – and the third on whether
the respondent believes he will thrive in Hornsberg Strand. The first item in the perceived
value construct captures a value-for-money statement by asking whether the respondent
believes the location provides value for money, the second item captures whether the
respondent believes the apartment provides value for money and the third item captures an
overall standpoint: whether the home provides good value for money. All items are measured
on a seven-point Likert scale (1 = disagree absolutely to 7 = agree absolutely).
Convergent validity
Assessment of the homogeneity of indicators and their construct is made to validate whether
the constructs relate only to the chosen indicators. Convergent validity is assessed by
investigating coefficients which measure the strengths of the relationship between two

18
variables: t-values which measure statistical significance and R2 values that estimate the
strength of linearity of a relationship (Jöreskog and Sörbom, 1993).
Discriminant validity
Assessment of the separateness of constructs is made to determine discriminant validity
between constructs. Discriminant validity is assessed by measuring the correlation between
two constructs using a confidence interval and the standard error of the constructs and should
have a value below 1.0 (Jöreskog & Sörbom, 1993, p19). An alternative control can be made
using the modification index that suggests changes to the model in LISREL.
Nomological validity
Nomological validity is an assessment which is made to ensure that the model as a whole is a
valid measure. The validity of a structural equation model is determined by measuring
nomological validity (Bollen, 1989; Jöreskog and Sörbom, 1993). Nomological validity is
assessed by measuring the distance between the model and the data that represents constructs
using Chi-Square, degrees of freedom (χ2,
, df) and a probability estimate (p value). A valid
measure of nomological validity for a structural model is when the relation between (χ2,
, df)
is close to one and the p value is higher than 0.05. Analysis of the structural equations using
LISREL was made by first determining the convergent validity of the indicators and then the
discriminant validity of the constructs. In the second step, causal relationships between the
constructs were analyzed to determine nomological validity.
5 Results
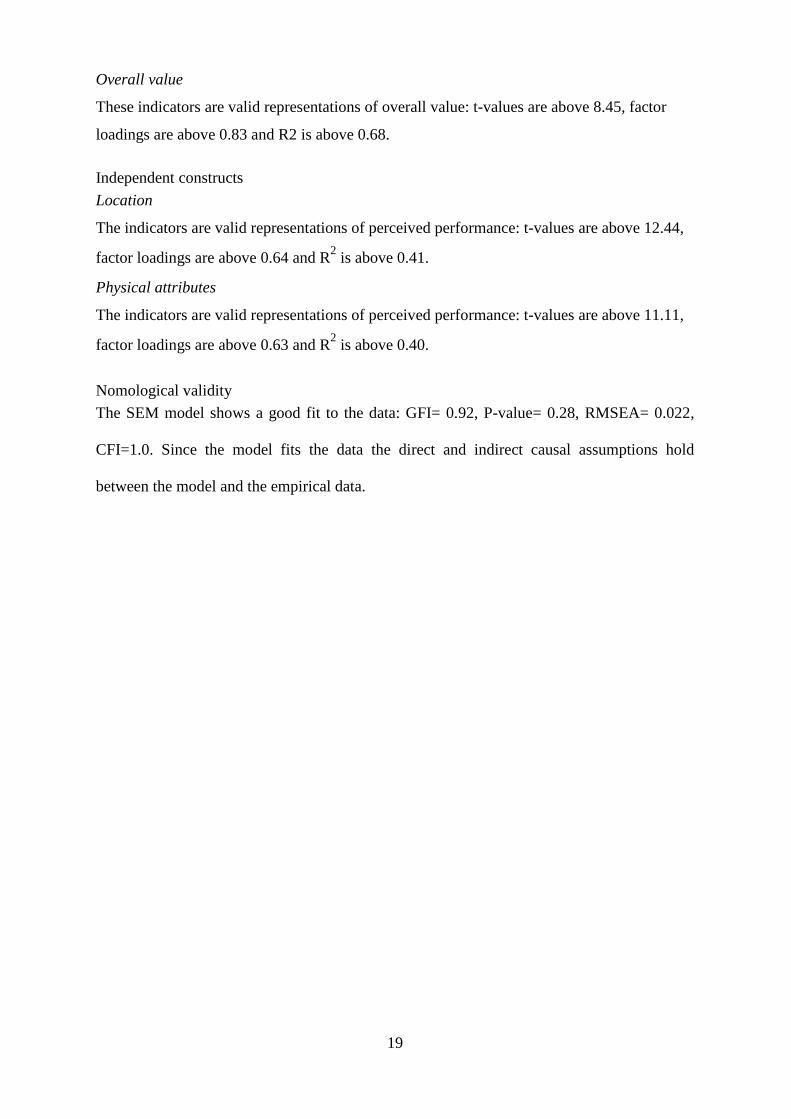
Dependent constructs
Customer-perceived value
These indicators are valid representations of customer-perceived value: t-values are above
7.98, factor loadings are above 0.84 and R2 is above 0.68.
19
Overall value
These indicators are valid representations of overall value: t-values are above 8.45, factor
loadings are above 0.83 and R2 is above 0.68.
Independent constructs
Location
The indicators are valid representations of perceived performance: t-values are above 12.44,
factor loadings are above 0.64 and R2 is above 0.41.
Physical attributes
The indicators are valid representations of perceived performance: t-values are above 11.11,
factor loadings are above 0.63 and R2 is above 0.40.
Nomological validity
The SEM model shows a good fit to the data: GFI= 0.92, P-value= 0.28, RMSEA= 0.022,
CFI=1.0. Since the model fits the data the direct and indirect causal assumptions hold
between the model and the empirical data.
20
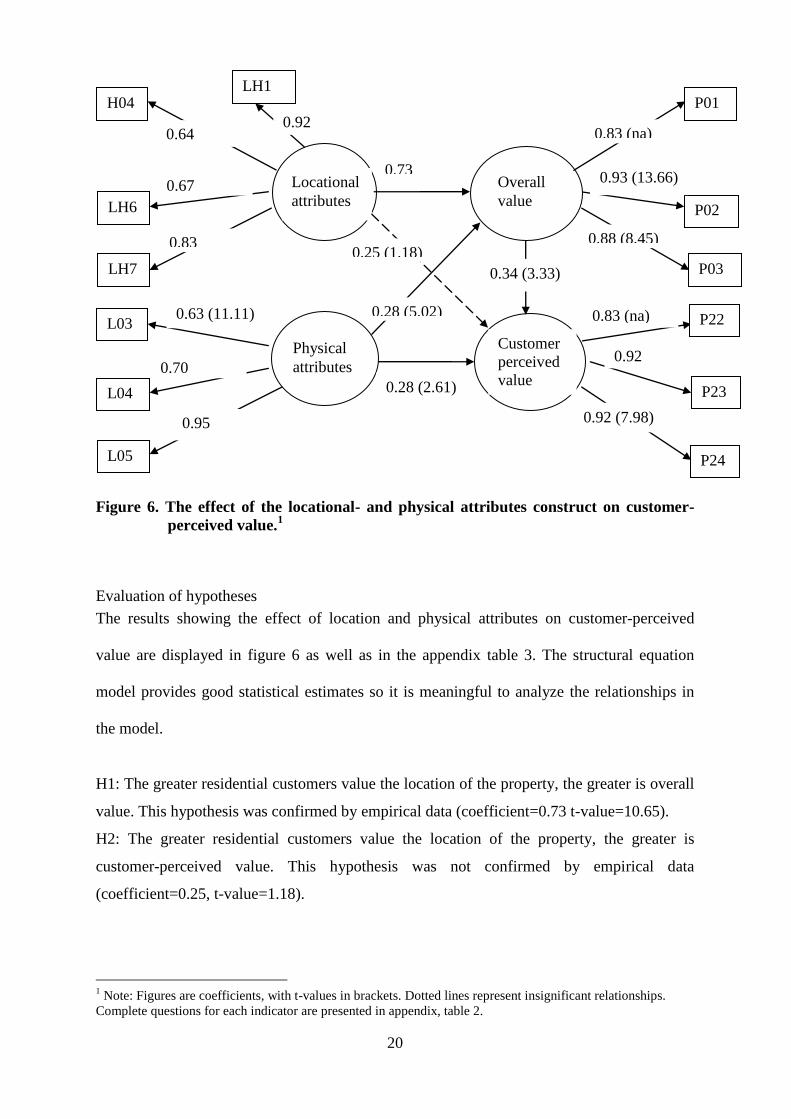
Figure 6. The effect of the locational- and physical attributes construct on customer-
perceived value.1
Evaluation of hypotheses
The results showing the effect of location and physical attributes on customer-perceived
value are displayed in figure 6 as well as in the appendix table 3. The structural equation
model provides good statistical estimates so it is meaningful to analyze the relationships in
the model.
H1: The greater residential customers value the location of the property, the greater is overall
value. This hypothesis was confirmed by empirical data (coefficient=0.73 t-value=10.65).
H2: The greater residential customers value the location of the property, the greater is
customer-perceived value. This hypothesis was not confirmed by empirical data
(coefficient=0.25, t-value=1.18).
1 Note: Figures are coefficients, with t-values in brackets. Dotted lines represent insignificant relationships.
Complete questions for each indicator are presented in appendix, table 2.
H04
LH6
LH7
L03
L04
L05
P01
P24
P23
Locational
attributes
Physical
attributes
Customer
perceived
value
value
Overall
value
0.63 (11.11)
0.73
(10.65)
0.64
(12.75)
0.83
(19.84)
0.67
(12.44)
P03
P02
0.83 (na)
0.88 (8.45)
P22 0.83 (na)
0.92
(11.50)
0.92 (7.98)
0.28 (5.02)
0.28 (2.61)
0.34 (3.33)
0.70
(12.24)
0.95
(26.25)
0.93 (13.66)
0.25 (1.18)
LH1
0.92
(39.39)

21
H3: The greater residential customers value physical features of the property, the greater is
overall value. This hypothesis was confirmed by empirical data (coefficient=0.28, t-
value=5.02).
H4: The greater residential customers value physical features of the property, the greater is
customer-perceived value. This hypothesis was confirmed by empirical data
(coefficient=0.28, t-value=2.61).
H5: The greater overall value, the greater customer-perceived value. This hypothesis was
confirmed by empirical data (coefficient=0.34, t-value=3.33).
H6: Locational features have a positive indirect effect on perceived value through overall
value. This hypothesis was confirmed (see table 1).
H7: Physical features of the apartment have a positive indirect effect on perceived value
through overall value. This hypothesis was confirmed (see table 1).

22
Table 1. Direct, indirect and total effects of locational and physical attributes on
perceived value.
Independent
constructs
Dependent
constructs
Direct
effect
Indirect
effect
Total
effect
Locational
attributes Perceived value N/A 0.17 (2.29) 0.17 (2.29)
Physical attributes Perceived value 0.28 (2.61) 0.09 (2.04) 0.37 (4.47)
Note: figures are coefficients, with t-values in brackets.
6 Discussion
Since our data fits the theoretical model, we have failed to reject the proposed model as one
viable representation of the true relationships underlying our data. The RCPV- model reveals
both an indirect and direct relationship between the physical attributes construct and overall
value on the perceived value construct. This effect would not have been possible to find
using, for example, a hedonic regression framework, due to the character of the items used in
this study which mostly reflect cognitive and affective factors. Evaluating the hypothesis, the
direct causal relationship between the location construct and VFM did not hold, thus
providing support for the theoretical assumption that an overall judgment is made to decide
whether a specific location is suitable or not and then, as a result, the decision process
continues, to arrive at a conclusion on perceived value and draw a value-for-money
conclusion, given the attributes and amenities of the property. In table 1, the total effect on
perceived value of the apartment was considerably higher than the total effect by location
construct.
The result shows that when location has been chosen by respondents, the apartment is the
factor that matters when assessing value for money. Does this mean that the proposed model
has the potential to improve the way we have previously identified productivity and customer
value in real estate? Yes, I believe that is the case, since from the standpoint of structural
equation modeling using a theoretical model we have achieved reliable statistical estimates
on customer-perceived value. But what are we measuring? This question might seem
superfluous but the project which we used in this study was under construction, meaning that
neither the landscaping nor all of the buildings were in place. The respondents visited a
23
construction site with a show apartment in place. Despite this, the items validating the
structural equation model state that “the natural feeling around Hornsberg Strand makes me
relax” or “this is a safe town environment” and “Hornsberg Strand has a soothing
environment”! These are indeed brave beliefs. So, what are we measuring if not their
expectations of a natural feeling, of opportunities to relax and of living in a soothing
residential environment? The respondents looked beyond the construction site and were able
to infer a positive image of the complete development in their minds.
How does these findings relate to those made by Bookout (1994) and Psilander (2004)? Our
findings indicate that by using the laddering technique we can identify those key features in a
residential development that consumers value highly and, further, by using a structural
equation model, we are able to statistically validate their existence. Therefore, by using the
structural equation model we have been able to answer the first two questions posed by
Woodruff in how to improve our understanding of how to deliver customer value to potential
residents.
However, developers in general strive to identify attributes on the lowest level in the
customer value hierarchy model because it is actionable and rational from a short-term
perspective, but what happens in the long run when consumers’ preferences change? Do old
truths stay the same or do they change? According to Woodruff (1997), consequences in use
situations are far more important to consumers than product attributes. If we study the items
we found, we discover that they are all at the consequence level: psychological and
functional consequences according the means-end chain theory; consequences that are
probably easy to connect to values and goals held by the respondents. Consequences in a use
situation do seem to matter for the potential tenants which are according to the findings of
Woodruff (1997).
Does this question matter to commercial residential developers? No, not really. Most
construction companies ask for checklists of customer-perceived values close to the attribute
level, which could easily be applied and adapted to a specific project. Short-sighted maybe,
but understandable if senior management is focusing on the bottom line figures: Did it sell?
How much profit did we make considering costs? From society’s point of view, consumers
will suffer a welfare loss if developers do not try their best to maximize consumer value. This
technique does look promising as a means of taking our current knowledge a step further, as
well as providing a competitive edge for those developers who are interested in advancing

24
their understanding of customer value. Developments that are attractive to consumers can be
more profitable, given that consumers are prepared to pay a premium for the fulfillment of
customer-perceived values and given that marginal costs for doing so equal marginal revenue.
The questionnaire consisted of 31 plausible items used to test the model and six items were
found to explain the theoretical model. The remaining 25 items did not provide a valid model
with respect to nomological, convergent and discriminant validity. All of the items were the
result of laddering interviews and thus found to be important to the respondents, so why
didn t́ more items validate the RCPV-model? The reason is found in the SEM technique,
since LISREL measures correlation and error covariance structures simultaneously between
all constructs in the model. If more items are entered into the equations, increasing error
covariance patterns between these items will reduce the validity of the model. Since the
proposed model is theoretically sound, items that verify the model should therefore represent
customer-perceived value with respect to the respondent’s beliefs. If no items were found
that validated the theoretical model, the whole model will of course have failed.
The high numbers of females (91%) answering the questionnaire came as a surprise. Why so
many females decided to answer the survey on behalf of their spouse might be the female
being the decision maker, taking the final decision to accept or reject the choice of new
apartment.

25
7 Future research
The customer value hierarchy model demonstrated by Woodruff and productivity analysis
provided the basis for the theoretical model developed in this paper and the structural
equation model was validated by empirical data. However, more research is needed to
advance our understanding of customer values in residential development or other categories
of real estate such as office and retail facilities to increase our understanding of features
creating customer perceived value. A collaborative project is planned in order to study how
developers and architects can use the laddering technique and the RCPV-model in the early
conceptual design of a planned residential construction project. The purpose of the project is
to validate the technique and, more specifically, to study how factor loadings vary on the
location and physical attributes construct, depending on different design solutions in similar
locations in a reference project.
Acknowledgements
I hereby acknowledge the financial support being made by Formas and by the companies
BESQAB, JM, NCC, Prognoscentret AB, Stockhoms Stads Bostadsförmedling, Swedbank
and Veidekke, and the municipalities Sollentuna and Upplands-Väsby municipality. Without
their financial support and fruitful discussions, these finding would not have been made.
I also acknowledge two anonymous reviewers for their suggestions for improvements to this
paper.

Appendix
Table 2. Explorative factor analysis
Multivariate analysis: factor loadings (maximum likelihood
varimax rotation) internal consistency and total variance explained. Factor loading Cronbachs Alpha Variance explained %
Locational attributes Locational attributes Locational attributes
1. Communication
H1. It is obvious how easy it is to get from Hornsbergs Strand to the inner city 0.76
0.83
14.7
(R) H5. The lack of possible public transport to Hornsberg Strand is worrying 0.75
(R) H7. My friends will find it difficult to get to Hornsbergs Strand 0.72
H8. It's quality of life being able bike from Hornsbergs Strand to the City 0.40
(R) H9. In Hornsbergs Strand there are no activities that interest me 0.36
(R) H10. The distance to the subway is too long, so I do not save time 0.77
2. Noise
0.90
12.4
(R) H3. The noise in the area worries me 0.88
(R) H6. In Hornsbergs Strand I am disturbed by traffic 0.79
(R) LH9. The noise in Hornsbergs Strand is really annoying 0.84
3. Urban environment
0.81
10.5
LH1. In this home environment, I can relax 0.64
LH2. The architecture of Hornsbergs Strand is representative of a modern town 0.44
LH6. This is a safe urban environment 0.66
LH7. The residential environment in Hornsbergs Strand is soothing 0.69
4. Relaxation
0.74
10.3
H2. The proximity to Ulvsundasjön makes it easy to get into the nature 0.69
H4. The natural feeling around Hornsbergs Strand makes me relax 0.68
LH4. The feeling of being close to nature is evident in Hornsbergs Strand 0.74
LH8. The proximity to Ulvsundasjön is Hornsbergs Strand's biggest asset 0.33

27
Factor loading Cronbachs Alpha Variance explained %
Location attributes Location attributes Location attributes
5. Architecture
0.73
7.4
(R) LH3. This neighborhood seems sterile 0.67
LH5. Houses' architecture is boring 0.54
(R) LH10. Hornsbergs Strand is really dead 0.49
Factor loa ading Cronbachs alpha Variance explained
Physical attributes Physical attaaaaattributes Physical attributes
6. Standard of the apartment
0.85
29.1
L2. The choice of materials in the apartment is appealing
0.68
L6. This kitchen is of a high standard
0.82
L8. This apartment feels luxurious
0.67
L9. This kitchen is functional in all respects
0.58
L10. This bathroom is really well equipped
0.62
7. Social relations
0.83
27.8
L1. As this apartment is designed, I can easily socialize with my friends
0.74
L3. The level of natural daylight in this apartment creates a feeling of well-being 0.46
L4. All spaces in this apartment are well-proportioned
0.81
L5. In this apartment, I can relax
0.64
(R) L7. This apartment is difficult to furnish
0.65
(R) L10. There is insufficient storage facilities in this apartment
0.49
R= negative statements, H1-H10, LH1-LH10, L1-Ll0 is the actual numbering of items in the survey

28
Table 3. Construct analysis structural equations
Abbreviation Factor t-value R2 value
loading
Locational attributes
In this home environment, I can relax LH1 0.92 39.39 0.84
The natural feeling around Hornberg Strand makes me relax H04 0.64 12.75 0.43
This is a safe city environment LH6 0.67 12.44 0.48
The residential environment in Hornsberg Strand is soothing LH7 0.83 19.84 0.72
Physical attributes
Daylight in this apartment creates real satisfaction L03 0.63 11.11 0.40
All spaces are well-proportioned in this apartment L04 0.70 12.24 0.49
In this apartment, I can relax L05 0.95 26.25 0.91
Overall value
Hornberg Strand gives a very good overall impression P01 0.83 na 0.69
I can recommend Hornberg Strand to my friends P02 0.93 13.66 0.87
I will enjoy Hornberg Strand P03 0.88 8.45 0.77
Perceived customer value
Given Hornberg Strand’s location, this location provides value for money P22 0.83 na 0.68
Given the apartment’s standard, this apartment provides value for money P23 0.92 11.50 0.85
This home provides good value for money P24 0.92 7.98 0.84
Note. The wording of indicators is the same as in the questionnaire.

Table 4. Construct validity
Correlation matrix of independent variables
Location Physical Overall value Perceived value
--------
attributes
-------- ------- --------
Location 1.00
Physical 0.52 1.00
attributes (0.09)
5.63
Overall 0.88 0.66 1.0
value (0.03) (0.06)
26.34 10.74
Perceived value 0.45 0.51 0.52 1.0
(0.08) (0.07) (0.06)
5.88 7.62 8.68
Covariance Matrix of Latent Variables
Overall value Perceived value Location Physical attributes
-------- -------- -------- --------
Overall value 1.00
Perceived value 0.53 1.00
Location 0.88 0.45 1.00
Physical attributes 0.66 0.51 0.52 1.00
30
8 References
Ambrose, I. and Dyregaard, P. (1993). Evaluering af Blangstedgård i brug:
Resultater af undersogelser 1989-92, SBI-Byplanaegning 66, Statens
Byggeforskningsinstitut, Denmark.
Bollen, K.A. (1989). Structural equations with latent variables. New York, Wiley.
Bookout, L.W., et al (1994). Value by Design – Landscape, Site Planning and
Amenities. Washington, The Urban Land Institute.
Coolen, H. and Hoekstra, J. (2001). Values as Determinants of Preferences for
Housing. Attributes, Journal of Housing and the Built Environment, 16, pp. 285–306.
Clow, K.E., Kurtz, D.L., Ozment, J. and Ong, B.S. (1997). The antecedents of
customer expectations of service: an empirical study across industries, Journal of
Service Marketing, 11, 4, pp. 230–48.
Cronin, J.J. and Taylor, S.A. (1992). Measuring service quality: a re-examination and
extension. Journal of Marketing, Vol. 56, (July), pp. 55–68.
Cronin, J.J. and Taylor, S.A. (1994). SERVPERF Versus SRVQUAL: Reconciliation
Performance-Based and Perception-Minus-Expectations Measurement of Service
Quality, Journal of Marketing, 58 (January), pp. 125–131.
Doods, W.B., Monroe, K.B. and Grewal, D. (1998). Effects of price, brand, and store
information on buyer’s product evaluations, Journal of Marketing, Vol. 28, pp. 307–
319.
Fanning, S.F. (2005). Market Analysis for Real Estate: Concepts and Applications in
Valuation and Highest and Best Use, Appraisal Institute.
Fornell, C. (1992). A National Customer Satisfaction Barometer: The Swedish
Experience, Journal of Marketing, 56 (1), pp. 6–21.
Fornell, C., Johnson, M.D, Anderson, E.W., Cha, J. & Bryant, B.E. (1996). The
American Customer Satisfaction Index: Nature, Purpose and Findings, Journal of
Marketing, Vol. 60, October, pp. 7–18.
Forsythe, P.J. (2007). A conceptual framework for studying customer satisfaction in
residential construction, Construction Management and Economics, 25, pp. 171–182.
Forsythe, P.J. (2008). Modelling customer perceived service quality in housing
construction, Engineering, Construction and Architectural Management, 15 (5), pp.
485–496.
Grewal, D., Monroe, K.B. & Krishnan, R. (1998). The Effects of Price-Comparison
Advertising on Buyers' Perceptions of Acquisition Value, Transaction Value, and
Behavioral Intentions, Journal of Marketing, Vol. 62, pp. 46–59.
31
Grunert, K.G. & Grunert, S.C. (1995). Measuring subjective meaning structures by
the laddering method: Theoretical considerations and methodological problems,
International Journal of Research in Marketing, 12, pp. 209–225.
Grunert, K.G. & Bech-Larsen, T. (2005). Explaining choice option attractiveness by
beliefs elicited by the laddering method, Journal of Economic Psychology, 26, pp.
223–241.
Gutman J. (1982). A means-end chain model based on consumer categorization
processes, Journal of Marketing, Vol. 46, Spring, pp. 60–72.
Jöreskog, K.G. & Sörbom, D. (1993). LISREL 8: Structural equation modeling
with the SIMPLIS command language. Chicago: Scientific Software International.
Kotha, S., Vadlamani, B., & Nair, A. (1997). Generic strategy research: application of
LISREL and smallest space analysis, M. Ghertman et al (eds.), Statistical Models for
Strategic management. Netherlands, Kluwer Academic Publisher, pp. 29–53.
Lancaster, K.J. (1966). A new Approach to Consumer Theory, Journal of Political
Economy, Vol. 74, pp. 132–156.
Lin, C., Sher, P. & Shih, H. (2005). Past progress and future directions in
conceptualizing customer perceived value, International Journal of Service industry
Management, Vol.16 No. 4, pp. 318–336.
Lundgren, B. (2010). Customers’ perspectives on a residential development using the
laddering method, Journal of Housing and the Built Environment, Vol. 25. pp. 37–52.
McDougall, G.H.G. & Levesque, T. (2000). Customer satisfaction with services:
putting perceived value into the equation, Journal of Services Marketing, Vol. 14, (5),
pp. 392–410.
Monroe, K.B. (1995). Pricing: Making Profitable Decisions. New York: McGraw-
Hill.
Oliver, R.L. (1977). Effect of Expectation and Disconfirmation on Post-exposure
Product Evaluations: An Alternative Interpretation, Journal of Applied Psychology, 62
(August), pp. 480–486.
Oliver, R.L. (1980). A Cognitive Model of Antecedents and Consequences of
Satisfaction Decisions, Journal of Marketing Research, 17 (4), pp. 460–469.
Oliver, R.L. (1997). Satisfaction: A Behavioural Perspective on the Consumer. New
York: McGraw Hill.
Olson, J.C. & Reynolds, T.J. (1983). Understanding consumers’ cognitive structures:
implications for marketing strategy, in L. Percy & A.G. Woodside (eds), Advertising
and Consumer Psychology. Lexington, MA, Lexington Books, pp.105–107.
Parasuraman, A., Zeithaml, V. & Berry, L. (1988). SERVQUAL: A Multi Item Scale
for Measuring Consumer Perception of Service Quality, Journal of Retailing, 64
(Spring), pp. 12–40.

32
Patterson, P.G. & Spreng, R.A. (1997). Modelling the relationship between perceived
value, satisfaction and repurchase intention in a business-to-business, services context:
an empirical examination, International Journal of Service Industry Management,
Vol.8 No.5, pp. 414–434.
Psilander, K. (2004). Niching in Residential Development, Journal of Property
Research, Vol. 21, 2, pp. 161–185.
Ratcliff, R.U. (1961). Real Estate Analysis. USA, McGraw-Hill.
Reynolds, T.J, Dethloff, C. & Westberg, J.W. (2001). Means-end chains and
laddering: an inventory of problems and an agenda for research, in T.C. Reynolds
& J.C. Olson (eds), Understanding Consumer Decision-making: The means-
end approach to marketing and Advertising Strategy. Mahwah, NJ, Lawrence
Erlbaum Associates, pp. 91–118.
Reynolds, T.J. & Gutman, J. (1988). Laddering Theory, Method, Analysis and
Interpretation, Journal of Advertising Research, Feb/March.
Sweeney, J. (1994). An investigation of a theoretical model of consumer perception of
value, unpublished doctoral dissertation, School of Management and Marketing,
Curtain University of Technology, Perth, Australia.
Sweeney, J., Soutar, G.N. & Johnson, L.W. (1999). The role of perceived risk in the
quality value relationship: A study in a retail environment, Journal of Retailing, Vol.
75. pp. 77–105.
Sweeney, J. & Soutar, G.N. (2001). Consumer perceived value: The development of a
multiple scale, Journal of Retailing, Vol. 77, pp. 203–230.
Wilson, D.T. & Swanti, J. (1997), Understanding the Value of a Relationship,
reprinted in D. Ford (ed.), Understanding Business Markets. The Dryden Press, pp.
288–304.
Woodruff, R.B. (1997). Customer value: the next source for competitive advantage,
Journal of the Academy of Marketing Science, Vol. 25, No 2, pp. 139–153.
Woodruff, R.B. & Gardial, S.F. (1996). Know your customer: New approaches to
customer value and satisfaction, Cambridge, MA, Blackwell.
Worthington, R.L., Whittaker, T.A. (2006), "Scale development research: a content
analysis and recommendations for best practices", The Counseling Psychologist, Vol.
34 No.6, pp.806-38.
Zeithmal, V.A. (1988). Consumer perceptions of price, quality, and value: a means-
end-chain model and synthesis of evidence, Journal of Marketing, Vol.25, pp. 2–22.