customer perceptions of service quality in retail financial institutions
TRANSCRIPT

Diana Best is a Lecturer in market research and services marketing at Queensland University ofTechnology. She is currently'studying for her PhD in the area ofservices marketing. Su MonWong is a Senior Lecturer instrategic marketing at QUT andhas had considerable research andconsultancy experience in the areaof financial services.
RESEARCH NOTES
Customerperceptions ofservice qualityin retail financialinstitutionsby Diana F. Best and Su MonWong
THE SERVQUAL instrument, which measures customer perception's ofservice quality, is applied toretail financial institutions in Brisbane. As in the
original SERVQUAL study, five factors emerged: tangibles, reliability, responsiveness, assurance and empathy.Consumers' experiences failed to match their expectations on virtually all dimensions. The study also foundsome differences in consumer perceptions ofservicequality based on age, gender and type offinancial institution, suggesting that more could be done by financialinstitutions to segment their markets
Asia - Australia MarketingJournal Vol. 1, No.2· 31

IntroductionIn an era of deregulated finan
cial markets, banking and n"onbanking institutions operate in anincreasingly competitive industry.Yet, little Australian research hasbeen published on how these institutions can attract and retain· retailcustomers. This article outlines arecent survey of customers of retailfinancial institutions in Brisbane,Queensland. It explores consumers' views of service quality intheir most preferred financial institution.
Marketing practitioners areincreasingly told that customer service is important to successful performance in the retail financialmarket (Lewis, 1989; Berry,Bennett & Brown, 1989; Cooper,1988; Skern & Gould, 1988).Indeed, in a service industry, superior customer service may beamong the most effective avenuesfor differentiating a product(l\1arshall, 1985; Wong & Perry,1991). Non-service elements suchas interest rates, product range,and branch location are highlyimitable whereas good customerservice is more difficult to achieve.As a result, elements other thancustomer service may be incapableof generating the level of consumer loyalty associated with awell-planned customer servicestrategy (Berry, Bennett andBrown, 1989). Nevertheless, it isevident that many consumersremain dissatisfied with the effortsmade by their financial institution(Marshall, 1985; Kennedy, 1989).
While some researchers consider that there may be both objective and perceived quality forgoods (Dodds & Monroe, 1985;Garvin, 1983), the distinctionbecomes less clear for services,especially those with significantcustomer interaction. A review ofthe literature revealed consistentviews that service quality is evaluated by consumers according totheir own unique definition(Parasuraman, Zeithaml & Berry,1988; Olshavsky, 1985; Garvin,1983) rather than 'factory standards' . Parasuraman, Zeithamland Berry (1984) consider that this
subjective view of service qualityis largely due to basic qualities ofservices such. as intangibility, variability or heterogeneity, and inseparability of production and consumption (p.2). These qualitiesmake it virtually impossible to setstrict manufacturing standards, andit is also mOre likely that each consumer willhavei his or her ownunique vi~W of desirable service.As Ghing91d and Maier (1988)point out, ."truly objective definitions ... will prove elusive, since acustomer's view of the personalservice factors in any given serviceencounter is idiosyncratic (p.45).To make matters even worse forthe service provider, Solomon andcolleagues (1985) suggest that "inpure service situations where notangible object is exchanged, andthe service quality itself is difficultto measure (financial planning,health care), customer satisfactionand repeat patronage may be determined solely by the quality of thepersonal encollnter" (p.1 00).Perceived quality is therefore verymuch based on processes, such ascustomer contact with front-linestaff, their accessibility, appearance and behaviour.
An instrument developed inrecent years, SERVQUAL,attempts to measure perceivedquality of services (Parasuraman,Zeithaml & Berry, 1985, 1988).The original conceptual version(1985) was developed from 12focus groups across four services(retail banking, credit card serviG~s, securities brokerage andprqduct repalT· and maintenance).It consisted of ten dimensions,including reli~bility, responsiveness, competence, access, courtesy, communication, credibility,security, understanding/knowingthe customer, and tangibles (p.47).Lindqvist (1987) has compared thedeterminants of service qualityfound byParasuraman and colleagues with ·four other empiricalstudies (Gronroos, 1982; Lehtinen& Lehtinen, 1985; Albrecht &Zemke, 1985; Gestranius, 1984)and overall has found quite goodconvergent validity.
In their later studyParasuraman, Zeithaml and Berry
(1988) found five determinants.These were derived from the original ten through factor analysis andreliability tests, and include:• Tangibles - physical facilites,
equipment and the appearance ofpersonnel
• Reliability - ability to performthe promised service dependablyand accurately
• Responsiveness - willingness tohelp customers and provideprompt service
• Assurance - knowledge andcourtesy of employees and theirability to convey trust and confidence
• Empathy - caring, individualisedattention the firm provides itscustomers.
Assurance consists of the earlier communication, credibility,security, competence and courtesydimensions, and empathy consistsof understanding/knowing the customer and access dimensions.Reliability relates to customers'perceptions of the outcomes of theservice, while the other fourdimensions tend to be more theprocess dimensions, or the serviceas it is being delivered(Parasuraman, Zeithaml & Berry,1991, p.41).
The SERVQUAL instrumentmeasures service quality as:
Q = P - E where
Q = Perceived quality of respondents' most used institution
P =Perceived performance ofrespondents' most used institution
E = Desired expectations of theservice industry overall
The latest version of SERVQUAL(1988) consists of 22 items, witheach statement being asked forboth desired expectations and perceived performance, making 44statements in all. In using gapscores of the difference betweenperformance and expectations,SERVQUAL follows the disconfirmation type models of satisfaction(Oliver, 1980; Churchill &Surprenant, 1982; Woodruff,Cadotte & Jenkins, 1983; Swan &
32 • Asia -Australia MarketingJournal Vol. 1, No.2

Trawick, 1981).SERVQUAL is one of the few
instruments in the services areawhich has gone through an extensive process of scale purification,reliability and validity tests, andclaims have been made by theauthors that it is valid across services industries. However,SERVQUAL is not without its critics. Carman (1990) criticizes it inseveral areas, including the stability of its dimensions, the validity ofanalysing gap scores, and thevalidity of using the instrument forall service industries. Lambert andLewis (1990) add to the criticism,suggesting that expectations in factmeasure importance. They alsofound that the negatively wordeditems tend to load onto the samedimensions.
Finally, there is some concernabout what the instrument actuallymeasures. Jayanti and Jackson(1991) have found that a disconfirmation explanation of servicequality does not fully explain theconcept. Carman (1990) alsopoints out that the SERVQUALinstrument measures global expectations of a service industry aftersome contact with the industry,whether through experience,advertising or word of mouth.Expectations are therefore hybridratings based on such things asexperience and service'inspectability' (Arnthorsson,Berry & Urbany, 1991) or search,experience and credence qualitiesof the service (Nelson, 1970;Darby & Karni, 1973). Babakus(1990) considers that the measurement of service quality is dominated by perception scores, as consumers tend to go into the serviceencounter with vague or "fuzzy"expectations (Hill, 1986, p.312).
However, because of its extensive testing, and the appeal ofusing the instrument across serviceindustries, SERVQUAL is likely tobe used widely. In the financialservices sector, few studies cancompete with SERVQUAL'srigour. Martin (1981) found sevendeterminants for bank retentionand selection decisions, includingwaiting, self-interested attitude,rudeness, transaction incompe-
tence, inconvenient service hours,cost-interest imbalance and information inadequacy (p.20). Gwinand Lindgren (1987) found eightdeterminant attributes for choosingfinancial institutions, includingfinancial soundness, convenience,interest rates on savings, requirements and fees, friendly and efficient service, interest on loans,personal interest, and innovativeservices (p.56). Dudley and colleagues (1985) found six reasonsfor selecting a bank: convenience,knowing staff, reputation, recommendation, interest rates, and thebank having solicited the customer's business (p.165).Murdock and Roe (1986) foundpricing, reputation, servicesoffered, time convenience, locationconvenience, employee expertiseand attitudes to be the most important determinant atttibutes (p.17).While these studies have shownsimilar findings to each other, andwhile they also partly reflect theSERVQUAL dimensions, nonehave been tested across more thanone situation, or subjected to reliability and validity tests.
Given the extensive testing ofSERVQUAL in the United Statesenvironment, it seems the mostappropriate instrument to date tomeasure perceived service qualityin service settings. However, asfar as the authors are aware, theinstrument has not been used todate for Australian financial institutions.
It is the purpose of thisresearch to ascertain, for theBrisbane area:• what elements constitute cus
tomer service in the retail financial industry,
• what expectations or desires consumers have with respect to service quality,
• how consumers perceive the current level of customer servicebeing provided, and
• how these perceptions differamong various market segments.
For the purposes of this research,the retail financial industry consists of those banks, building societies and credit unions providingfinancial services to personal con-
sumers. The survey instrumentused in the research study wasbased on Parasuraman, Zeithamland Berry's (1988) SERVQUALquestionnaire.
MethodThe sample for this study con
sisted of 290 adult personal consumers of financial services in theBrisbane metropolitan area. Aquota sample was used based onthe market shares of banks, building societies and credit unions.Door knock interviews were conducted in five suburbs of Toowong,Rochedale, Mt. Gravatt, Jindalee,and Everton Park. It was considered desirable to balance the sample by financial institution marketshares, and also by the age andgender characteristics of the population in the Brisbane area. A further round of interviews with thisin mind was conducted at the following shopping centres:Capalaba, Brookside, Chermsideand Toombul. The final sample of290 respondents represented market shares of financial institutions(Reserve Bank of Australia, 1990)and age and gender characteristicsof the Brisbane Statistical Division(Australian Bureau of Statistics,1986).
Questionnaire
The survey questionnaire used inthis research study was based onthe SERVQUAL instrument, butconsisted of only 19 of the original22 items.
Parasuraman, Zeithaml &Berry (1988) recommend "appropriate adaptation of the instrument... when only a single service isinvestigated" (p.28). The threeitems removed tended to be repetitive of other items. The first itemremoved was as follows:
They should provide theirservices at the time theypromise to do so.
This statement was consideredto be repetitive of "when thesefirms promise to do something bya certain time, they should do ·so".The last two items removed were
Asia - Australia MarketingJournal Vol. 1, No.2· 33"
negatively worded as well as beingsomewhat repetitive. Carman(1990) notes that although theinclusion of negatively wordeditems are used to keep respondentsalert and to avoid halo effects,many respondents in his study ofSERVQUAL actually misreadthese items. Given too thatBabakus (1990) found that theunderlying factor structure may bealtered by too many negativelyworded items, it was consideredappropriate to remove the following:- They shouldn't be expect-ed to tell customers exactly whenservices will be performed.- It is unrealistic to expectthese firms to have their cus-
tomers' best interests at heart.As also recommended byParasuraman and colleagues(1988), the wording of the instrument was slightly modified fromthe original to make items morerelevant to the financial institutioncontext, mainly by the inclusion of'financial institutions' instead of'they' or 'these firms'.
As suggested by the forumla Q =P - E, SERVQUAL consists ofboth expectations and perceptionquestions. Nineteen expectationquestions were asked about financial institutions overall, followedby 19 perception questions relatingto the respondent's most-usedfinancial institution. The expectation and perception questions for
each item consisted of a sevenpoint Likert-type scale, anchoredat each end with 'strongly agree'and 'strongly disagree'.Supplementary questions at theend of the questionnaire includedthe names of financial institutionsused most often, changes in financial institutions over a ten yearperiod, and demographic characteristics of respondents (gender,age, income).
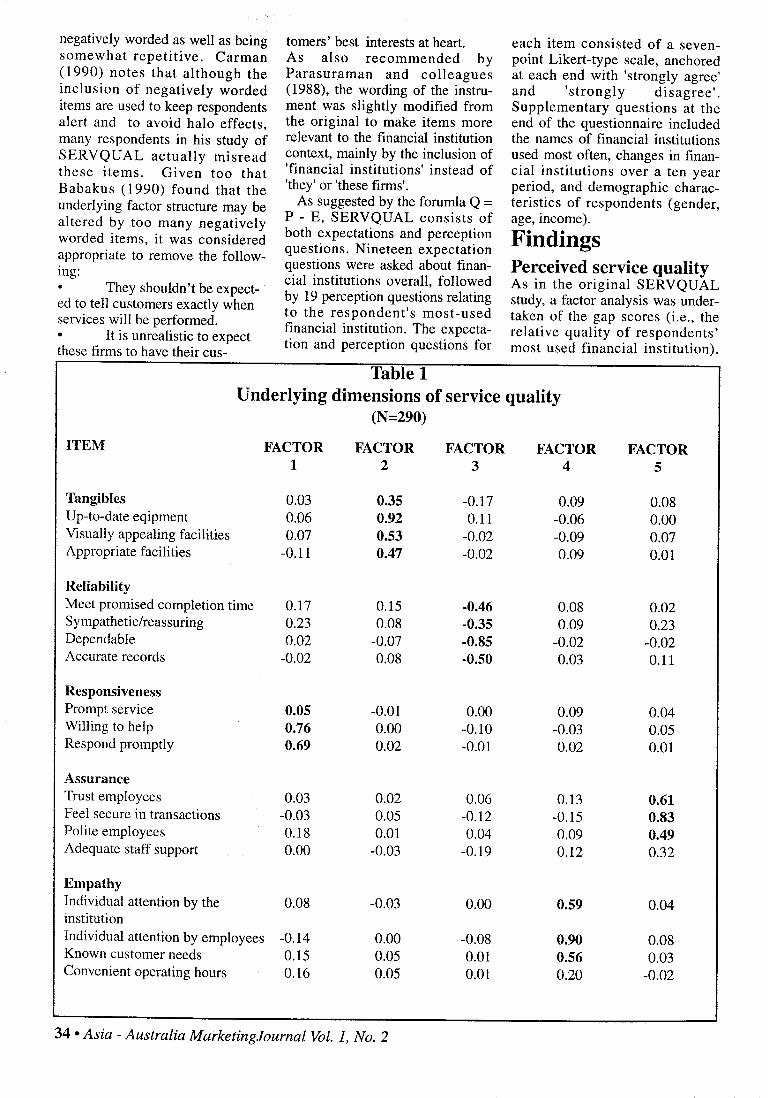
FindingsPerceived service qualityAs in the original SERVQUALstudy, a factor analysis was undertaken of the gap scores (i.e., therelative quality of respondents'most used financial institution).
Table 1Underlying dimensions of service quality
(N=290)
ITEM FACTOR FACTOR FACTOR FACTOR FACTOR1 2 3 4 5
Tangibles 0.03 0.35 -0.17 0.09 0.08Up-to-date eqipment 0.06 0.92 0.11 -0.06 0.00Visually appealing facilities 0.Q7 0.53 -0.02 -0.09 0.07Appropriate facilities -0.11 0.47 -0.02 0.09 0.01
ReliabilityMeet promised completion time 0.17 0.15 -0.46 0.08 0.02Sympathetic/reassuring 0.23 0.08 -0.35 0.09 0.23Dependable 0.02 -0.07 -0.85 -0.02 -0.02Accurate records -0.02 0.08 -0.50 0.03 0.11
ResponsivenessPrompt service 0.05 -0.01 0.00 0.09 0.04Willing to help 0.76 0.00 -0.10 -0.03 0.05Respond promptly 0.69 0.02 -0.01 0.02 0.01
AssuranceTrust employees 0.03 0.02 0.06 0.13 0.61Feel secure in transactions -0.03 0.05 -0.12 -0.15 0.83Polite employees 0.18 0.01 0.04 0.09 0.49Adequate staff support 0.00 -0.03 -0.19 0.12 0.32
EmpathyIndividual attention by the 0~08 -0.03 0.00 0.59 0.04institutionIndividual attention by employees -0.14 0.00 -0.08 0.90 0.08Known customer needs 0.15 0.05 0.01 0.56 0.03Convenient operating hours 0.16 0.05 0.01 0.20 -0.02
34- Asia - Australia MarketingJournal Vol. 1, No.2

The extraction method used wasprincipal components analysis, andthe factor matrix was subjected to'an oblique rotation. As suggestedin the original study (Parasuraman,Zeithaml & Berry, 1988, p.20),
,some degree of correlationbetween the dimensions was anticipated, thus making an obliquerotation an appealing choice.Analysis was constrained a priorito five factors in keeping with theSERVQUAL study. It produced afactor-loading matrix whichshowed fairly clear loadings, with
all items loading onto the samefactors as the original study (Table1). Taken together, these factorsaccounted for 57.9% of the variance in the scale items, comparedwith 56.0% for the Bank section ofthe original SERVQUAL study(1988).
The factors were tested forreliability using Cronbach's coefficient alpha (Nunnally, 1978). Twoitems were deleted in order to raisethe reliability of the relevant factor('adequate staff support' and 'convenient operating hours'). The
factor structure of the reducednumber of items and their coefficients is shown in Table 2. Itshould be noted that the alphacoefficients are adequate, but notparticularly high. While Nunnally(1978) suggests that alpha's of0.50 are acceptable in pilotresearch, for an 'established'instrument these should be substantially higher. It should benoted (Table 3) that the alpha coefficients of the Bank section of theoriginal SERVQUAL study are nohigher than the Brisbane study
ITEM
Table 2Underlying dimensions of service quality
(N=290)
LOADING* ITEM-TOTALCORRELATION*
Factor 1. Responsiveness(29.4% of variance explained; alpha = 0.73Willing to helpRespond promptlyPrompt service
Factor 2. Tangibles(9.0% of variance explained; alpha = 0.71)Appealing facilitiesNeat employeesAppropriate facilitiesUp-to-date equipment
Factor 3. Reliability(6.3% of variance explained; alpha = 0.66)DependableMeet promised completion timesympathetic/reassuringAccurate records
factor 4. Empathy(6.3% of variance explained; alpha =0.76)Individual attention by the employeesKnow customer needsIndividual attention by the institution
Factor 5. Assurance(5.6% of variance explained; alpha = 0.75)Feel secure in transationsTrust employeesPolite en1ployees
807356
88544842
-82-60-59-59
906664
826559
546672
60434235
61575549
705555
595447
* The factor loadings and item-total correlations have been rounded to 2 decimal places and multiplied by 100 for ease of reading.
Asia - Australia MarketingJournal Vol. 1, No.2· 35

(0.72, 0.52, 0.80, 0.71, 0.84;Parasuraman; Zeithaml and Berry1988).Overall gap scoresBy examining the discrepancybetween client expectations and
perceptions, it is possible to gaininsights into the levels of perceivedquality of the client's financialinstitution. Thus, a large positive"gap' between perception andexpecctation (the consumer
receives more than is expected)constitutes a situation of strongquality perceptions. The difference between a respondent'sexpectations and perceptions willbe referred to as a gap score, with
Table 3. Comparison of SERVQUAL studies
Factor Alpha Factor AlphaLoading Coefficient Loading Coefficient
73 7280 6273 6956 55
37
Dimensions Items
ResponsivenessWilling to helpRespond promptlyPrompt servicelell when service will beperformed
Brisbane, Australiastudy #(N=290)
SERVQUAL*Bank Study (USA)#
(N=200)
TangiblesAppealing facilitiesNeat employeesAppropriate facilitiesUp-ta-date equipment
88544842
71 5264392834
Reliability 66 80Dependable -82 71Meet promised completion time -60 72Sympathetic/reassuring -59 63Accurate records -59 39Provide services when promised 80
Empathy 76 71Individual attention by the 90 48employeesKnown customer needs 66 41Individual attention by 64 37the institutionCustomers' best interests 33at heartConvenient operating hours 68
Assurance 75 84Feel secure in transactions 82 84Trust employees 65 68Polite employees 59 72Staff get adequate support 64
*Source: Parasuraman, A., V.A. ZeithaJ111 and L.L. Berry, 1988 "SERVQUAL: a multi-item scale formeasuring consumer perceptions of service quality", Journal of Retailing, 69,1,12-39.# The factor loadings and item-total correlations have been rounded to 2 decimal places and multiplied by 100 for ease of reading
36 • Asia - Australia MarketingJournal Vol. 1, No.2

the size and direction of the scorerepresenting the degree of perceived quality of the respondent'spreferred financial institution.
Table 4 shows the mean gapscores for each item underlying thefive factors. The last columnshows that experiences with financial services do not meet consumers' expectations for mostitems (i.e., many gap_ scores arenegative). Tangibles is the onlydimension which appears to meet,but not exceed, expectations. Onthe other hand, responsiveness andreliability fare least well overall.Although SERVQUAL does notgive norms for gap scores, it isapparent that any negative scoreindicates less than was expected bythe consumer.
Assurance and reliability areperceived to be the most importantdimension for customers, as shownby the high expectation scores (seeLambert and Lewis, 1990, for acomparison of expectations andimportance). Reliability, being an'outcome' dimension as opposedto the other four 'process' dimensions, would be expected to showgreatest importance (Parasuraman,Zeithaml & Berry, 1991). Indeed,of the five service industries studied in the original SERVQUALstudy, reliability proved to be byfar the most important dimensionfor all services (Parasuraman,Zeithaml & Berry, 1988, p.34).Although reliability and assuranceare considered most important inthis study, they still have two ofthe larger gap scores.
On an individual item level,willingness to help, meetingpromised completion times, andthe level of staff sympathy andreassurance measure up least wellfor perceived quality. Only theappeal and appropriateness offacilities are considered to be better than expected.
Serviceperceptions ofconsumer groups
As in all consumer markets, onemight expect that the needs anddesires of different consumergroups may vary. The research
data was analysed to determine ifconsumer characteristics influencethe level of desired expectationsand relative quality perceptions ofthe five dimensions of servicequality. Consumer characteristicsused included gender, age, incomeand most used financial institution.MANOVA was used to test theoverall effect of each of these variables on each of the five factors ofservice quality (responsiveness,tangibles, reliability, empathy andassurance). The technique wasused in accordance with the suggested applications ofSERVQUAL for future research asoutlined by Parasuraman, Zeithamland Berry (1988), and also as usedby Webster (1989) in an Americanreplication of SERVQUAL.
Although the use of MANOVApresumes that intervally scaleditems are used, there is positivecommentary in the literature on theeffectiveness of using the technique on Likert-type (ordinal)scales such as were used in thisstudy (Schertzer & Kernan, 1985).ANOVA was similarly used foreach of the contributing items.Respondents' gap scores, whichmeasure the relative quality perceptions of the five dimensions,were used as input data. Likewise,the tests were also run on expectation scores alone. The tests wereconducted to ascertain any significant differences in quality perceptions or expectations between thevarious consumers in the market.
Demographic effectsThere were few significant effectsof demographics on perceptions ofservice quality. However, sometrends were evident.
Males had lower quality perceptions of the tangible dimensionof their financial institution thandid females (Wilks lambda = .96, p= .03), particularly regardingwhether equipment is up-to-date (f= 5.6, p = .02).
Age had an effect on perceptions of assurance quality (Wilks =0.87, P = .001). Elderly consumers (over 55 years) had lowerquality perceptions of the trustworthiness and politeness of employees than did younger consumers.Also on an individual item level,
age seems to have had an effect onperceptions of whether institutionsmeet promised completion timesof various tasks. Those respondents over 45 years had a poorerview of quality in this area (f =2.4, p =.05).
Independently of perceptionsof service quality (P), there arealso some significant variationsbetween consumers in their desiredexpectations of financial institutionsoverall (E). Males havehigher expectations of responsiveness than females (Wilks =.97, p =.02), although their quality perceptions in this area do not seem todiffer significantly. In parti~ular,
males expect more than females inthe way of prompt service (f =4.3,p = .04).
Eighteen to 35 year olds havelower expectations of responsiveness than those over 35 years(Wilks = .93, p = .05), particularlyin the areas of promptness of service (f = 3.1, P = .02) and staffwillingness to help (f = 4.0, p =.00).
At an individual item level,expectations of individual attentionincreased with age, both from thefinancial institutions overall (f =3.3, P = .01) and from theiremployees (f = 2.0, P = .09).Effects of institutionInterestingly, consumers who used,a credit union as their primaryfinancial institution had lowerquality perceptions for the responsiveness dimension (Wilks =.89, P= .00), particularly for promptnessof service and staff willingness tohelp. They also had lower qualityperceptions of whether employeesknow customers' needs, an empathy item (f = 2.77, P = .06).
Those whose main institutionis a credit union have lower expectations of empathy than users ofbanks or building societies (Wilks= 0.12, P = .00), particularly in theareas of staff knowing customerneeds (f = 2.8, P = .06). This wasalso an area of lower quality perceptions for credit union users.They expect less than bank customers, but even so, perceive thatthey get less than they desire.
Asia - Australia MarketingJournal Vol. 1, No.2· 37

Consumer shiftsin institutionpreference
Within the survey que~tionnaire,
respondents were questioned ontheir changes of financial institution in the last ten years betweenbanks, building societies and creditunions.
Fifty-nine percent (170) ofrespondents indicated that they had
changed financial institution in thepast ten years. Table 5 looks at thechanges between financial institutions in the last 10 years by thereasons given for those changes.Unfortunately, the number ofrespondents in each cell is quitesmall, and only trends can be estimated. The results should beviewed with caution until furtherconfirmatory analysis can beundertaken.
The table indicates that themajority of changes (79%) werefrom banks, with considerably lessactivity in other areas. Of thosethat changed from a bank, a substantial portion (69%) changed toanother bank.
Although the number ofrespondents was too. small to maketoo many assertions about reasonsfor changes, there are some reasonably clear trends. It appears
Table 4Consumer expectations and perceptions of service quality
and resultant gaps*(N=290)
Dimension/Item
ResponsivenessWilling to helpRespond promptlyPrompt serviceAverage for Dimension
Perception Expectation Gap
4.1 5.4 -1.33.9 4.6 -0.73.8 4.8 -1.04.0 4.9 -0.9
TangiblesUp-to-date equipmentAppealing facilitiesNeat employeesAppropriate facilitiesAverage for Dimension
ReliabilityDependableMeet promised completion timeSympathetic/reassuringAccurate recordsAverage for Dimension
6.15.76.15.85.9
5.95.45.36.05.7
6.45.66.15.76.0
6.76.76.46.86.6
-0.30.10.00.1
-0.1
-0.8-1.3-1.1-0.8-0.9
EmpathyIndividual attention by employees 4.0Known customer needs 3.5Individual attention by the institution 4.0Average for Dimension 3.8
4.84.14.74.4
-0.8-0.6-0.7-0.6
AssuranceFeel secure in transactionsTrust employeesPolite employeesAverage for Dimension
5.95.86.05.8
6.86.76.66.6
-0.9-0.9-0.6-0.8
*All scores were averaged without weighting, and are rounded to one decimal place. Scores represent average consumer response based on a 1-7 scale, 7 being 'strongly agree'. All negative stemmed questions werereversed to ensure uniformity.
38 • Asia - Australia MarketingJournal Vol. 1, No.2

that the biggest draw-cards forbuilding societies are their products and loan conditions.However, credit unions, whileattrac~ingpeople for these reasons,also attract people as a result ofchanges in their working arrangements (eg. to a teachers' or publicservice credit union). Changesfrom bank to bank appear to befairly strongly influenced by customer service expectations, something which does not seem to be adeterminant of other changes.Interestingly, changes from building societies back to banks aremainly for reasons somewhat outside the marketing efforts ofbanks, i.e., their location, andchanges in working conditions.
It appears that if banks haveany point of perceived differentiation, it would be customer service,while building societies and creditunions tend to be differentiated at
the product level. This same trendwas picked up in the ANOVAresults, where, at least for creditunions, customers neither expectedas much in the way of service, norperceived that they received it.Further research into these perceived differences between banksand other financial institutions isstrongly needed.
DiscussionAnecdotal evidence suggests
that Australian service industrieshave developed a somewhat notorious reputation in the area of service quality (Ostrow, 1991).Whether this notoriety is justifiedor not has not been empiricallytested in most service industries.However, it seems from Table 4that customers of financial institutions in Brisbane are moderatelyunimpressed with service qualityacross a range of areas and itseems· that this perceived lack of
service quality is not confined toanyone type of institution. Thefact that fifty-nine percent ofrespondents· have changed financial institution in the last 10 yearsseems to reinforce the findings thatthose consumers are less than satisfied, although it is acknowledgedthat consumers may switch for reasons other than dissatisfaction.
Customers also have quite highexpectations in the areas of reliability and assurance. For thefinancial institutions involved, onestrategy may be to lower expectations through marketing efforts.However, ·given competition, it ismore likely that financial institutions should raise their standardsand thus increase consumer perceptions of service quality. This isparticularly the case for banks, asit seems that customers have astronger expectation of customerservice for banks than for nonbank financial institutions. Fromthe gap scores in Table 4 and the
Table 5Reasons behind changes in last 10 years
(N=170)
Bank to Bid Soc to Credit Union to
BId Credit BId Credit BIdBank Soc Union Bank Soc Union Bank SocN=93 N=27 N=15 N=17 N=4 N=3 N=7 N=4
Customer service 28.0 11.1 13.3 - - - - -Manager service 7.5 11.1 6.7 5.9 - - - -Loan conditions 8.6 22.2 13.3 11.8 - 66.7 - 50.0Employment changes 15.1 7.4 26.7 23.5 75.0 33.3 28.6 25.0Products 16.1 23.3 26.7 11.8 - - 28.6 25.0Location 17.2 3.7 13.3 41.2 - - 14.3 -Other 7.5 11.1 - 5.9 25.0 - 28.6 -Total 100.0 100.0 100.0 100.0 100.0 100.0 100.0 100.0
Proportion of 54.7 15.9 8.8 10.0 2.4 1.8 4.1 2.4changes overall
Proportion of 68.9 20.0 11.1changes from banks
Chi-square = 400.85,d.f.=56, sig.=.OOOO
Asia - Australia MarketingJournal Vol. 1, No.2· 39

movement between financial insti~
tutions in Table 5, it appears thatthose who have high expectationsof service are inevitably going tobe disappointed. While the numbers in Table 5 are relatively small,there appears to be a trend indicating that those who frequent creditunions tend to look for productbenefits rather than service performance. They therefore are probably not as disappointed when theydo not receive excellent customerservice. Further. research with alarger sample size is needed to verify these tentative findings.
Other than the differencesbetween different types of financial institutions, overall the findings of this analysis suggested surprisingly small differences in perceptions of service qualityamongst demographic groups.Such a result indicates either .thatconsumers of retail financial services have reasonablyhomogeneous needs, or financial institutions have placed considerableeffort into tailoring their servicesto the needs of various demographic groups. A combination of thesefactors most likely exists.Targeting market segments is however, not irrelevant to the industryand the various age categories inthe market seem to show potentialfor segmentation (Nadel, 1985;Esters & Don, 1986/7). There isgrowing commentary in the recentliterature on the desirability of targeting the ageing consumer("Going for the Gray", 1989:National Australia Bank, 1989). Itseems from this study that many ofthe elderly are seeking more assurance and security in their dealingswith financial institutions, and thearea could probably be furtherdeveloped.
LimitationsThe results, although for oneindustry and one geographic area,are not altogether convincing forthe reliability of SERVQUAL.The alpha coefficients exhibitedonly reasonable reliability for anestablished instrument. It is possible that the adaptation of theinstrument used for this.· study mayhave influenced its reliability.
Further research needs to beundertaken regardingSERVQUAL's applicability to theBrisbane and Australian setting.
There is also a problem withthe clarity of the 'expectations'construct. As intimated in the initial .discussion, to ask respondentswhat they expect of a service after0Ile, several or many contacts withinstitutions involved is to ask for asummary conclusion which is amixture of desires, predictions andwhat is learned from experience.For example, long-time customersmay have moderated their 'expectations' over time, perhaps becausethey consider their real desires tobe unattainable. This may well bethe case for credit union customers. Further research needs tobe undertaken into the effects ofexperience on expectations andperceived quality for serviceindustries.
SERVQUAL's applicability tovarious service industries whichvary in levels of the product components is also an issue which isuncertain, as the instrument wouldseem to most suit those industrieswith higher levels of intangibilityand process dimensions (Finn &Lamb, 1991). It has been previously noted (Carman, 1990) thatSERVQUAL is somewhat deficient in diagnosing outcome quality, except perhaps in the dimensionof reliability and some aspects ofthe tangibles dimension. In thisstudy for example, interest ratesanq other 'product' improvementsar~ difficult to place in theSERVQUAL dimensions anditems. Product and 'price' -relatedvariables such as interest rates andrange of products offered may bemost important for non-bankfinancial institutions, as they seemto try. to position themselves moretowards product variables. Theidea of value, or 'what you get forwhat you give up', is also missingfrom what the instrument measures.
Adaptation of SERVQUAL fordifferent service contexts mayneed to be more significant thanthe designers intimate. Althoughnot tested in this study, adaptationwould seem to be particularly nec-
essary for services varying significantly in product versus servicecomponents, (eg. appliance repairversus solicitor) and also for thosewhich rely more or less on processversus outcome dimensions (eg.restaurant versus panel beater).Further research needs to beundertaken in these areas.
The analysis of SERVQUALgap scores between expectationsand perceptions of performancealso has limitations. It is likely thatfor all but the very experienced,expectations will be 'ideals'. If aninstitution fails to live up to thoseideals, it does not necessarily follow that the consumer is dissatisfied with the service quality. A better measure might be a direct disconfirmation measure, as used insatisfaction research (Oliver 1980).Alternatively, standard Of benchmarked gap scores for variousindustries could be developed forcomparison purposes.
ConclusionThis paper attempted to gain
some insights into perceptions ofservice quality in the financial services industry, and in so doing,look at the applicability ofSERVQUAL to the Australianfinancial services context. Thepaper has indicated several areas inneed of improvement if the institution involved wishes to differentiate itself on service quality. Whenconsidering the admonitions of thepopular press, it would be veryeasy to assume that all consumersdesire very high levels of servicequality. However,credit unionsseem to have successfully loweredtheir customers' expectations inthis area, perhaps as a trade-off forhigher interest rates and otherproduct-related improvements.However, neither banks nor nonbank institutions are succeeding inmeeting expectations, even thoughthe level of those expectations differ. There may be opportunitiesfor gaining competitive advantagethrough service quality, particularly in the areas of responsiveness,reliability and assurance.
The paper also indicates thatsignificantly more work is neededin adapting the SERVQUALinstrument to the Australian environment and to different servicescontexts.
40 • Asia - Australia MarketingJournal Vol. 1, No.2
ReferencesAlbrecht, K. and R. Zemke(1985), Instilling a servicementality: like teaching an elephant to dance, InternationalManagement, November,pp.61-67.
Arnthorson, A., W.E. Berryand J .E. Urbany (1991),Difficulty of Pre-PurchaseQuality Inspection:Conceptualization andMeasurement, Advances inConsumer Research, 18,pp.217-224.
Australian Bureau of Statistics(1986), Australian Census,Brisbane Statistical Division.
Babakus, E. (1990),Dimensions of Service Quality:Method Artifacts?, AmericanMarketing Association'sEducators' Proceedings, p.290.
Berry, L.L., D.R. Bennett andC.W. Brown (1989), ServiceQuality - a Profit Strategy forFinancial Institutions, DowJones Irwin, Homewood, n.Carman, J.M. (1990),Consumer Perceptions ofService Quality: anAssessment of theSERVQUAL Dimensions,Journal of Retailing, 66,1,pp.33-55.
Churchill, G.A. and C.Surprenant (1982), An investigation into the Determinantsof Customer Satisfaction,Journal of Marketing Research,19, November, pp.491-504.
Cooper, T.A. (1988), TheCustomer is Always Right,Financial ServicesInternational, December, pp.911.
Darby, M.R. and E. Karni(1973), Free Competition andthe Optimal Amount of Fraud,Journal of Law and Economics,16~ April, pp.67-86.
Dodds, W.B. and K.B. Monroe(1985), The Effect of Brandand Price Information onSubjecti ve ProductEvaluations, Advances inConsumer Research, 12, pp.8590,
Dudley, S.C., G.F. Young andR.L. Powers (1985-86), AStudy of Factors AffectingIndividuals' BankingPreferences, Journal ofProfessional Services
Marketing, 1, Fall/Winter,pp.163-168.
Esters, R. and C. Don(1986/87), MarketSegmentation: Effecti veDesign and Use of FinancialService Institutions, Journal ofRetail Banking, 8,4, pp.19-28.
Finn, D.W. and C.W. Lamb(1991), An Evaluation ofSERVQUAL Scales in a RetailSetting, Advances inConsumer Research, 18,pp.483-490.
Garvin, D.A. (1983), Qualityon the Line, Harvard BusinessReview, 61, SeptemberOctober, pp.65-73.
Gestranius, N. (1984),Upplevd kvalitet paVikinglinjens Diana II,Helsingfors, SvenskaHandelshogskolan, marknadsekonomi (original unseen).
Ghingold, M. and K.C. Maier(1988), Questioning theUnquestioned Importance ofPersonal Service in ServicesMarketing: Discussion andImplications, In The ServicesChallenge: Integrating forCompetitive Advantage, Editedby lA. Czepiel, C.A. Congramand J. Shanahan, AmericanMarketing Association,Chicago, n., pp.45-49.
Going for the Gray, (1989),ABC Banking Journal, April,pp.43-63,66.
Gronroos, C. (1982), StrategicManagement and Marketing inthe Services Sector, ResearchReports, No.8, Helsingfors,Svenska Handelshogskolan(original unseen).
Gwin, lM. and J.H. Lindgren(1987), Bank AttributeDeterminance: Initial Findingsin the Consumer ChoiceProcess, In Creativity inServices Marketing, Edited byM. Venkatesan, D.M.Schmalensee and C. Marshall,American MarketingAssociation, Chicago, II.,pp.53-57.
Hill, D. (1986), Satisfactionand Consumer Services,Advances in ConsumerResearch, 13, pp.311-315.
Jayanti, R. and A. Jackson(1991), Service Satisfaction:an Exploratory Investigation ofThree Models, Advances inConsumer Research, 18,pp.603-610.
Kennedy, S. (1989), TheUnloved Bank Manager, TheBulletin, 2nd May, pp.42-54.
Lambert, D.M. and M.C. Lewis(1990), A Comparison ofAttribute Importance andExpectation Scales forMeasuring Service Quality,American MarketingAssociation's Educators'Proceedings, p.291.
Lehtinen, U. and J.R. Lehtinen(1985), Service Quality: aStudy of Quality Dimensions,In Proceedings, Second WorldMarketing Congress, v.l,University of Stirling, Scotland(original unseen).
Lewis, B., ed. (1989), Qualityin the Service Sector: aReview, International Journalof Bank Marketing, 7,5, specialissue.
Lindqvist, LJ. (1987), Qualityand Service Value in theConsumption of Services, InAdd Value to Your Service: theKey to Success, Edited by C.Surprenant, AmericanMarketing Association,Chicago, 11., pp. 17-20.
Marshall, C.E. (1985), Canwe be 'Consumer-Oriented' ina Changing Financial ServiceWorld? in Services Marketingin a Changing Environment,Edited by T.M. Bloch, G.D.Upah and V.A. Zeithaml,American MarketingAssociation, Chicago, 11.
Martin, J. (1981), SevenDeterminant Problems BehindBank Retention and SelectionDecisions, In Marketing ofServices, Edited by J .H.Donnelly and W.R. George,American MarketingAssociation, Chicago, 11.,pp.16-20.
Murdock, G.W. and R.G. Roe(1986), Consumer BankSelection: Attributes ofChoice, American MarketingAssociation's Educators'Proceedings, pp.12-17.
Nadel, CJ. (1985), Bankersmust Adopt Target-marketingMethods, Marketing News,19,8, p.20.
National Australia Bank(1989), Ageing DemographicPerspectives, QuarterlySummary, March, pp.8-9.
Nelson, P. (1970),Information and ConsumerBehavior, Journal of Political
Economy, 78,20, pp.311-329.
Oliver, R.L. (1980), ACognitive Model of theAntecedents and Consequencesof Satisfaction Decisions,Journal of Marketing Research,17, November, pp.460-469,
Olshavsky, R.W. (1985),Perceived Quality in ConsumerDecision-Making: anIntegrated TheoreticalPerspective, In PerceivedQuality, Edited by J. Jacobyand J. Olson, Lexington Books,Lexington, Ma.
Ostrow, R. (1991), Servicewith a Smile - All the Way tothe Bank, The WeekendAustralian, March 30-31,Review, p.14.
Parasuraman, A., V.A.Zeithaml and L.J. Berry(1984) A Conceptual Model ofService Quality and itsImplications for FutureResearch, Report No. 84-106,Marketing Science Institute,Cambridge, Ma.
Parasuraman, A., V.A.Zeithaml and L.J. Berry(1985), A Conceptual Modelof Service Quality and itsImplications for FutureResearch, Journal ofMarketing, 49, Fall, pp.41-50.
Parasuraman, A., V.A.Zeithaml and L.J. Berry(1988), SERVQUAL: aMultiple-Item Scale forMeasuring ConsumerPerceptions of Service Quality,Journal of Retailing, 69, 1,pp.l2-39.
Parasuraman, A., V.A.Zeithaml and L.J. Berry(1991), UnderstandingCustomer Expectations ofService, Sloan ManagementReview, Spring, pp.39-48.
Reserve Bank of Australia(1990), Bulletin, May.
Schertzer, C.B. and J.B.Kernan (1985), More on theRobustness of ResponseScales, Journal of the MarketResearch Society, 27, 4,pp.261-282.
Skern, B.B. and S.J. Gould(1988), The Consumer asFinancial Leader, Journal ofRetail Banking, 10, 2, pp.4352.
Solomon, M.R., C. Surprenant,J.A. Czepiel and E.G. Gutman(1985), A Role Theory
Asia - Australia MarketingJournal Vol. 1, No.2· 41

Perspective on DyadicInteractions: the ServiceEncounter, Journal ofMarketing, 49, Winter, pp.99111.
Swan, J.E. and I.F. Trawick(19.81), Disconfirmation ofExpectations and Satisfaction
with a Retail Service, Journalof Retailing, 57, 3, Fall, pp.4967.
Webster, C. (1989), CanConsumers be Segmented onthe Basis of their ServiceQuality Expectations?,Journal of Services Marketing,
3,2, pp.35-53.
Wong, S.M. and C. Perry(1991), Customer ServiceStrategies in Retail FinancialInstitutions, InternationalJournal of Bank Marketing, 6,2, pp.11-16.
Woodruff, R.B., E.R. Cadotte,and R.L. Jenkins (1983)Modeling ConsumerSatisfaction Processes usingExperience-Based Norms,Journal of MarketingResearch, 20, August., pp.296304.
42 • Asia - Australia MarketingJournal Vol. 1, No.2