customer satisfaction index of … 2016 full year and fourth quarter overview the customer...
TRANSCRIPT
CUSTOMER SATISFACTION INDEX OF SINGAPORE 2016 FULL YEAR RESULTS OVERVIEW
Q4 FINDINGS FOR FINANCE & INSURANCE AND HEALTHCARE
CSISG 2016 FULL YEAR AND FOURTH QUARTER OVERVIEW
The Customer Satisfaction Index of Singapore (CSISG) computes customer satisfaction scores at the national, sector, sub-sector, and company levels. The CSISG serves as a quantitative benchmark of the quality of goods and services produced by the Singapore economy over time and across countries. The fourth quarter results mark the end of measurement for CSISG 2016. Singapore’s 2016 national score was computed using the data collected during these four quarters.
FULL YEAR RESULTS HIGHLIGHTS
Singapore’s CSISG score for 2016 was 71.8 points, on a scale of 0 to 100. This was a statistically significant* 1.69-point (+2.4%) improvement over 2015.
Of the 11 sectors that the CSISG measured in 2016, nine recorded significantly higher scores year-on-year. These were, in order of performance, Public Education, Air Transport, Finance & Insurance, Retail, Tourism, Healthcare, Food & Beverage, Info-communications, and Land Transport. Two sectors, Logistics and Private Education, did not register any significant change. These sectoral performances are illustrated in Figure 1.
FOURTH QUARTER RESULTS HIGHLIGHTS
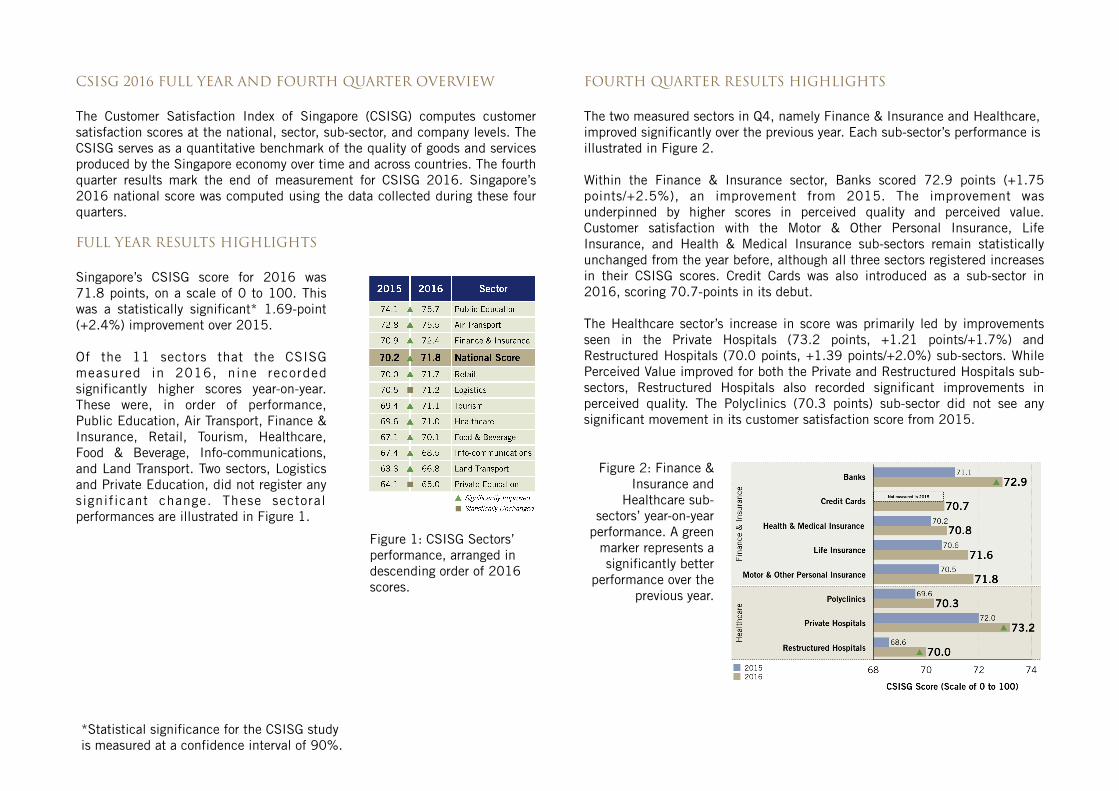
The two measured sectors in Q4, namely Finance & Insurance and Healthcare, improved significantly over the previous year. Each sub-sector’s performance is illustrated in Figure 2.
Within the Finance & Insurance sector, Banks scored 72.9 points (+1.75 points/+2.5%), an improvement from 2015. The improvement was underpinned by higher scores in perceived quality and perceived value. Customer satisfaction with the Motor & Other Personal Insurance, Life Insurance, and Health & Medical Insurance sub-sectors remain statistically unchanged from the year before, although all three sectors registered increases in their CSISG scores. Credit Cards was also introduced as a sub-sector in 2016, scoring 70.7-points in its debut.
The Healthcare sector’s increase in score was primarily led by improvements seen in the Private Hospitals (73.2 points, +1.21 points/+1.7%) and Restructured Hospitals (70.0 points, +1.39 points/+2.0%) sub-sectors. While Perceived Value improved for both the Private and Restructured Hospitals sub-sectors, Restructured Hospitals also recorded significant improvements in perceived quality. The Polyclinics (70.3 points) sub-sector did not see any significant movement in its customer satisfaction score from 2015.
Figure 2: Finance & Insurance and
Healthcare sub-sectors’ year-on-year
performance. A green marker represents a significantly better
performance over the previous year.
Figure 1: CSISG Sectors’ performance, arranged in descending order of 2016 scores.
*Statistical significance for the CSISG study is measured at a confidence interval of 90%.
FOURTH QUARTER KEY FINDINGS
Healthcare Sub-sectors’ Waiting Experience A Larger Differentiator of Quality
than Waiting Time
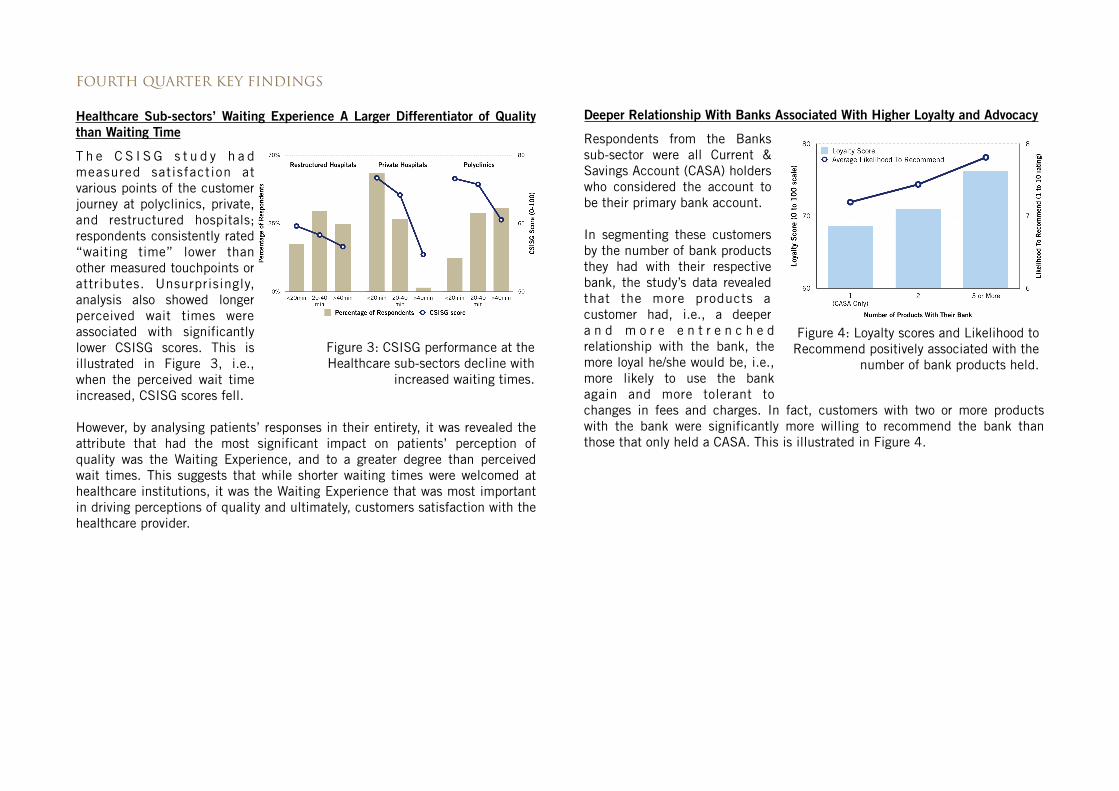
T h e C S I S G s t u d y h a d measured satisfaction at various points of the customer journey at polyclinics, private, and restructured hospitals; respondents consistently rated “waiting time” lower than other measured touchpoints or attributes. Unsurprisingly, analysis also showed longer perceived wait times were associated with significantly lower CSISG scores. This is illustrated in Figure 3, i.e., when the perceived wait time increased, CSISG scores fell.
However, by analysing patients’ responses in their entirety, it was revealed the attribute that had the most significant impact on patients’ perception of quality was the Waiting Experience, and to a greater degree than perceived wait times. This suggests that while shorter waiting times were welcomed at healthcare institutions, it was the Waiting Experience that was most important in driving perceptions of quality and ultimately, customers satisfaction with the healthcare provider.
Deeper Relationship With Banks Associated With Higher Loyalty and Advocacy
Respondents from the Banks sub-sector were all Current & Savings Account (CASA) holders who considered the account to be their primary bank account.
In segmenting these customers by the number of bank products they had with their respective bank, the study’s data revealed that the more products a customer had, i.e., a deeper a n d m o r e e n t r e n c h e d relationship with the bank, the more loyal he/she would be, i.e., more likely to use the bank again and more tolerant to changes in fees and charges. In fact, customers with two or more products with the bank were significantly more willing to recommend the bank than those that only held a CASA. This is illustrated in Figure 4.
Figure 3: CSISG performance at the Healthcare sub-sectors decline with
increased waiting times.
Figure 4: Loyalty scores and Likelihood to Recommend positively associated with the
number of bank products held.
Both Product and Service Attributes Drive Quality and Satisfaction with Credit
Cards
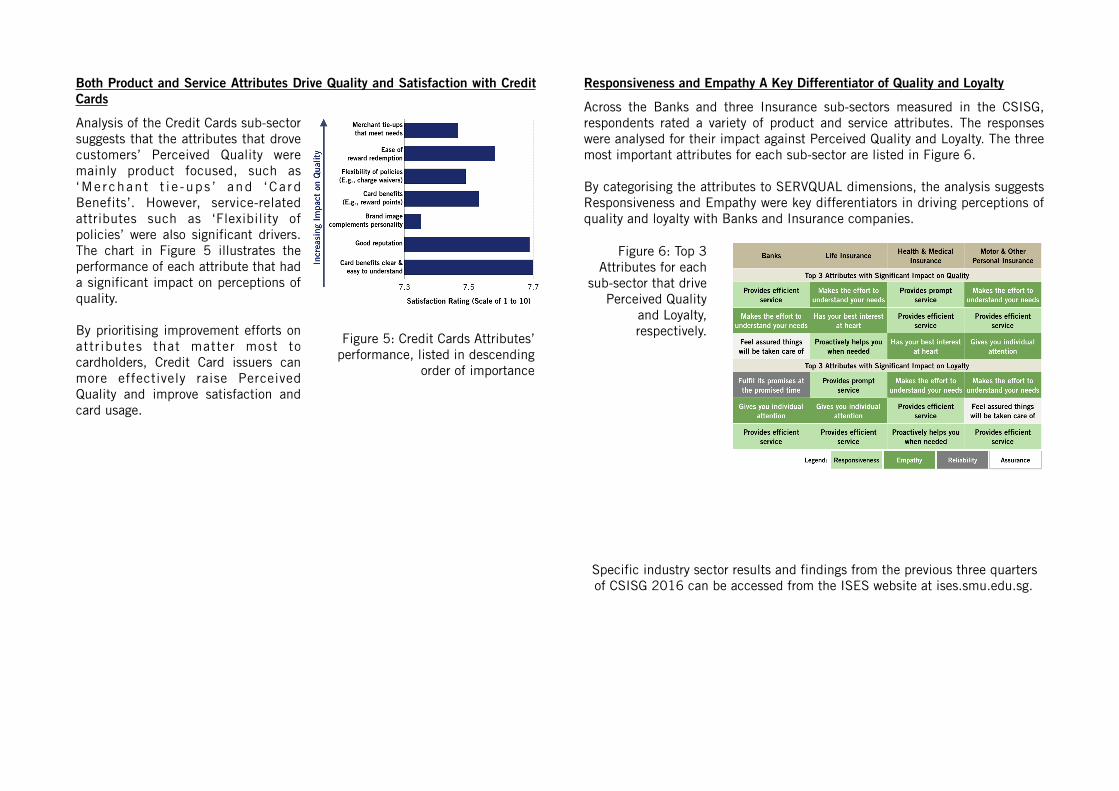
Analysis of the Credit Cards sub-sector suggests that the attributes that drove customers’ Perceived Quality were mainly product focused, such as ‘Me rchan t t i e -ups ’ and ‘Ca rd Benefits’. However, service-related attributes such as ‘Flexibility of policies’ were also significant drivers. The chart in Figure 5 illustrates the performance of each attribute that had a significant impact on perceptions of quality. By prioritising improvement efforts on attributes that matter most to cardholders, Credit Card issuers can more effectively raise Perceived Quality and improve satisfaction and card usage.
Responsiveness and Empathy A Key Differentiator of Quality and Loyalty
Across the Banks and three Insurance sub-sectors measured in the CSISG, respondents rated a variety of product and service attributes. The responses were analysed for their impact against Perceived Quality and Loyalty. The three most important attributes for each sub-sector are listed in Figure 6.
By categorising the attributes to SERVQUAL dimensions, the analysis suggests Responsiveness and Empathy were key differentiators in driving perceptions of quality and loyalty with Banks and Insurance companies.
Figure 6: Top 3 Attributes for each
sub-sector that drive Perceived Quality
and Loyalty, respectively.
Specific industry sector results and findings from the previous three quarters of CSISG 2016 can be accessed from the ISES website at ises.smu.edu.sg.
Figure 5: Credit Cards Attributes’ performance, listed in descending
order of importance
CSISG BACKGROUND
CSISG scores are generated based on the econometric modelling of survey data collected from end-users after the consumption of products and services.
Company scores are weighted based on a separate incidence study. This incidence study helps determine each company’s sample profile and the local-tourist weights. Sub-sector scores are derived as a weighted average of company scores, in proportion to the local and tourist incidence interactions with the constituent companies. Sector scores are derived by aggregating the sub-sector scores proportionately to each sub-sector’s revenue contributions. Finally, the national score is weighted according to each sector’s contribution to GDP. CSISG scores customer satisfaction on a scale of 0 to 100 with higher scores representing better performance.
Under a quarterly measure-and-release system, distinct sectors are measured each quarter with their results released the following quarter. Companies in the Retail and Info-Communications sectors were measured in the first quarter, Air Transport, Land Transport, Logistics, Public, and Private Education in the second quarter, Food & Beverage and Tourism sectors in the third quarter, and finally the companies of Finance & Insurance and Healthcare sectors, in the fourth quarter.
CSISG 2016 Q4 marks the end of measurement for 2016. The CSISG 2016 national score was computed using the data collected during these four quarters.
The Finance & Insurance sector comprises of the Banks sub-sector, Credit Cards sub-sector, Health & Medical Insurance sub-sector, Motor & Other Personal Insurance sub-sector, and Life Insurance sub-sector. The Healthcare sector consists of the Private Hospitals sub-sector, Restructured Hospitals sub-sector, and Polyclinics sub-sector.
CSISG 2016 FIELDWORK
Survey data for the Finance & Insurance and Healthcare sectors was collected between October 2016 and January 2017. This was primarily conducted through face-to-face interviews with Singapore residents at their homes. The survey was also conducted with departing tourists at Changi Airport.
The Q4 fieldwork garnered 9,042 interviews with locals and 360 with departing tourists at the airport. In total, there were 9,402 unique responses covering 85 companies and entities in the Finance & Insurance and Healthcare sectors; 48 entities have published scores.
For the whole of 2016, 40,809 unique responses were recorded. This comprised of 28,823 face-to-face interviews with Singapore residents, 3,984 online surveys, and 8,002 interviews with tourists at Changi Airport. In all, the study covered 1,245 companies and entities, with 196 entities with published scores.
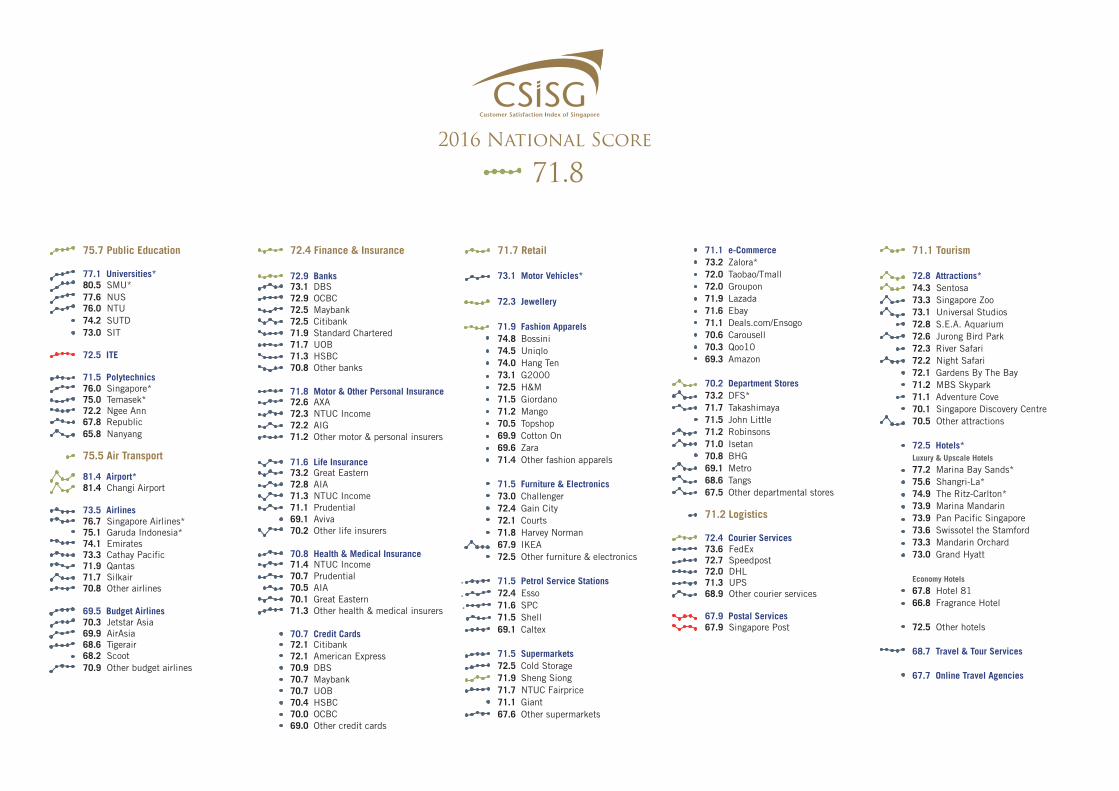
75.7 Public Education 77.1 Universities* 80.5 SMU*77.6 NUS 76.0 NTU74.2 SUTD73.0 SIT 72.5 ITE 71.5 Polytechnics 76.0 Singapore* 75.0 Temasek* 72.2 Ngee Ann 67.8 Republic 65.8 Nanyang
75.5 Air Transport 81.4 Airport* 81.4 Changi Airport 73.5 Airlines 76.7 Singapore Airlines* 75.1 Garuda Indonesia* 74.1 Emirates 73.3 Cathay Pacific 71.9 Qantas 71.7 Silkair 70.8 Other airlines 69.5 Budget Airlines 70.3 Jetstar Asia 69.9 AirAsia 68.6 Tigerair 68.2 Scoot 70.9 Other budget airlines
71.7 Retail
73.1 Motor Vehicles*
72.3 Jewellery
71.9 Fashion Apparels74.8 Bossini74.5 Uniqlo74.0 Hang Ten73.1 G200072.5 H&M71.5 Giordano71.2 Mango70.5 Topshop69.9 Cotton On69.6 Zara71.4 Other fashion apparels
71.5 Furniture & Electronics73.0 Challenger72.4 Gain City72.1 Courts71.8 Harvey Norman67.9 IKEA72.5 Other furniture & electronics
71.5 Petrol Service Stations72.4 Esso71.6 SPC71.5 Shell69.1 Caltex
71.5 Supermarkets72.5 Cold Storage71.9 Sheng Siong71.7 NTUC Fairprice71.1 Giant67.6 Other supermarkets
71.1 e-Commerce73.2 Zalora*72.0 Taobao/Tmall72.0 Groupon71.9 Lazada71.6 Ebay 71.1 Deals.com/Ensogo70.6 Carousell70.3 Qoo10 69.3 Amazon
70.2 Department Stores73.2 DFS*71.7 Takashimaya71.5 John Little71.2 Robinsons71.0 Isetan70.8 BHG69.1 Metro68.6 Tangs67.5 Other departmental stores
71.2 Logistics 72.4 Courier Services 73.6 FedEx 72.7 Speedpost 72.0 DHL 71.3 UPS 68.9 Other courier services 67.9 Postal Services 67.9 Singapore Post
72.4 Finance & Insurance
72.9 Banks 73.1 DBS72.9 OCBC72.5 Maybank72.5 Citibank71.9 Standard Chartered71.7 UOB71.3 HSBC70.8 Other banks 71.8 Motor & Other Personal Insurance 72.6 AXA72.3 NTUC Income72.2 AIG71.2 Other motor & personal insurers
71.6 Life Insurance 73.2 Great Eastern72.8 AIA71.3 NTUC Income71.1 Prudential69.1 Aviva70.2 Other life insurers
70.8 Health & Medical Insurance 71.4 NTUC Income70.7 Prudential70.5 AIA70.1 Great Eastern71.3 Other health & medical insurers
70.7 Credit Cards 72.1 Citibank72.1 American Express70.9 DBS70.7 Maybank70.7 UOB70.4 HSBC70.0 OCBC69.0 Other credit cards
2016 National Score
71.8
71.1 Tourism
72.8 Attractions*74.3 Sentosa73.3 Singapore Zoo73.1 Universal Studios72.8 S.E.A. Aquarium72.6 Jurong Bird Park72.3 River Safari72.2 Night Safari72.1 Gardens By The Bay71.2 MBS Skypark71.1 Adventure Cove70.1 Singapore Discovery Centre70.5 Other attractions
72.5 Hotels*Luxury & Upscale Hotels
77.2 Marina Bay Sands*75.6 Shangri-La*74.9 The Ritz-Carlton*73.9 Marina Mandarin73.9 Pan Pacific Singapore73.6 Swissotel the Stamford73.3 Mandarin Orchard73.0 Grand Hyatt
Economy Hotels
67.8 Hotel 8166.8 Fragrance Hotel
72.5 Other hotels
68.7 Travel & Tour Services
67.7 Online Travel Agencies
2016 National Score
71.8
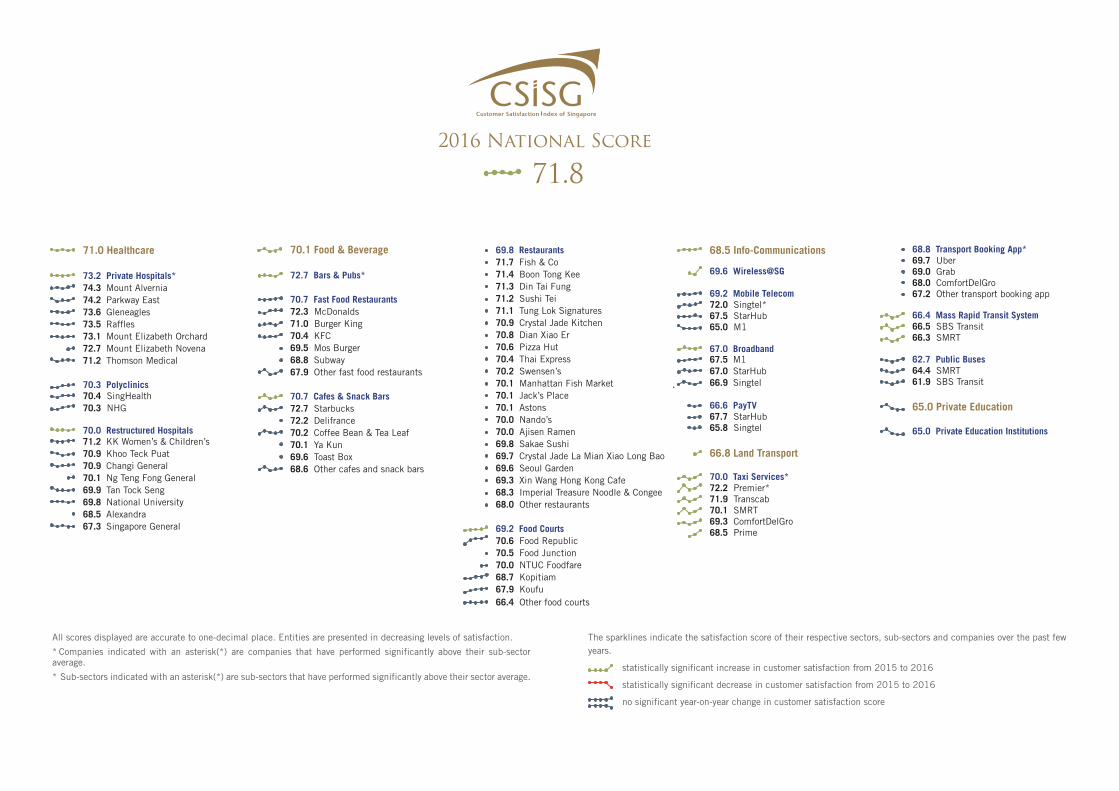
71.0 Healthcare
73.2 Private Hospitals*74.3 Mount Alvernia74.2 Parkway East73.6 Gleneagles73.5 Raffles73.1 Mount Elizabeth Orchard72.7 Mount Elizabeth Novena71.2 Thomson Medical
70.3 Polyclinics 70.4 SingHealth70.3 NHG 70.0 Restructured Hospitals 71.2 KK Women’s & Children’s70.9 Khoo Teck Puat70.9 Changi General70.1 Ng Teng Fong General69.9 Tan Tock Seng69.8 National University68.5 Alexandra67.3 Singapore General
69.8 Restaurants71.7 Fish & Co 71.4 Boon Tong Kee 71.3 Din Tai Fung 71.2 Sushi Tei71.1 Tung Lok Signatures70.9 Crystal Jade Kitchen 70.8 Dian Xiao Er 70.6 Pizza Hut 70.4 Thai Express 70.2 Swensen’s 70.1 Manhattan Fish Market 70.1 Jack’s Place 70.1 Astons70.0 Nando’s70.0 Ajisen Ramen 69.8 Sakae Sushi 69.7 Crystal Jade La Mian Xiao Long Bao 69.6 Seoul Garden 69.3 Xin Wang Hong Kong Cafe 68.3 Imperial Treasure Noodle & Congee 68.0 Other restaurants 69.2 Food Courts70.6 Food Republic70.5 Food Junction70.0 NTUC Foodfare68.7 Kopitiam67.9 Koufu66.4 Other food courts
68.5 Info-Communications 69.6 Wireless@SG 69.2 Mobile Telecom 72.0 Singtel* 67.5 StarHub 65.0 M1 67.0 Broadband 67.5 M167.0 StarHub66.9 Singtel 66.6 PayTV 67.7 StarHub 65.8 Singtel
66.8 Land Transport
70.0 Taxi Services* 72.2 Premier* 71.9 Transcab 70.1 SMRT 69.3 ComfortDelGro 68.5 Prime
70.1 Food & Beverage
72.7 Bars & Pubs*
70.7 Fast Food Restaurants72.3 McDonalds71.0 Burger King70.4 KFC69.5 Mos Burger68.8 Subway67.9 Other fast food restaurants
70.7 Cafes & Snack Bars72.7 Starbucks72.2 Delifrance70.2 Coffee Bean & Tea Leaf70.1 Ya Kun69.6 Toast Box68.6 Other cafes and snack bars
The sparklines indicate the satisfaction score of their respective sectors, sub-sectors and companies over the past few years.
statistically significant increase in customer satisfaction from 2015 to 2016
statistically significant decrease in customer satisfaction from 2015 to 2016
no significant year-on-year change in customer satisfaction score
All scores displayed are accurate to one-decimal place. Entities are presented in decreasing levels of satisfaction.
* Companies indicated with an asterisk(*) are companies that have performed significantly above their sub-sector average.
* Sub-sectors indicated with an asterisk(*) are sub-sectors that have performed significantly above their sector average.
68.8 Transport Booking App* 69.7 Uber 69.0 Grab 68.0 ComfortDelGro 67.2 Other transport booking app 66.4 Mass Rapid Transit System 66.5 SBS Transit 66.3 SMRT 62.7 Public Buses 64.4 SMRT 61.9 SBS Transit 65.0 Private Education 65.0 Private Education Institutions
contact us
For more details on the CSISG, the ISE Corporate Membership programme, and customised research, please reach us at
Institute of Service Excellence Singapore Management University
81 Victoria Street Tel: +65 6828 0111 Administration Building Fax: +65 6828 0690 Singapore 188065 Email: [email protected]
ises.smu.edu.sg