customer service - southern california edison · · 2016-11-18customer service before the public...
TRANSCRIPT

Application No.: A.16-09- Exhibit No.: SCE-03 R Witnesses: B. Anderson
D. Bernaudo D. Kempf J. Lim L. Low S. Nagoshi D. Tunnicliff
(U 338-E)
2018 General Rate Case
Customer Service
Before the
Public Utilities Commission of the State of California
Rosemead, California
November, 2016
A
ERRATA

SUMMARY
O&M
This volume presents the Customer Service request of $199.964 million (constant 2015 $) in
operation and maintenance (O&M) expense for the 2018 Test Year forecast. SCE’s request is
$7.98 million below 2015 recorded adjusted O&M expense.
• Reflects $23.85 million of reductions that offset more than the proposed program changes.
• Includes $8.22 million ($9.97 million expense and $1.75 million benefits) related to the
proposed CS Re-Platform Project discussed in Exhibit SCE-04, Volume 3.
SCE proposes a Test Year OOR forecast of $28.177 million, a decrease of $4.077 million from
2015 recorded levels of $32.255 million primarily due to a proposed reduction to SCE’s Late
Payment Charge and the Non-Residential Connection Charge, and lower Opt-Out fee volumes.
Customer Service 2018 O&M Expense Forecast
(Constant 2015 $ millions) Excludes Uncollectibles
$27,981 $4.274

8
1. Customer Service O&M Forecast 1
Customer Service forecasts a total 2018 Test Year O&M funding level of $199.964 2
million, $7.98 million less than the Base Year recorded costs. This forecast includes $23.85 million of 3
Operational Excellence reductions described in the previous section that offset more than the proposed 4
program changes and the O&M impact of the CS Re-Platform program. Figure I-1 below provides a 5
summary by FERC Account type and activity group: customer growth, program changes, CS 6
Re-Platform O&M expenses and benefits, and Operational Excellence. The Customer Service Test Year 7
request also includes an O&M net increase of $8.22 million ($9.97 million in expenses and $1.75 8
million in benefits) related to the planned implementation of a CS Re-Platform project that replaces the 9
obsolete Customer Service System (CSS). The CS Re-Platform project is described in detail in SCE-04, 10
Volume 3, and other Information Technology (IT)-related implementation costs as a result of CS 11
Re-Platform are described in SCE-04, Volume 1. Descriptions of the individual Customer Service FERC 12
account forecasts are described in detail within this exhibit. 13
$199.761
$8.18

9
Figure I-1 Customer Service
Summary of 2018 Test Year O&M Expense Forecast (Constant 2015 $ Millions)
Figure I-2 below provides Customer Service’s five-year recorded O&M expense history 1
and the O&M forecast including the 2018 Test Year. 2
Line No. Functional Area 2015
RecordedCustomer Growth
Program Changes
CSReplatform
CS Replatform
Benefits
Operation Excellence 2018 Forecast
1 Distribution Acconts FERC 580, 586, 587 $34.76 $0.78 -$0.64 $0.00 ($0.58) ($1.18) $33.14
2 Customer Accounts FERC 901, 902, 903, 905 $149.86 $2.22 $4.05 $9.97 ($0.90) ($19.47) $145.73
3 CS&I Accounts FERC 907, 908 $23.33 $0.20 $1.03 $0.00 ($0.27) ($3.20) $21.09
4 Total $207.94 $3.21 $4.45 $9.97 ($1.75) ($23.85) $199.96
($2)($24)
$208 $3 $4 $10
$200
2015Recorded
CustomerGrowth
ProgramChanges
CS Re-platform CS Re-platformBenefits
OperationalExcellence
2018Forecast
$3.94
$0.95$4.25
$145.62$21.01
$199.77

10
Figure I-2 Customer Service
Summary of O&M Test Year Forecast (Excluding Uncollectibles)
(Constant 2015 $000)
2. Customer Service Capital Expenditure Forecast 1
Customer Service forecasts the general capital expenditures necessary to deliver customer 2
service. Chapter VI of this exhibit provides the forecast for meters, specialized equipment, structures, 3
and improvements. Chapter VII of this exhibit provides the forecast for BCD specialized equipment, 4
structures, and improvements. Table I-2 summarizes the Customer Service capital expenditure forecast 5
for 2016 – 2020. 6
Forecast2011 2012 2013 2014 2015 2018
Labor 186,716 144,578 146,860 135,555 127,831 123,006 Non-labor 95,600 78,251 88,390 83,534 79,650 76,343 Other 221 656 235 259 460 615 Total 282,537 223,485 235,485 219,348 207,941 199,964
Expense Category
Recorded/Adjusted
$0
$50,000
$100,000
$150,000
$200,000
$250,000
$300,000
2011 2012 2013 2014 2015 2018
Labor Non-labor Other
122,847
199,761
76,299

12
mainframe billing system, which was constructed in the late 1980s using now-obsolete technology. The 1
CS Re-Platform project will utilize the SAP8 Customer Relationship & Billing (CR&B) module9 on a 2
platform that is flexible and scalable. SCE expects the CS Re-Platform project to create a stable 3
technology environment, lower operating costs, improve our ability to support customer service 4
capabilities, and meet future needs in a cost-efficient manner. The details and forecast information for 5
this capitalized software project are provided in Exhibit SCE-04, 6
Volume 3. 7
Other key Customer Service capitalized software projects include: (1) Digital Customer 8
Self-Service Project, which will increase customer self-service options by enhancing the digital 9
experience by integrating SCE.com with our CRM system, making upgrades to our Interactive Voice 10
Response (IVR) system, developing our Customer Data Warehouse, and enhancing our Outage 11
Communications System; (2) Alerts and Notifications Project, which will enable system capabilities to 12
provide customers with the ability to manage their contact information and alert preferences through 13
self-service, and enable SCE representatives to enroll customers into alert programs of their choice; and 14
(3) Meter Data Management System (MDMS) Upgrade Project, which will refresh the software utilized 15
for managing the billing data for over five million customers. 16
Because SCE’s customer engagement model relies significantly on system enhancements, 17
we require capitalized software investments to implement our strategy. These investments will enable us 18
to modernize our customer service practices and procedures to match customers’ expectations for 19
customer service. The details and forecast information for these capitalized software projects are 20
provided in Exhibit SCE-04, Volume 2. 21
4. Customer Service Other Operating Revenue Forecast 22
For the 2018 Test Year, SCE proposes updated service fees to reflect our current cost of 23
providing services that are recovered through OOR. Overall, the Test Year forecast OOR of $28.177 24
8 Systems, Applications and Products (SAP) Enterprise Resource Planning and data management software. 9 SAP’s CR&B module is an industry-specific solution for the utility industry that has numerous components
such as device management, customer service, billing and invoicing, and accounts receivable management. See, e.g., “SAP IS-U Online Training” overview, Success Soft Solutions, available at http://www.successoftsolutions.com/index.php?option=com_content&view=article&id=175&Itemid=355 [as of August 15, 2016].
$27.981

13
million is decreasing by $4.077 million from 2015 recorded levels of $32.255 million mainly because 1
SCE proposes to reduce the Late Payment Charge and the Non-Residential Connection Charge, and 2
estimates lower Opt-Out fee volumes. The reduced costs to perform many of these services support 3
SCE’s proposed reductions to both our residential and non-residential service fees. The Customer 4
Service OOR, service charges, and fees are contained in Chapter XI of this exhibit. 5
Table I-4 Customer Service
OOR By Service Charge or Fee 2015 Recorded and 2018 Forecast
(Nominal $000)
Line No.
FERC Account Account Name 2015
Recorded2018
Proposed Difference
1 450.100 Late Payment Charge – Non-Residential $ 6,592 $ 5,779 $ (813)2 450.150 Late Payment Charge – Residential $ 11,086 $ 9,452 $ (1,633)3 451.110 Returned Check Charge $ 1,510 $ 1,396 $ (114)4 451.300 Connection Charge – Residential $ 6,784 $ 7,071 $ 287 5 451.310 Connection Charge – Non-Residential $ 3,312 $ 2,043 $ (1,269)6 451.320 Connection Charge – At Pole $ 14 $ 28 $ 14 7 451.780 Misc. Revenue – Recovery Unauthorized Use Non-Energy $ 103 $ 103 $ - 8 451.820 Opt-Out CARE – Initial $ 3 $ 2 $ (1)9 451.820 Opt-Out NON-CARE – Initial $ 86 $ 51 $ (35)
10 451.820 Opt-Out CARE – Monthly $ 243 $ 29 $ (214)11 451.820 Opt-Out NON-CARE – Monthly $ 1,647 $ 269 $ (1,378)12 456.401 Direct Access Services $ 283 $ 111 $ (172)13 456.948 Service Fee – Optimal Billing Period $ 0 $ 0 $ - 14 456.412 Community Choice Aggregation $ 30 $ 1,299 $ 1,269 15 456.415 Manufactured Home Billing Service $ 3 $ 3 $ - 16 456.945 SCE EnergyManager $ 145 $ 127 $ (18)17 456.924 Energy Related Services (ERS) $ 414 $ 414 $ - 18 TOTAL CS OOR $ 32,255 $ 28,177 $ (4,077)
18 ($225
1,245
$1,275$27,981 ($4,274)
108 ($1,539)
$4.274

15
Figure I-4 2015 GRC Requested and Authorized Capital Expenditures Compared to 2015
Recorded for Customer Service (Nominal $ millions)
E. Compliance Requirements 1
Customer Service is required to comply with the following regulatory decisions related to the 2
GRC proceeding: 3
In D.15-11-021, SCE was directed to provide a comparison of the Commission-authorized 4
2015 O&M expense and capital expenditures to SCE’s recorded 2015 O&M and capital 5
expenditures.11 As such, this information is provided for each FERC activity and major capital 6
category within Chapters III-X. 7
D.15-09-013 approved the Joint Motion of SCE and the City of Lancaster for Adoption of 8
Settlement Agreement, wherein SCE agreed to perform a comprehensive update of all the 9
11 D.15-11-021, OP 3.
($2,374) ($327) ($1,001)
$30,810
$18,342
$14,640
0
5,000
10,000
15,000
20,000
25,000
30,000
35,000
2015Request
2015Authorized
Meters Variance SpecializedEquipmentVariance
Structures &Improvements
Variance
2015 Recorded
Meters Specialized Equipment Structures and Improvements
000s
$13,847
($3,167)

49
(2) Service Guarantee – Missed Appointments 1
SCE’s Missed Appointment service guarantee states that SCE will arrive 2
at the agreed-upon appointment within 30 minutes before or after the scheduled appointment time. SCE 3
pays a $30 credit for each missed appointment related to service establishment (turn-on) and billing 4
inquiries. Table III-10 below shows the Missed Appointment service guarantee credits SCE paid over 5
the last five years. In 2015, out of a five-year average of 3,717 turn-on appointments and billing 6
inquiries, SCE paid 177 claims, or 4.8 percent of all turn-on and billing-inquiry appointments. 7
Table III-10 Missed Appointment Service Guarantee Credits
Recorded 2011-2015 (Nominal $000)
SCE proposes to include the cost of service guarantee credits in our cost 8
structure based on the average number of missed appointments that have been recorded over the last five 9
years. SCE rarely receives a customer complaint regarding a missed appointment, because complaints 10
are generally self-reported by SCE. Most late or missed appointments result from heavy traffic 11
preceding work that requires more time to complete than planned, or higher-priority emergency work 12
causing a deferral of the routine work. This service commitment results in improved service levels for 13
all customers and should be treated as a normal cost of business. Due to the variability in the number of 14
claims paid across the years, SCE proposes that the five-year average of $5,316 for credits be used as the 15
2011 2012 2013 2014 20151 Number of Claims Made 235 163 149 208 131 1772 Number of Claims Paid 235 163 149 208 131 1773 Amount Paid $7,050 $4,890 $4,470 $6,240 $3,930 $5,316
4Total Volume of Turn On Appointments and Billing Inquiries
6,320 4,707 3,117 2,637 1,804 3,717
5Paid % of Total Volume of Turn On Appointments and Billing Inquiries
3.7% 3.5% 4.8% 7.9% 7.3% 4.8%
Line No.
Missed Appointments Recorded Five-Year Average

56
SCE.com was corrected and ESC pickup reads decreased by 36.7 percent due to a reduction in non-1
communicating meters as shown in Table III-9. 2
b) Comparison of 2015 Authorized and Recorded O&M Expenses 3
Figure III-15 compares the requested and authorized O&M expenses from SCE’s 4
2015 GRC with the 2015 recorded expenses in FERC Account 587 in compliance with D.15-11-021. As 5
shown in Figure III-15, SCE’s recorded expenses for 2015 in FERC Account 587 were less than the 6
authorized amount by $1.7 million, or 25.8 percent. This variance is primarily due to the delay in 7
implementing two programs authorized in the 2015 GRC related to Tamper Flags and Unusual Usage, 8
which are still in the development stages. In addition, ESC stabilization efforts reduced the need for 9
approximately 100,000 pick-up reads. 10
Field Service

76
a) Historic Variance Analysis for Billing Services 1
As shown in Figure IV-20, over the five year period from 2011 to 2015, Billing 2
Services’ recorded adjusted costs declined 20 percent from $34.3 million to $27.4 million due to 3
increased efficiencies and streamlining of work functions further discussed below. 4
Figure IV-20 Billing Services
Recorded 2011-2015 / Forecast 2016-2018 FERC Account 903.500
(Constant 2015 $000)
(1) Analysis of Billing Services Variance (Excluding Policy Adjustments) 5
Labor expenses decreased by $5.0 million or 20 percent from $24.7 6
million in 2011 to $19.7 million in 2015. Implementation of ESC significantly reduced Billing 7
operations labor from 2011 through 2013 as a result of further ramping down usage and billing 8
exceptions post ESC deployment. Labor expenses continued to decline in 2014 and 2015 due to 9
continued operational efficiencies such as automating one-step exception processing and streamlining 10
$19,732
$7,810
$28,157

80
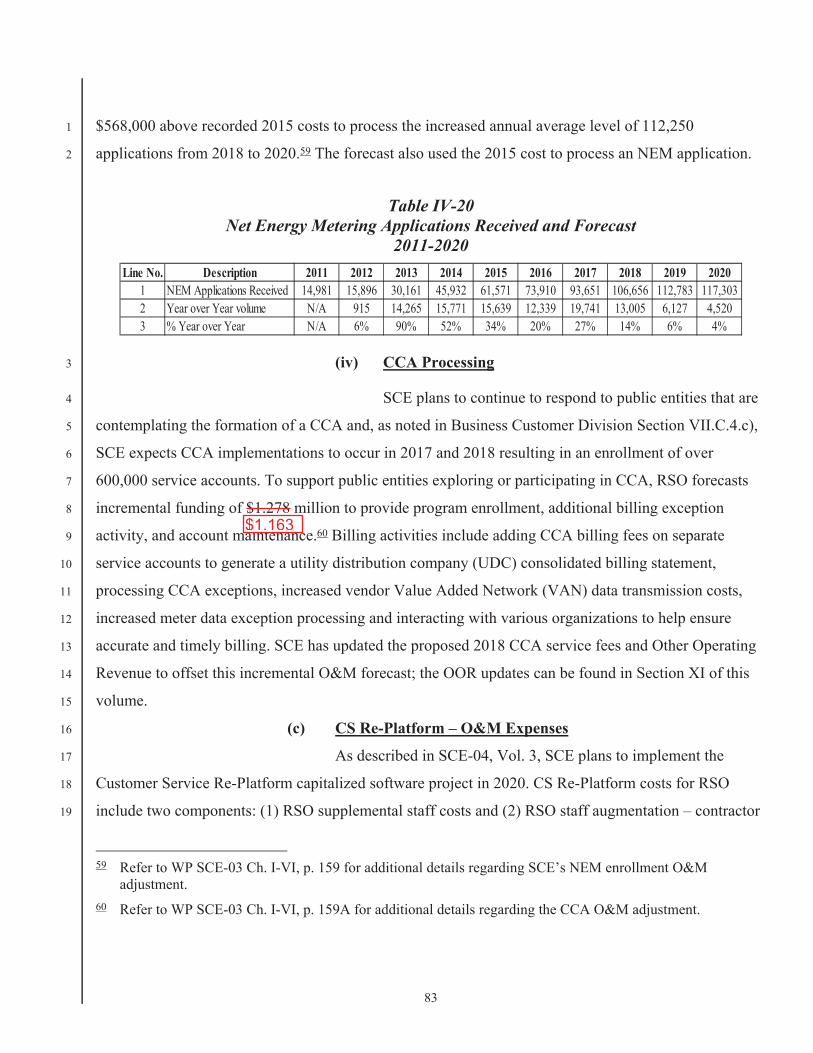
(2) Test Year Adjustments 1
SCE’s forecast of Test Year O&M expenses for Billing reflects increased 2
expenses due to customer growth, program changes, and CS Re-Platform net expenses, offset by 3
reduced expenses associated with Operational Excellence initiatives. These adjustments are described in 4
detail below and summarized in Table IV-19. The resulting O&M forecast is shown in Figure IV-20 and 5
Figure IV-22 illustrates the relative levels of the 2015 Base Year expenses to the 2018 Test Year 6
forecast and the forecast adjustments used to arrive at the forecast cost for SCE’s Billing Services in 7
2018. 8
Table IV-19 Billing Test Year O&M Adjustment Summary
(Constant 2015 $000)
Continued from the previous page CPUC stated that if costs have shown significant fluctuations from year to year, an average of recorded expenses is the appropriate basis for estimating Test Year expenses. For Billing Services, other expenses have varied significantly over the period 2011-2015.
Line No. Description Labor Non-Labor Other Total
1 Customer Growth $453 $166 $6192 Program Changes3 Policy Adjustments ($94) ($94)4 Service Guarantees $249 $2495 Net Energy Metering $154 $414 $5686 CCA Processing $610 $668 $1,2788 CS Re-Platform Expenses $1,900 $933 $2,8339 CS Re-Platform Benefits ($423) ($423)10 Operational Excellence11 Electronic Billing ($1,257) ($1,257)12 Increased Vendor Partnering ($1,594) ($1,594)13 Support Function Reduction ($998) ($330) ($1,328)15 Total Test Year Adjustments $103 $594 $155 $852
$509 $654 $1,163
$580$1 $736
83
$568,000 above recorded 2015 costs to process the increased annual average level of 112,250 1
applications from 2018 to 2020.59 The forecast also used the 2015 cost to process an NEM application. 2
Table IV-20 Net Energy Metering Applications Received and Forecast
2011-2020
(iv) CCA Processing 3
SCE plans to continue to respond to public entities that are 4
contemplating the formation of a CCA and, as noted in Business Customer Division Section VII.C.4.c), 5
SCE expects CCA implementations to occur in 2017 and 2018 resulting in an enrollment of over 6
600,000 service accounts. To support public entities exploring or participating in CCA, RSO forecasts 7
incremental funding of $1.278 million to provide program enrollment, additional billing exception 8
activity, and account maintenance.60 Billing activities include adding CCA billing fees on separate 9
service accounts to generate a utility distribution company (UDC) consolidated billing statement, 10
processing CCA exceptions, increased vendor Value Added Network (VAN) data transmission costs, 11
increased meter data exception processing and interacting with various organizations to help ensure 12
accurate and timely billing. SCE has updated the proposed 2018 CCA service fees and Other Operating 13
Revenue to offset this incremental O&M forecast; the OOR updates can be found in Section XI of this 14
volume. 15
(c) CS Re-Platform – O&M Expenses 16
As described in SCE-04, Vol. 3, SCE plans to implement the 17
Customer Service Re-Platform capitalized software project in 2020. CS Re-Platform costs for RSO 18
include two components: (1) RSO supplemental staff costs and (2) RSO staff augmentation – contractor 19
59 Refer to WP SCE-03 Ch. I-VI, p. 159 for additional details regarding SCE’s NEM enrollment O&M
adjustment. 60 Refer to WP SCE-03 Ch. I-VI, p. 159A for additional details regarding the CCA O&M adjustment.
Line No. Description 2011 2012 2013 2014 2015 2016 2017 2018 2019 20201 NEM Applications Received 14,981 15,896 30,161 45,932 61,571 73,910 93,651 106,656 112,783 117,3032 Year over Year volume N/A 915 14,265 15,771 15,639 12,339 19,741 13,005 6,127 4,5203 % Year over Year N/A 6% 90% 52% 34% 20% 27% 14% 6% 4%
$1,163

86
approved by the Commission. See SCE-03, Vol. 2 for details on the Digital Customer Self-Service 1
project. 2
(ii) Increased Vendor Partnering 3
RSO forecasts savings resulting from partnering with 4
vendors to perform selected work functions. Beginning in 2016, RSO started to transition simple 5
transaction work, with low to medium complexity, to an external vendor. For example, in 2016 vendors 6
will perform Net Energy Metering application processing for accounts smaller than 10 kW, saving 7
$268,000. RSO plans to continue to expand vendor partnering opportunities through 2018, which can 8
maintain service levels and reduce costs for customers. By the 2018 Test Year, RSO forecasts saving 9
$1.594 million in labor costs from partnering with vendors.65 10
(iii) Support Function Reduction 11
RSO plans to reduce Test Year support expenses that 12
record in FERC Account 903.500. The Operational Excellence initiative is forecast to save $1.328 13
million in labor and non-labor by streamlining, prioritizing, and eliminating selected support functions.66 14
(3) Billing Services Forecast Summary 15
As shown below in Figure IV-22, by the 2018 Test Year SCE expects 16
$28.272 million in O&M expenses for FERC Account 903.500, an increase of $0.852 million or three 17
percent as compared to Base Year O&M expenses of $27.420 million. 18
65 Refer to WP SCE-03 Ch. I-VI, p. 163 regarding the Operational Excellence reduction associated with vendor
partnering. 66 Refer to WP SCE-03 Ch. I-VI, p. 164 regarding the Operational Excellence reduction associated with support
function.
$28.157
$0.737

87
Figure IV-22 Billing Services Comparison of 2015 Base Year to 2018 Test Year
FERC Account 903.500 (Constant 2015 $000)
C. Credit and Payment Services [FERC Account 903.200] 1
The Credit and Payment Services function is described in Section IV.C.1 below. The O&M 2
expenses associated with this function are recorded in FERC Account 903.200. The recorded and 3
forecast O&M expenses associated with this function are described in Section IV.C.2 below. 4
1. Credit and Payment Services Functions and Base Year Operating Results 5
Credit and Payment Services consists of credit policy development and enforcement, 6
customer verification, fraud prevention, customer risk assessment, collection activities, and the overall 7
management of credit-related operations to minimize arrearages and uncollectible expense. A primary 8
goal of the Credit group is to mitigate loss of revenue by acquiring adequate security for 9
newly-established and higher-risk existing accounts and to pursue collection of unpaid balances. These 10
processes have been prescribed by the Commission and implemented in accordance with SCE’s 11
established tariffs, Rules 6 and 7 for Credit Services. 12
The Payment Services function is responsible for oversight associated with providing 13
SCE customers with convenient, efficient, and cost-effective payment options. While SCE customers 14
can continue to pay their electric bill through the U.S. mail, they also have seven electronic payment 15
$28,272 ( $423 )
( $4,178 )
$27,420$619
$2,001$2,833
$-
$5,000
$10,000
$15,000
$20,000
$25,000
$30,000
$35,000
2015 Recorded CustomerGrowth
ProgramChanges
CSRe-platform
CSRe-platform
Benefits
OperationalExcellence
2018Forecast
Program ChangesPolicy Adjustments ($94)Service Guarantee $249NEM $568CCA $1,278Total Program Changes $2,001
Operational ExcellenceElectronic Billing ($1,257)Vendor Partnering ($1,594)Support Function ($1,328)Total Program Changes ($4,178)
$1,163
$28,157$1,886
$1,886

104
As of June 2016, over 1.5 million customers, or 33 percent, receive their bills 1
electronically as opposed to mailed. In recent years, mailing costs have been lowered significantly by 2
encouraging customers to convert to electronic billing.89 SCE continues to explore options to encourage 3
customers to receive their bill electronically to reduce postage and other paper-statement-related costs. 4
a) Operating Results for Postage 5
As shown in Table IV-27 below, RSO reduced mailings by 11 percent, from 6
11.23 mailings per customer in 2011 to 10.05 mailings per customer in 2015. This reduction corresponds 7
to the increase in on-line electronic billing transactions that began in 2013 and increased to 2.845 8
million on-line billing electronic transactions in 2015. 9
Table IV-27 Mailings Per Customer
2011-2015 Recorded and 2016-2018 Forecast (In 000s Except For Mailings Per Customer)
The postage rates in effect and a breakdown of recorded mailings by type for each 10
year from 2011-2015 are shown in Table IV-28. Due to its bulk mailing operations, SCE receives 11
postage discounts for six types of mailings: 12
5-Digit Presorted mailings, 13
3-Digit Presorted mailings, 14
89 Customers can elect to have their bills mailed through an electronic means (e.g., e-mail) or mailed through the
United States Postal Service (USPS). In accordance with SCE Tariffs, Rule 1 (Definitions), Customer’s Mailing Address(es): The physical and electronic mailing address specified in a customer’s application or contract, or any other address subsequently given to SCE by the customer, to which any bill, notice, or other communication is to be mailed.
2011 2012 2013 2014 2015 2016 2017 20181 4,929 4,950 4,978 5,005 5,033 5,067 5,105 5,1472 N/A N/A 55,694 56,252 57,514 56,083 62,748 64,3213 N/A N/A 1,856 2,057 2,845 5,135 11,419 12,5694 55,351 53,561 53,176 51,873 50,610 50,948 51,330 51,7515 11.23 10.82 10.68 10.36 10.05 10.05 10.05 10.0567
Note - Mailings include bills, notices and customer correspondence
10.365-Year Average 10.63
Customers Mailings On-line Billing Transactions Mailings less On-line Billing Mailings / Customer3-Year Average
Line No. Topic Recorded Forecast
2,518 6,9044,379
6,904

110
customers served in SCE’s service territory is expected to increase by 2.26 percent from 2015 to 2018. 1
To reflect the cost impact that customer growth will have on the volume of mailings and postage 2
expense and postage-related activities, the 2016-2018 forecast number of customers was used in the 3
postage study.92 4
In April 2016, the USPS reduced postage rates by a weighted 5
average of $0.015 per mailing. The reduced postage rate decreases the Test Year postage expense in 6
FERC Account 903.100 by $570,000.93 This reduction was calculated based on using the April 2016 7
postage rates applied to the recorded 2015 mailing volumes by type of mailing class compared to the 8
2015 postage expense. The 2018 postage expense forecast is based on the current April 2016 USPS 9
postage rates. 10
(b) Operational Excellence 11
SCE forecasts Test Year postage savings of $4.839 million through 12
a customer engagement campaign to automatically enroll SCE ePayment, Direct Pay, and Credit Card 13
customers to electronic billing. These initiatives to increase participation in electronic billing also 14
include several customer promotions to increase customer awareness and participation. For example, the 15
EV Sweepstakes initiative in Line 2 of Table IV-29 refers to a campaign where all SCE customers 16
enrolled in electronic billing will be eligible to win an electric vehicle. This campaign will be promoted 17
on the SCE website, with banner ads, email, and direct mail. The New Initiatives in Line 8 of 18
Table IV-29 refer to efforts by SCE to offer electronic billing at the time of ordering new service or 19
making a credit card payment. 20
The Digital Customer Self-Service capitalized software project, 21
described in testimony at Exhibit SCE-04, Vol. 2, is essential to increase customer enrollment in 22
electronic billing through digital options like mobile-based platforms and “My Account” on SCE.com. 23
The electronic billing program is designed so that customers can easily opt out of electronic billing at 24
any time if they choose. Table IV-29 below shows the forecast number of new Ebilling transactions for 25
92 Refer to WP SCE-03 Ch. I-VI, pp. 219-227 regarding SCE’s postage study. 93 Refer to WP SCE-03 Ch. I-VI, p. 228 for additional details regarding postage expenses and program changes
for FERC Account 903.100.
$0.031

140
meters that were installed in the early portion of the ESC deployment period have now been in service 1
for more than five years. Failed or damaged ESC meters that are five years or older are not expected to 2
qualify for replacement under warranty because the existing meters as a group are not expected to 3
exceed the 0.75 percent contractual failure rate required for warranty repair. 4
The C&I replacement volume forecasts are based on a three-year historical replacement 5
average of 12,543 meters. The Agricultural meter replacement volume shown in 6
Table VI-35 is forecast using the three-year recorded average of 1,787 meters per year. Opt-Out 7
replacements are expected to be driven by opt-out customer turnover, as existing opt-out customers 8
decide to revert back to ESC meters, and as existing ESC-metered customers choose to opt out of their 9
ESC meter. Consistent with the plan adopted by the Commission in D.15-11-021, SCE will replace a 10
total of 702 of these meters with ESC meters starting in 2017 and ending in 2020. The RTEM 11
replacement meter expenditure forecast is based on the three-year replacement average from 2013 12
through 2015, which represents steady-state operations. 13
Based on customer growth and SCE’s past experience of customers moving into and out 14
of the Opt-Out Program, SCE forecasts the need for 50 electromechanical meters per year for 2016 15
through 2020 based on the last two-year average. We did not include 2013 in the estimate because it was 16
the first year after ESC deployment, when customers questioned the new technology and chose to opt-17
out at a higher rate. 18
3. Historical Expenditures 19
The historical and forecast metering equipment capital expenditures are shown in Table 20
VI-36 and forecast requirements are discussed more fully in the following sections. 21
Table VI-36 Metering Equipment
Recorded 2011 – 2015 and Forecast 2016-2020 (Nominal $ millions)
Metering capital expenditures averaged $12.0 million from 2013 through 2015. These 22
meter volumes and expenditures do not include the nearly five million ESC meters installed through 23
2012, the cost of which was recovered through the ESCBA. Because approximately 120,000 meters 24
2011 2012 2013 2014 2015 2016 2017 2018 2019 20201 Metering Equipment $ 7.723 $ 6.832 $ 12.665 $ 9.775 $ 13.642 $ 21.058 $ 25.337 $ 36.264 $ 38.342 $ 42.393
Line No. Class of Plant Recorded Forecast
$13,131

144
The variance is primarily due to SCE deferring the replacement of PCAN meters to 2017. This was 1
necessary to shift resources to ESC-related priorities. In addition, in 2015, costs to replace meters that 2
were covered under warranty were charged to O&M rather than capital. Finally, SCE deferred the 3
purchase of specialized tool kits, and thus spent less than forecast in 2015. 4
Figure VI-34 Comparison of 2015 Authorized and 2015 Recorded CSOD Capital
Expenditures ($000)
Line No. Capital Category 2015 Requested
(A)
2015 Authorized
(B)
2015 Recorded(C)
Authorized vs. Recorded
(C-B)
1 Structures and Improvements $28,766 $16,298 13,642 ($2,656)
2 Specialized Equipment $215 $215 74 ($142)
3 Total CSOD Capital $28,981 $16,513 $13,716 ($2,798)
($2,656) ($142)
$28,981
$16,513 $13,998
0
5,000
10,000
15,000
20,000
25,000
30,000
35,000
2015Request
2015Authorized
Meters Variance SpecializedEquipmentVariance
2015 Recorded
Meters Specialized Equipment
Meters 13,131
$13,205
($3,167)
($3,308)
($3,167)
$13,205

163
Figure VII-35 Business Customer Division
Recorded and Adjusted 2011-2015/Forecast 2016-2018 (Constant 2015 $000)
1. Analysis of Recorded BCD O&M Expenses 1
As shown in Figure VII-35, total recorded adjusted O&M expenses for FERC Account 2
908.600 have declined from $24.324 million in 2011 to $20.840 million in 2015, a reduction of over 14 3
percent. From 2011 through 2013, BCD labor expenses declined following after we implemented a 4
number of productivity measures, including consolidating Account Management support activities, 5
eliminating vacancies, and the voluntary departure of a number of employees. In 2014 and 2015, BCD 6
succeeded in filling a number of key vacancies. That, combined with an increase in O&M-funded 7
activities, such as increased support of infrastructure and reliability efforts, increased customer requests 8
for information regarding the impacts of regulatory, legislative and tariff changes, led to an increase in 9
labor expenses in 2014 and 2015 of $1.032 million and $983,000, respectively. 10
The Operational Excellence measures implemented in 2012 included a number of 11
activities that reduced non-labor expenses, including, for example, reducing employee meeting and 12
travel expenses by increasing the use of audio and video conferencing, and using web-enabled meetings. 13
15,427
3,093
18,520
167
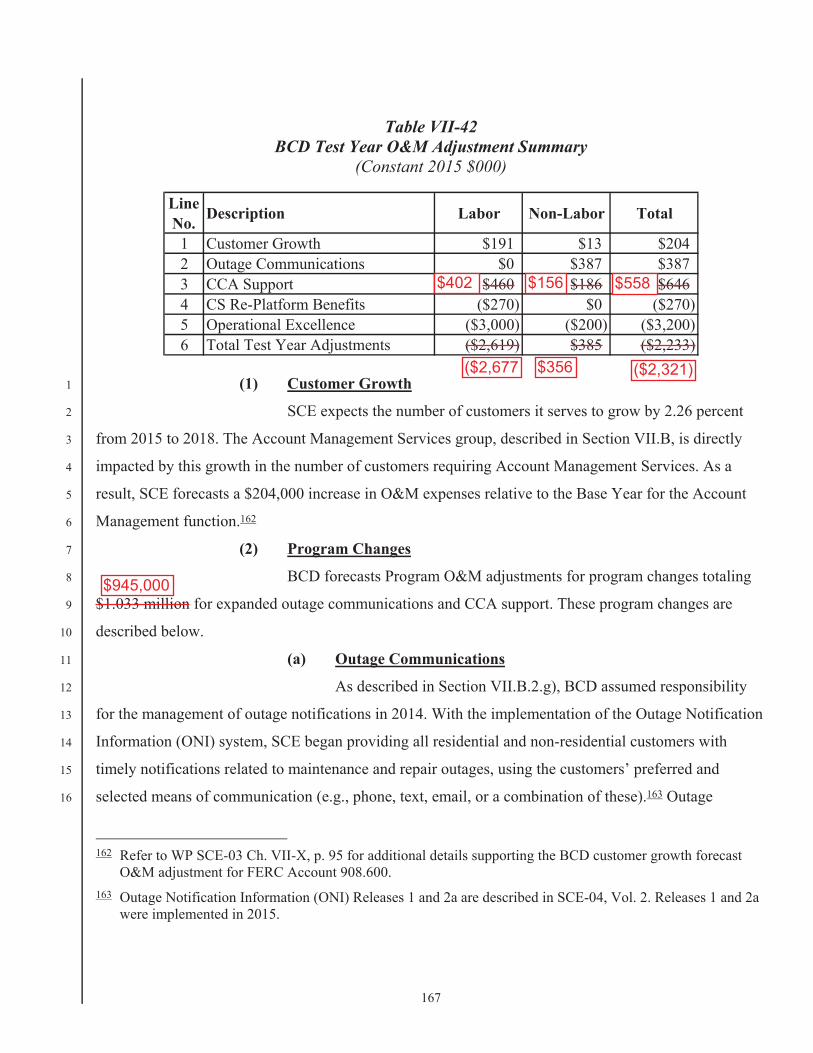
Table VII-42 BCD Test Year O&M Adjustment Summary
(Constant 2015 $000)
(1) Customer Growth 1
SCE expects the number of customers it serves to grow by 2.26 percent 2
from 2015 to 2018. The Account Management Services group, described in Section VII.B, is directly 3
impacted by this growth in the number of customers requiring Account Management Services. As a 4
result, SCE forecasts a $204,000 increase in O&M expenses relative to the Base Year for the Account 5
Management function.162 6
(2) Program Changes 7
BCD forecasts Program O&M adjustments for program changes totaling 8
$1.033 million for expanded outage communications and CCA support. These program changes are 9
described below. 10
(a) Outage Communications 11
As described in Section VII.B.2.g), BCD assumed responsibility 12
for the management of outage notifications in 2014. With the implementation of the Outage Notification 13
Information (ONI) system, SCE began providing all residential and non-residential customers with 14
timely notifications related to maintenance and repair outages, using the customers’ preferred and 15
selected means of communication (e.g., phone, text, email, or a combination of these).163 Outage 16
162 Refer to WP SCE-03 Ch. VII-X, p. 95 for additional details supporting the BCD customer growth forecast
O&M adjustment for FERC Account 908.600. 163 Outage Notification Information (ONI) Releases 1 and 2a are described in SCE-04, Vol. 2. Releases 1 and 2a
were implemented in 2015.
Line No. Description Labor Non-Labor Total
1 Customer Growth $191 $13 $2042 Outage Communications $0 $387 $3873 CCA Support $460 $186 $6464 CS Re-Platform Benefits ($270) $0 ($270)5 Operational Excellence ($3,000) ($200) ($3,200)6 Total Test Year Adjustments ($2,619) $385 ($2,233)
$402 $156 $558
($2,677 $356 ($2,321)
$945,000

169
compared to a single CCA with approximately 50,000 service accounts in the Base Year.165 As 1
described in Section VII.C.4 above, BCD’s Customer Choice Services (CCS) group maintains a single 2
point of contact with CCAs, responds to information requests, and resolves service-related issues. To 3
accommodate this growth in CCA activity, SCE plans to increase staffing in BCD’s CCS group by three 4
FTEs above Base Year levels, which will increase labor expenses by $460,000 and non-labor O&M 5
expenses by $23,000 in the Test Year.166 In addition, BCD forecasts $162,000 in non-labor expenses to 6
perform some of the activities included in SCE’s CCA-related OOR forecast.167 Combined, SCE 7
forecasts $646,000 in incremental O&M expenses in the Test Year to support CCA activity.168 8
(3) CS Re-Platform Benefits 9
As described in SCE-04, Vol. 3, the CS Re-Platform program will 10
eliminate the inefficiencies associated with obsolete and disparate applications and systems through 11
implementation of a simplified, modern, integrated suite of Customer Service applications. The 12
transition to a modern digital environment will increase SCE employee productivity and lower costs to 13
provide service. As a result, SCE forecasts a $270,000 Test Year reduction in BCD O&M expenses.169 14
(4) Operational Excellence 15
In late 2015, BCD increased productivity and reduced O&M by refining 16
the assignment of Account Management resources and increasing self-service options available to 17
customers. BCD also consolidated and streamlined its account management support function, and 18
165 Lancaster Choice Energy, the first CCA in SCE’s service territory, began serving customers in 2015. 166 The $483,000 Test Year increase includes $460,000 in labor expenses and $23,000 in labor-related non-labor
expenses. 167 Costs associated with performing these OOR-related activities are recovered through SCE’s CCA OOR fees.
Furthermore, if CCA growth exceeds SCE’s current forecast of the number of CCAs formed and service accounts impacted, SCE expects that OOR achieved through CCA service charges will be adequate to cover any incremental costs above those included here.
168 Refer to WP SCE-03 Ch. VII-X, pp. 97-99 for additional details supporting the CCA Support Activities O&M forecast adjustment to FERC Account 908.600.
169 The CS Re-Platform benefits included in SCE’s 2018 Test Year forecast are proposed, contingent upon approval of the corresponding CS Re-Platform project costs. Should the Commission not adopt the proposed CS Re-Platform costs in this FERC activity, the corresponding benefits must also be removed from the Test Year forecast. Refer to WP SCE-03 Ch. VII-X, p. 100 regarding the expected benefits for the CS Re-Platform project.
$20,000
$402,000
$558,000
168 Refer to WP SCE-03 Ch. VII-X, pp. 97-99 for additional details supporting the CCA Support Activities O&M , ppforecast adjustment to FERC Account 908.600.
$422,000 $402,000 $20,000
$135,000

170
combined the EDS group with the Account Management group. As a result, SCE forecasts reducing 1
BCD labor expenses by $3.6 million and non-labor expenses by $200,000. Of this amount, BCD 2
reduced labor expenses an estimated $600,000 in 2015, which is reflected in the Base Year recorded 3
adjusted amount. The remaining $3.2 million reduction is reflected in BCD’s Test Year O&M expense 4
forecast.170 5
c) Test Year Forecast Summary 6
As shown below in Figure VII-37, SCE forecasts $18.607 million in O&M 7
expenses for FERC Account 908.600, a reduction of $2.233 million—or eleven percent—compared to 8
Base Year O&M expenses of $20.840 million. 9
Figure VII-37 Business Customer Division
Comparison of 2015 Base Year and 2018 Test Year FERC Account 908.600
(Constant 2015 $000)
170 Refer to WP SCE-03 Ch. VII-X, p. 101 for additional details supporting the BCD Operational Excellence
O&M Forecast adjustment to FERC Account 908.600.
$20,840 $204$1,033
($270)
($3,200)
$18,607
$0
$5,000
$10,000
$15,000
$20,000
$25,000
2015 Recorded CustomerGrowth
ProgramChanges
CS Re-PlatformBenefits
OperationalExcellence
2018 Forecast
Program ChangesCCA Support $645Outage Communications 387Total Program Changes $1,033
$18.520
$2.320
$945
$18,520
$558
$945
221
XI. 1
OTHER OPERATING REVENUES (OOR) 2
A. Introduction 3
Customer Service evaluated the fees to charge individual customers and third parties who receive 4
services that cause SCE to incur additional operational expenses. These services are above the standard 5
operational services provided by SCE. As such, SCE cannot fund these activities through general rates 6
and must charge separately for these services. The revenue received for these services is accounted for 7
as Other Operating Revenue (OOR). These services include service connection charges (fees) for 8
establishing service and reconnecting service following disconnection for nonpayment of bills, returned 9
check charges to offset costs associated with processing checks that are returned from the bank due to 10
insufficient funds, and other services associated with Direct Access (DA), Community Choice 11
Aggregation (CCA), and other special services. 12
Revenue derived from these activities is recorded in FERC Accounts 450, 451, and 456. This 13
chapter describes the functional subaccounts associated with the FERC Revenue Accounts and the 14
analyses and estimating methods used to forecast SCE’s 2018 Test Year OOR. 15
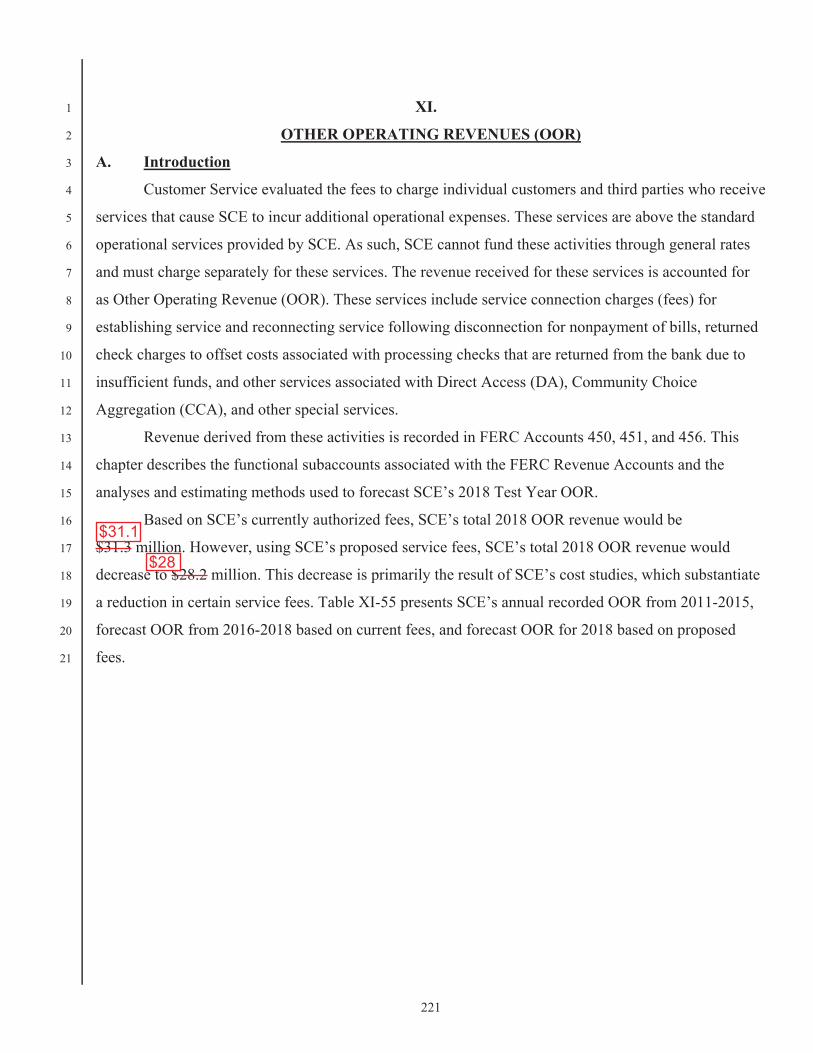
Based on SCE’s currently authorized fees, SCE’s total 2018 OOR revenue would be 16
$31.3 million. However, using SCE’s proposed service fees, SCE’s total 2018 OOR revenue would 17
decrease to $28.2 million. This decrease is primarily the result of SCE’s cost studies, which substantiate 18
a reduction in certain service fees. Table XI-55 presents SCE’s annual recorded OOR from 2011-2015, 19
forecast OOR from 2016-2018 based on current fees, and forecast OOR for 2018 based on proposed 20
fees. 21
$31.1
$28

222
Table XI-55 Other Operating Revenue – Customer Service
Recorded 2011 – 2015 and Forecast 2016 – 2018 (Nominal $000)
B. Forecast Method for OOR 1
To forecast the 2018 Test Year revenues associated with the proposed fee-based OOR activities, 2
SCE: 3
identified the processes and activities associated with each existing service fee; 4
identified the costs associated with each activity of the individual service fees, including 5
updating the service fee cost studies, data analytics, wage rates, and labor loadings; 6
reviewed the historical record of activity levels and actual revenue collected from these 7
activities over the last five years (where applicable); and 8
Proposed
2011 2012 2013 2014 2015 2016 2017 2018 20181 450.100 Late Payment Charge – Non-Residential $6,173 $6,262 $6,230 $6,638 $6,592 $5,805 $5,886 $5,870 $5,779
2 450.150 Late Payment Charge – Residential $10,079 $10,849 $9,891 $10,337 $11,086 $9,340 $9,511 $9,602 $9,452
3 451.110 Returned Check Charge $1,442 $1,623 $1,575 $1,600 $1,510 $1,374 $1,384 $1,396 $1,396
4 451.200 Reconnection Charge (eliminated in 2013) $6,133 $4,862 $0 $0 $0 $0 $0 $0 $0
5 451.250 Service Establishment Charge (eliminated in 2013) $15,838 $15,794 $0 $0 $0 $0 $0 $0 $0
6 451.300 Connection Charge – Residential $0 $0 $7,322 $6,806 $6,784 $6,962 $7,014 $7,071 $7,071
7 451.310 Connection Charge – Non-Residential $0 $0 $3,515 $3,256 $3,312 $1,676 $1,689 $1,703 $2,043
8 451.320 Connection Charge – At Pole $0 $0 $15 $16 $14 $22 $22 $22 $28
9 451.600 Field Assignment Charge (eliminated in 2013) $6,882 $3,154 $0 $0 $0 $0 $0 $0 $0
10 451.780 Misc. Revenue – Recovery Unauthorized Use Non-Energy $246 $205 $157 $138 $103 $103 $103 $103 $103
11 451.820 Opt-Out CARE – Initial $0 $50 $15 $4 $3 $2 $2 $2 $2
12 451.820 Opt-Out NON-CARE – Initial $0 $1,114 $314 $91 $86 $53 $51 $51 $51
13 451.820 Opt-Out CARE – Monthly $0 $101 $316 $322 $243 $66 $38 $29 $29
14 451.820 Opt-Out NON-CARE – Monthly $0 $662 $1,916 $2,090 $1,647 $432 $321 $269 $269
15 456.401 Direct Access Services $492 $484 $294 $283 $283 $285 $287 $289 $111
16 456.948 Service Fee – Optimal Billing Period $1 $0 $0 $0 $0 $0 $0 $0 $0
17 456.412 Community Choice Aggregation $4 $4 $2 $1 $30 $761 $2,001 $4,357 $1,299
18 456.415 Manufactured Home Billing Service $1 $2 $2 $2 $3 $3 $3 $3 $3
19 456.945 SCE Energy Manager $521 $517 $136 $162 $145 $139 $133 $127 $127
20 456.924 Energy Related Services (ERS) $224 $471 $367 $339 $414 $414 $414 $414 $414
21 TOTAL CS OOR $48,036 $46,154 $32,066 $32,085 $32,255 $27,437 $28,858 $31,309 $28,177
Recorded Operating Revenue Forecast (Currently Authorized Fees)Account NameFERC
AccountLine No.

222
Table XI-55 Other Operating Revenue – Customer Service
Recorded 2011 – 2015 and Forecast 2016 – 2018 (Nominal $000)
B. Forecast Method for OOR 1
To forecast the 2018 Test Year revenues associated with the proposed fee-based OOR activities, 2
SCE: 3
identified the processes and activities associated with each existing service fee; 4
identified the costs associated with each activity of the individual service fees, including 5
updating the service fee cost studies, data analytics, wage rates, and labor loadings; 6
reviewed the historical record of activity levels and actual revenue collected from these 7
activities over the last five years (where applicable); and 8
Proposed
2011 2012 2013 2014 2015 2016 2017 2018 2018
1 450.100 Late Payment Charge – Non-Residential $6,173 $6,262 $6,230 $6,638 $6,592 $5,805 $5,886 $5,870 $5,779
2 450.150 Late Payment Charge – Residential $10,079 $10,849 $9,891 $10,337 $11,086 $9,340 $9,511 $9,602 $9,452
3 451.110 Returned Check Charge $1,442 $1,623 $1,575 $1,600 $1,510 $1,374 $1,384 $1,396 $1,396
4 451.200 Reconnection Charge (eliminated in 2013) $6,133 $4,862 $0 $0 $0 $0 $0 $0 $0
5 451.250 Service Establishment Charge (eliminated in 2013) $15,838 $15,794 $0 $0 $0 $0 $0 $0 $0
6 451.300 Connection Charge – Residential $0 $0 $7,322 $6,806 $6,784 $6,962 $7,014 $7,071 $7,071
7 451.310 Connection Charge – Non-Residential $0 $0 $3,515 $3,256 $3,312 $1,676 $1,689 $1,703 $2,043
8 451.320 Connection Charge – At Pole $0 $0 $15 $16 $14 $22 $22 $22 $28
9 451.600 Field Assignment Charge (eliminated in 2013) $6,882 $3,154 $0 $0 $0 $0 $0 $0 $0
10 451.780 Misc. Revenue – Recovery Unauthorized Use Non-Energy $246 $205 $157 $138 $103 $103 $103 $103 $103
11 451.820 Opt-Out CARE – Initial $0 $50 $15 $4 $3 $2 $2 $2 $212 451.820 Opt-Out NON-CARE – Initial $0 $1,114 $314 $91 $86 $53 $51 $51 $5113 451.820 Opt-Out CARE – Monthly $0 $101 $316 $322 $243 $70 $36 $18 $1814 451.820 Opt-Out NON-CARE – Monthly $0 $662 $1,916 $2,090 $1,647 $423 $217 $108 $10815 456.401 Direct Access Services $492 $484 $294 $283 $283 $285 $287 $289 $111
16 456.948 Service Fee – Optimal Billing Period $1 $0 $0 $0 $0 $0 $0 $0 $0
17 456.412 Community Choice Aggregation $4 $4 $2 $1 $30 $761 $2,001 $4,357 $1,27518 456.415 Manufactured Home Billing Service $1 $2 $2 $2 $3 $3 $3 $3 $319 456.945 SCE Energy Manager $521 $517 $136 $162 $145 $139 $133 $127 $12720 456.924 Energy Related Services (ERS) $224 $471 $367 $339 $414 $414 $414 $414 $41421 TOTAL CS OOR $48,036 $46,154 $32,066 $32,085 $32,255 $27,433 $28,753 $31,137 $27,981
Recorded Operating Revenue Forecast (Currently Authorized Fees)Account NameFERC
AccountLine No.
222A

230
continue charging the opt-out fees, but only for the first three years after a customer opts out of the smart 1
meter program.238 SCE does not propose to change the fees authorized in D.14-12-078. 2
Table XI-58 provides SCE’s annual revenue recorded from 2012 through 2015 for this 3
fee. SCE forecasts a decrease in the Opt-Out Program service fee revenues from $1.979 million in 2015 4
to $351,000 in 2018. SCE forecasts a significant decrease in Opt-Out OOR over this period because the 5
majority of Opt-Out customers will reach the end of their three-year fee period.239 As shown in Table 6
XI-58 below, the forecast volumes and revenues for the Opt-Out program decline significantly from 7
2016 to 2018. 8
Table XI-58 FERC Account 451.820
Opt-Out Forecast Volume and Revenue (Nominal $000)
D. Non-Residential Service Charges 9
SCE proposes to decrease the Non-Residential Late Payment Charge from 0.8 percent to 0.7 10
percent of the customer’s account balance, and proposes to increase the Non-Residential Service 11
Connection Charge to reflect an increase based on the 2015 weighted average of manual and RSS 12
238 See D.14-12-078. 239 Refer to WP SCE-03 Ch. XI, pp. 28-40 for additional details regarding the Edison SmartConnect Opt-Out
Forecast by Organization and Activity.
Recorded Forecast
2011* 2012 2013 2014 2015 2016 2017 2018 2018At 2015 GRC At 2018 GRCCurrent Fees Proposed Fees
Initial Fee – Annual VolumeTotal N/A 19,897 5,702 1,622 1,444 948 900 900
CARE (25%) 5,040 1,522 403 304 237 225 225 Non-CARE (75%) 14,857 4,180 1,219 1,140 711 675 675
Monthly Fee – Annual VolumeTotal N/A 86,328 254,725 273,381 213,306 56,381 28,981 14,429
CARE (25%) 20129 63,172 64,426 48,564 14,095 7,245 3,607 Non-CARE (75%) 66199 191,553 208,955 164,742 42,286 21,736 10,822
Revenue ($000s)Initial Fee – CARE $50 $15 $4 $3 $2 $2 $2 $2 Initial Fee – Non-CARE $1,114 $314 $91 $86 $53 $51 $51 $51 Monthly Fee – CARE $101 $316 $322 $243 $70 $36 $18 $18 Monthly Fee – Non-CARE $662 $1,916 $2,090 $1,647 $423 $217 $108 $108 Total ($000s) N/A $1,927 $2,560 $2,507 $1,979 $549 $306 $179 $179
* Program started in 2012
$179,000

247
Table XI-65 DA Service Fees – Proposed for Elimination
FERC 456.401 (Nominal $)
(5) Direct Access Service Fees - Consolidated into Other Fees 1
SCE proposes to eliminate fees that can be consolidated with other 2
existing fees. As shown in Table XI-66, SCE proposes to eliminate two fees and consolidate those 3
Line No. Fee Description Current
FeesProposed
Fees* Reason for Elimination
1 Separate Mailing Charge 0.46$ ELM2 Refund account credits due to overpayment EDI Charge 6.25$ ELM3 Basic I 149.00$ ELM4 Basic I with Pulse Output 328.00$ ELM5 Basic I with Modem 359.00$ ELM6 Basic I with Pulse Output & Modem 402.00$ ELM7 Advanced I 178.00$ ELM8 Advanced I with Pulse Output 286.00$ ELM9 Advanced I with Modem 437.00$ ELM
10 Advanced I with Pulse Output & Modem 437.00$ ELM11 Meter Installation IDR 260.00$ ELM12 Meter Installation IDR with Pulse Output 338.00$ ELM13 Meter Installation IDR with Modem 348.00$ ELM14 Meter Installation IDR with Pulse Output & Modem 402.00$ ELM15 Basic I Maintenance Charges Billing Meter - IDR 1.20$ ELM16 Basic I Maintenance Charges Billing Meter- IDR Billing Meter with Pulse Output 1.40$ ELM17 Basic I Maintenance Charges Billing Meter - IDR with Modem 2.30$ ELM18 Basic I Maintenance Charges Billing Meter - IDR with Pulse Output & Modem 2.60$ ELM19 Advanced I Maintenance Charges Billing Meter - IDR 1.40$ ELM20 Advanced I Maintenance Charges Billing Meter - IDR with Pulse Output 1.90$ ELM21 Advanced I Maintenance Charges Billing Meter - IDR with Modem 2.80$ ELM22 Advanced I Maintenance Charges Billing Meter - IDR with Pulse Output & Modem 2.80$ ELM23 Basic I Maintenance Charges Non-Billing Meter - IDR 1.20$ ELM24 Basic I Maintenance Charges Non-Billing Meter- IDR Billing Meter with Pulse Output 1.40$ ELM25 Basic I Maintenance Charges Non-Billing Meter - IDR with Modem 2.30$ ELM26 Basic I Maintenance Charges Non-Billing Meter - IDR with Pulse Output & Modem 2.60$ ELM27 Advanced I Maintenance Charges Non-Billing Meter - IDR 1.40$ ELM28 Advanced I Maintenance Charges Non-Billing Meter - IDR with Pulse Output 1.90$ ELM29 Advanced I Maintenance Charges Non-Billing Meter - IDR with Modem 2.80$ ELM30 Advanced I Maintenance Charges Non-Billing Meter - IDR with Pulse Output & Modem 2.80$ ELM31 Meter Removal Charge 134.00$ ELM32 Meter Replacement Charges with Standard SCE IDR Meter 257.00$ ELM33 Meter Replacement Charges with Standard SCE Demand Meter 207.00$ ELM34 Daily Check for Payment Charge 73.80$ ELM35 Hourly Rate to Assist ESPs with Rates and Systems 106.00$ ELM36 Retrieval of Account Information Charge 6.25$ ELM37 Routine Account Analysis Charge 12.50$ ELM38 Complex Account Analysis Charge 56.30$ ELM39 Resend File/Report Charge 18.80$ ELM

247
Table XI-65 DA Service Fees – Proposed for Elimination
FERC 456.401 (Nominal $)
(5) Direct Access Service Fees - Consolidated into Other Fees 1
SCE proposes to eliminate fees that can be consolidated with other 2
existing fees. As shown in Table XI-66, SCE proposes to eliminate two fees and consolidate those 3
Line No. Fee Description
Current Fees
Proposed Fees* Reason for Elimination
1 Separate Mailing Charge 0.46$ ELM Automated2 Refund account credits due to overpayment EDI Charge 6.25$ ELM Automated3 Consolidated SCE Billing - Standard Bill by Mail Charge 0.23$ ELM Automated4 Consolidated SCE Billing - Bill by Internet Charge 0.11$ ELM Automated5 Basic I 149.00$ ELM Obsolete due to ESC Meters6 Basic I with Pulse Output 328.00$ ELM Obsolete due to ESC Meters7 Basic I with Modem 359.00$ ELM Obsolete due to ESC Meters8 Basic I with Pulse Output & Modem 402.00$ ELM Obsolete due to ESC Meters9 Advanced I 178.00$ ELM Obsolete due to ESC Meters
10 Advanced I with Pulse Output 286.00$ ELM Obsolete due to ESC Meters11 Advanced I with Modem 437.00$ ELM Obsolete due to ESC Meters12 Advanced I with Pulse Output & Modem 437.00$ ELM Obsolete due to ESC Meters13 Meter Installation IDR 260.00$ ELM Obsolete due to ESC Meters14 Meter Installation IDR with Pulse Output 338.00$ ELM Obsolete due to ESC Meters15 Meter Installation IDR with Modem 348.00$ ELM Obsolete due to ESC Meters16 Meter Installation IDR with Pulse Output & Modem 402.00$ ELM Obsolete due to ESC Meters17 Basic I Maintenance Charges Billing Meter - IDR 1.20$ ELM Obsolete due to ESC Meters18 Basic I Maintenance Charges Billing Meter- IDR Billing Meter with Pulse Output 1.40$ ELM Obsolete due to ESC Meters19 Basic I Maintenance Charges Billing Meter - IDR with Modem 2.30$ ELM Obsolete due to ESC Meters20 Basic I Maintenance Charges Billing Meter - IDR with Pulse Output & Modem 2.60$ ELM Obsolete due to ESC Meters21 Advanced I Maintenance Charges Billing Meter - IDR 1.40$ ELM Obsolete due to ESC Meters22 Advanced I Maintenance Charges Billing Meter - IDR with Pulse Output 1.90$ ELM Obsolete due to ESC Meters23 Advanced I Maintenance Charges Billing Meter - IDR with Modem 2.80$ ELM Obsolete due to ESC Meters24 Advanced I Maintenance Charges Billing Meter - IDR with Pulse Output & Modem 2.80$ ELM Obsolete due to ESC Meters25 Basic I Maintenance Charges Non-Billing Meter - IDR 1.20$ ELM Obsolete due to ESC Meters26 Basic I Maintenance Charges Non-Billing Meter- IDR Billing Meter with Pulse Output 1.40$ ELM Obsolete due to ESC Meters27 Basic I Maintenance Charges Non-Billing Meter - IDR with Modem 2.30$ ELM Obsolete due to ESC Meters28 Basic I Maintenance Charges Non-Billing Meter - IDR with Pulse Output & Modem 2.60$ ELM Obsolete due to ESC Meters29 Advanced I Maintenance Charges Non-Billing Meter - IDR 1.40$ ELM Obsolete due to ESC Meters30 Advanced I Maintenance Charges Non-Billing Meter - IDR with Pulse Output 1.90$ ELM Obsolete due to ESC Meters31 Advanced I Maintenance Charges Non-Billing Meter - IDR with Modem 2.80$ ELM Obsolete due to ESC Meters32 Advanced I Maintenance Charges Non-Billing Meter - IDR with Pulse Output & Modem 2.80$ ELM Obsolete due to ESC Meters33 Meter Removal Charge 134.00$ ELM Obsolete due to ESC Meters34 Meter Replacement Charges with Standard SCE IDR Meter 257.00$ ELM Obsolete due to ESC Meters35 Meter Replacement Charges with Standard SCE Demand Meter 207.00$ ELM Obsolete due to ESC Meters36 Daily Check for Payment Charge 73.80$ ELM Obsolete Fees37 Hourly Rate to Assist ESPs with Rates and Systems 106.00$ ELM Obsolete Fees38 Retrieval of Account Information Charge 6.25$ ELM Obsolete Fees39 Routine Account Analysis Charge 12.50$ ELM Obsolete Fees40 Complex Account Analysis Charge 56.30$ ELM Obsolete Fees41 Resend File/Report Charge 18.80$ ELM Obsolete Fees
* ELM = Eliminate
247A

248
charges under the Meter Data Posting Fee and eliminate four fees and consolidate those charges into the 1
EDI VAN Charge. 2
Table XI-66 DA Service Fees – Eliminated due to Consolidation
(Nominal $)
2. Direct Access Service Fees – Forecast OOR 3
Table XI-67 below presents the DA services and the revenues forecast by service fee. 4
Table XI-67 DA Service Fee Revenues
FERC 456.401 (Nominal $s)
In 2018, revenues from DA service fees are forecast to decrease to $111,000, from 5
$283,000 in 2015. The decrease is attributed to (1) decreased DA transaction volumes, (2) expected 6
LineNo.
Fee Description Current Fees
Proposed Fees*
Fee Incorporated Under
1 Consolidated SCE Billing - Standard Bill by Mail Charge 0.23$ ELM Meter Posting Fee2 Consolidated SCE Billing - Bill by Internet Charge 0.11$ ELM Meter Posting Fee3 Value Added Network (VAN) Transmission of Data 0.15$ ELM EDI VAN Charge4 Electronic Data Interchange (EDI) Bank Processing 2.25$ ELM EDI VAN Charge5 Electronic Data Interchange (EDI) Value Added Network (VAN) 2.75$ ELM EDI VAN Charge6 Investigate EDI Payment Charge 106.00$ ELM EDI VAN Charge
* ELM = Eliminate
Line No. Direct Access Services Proposed
FeeForecasted
Volume
Forecasted 2018 OOR
($000s)1 Consolidated SCE Billing - Additional Page Charge $7.00 1,200 8$ 2 EDI VAN Charge $0.09 352,167 32$ 3 Meter Data Posting $0.06 352,167 22$ 4 Testing Charge: IDR Meter $201 0 -$ 5 Engineering Estimate or Job Design $54 19 1$ 6 Incomplete Trip Charge $104 1 0$ 7 Pulse Adapter Equipment and Installation Charge $323 98 32$ 8 ESC Meter with Pulse Output Fee $460 16 7$ 9 Meter Replacement Service Fee $241 36 9$
10 Involuntary Billing Change Charge $8 0 -$ 11 Repost of Data Usage Files Fee $42 4 0$ 12 111$

254
activities. SCE’s review of its activities resulted in multiple process improvements, which streamlined 1
and automated various functional activities, as well as the identification of reduced actual processing 2
times compared to estimated processing times. One such service fee required considerable manual labor 3
to process and originally took about four hours to complete one report. The process has since been fully 4
automated and now takes approximately one minute to produce the report. Due to automation, SCE 5
proposes this report be provided at no charge. The Edison SmartConnect Program also provided 6
operational efficiencies, such as a metering communication system that eliminated the need for 7
CCA-related customer site visits for mass enrollments and voluntary terminations. As a result of SCE’s 8
operational efficiency efforts, SCE proposes reducing the applicable components in SCE’s proposed 9
service fees. 10
(b) Material Costs 11
As described previously, SCE performed a function-by-function 12
cost study that focused on labor and non-labor costs. As part of this study, SCE evaluated its material 13
costs for such items as telecommunication costs, automated printing, stationery, envelopes and postage. 14
Costs for these items have been updated, and will result in decreases and increases to the applicable cost 15
components of SCE’s proposed service fees. 16
SCE performed a function-by-function cost study that focused on 17
labor and non-labor costs. As part of this study, SCE evaluated its material costs for items such as 18
automated printing, stationery, envelopes, and postage. Costs for these items have been updated and, as 19
a result, SCE proposes to increase the Consolidated SCE Billing – Additional Page Charge fee but also 20
increase the page allowance. Currently, SCE bills CCA service accounts $0.08 for additional pages that 21
exceed four pages. As a result of its cost study, SCE determined that SCE does not incur additional costs 22
per statement until after seven pages. As a result, SCE proposes to charge time and material costs for bill 23
statements that are between seven and 73 pages and a $7.00 fee for statements that exceed 73 pages to 24
recoup the extra postage and special packaging needed to accommodate the additional pages. This fee is 25
necessary to recover SCE’s costs from the appropriate CCA. SCE expects that this change will only 26
apply to 3.4 percent of statements requested. 27
(c) Increased Labor Costs 28
SCE’s aforementioned cost study evaluated activities, actual time 29
(measured in minutes and hours), and job classifications required to perform individual activities related 30
to its service fees. The processing time for many activities decreased, but activities previously not 31

255
identified and job classifications for certain activities did increase. As a result of these factors, SCE 1
proposes to increase the applicable labor cost components included in certain CCA service fees. 2
(d) Proposed Fee Structure Change 3
SCE proposes that two CCA service fees be revised to time and 4
materials based fees and such costs will be directly billed to the appropriate CCA. These services are 5
unique and can vary by customer, and are thus appropriately billed on a time and material basis. 6
Table XI-69 CCA Service Fees – Fees Proposed to be Updated
FERC 456.412 (Nominal $s)
Line No. Fee Description Current
FeesProposed
Fees* Reason for Change
1 Additional Metering Related Services - Acceptance Testing of Customer-owned Meter 53.00$ T&M Fee Structure Change2 Additional Metering Related Services - Engineering Estimate or Job Design 43.00$ 54.00$ Labor Increases3 Additional Metering Related Services - Incomplete Trip Fee 100.00$ 104.00$ Labor Increases4 Additional Metering Related Services - Pulse Adapter Equipment and Installation Charge 274.00$ 323.00$ Labor Increases5 Additional Metering Related Services - Third Party Un-Returned Meter Penalty Charge Replace cost
of meter T&M Fee Structure Change
6 CCA Establishment - CCA Credit Establishment Fee 174.00$ 24.00$ Operational Efficiencies7 CCA Establishment - CCA Service Establishment 606.01$ 517.00$ Operational Efficiencies8 CCA Non-Energy Billing Receivable Fee 9.00$ 8.00$ Operational Efficiencies9 CCA Termination of Service - Voluntary Termination Fee - Per Event 3,041.00$ 152.00$ Operational Efficiencies
10 CCA Termination of Service - Voluntary Termination Fee - Per Service Account 0.13$ 0.10$ Operational Efficiencies11 Community Choice Aggregation Service Request (CCASR) - Cancellation Fee 1.30$ 2.10$ Labor Increases12 Community Choice Aggregation Service Request (CCASR) - CCASR Fee 0.98$ 0.68$ Operational Efficiencies13 Community Choice Aggregation Service Request (CCASR) - Customer Re-entry 1.30$ 0.50$ Operational Efficiencies14 Community Choice Aggregation Service Request (CCASR) - New Customer 0.66$ 1.10$ Labor Increases15 Community Choice Aggregation Service Request (CCASR) - Opt-out CCASR Fee 1.20$ 2.50$ Labor Increases16 Consolidated Bill Ready Billing Services - Additional Page Charge 0.08$ 7.00$ Material Cost Increase17 Mass Enrollment - Per Event 3,041.00$ 152.00$ Operational Efficiencies18 Mass Enrollment - Per Service Account 0.13$ 0.10$ Operational Efficiencies19 Meter and Data Management Agent (MDMA) - Meter Data Posting Fee 0.18$ 0.06$ Operational Efficiencies20 Testing Charge: IDR Meter 198.00$ 201.00$ Labor Increases21 Opt-Out Requests - Customer Contact Opt-out 0.46$ 4.50$ Labor Increases22 Opt-Out Requests - Internet Opt-out 1.90$ 0.46$ Operational Efficiencies23 Opt-Out Requests - Voice Response Unit (VRU) Opt-out 0.53$ 0.54$ Material Cost Increase24 Special Requirements Data - Standard Output File by Rate Group 161.00$ 74.00$ Operational Efficiencies25 Special Requirements Data - Aggregate Annual Usage Report, Standard File 161.00$ 154.00$ Operational Efficiencies26 Additional Information - Public Goods Charge, Residential Tier Data, Generation Revenue Informatio 302.01$ No Charge Operational Efficiencies27 Standard Phase In - Mass Enrollment Fee - Per Phase 3,041.00$ 152.00$ Operational Efficiencies28 Standard Phase In - Mass enrollment Fee - Per Service Account 0.13$ 0.11$ Operational Efficiencies
*T&M = Time and Material
$2.00$0.50
$2.30

259
is not compatible with SCE’s meter-reading systems. This fee replaces the Meter Replacement with 1
Standard SCE IDR Meter fee, Meter Replacement with Standard SCE Demand Meter fee, and the Meter 2
Removal Service fee. 3
(4) CCA Service Fees –Eliminated 4
Based on the comprehensive cost review of fees described earlier, SCE 5
proposes to eliminate 40 existing CCA service fees because the fees are duplicative, obsolete, or no 6
longer applicable because the sub-activities have been automated. These fees are shown in 7
Table XI-72. 8
(a) Fees No Longer Applicable Because of Process Automation 9
SCE proposes to eliminate the Customer Notification – Standard 10
Notification fee and the Miscellaneous Customer Notification fee because the process to notify 11
customers has been automated. Developing any other notices will be performed on a time and materials 12
basis under a Specialized Service Agreement and will incorporate development, stationery, envelope, 13
and postage costs. 14
(b) Fees No Longer Applicable Because of Duplication 15
SCE proposes to eliminate four fees because the fees are 16
duplicative of the Standard Output File by Rate Group fee and the three different aggregation methods, 17
which include aggregation by zip code, by customer status, and by rate schedule. 18
(c) Obsolete Fees 19
SCE proposes to eliminate 34 fees because the services are 20
obsolete. Three reporting fees were originally developed because, at that time, the processing required 21
considerable manual labor to develop the zip code, customer status, and rate schedule tables from the 22
corresponding data set. However, with the introduction of pivot tables and advanced filtering options 23
within Excel, this once manual process has become mostly automatic. Once customers purchase the 24
Standard Output File by Rate Group, they can pivot and manipulate their own data as desired. As a 25
result, customers no longer request these special reports. SCE also proposes to eliminate maintenance 26
and meter fees that are specific for IDR meters. IDR meters for CCA customers are now obsolete due to 27
the ESC meters and SCE will no longer provide IDR meters to customers. 28
42

260
Table XI-72 Community Choice Aggregation (CCA) Service Fees
Fees Proposed to be Eliminated FERC 456.412 (Nominal $s)
(5) CCA Service Fees - Consolidated into Other Fees 1
Based on the comprehensive review of fees described earlier, SCE 2
proposes to combine seven current CCA service fees into the proposed Aggregate Annual Usage Report 3
(Section A) Report fee. SCE proposes to consolidate the current fees into a single fee to streamline and 4
simplify its CCA fees. In addition, SCE proposes to consolidate three fees because the activities are 5
Line No
Description Current Fees
Reason for Elimination
1 Customer Notification - Standard Notification 1.70$ Automated2 Miscellaneous Customer Notification Fee 0.38$ Automated3 Special Requirements Data - Aggregate Annual Usage Report Base Processing Fee 161.00$ Duplicative4 Special Requirements Data - Aggregate Annual Usage Report, by Zip Code 68.00$ Duplicative5 Special Requirements Data - Aggregate Annual Usage Report, by Customer Status 68.00$ Duplicative6 Special Requirements Data - Aggregate Annual Usage Report, by Rate Schedule 76.00$ Duplicative7 Special Requirements Data - Standard Output File by Rate Group Aggregated by Zip Code 68.00$ Obsolete Fee8 Special Requirements Data - Standard Output File by Rate Group Aggregated by Customer Status 68.00$ Obsolete Fee9 Special Requirements Data - Standard Output File by Rate Group Aggregated by Rate Schedule 76.00$ Obsolete Fee10 Meter Ownership - Basic I 149.00$ Obsolete Fee11 Meter Ownership - Basic I with Pulse Output 328.00$ Obsolete Fee12 Meter Ownership - Basic I with Modem 359.00$ Obsolete Fee13 Meter Ownership - Basic I with Pulse Output & Modem 402.00$ Obsolete Fee14 Meter Ownership - Advanced I 178.00$ Obsolete Fee15 Meter Ownership - Advanced I with Pulse Output 286.00$ Obsolete Fee16 Meter Ownership - Advanced I with Modem 437.00$ Obsolete Fee17 Meter Ownership - Advanced I with Pulse Output & Modem 437.00$ Obsolete Fee18 Meter Services - Meter Installation IDR 260.00$ Obsolete Fee19 Meter Services - Meter Installation IDR with Pulse Output 338.00$ Obsolete Fee20 Meter Services -Meter Installation IDR with Modem 348.00$ Obsolete Fee21 Meter Services - Meter Installation IDR with Pulse Output & Modem 402.00$ Obsolete Fee22 Meter Services - Basic I Maintenance Charges Billing Meter - IDR 1.20$ Obsolete Fee23 Meter Services - Basic I Maintenance Charges Billing Meter- IDR Billing Meter with Pulse Output 1.40$ Obsolete Fee24 Meter Services - Basic I Maintenance Charges Billing Meter - IDR with Modem 2.30$ Obsolete Fee25 Meter Services - Basic I Maintenance Charges Billing Meter - IDR with Pulse Output & Modem 2.60$ Obsolete Fee26 Meter Services - Advanced I Maintenance Charges Billing Meter - IDR 1.40$ Obsolete Fee27 Meter Services - Advanced I Maintenance Charges Billing Meter - IDR with Pulse Output 1.90$ Obsolete Fee28 Meter Services - Advanced I Maintenance Charges Billing Meter - IDR with Modem 2.80$ Obsolete Fee29 Meter Services - Advanced I Maintenance Charges Billing Meter - IDR with Pulse Output & Modem 2.80$ Obsolete Fee30 Meter Services - Basic I Maintenance Charges Non-Billing Meter - IDR 1.20$ Obsolete Fee31 Meter Services -Basic I Maintenance Charges Non-Billing Meter- IDR Billing Meter with Pulse Output 1.40$ Obsolete Fee32 Meter Services - Basic I Maintenance Charges Non-Billing Meter - IDR with Modem 2.30$ Obsolete Fee33 Meter Services - Basic I Maintenance Charges Non-Billing Meter - IDR with Pulse Output & Modem 2.60$ Obsolete Fee34 Meter Services - Advanced I Maintenance Charges Non-Billing Meter - IDR 1.40$ Obsolete Fee35 Meter Services - Advanced I Maintenance Charges Non-Billing Meter - IDR with Pulse Output 1.90$ Obsolete Fee36 Meter Services - Advanced I Maintenance Charges Non-Billing Meter - IDR with Modem 2.80$ Obsolete Fee37 Meter Services - Advanced I Maintenance Charges Non-Billing Meter - IDR with Pulse Output & Modem 2.80$ Obsolete Fee38 Additional Metering Related Services - Meter Removal Charge 134.00$ Obsolete Fee39 Additional Metering Related Services - Meter Replacement Charges with Standard SCE IDR Meter 257.00$ Obsolete Fee40 Additional Metering Related Services - Meter Replacement Charges with Standard SCE Demand Meter 207.00$ Obsolete Fee

260
Table XI-72 Community Choice Aggregation (CCA) Service Fees
Fees Proposed to be Eliminated FERC 456.412 (Nominal $s)
(5) CCA Service Fees - Consolidated into Other Fees 1
Based on the comprehensive review of fees described earlier, SCE 2
proposes to combine seven current CCA service fees into the proposed Aggregate Annual Usage Report 3
(Section A) Report fee. SCE proposes to consolidate the current fees into a single fee to streamline and 4
simplify its CCA fees. In addition, SCE proposes to consolidate three fees because the activities are 5
Line No. Fee Description
Current Fees
Reason for Elimination
1 Customer Notification 1.70$ Automated2 Miscellaneous Customer Notification 0.38$ Automated3 Consolidated SCE Billing - Standard Bill by Mail Charge 0.23$ Automated4 Consolidated SCE Billing - Bill by Internet Charge 0.11$ Automated5 Special Requirements Data - Aggregate Annual Usage Report Base Processing Fee 161.00$ Duplicative6 Special Requirements Data - Aggregate Annual Usage Report, by Zip Code 68.00$ Duplicative7 Special Requirements Data - Aggregate Annual Usage Report, by Customer Status 68.00$ Duplicative8 Special Requirements Data - Aggregate Annual Usage Report, by Rate Schedule 76.00$ Duplicative9 Special Requirements Data - Standard Output File by Rate Group Aggregated by Zip Code 68.00$ Obsolete Fee
10 Special Requirements Data - Standard Output File by Rate Group Aggregated by Customer Status 68.00$ Obsolete Fee11 Special Requirements Data - Standard Output File by Rate Group Aggregated by Rate Schedule 76.00$ Obsolete Fee12 Meter Ownership - Basic I 149.00$ Obsolete Fee13 Meter Ownership - Basic I with Pulse Output 328.00$ Obsolete Fee14 Meter Ownership - Basic I with Modem 359.00$ Obsolete Fee15 Meter Ownership - Basic I with Pulse Output & Modem 402.00$ Obsolete Fee16 Meter Ownership - Advanced I 178.00$ Obsolete Fee17 Meter Ownership - Advanced I with Pulse Output 286.00$ Obsolete Fee18 Meter Ownership - Advanced I with Modem 437.00$ Obsolete Fee19 Meter Ownership - Advanced I with Pulse Output & Modem 437.00$ Obsolete Fee20 Meter Services - Meter Installation IDR 260.00$ Obsolete Fee21 Meter Services - Meter Installation IDR with Pulse Output 338.00$ Obsolete Fee22 Meter Services - Meter Installation IDR with Modem 348.00$ Obsolete Fee23 Meter Services - Meter Installation IDR with Pulse Output & Modem 402.00$ Obsolete Fee24 Meter Services - Basic I Maintenance Charges Billing Meter - IDR 1.20$ Obsolete Fee25 Meter Services - Basic I Maintenance Charges Billing Meter- IDR Billing Meter with Pulse Output 1.40$ Obsolete Fee26 Meter Services - Basic I Maintenance Charges Billing Meter - IDR with Modem 2.30$ Obsolete Fee27 Meter Services - Basic I Maintenance Charges Billing Meter - IDR with Pulse Output & Modem 2.60$ Obsolete Fee28 Meter Services - Advanced I Maintenance Charges Billing Meter - IDR 1.40$ Obsolete Fee29 Meter Services - Advanced I Maintenance Charges Billing Meter - IDR with Pulse Output 1.90$ Obsolete Fee30 Meter Services - Advanced I Maintenance Charges Billing Meter - IDR with Modem 2.80$ Obsolete Fee31 Meter Services - Advanced I Maintenance Charges Billing Meter - IDR with Pulse Output & Modem 2.80$ Obsolete Fee32 Meter Services - Basic I Maintenance Charges Non-Billing Meter - IDR 1.20$ Obsolete Fee33 Meter Services - Basic I Maintenance Charges Non-Billing Meter- IDR Billing Meter with Pulse Output 1.40$ Obsolete Fee34 Meter Services - Basic I Maintenance Charges Non-Billing Meter - IDR with Modem 2.30$ Obsolete Fee35 Meter Services - Basic I Maintenance Charges Non-Billing Meter - IDR with Pulse Output & Modem 2.60$ Obsolete Fee36 Meter Services - Advanced I Maintenance Charges Non-Billing Meter - IDR 1.40$ Obsolete Fee37 Meter Services - Advanced I Maintenance Charges Non-Billing Meter - IDR with Pulse Output 1.90$ Obsolete Fee38 Meter Services - Advanced I Maintenance Charges Non-Billing Meter - IDR with Modem 2.80$ Obsolete Fee39 Meter Services - Advanced I Maintenance Charges Non-Billing Meter - IDR with Pulse Output & Modem 2.80$ Obsolete Fee40 Additional Metering Related Services - Meter Removal Charge 134.00$ Obsolete Fee41 Additional Metering Related Services - Meter Replacement Charges with Standard SCE IDR Meter 257.00$ Obsolete Fee42 Additional Metering Related Services - Meter Replacement Charges with Standard SCE Demand Meter 207.00$ Obsolete Fee
260A

261
already captured in the Meter Data Posting Fee and consolidate two fees into the EDI VAN Charge. 1
Table XI-73 summarizes the 11 fees that SCE proposes to combine with other fees. 2
Table XI-73 Community Choice Aggregation (CCA) – Proposed for Elimination
Due to Consolidation FERC 456.412 (Nominal $s)
2. CCA Service Fees – Forecast OOR 3
Table XI-74 presents the 2018 forecast revenues by CCA service fees. 4
Line No. Description Current
FeesProposed
Fees Consolidated Under
1 Consolidated Bill Ready Billing Services - Bill By Mail 0.23$ Eliminated Meter Data Posting2 Consolidated Bill Ready Billing Services - Bill By Internet 0.11$ Eliminated Meter Data Posting3 Monthly Account Maintenance Fee - Manual Billing Exception
Processing (Variable)0.37$ Eliminated Meter Data Posting
4 Information Normally Provided at No Charge - Number of Accounts in each Rate Group
No Charge Eliminated Aggregate Annual Usage Report (Section A Report) Fee*
5 Information Normally Provided at No Charge - Aggregate Annual Consumption for each Rate Group
No Charge Eliminated Aggregate Annual Usage Report (Section A Report) Fee*
6 Information Normally Provided at No Charge - Aggregate Noncoincident Demand in each Rate Group
No Charge Eliminated Aggregate Annual Usage Report (Section A Report) Fee*
7 Information Normally Provided at No Charge - Aggregate Coincident Demand in each Rate Group
No Charge Eliminated Aggregate Annual Usage Report (Section A Report) Fee*
8 Information Normally Provided at No Charge - Coincidence Peak Factors which Estimate Coincident Demands
No Charge Eliminated Aggregate Annual Usage Report (Section A Report) Fee*
9 Information Normally Provided at No Charge - Standard System Average Load Profiles by Rate Group
No Charge Eliminated Aggregate Annual Usage Report (Section A Report) Fee*
10 Information Normally Provided at No Charge - The Proportional Share in a CCA's Territory or Proposed Territory as Defined in the Commission's Energy Efficiency Policy Manual
No Charge Eliminated Aggregate Annual Usage Report (Section A Report) Fee*
* Currently, for CCAs that request a report more than two times per calendar year, the CCA is charged $256.62 for each additional report. It is proposed that these seven reports be consolidated with charge of $33 for each additional report.
the Monthly Account Maintenance Fee (Variable) under the Meter Data Posting Fee
eight

262
Table XI-74 Community Choice Aggregation (CCA) Fees
FERC 456.412 (Nominal $s)
SCE’s first CCA was implemented in 2015, with the majority of accounts transitioning to 1
CCA service in October 2015. As discussed in Section VII.C.4.c), SCE anticipates implementing two 2
additional CCAs by the Test Year 2018. SCE forecasts CCA revenue to increase to $1.299 million by 3
2018, if these CCAs complete implementation. The forecasting was based on one new CCA in 2017 4
LineNo. Fee Description Proposed
FeesForecasted
Volume
Forecast 2018 Annual
Revenue*1 CCA Establishment - CCA Service Establishment $517.00 1 1$ 2 CCA Establishment - CCA Credit Establishment Fee $24.00 1 0$ 3 Mass Enrollment - Per Event $152.00 1 0$ 4 Mass Enrollment - Per Service Account $0.10 281,000 28$ 5 Opt-Out Requests - Customer Contact Opt-out $4.50 3,600 16$ 6 Opt-Out Requests - Voice Response Unit (VRU) Opt-out $0.54 3,600 2$ 7 Opt-Out Requests - Internet Opt-out $0.46 4,800 2$ 8 Community Choice Aggregation Service Request (CCASR) - CCASR Fee $0.68 126,000 85$ 9 Community Choice Aggregation Service Request (CCASR) - Customer Re-entry $0.50 3,800 2$
10 Community Choice Aggregation Service Request (CCASR) - Cancellation Fee $2.10 0 -$ 11 Community Choice Aggregation Service Request (CCASR) - New Customer $1.10 46,000 51$ 12 Community Choice Aggregation Service Request (CCASR) - Opt-out CCASR Fee $2.50 3,800 10$ 13 Consolidated Bill Ready Billing Services - Additional Page Charge $7.00 19,600 137$ 14 CCA Non-Energy Billing Receivable Fee $8.00 30 0$ 15 CCA Termination of Service - Voluntary Termination Fee - Per Event $152.00 0 -$ 16 CCA Termination of Service - Voluntary Termination Fee - Per Service Account $0.10 0 -$ 17 Meter and Data Management Agent (MDMA) - Meter Data Posting Fee $0.06 5,742,000 360$ 18 Monthly Account Maintenance Fee - Manual Billing Exception Processing (Fixed) $370.00 30 11$ 19 Standard Phase In - Mass Enrollment Fee - Per Phase $152.00 0 -$ 20 Standard Phase In - Mass enrollment Fee - Per Service Account $0.11 0 -$ 21 Special Requirements Data - Standard Output File by Rate Group $74.00 219 16$ 22 Special Requirements Data - Aggregate Annual Usage Report, Standard File $154.00 301 46$ 23 Aggregate Annual Usage Report (Section A Report) Fee $33.00 418 14$ 24 Reposting of Usage Data Files Fee $42.00 4 0$ 25 EDI VAN Charge $0.09 5,742,000 517$ 26 Additional Metering Related Services - Engineering Estimate or Job Design $54.00 0 -$ 27 Additional Metering Related Services - Incomplete Trip Fee $104.00 0 -$ 28 Additional Metering Related Services - Pulse Adapter Equipment and Installation Charge $323.00 0 -$ 29 Testing Charge: IDR Meter $201.00 0 -$ 30 Customer Information Standardized Request (CISR) - CISR Base Processing Fee $9.91 0 -$ 31 Customer Information Standardized Request (CISR) - Usage Data Base Fee (Non-Interval) $4.52 0 -$ 32 Customer Information Standardized Request (CISR) - Service Acct Usage Data Fee (Non-Interv $5.54 0 -$ 33 Customer Information Standardized Request (CISR) - Usage Data Base Fee (Interval) $4.32 0 -$ 34 Customer Information Standardized Request (CISR) - Service Acct Usage Data Fee (Interval) $7.73 0 -$ 35 ESC Meter with Pulse Output Fee $460.00 0 -$ 36 Meter Replacement Service Fee $241.00 0 -$ 37 1,299$
* The Customer Services (Revenue Services Organization) O&M forecast includes expenses to support the forecasted increase in CCA OOR's. Details are provided in the workpapers for each fee.
$0.50
$2.00
$2.30
$1,275
$1.275

264
Figure XI-52 FERC Account 456.412
CCA Service Fee Revenue263 (Nominal $000)
H. Other - Miscellaneous OOR Accounts 1
1. FERC Account 456.415 – Manufactured Home Billing Service 2
Sub-account 456.415 records the revenue SCE receives from customers that use the 3
Manufactured Home Billing (MHB) Service. SCE’s Tenant Bill Calculation Service is an optional 4
fee-based service available to Manufactured Home Park owners and operators on a contractual basis. 5
This service allows customers to request that SCE calculate the amount of each tenant’s monthly electric 6
bill. SCE calculates individual tenant bill amounts based on input provided by the owner or operator 7
263 Refer to WP SCE-03 Ch. XI, pp. 192-203 for the recorded and forecast OOR for CCA Service Fees.
$1.275
$1.275