customersatisfactionreport
TRANSCRIPT
EUROCONTROL
A Centre of Excellence in ATM Training
IANS
Customer Satisfaction Report
Report

ii © Copyright 2006 EUROCONTROL
Copyright Notice
© 2006 European Organisation for the Safety of Air Navigation (EUROCONTROL). All rights reserved.
No part of this publication may be reproduced, stored in a retrieval system, or transmitted in any form or by any means, electronic, mechanical, photocopying, recording or otherwise.
Any other use is subject to prior written consent by EUROCONTROL. Request shall be addressed to:
Director of the Institute of Air Navigation Services, 12, rue Antoine de Saint-Exupéry, L-1432 Kirchberg/Luxembourg.
The EUROCONTROL Institute of Air Navigation Services aims to provide the services that you want and to make your stay in the Institute as enjoyable as possible. All Institute personnel are there to ensure that your stay at the Institute is successful. However, if you do have a complaint (or a compliment) please tell us. If you are not satisfied with the service we provide or you would like to propose an improvement then please fill out the form at http://www.eurocontrol.int/ians/complaint.html, or contact [email protected] directly.

Printed on 30/11/2004 Produced by the Business and Administration Unit 3
Table of Contents INTRODUCTION..................................................................................................................................... 4
ATM TRAINING ...................................................................................................................................... 5
ATC TRAINING .................................................................................................................................... 12
E-LEARNING........................................................................................................................................ 13
STAKEHOLDER FEEDBACK.............................................................................................................. 14
COMPLAINTS ...................................................................................................................................... 15
CONCLUSION ...................................................................................................................................... 16

Customer Satisfaction Report
4 © Copyright 2006 EUROCONTROL
IntroductionThis is the 7th report that the Institute devotes to the assessment of the level of satisfaction of its customers. The study on which this report is based has been conducted in the framework of the quality improvement programme implemented at the Institute since end of 1996.
Measuring customer satisfaction on a regular basis is one of the key elements of the quality strategy implemented by the Institute since 1997.
Our objective is to understand exactly how our customers perceive the Institute and, based on their level of satisfaction, to improve our services and products.
This report proposes a summary and an analysis of the data collected in 2005.
The customer segments assessed in 2005 IANS applies a policy to measure the satisfaction of its customers with all its products and services. These include: • The ATM course participants • The ATC course participants • The E-Learning Students • Training Sponsors • Consultancy Bodies. • User Groups
Assessment Tools The assessment is based on a set of assessment tools and measurement methods. During 2005 further work has been done to increase the integrity of the data collection.
Evaluation Forms To measure the satisfaction of its customers with the products and services IANS uses the following evaluation forms:
• A Student Evaluation Form filled in by the students at the end of a course. This evaluation form is used for both the ATM course participants and ATC course participants.
• An E-Learning Evaluation Form filled in by a student upon completion of an E-Learning Module.
• A generic Stakeholder Feedback Form filled in by various stakeholders. The form is available at http://www.eurocontrol.int/ians/feedback.html.
Customer Visits IANS visits a sample of its customers on a yearly basis. The customer visits serve as a main source of feedback on existing products and a source of information for improvements and new products. The customer visits include visits to Air Navigation Service Providers and civil and military State Authorities.
Complaint Procedure and Complaint Form IANS uses an anonymous form, available on its web-site for the collection of complaints related to its products, services and staff. A reference to the complaint procedure and associated form is made in all products and services. The complaint form is available at http://www.eurocontrol.int/ians/complaint.html.

Printed on 30/11/2004 Produced by the Business and Administration Unit 5
ATM Training The Satisfaction of Students with the ATM Training Products is measured through the use of a Course Evaluation Form.
Measurement Method At the end of each (classroom) course, students are presented with an evaluation form containing a number of criteria to be assessed. Each criterion can be given a result between 1 and 4 meaning unacceptable (1), unsatisfactory (2), good (3) an excellent (4).
The complete set of criteria are grouped in five main categories: • Training Content • Instructional Team • Documentation • Equipment • Administration
The first three categories are directly related to the course. The last two categories are directly related to the supporting environment and organisation.
Figure 1 Student Evaluation Form

Customer Satisfaction Report
6 © Copyright 2006 EUROCONTROL
From Forms to Results We map the marks of the students on a scale from 0 (all students mark Unacceptable) to +100 (all students mark Excellent). When all students mark Good then the result is 75 and when students mark, on average, between Good and Excellent then the result will be around 85. Likewise, if students fill in 'all-Uncacceptable' then the result will be 0. If students fill in 'all-Un-Satisfactory' then the result will be 25.
1©Copyright 2003 EUROCONTROL
Measuring SatisfactionMeasuring Satisfaction
1
Unsatisfactory Satisfactory
2
Good
3
Excellent
4
Marks from Students
ResultResult
All 3All 3All 2All 2All 1All 12525 7575 10010000
All 4All 4
Figure 2 How we measure satisfaction
IANS aims to meet our objective of being a Centre of Excellence in ATM Training. For us this means we aim to achieve results on any criterion between 75 and 100. As an example: the overall average (all courses, all criteria, 3090 forms) for IANS in 2005 is 87.5 – compared to 85 in 2004. The highest result on a single criterion is 95 (Subject Knowledge of the Instructor). The lowest result remains pre-course information (76.5 – compared to 70 in 2004).
Results The results presented below are extracted from the automated student satisfaction evaluation system. Results can be presented per category, per training domain and per criterion. We have selected the most significant results to be included in this report.
Printed on 30/11/2004 Produced by the Business and Administration Unit 7
0
500
1000
1500
2000
2500
3000
3500
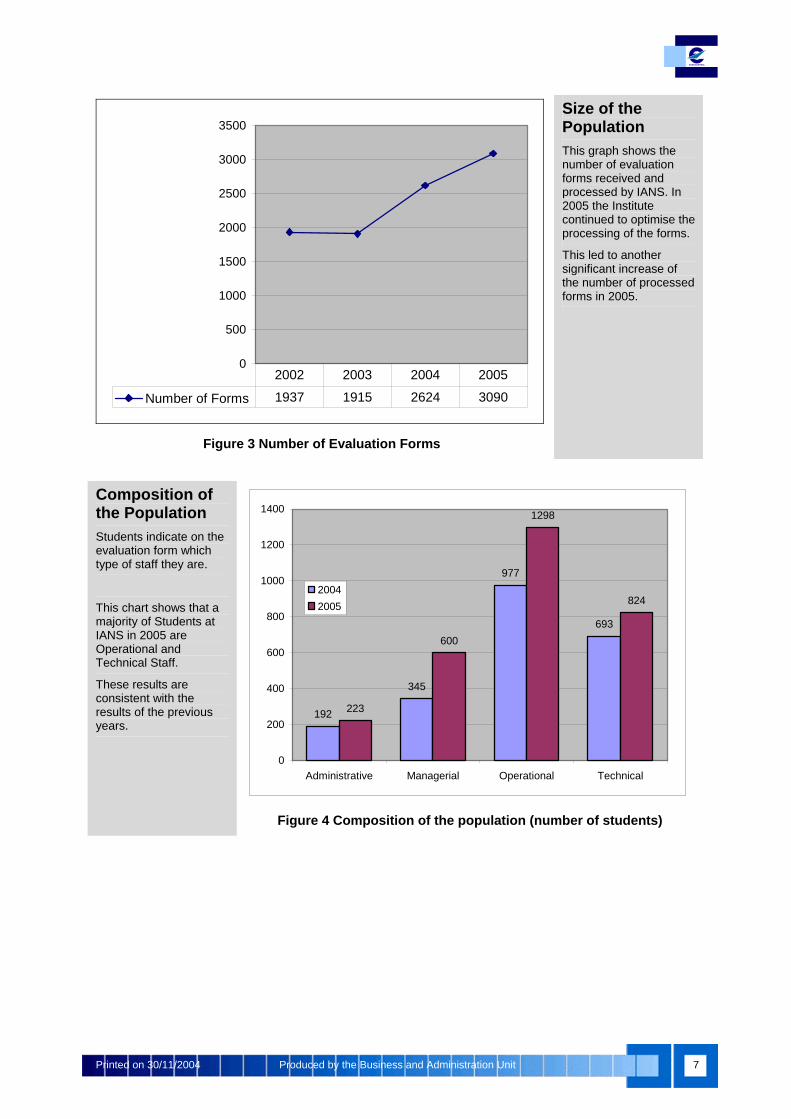
Number of Forms 1937 1915 2624 3090
2002 2003 2004 2005
Figure 3 Number of Evaluation Forms
Size of the Population This graph shows the number of evaluation forms received and processed by IANS. In 2005 the Institute continued to optimise the processing of the forms.
This led to another significant increase of the number of processed forms in 2005.
Composition of the Population Students indicate on the evaluation form which type of staff they are.
This chart shows that a majority of Students at IANS in 2005 are Operational and Technical Staff.
These results are consistent with the results of the previous years.
192
345
977
693
223
600
1298
824
0
200
400
600
800
1000
1200
1400
Administrative Managerial Operational Technical
20042005
Figure 4 Composition of the population (number of students)

Customer Satisfaction Report
8 © Copyright 2006 EUROCONTROL
50
55
60
65
70
75
80
85
90
95
100
Course Results 83 84,5 86 87,5
2002 2003 2004 2005
Figure 5 ATM Course Results
Satisfaction This chart shows the satisfaction of the students with the ATM courses. The result is obtained by averaging the results obtained on every criterion in the categories Training Content, Instructional Team and Documentation.
A result of 87 indicates that, on average, students mark criteria between Good and Excellent.
The increase in satisfaction has been achieved through detailed analysis of the results of each course and introducing corrective action wherever required.
50556065707580859095
100
Content 81,5 83 84,5 86,5
Instructor 88 89 91 92
Documentation 80 80,5 83,5 85
2002 2003 2004 2005
Figure 6 ATM Course Results: per Category
Segmented View This chart presents the results per measurement Category. These are Training Content, Instructional Team and Documentation.
IANS has improved the results on each of these three categories during the last four years.
IANS will continue to analyse the results and make improvements where possible and practicable.

Printed on 30/11/2004 Produced by the Business and Administration Unit 9
‘Best’ Results Customers often praise IANS for its staff and excellent infrastructure.
This informal feedback is confirmed by the course evaluation results. The criteria ‘Instructor Subject Knowledge’ and ‘Classroom Equipment’ have consistently received the highest marks from the students during the last three years.
IANS will continue to invest in the competence of its instructors by continuation training and competency assessment and it will maintain the building at its high standard.
50
60
70
80
90
100
Instructor SubjectKnowledge
92,5 93 94,5 95,5
ClassroomEquipment
88,5 89 90,5 91
2002 2003 2004 2005
Figure 7 Criteria with ‘Best’ Results
50
60
70
80
90
100
Pre CourseInformation
61,5 64 70,5 78
Course Duration 71 74 76 76
Canteen 73,5 72,5 75 77,5
2002 2003 2004 2005
Figure 8 Criteria with less positive Results
Areas for Improvement IANS continuously looks for opportunities to improve. Criteria with the less positive results are the Pre-Course Information and the Course Duration.
In 2004 IANS has put in place an action plan to improve the Pre-Course information and significant progress has been made in this domain in 2004 and 2005.
The optimum duration for each course will be reviewed on a course-by-course basis.
In 2005 IANS changed the layout of the coffee area and installed new equipment in the kitchen to improve the flow of students.
Customer Satisfaction Report
10 © Copyright 2006 EUROCONTROL
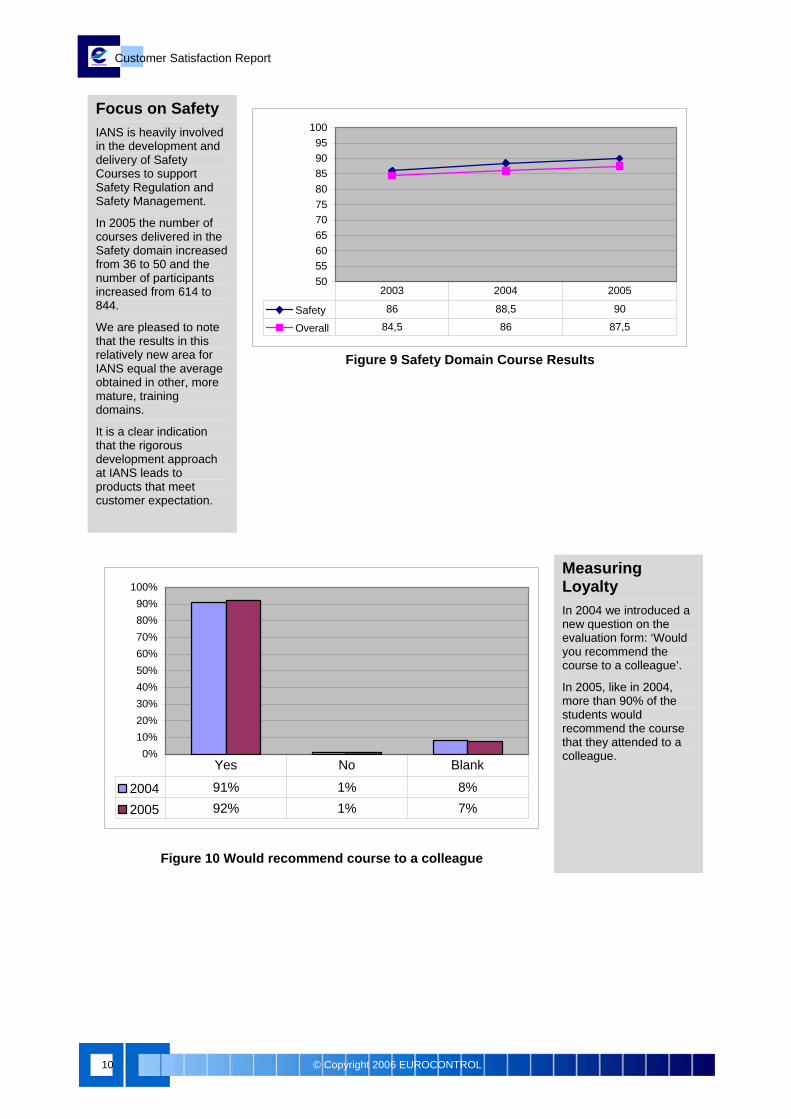
Focus on Safety IANS is heavily involved in the development and delivery of Safety Courses to support Safety Regulation and Safety Management.
In 2005 the number of courses delivered in the Safety domain increased from 36 to 50 and the number of participants increased from 614 to 844.
We are pleased to note that the results in this relatively new area for IANS equal the average obtained in other, more mature, training domains.
It is a clear indication that the rigorous development approach at IANS leads to products that meet customer expectation.
50556065707580859095
100
Safety 86 88,5 90
Overall 84,5 86 87,5
2003 2004 2005
Figure 9 Safety Domain Course Results
0%10%20%30%40%50%60%70%80%90%
100%
2004 91% 1% 8%
2005 92% 1% 7%
Yes No Blank
Figure 10 Would recommend course to a colleague
Measuring Loyalty In 2004 we introduced a new question on the evaluation form: ‘Would you recommend the course to a colleague’.
In 2005, like in 2004, more than 90% of the students would recommend the course that they attended to a colleague.
Printed on 30/11/2004 Produced by the Business and Administration Unit 11
0,00%
1,00%
2,00%
3,00%
4,00%
5,00%
6,00%
7,00%
8,00%
9,00%
10,00%
Percentage of'Unsatisfactory'Results
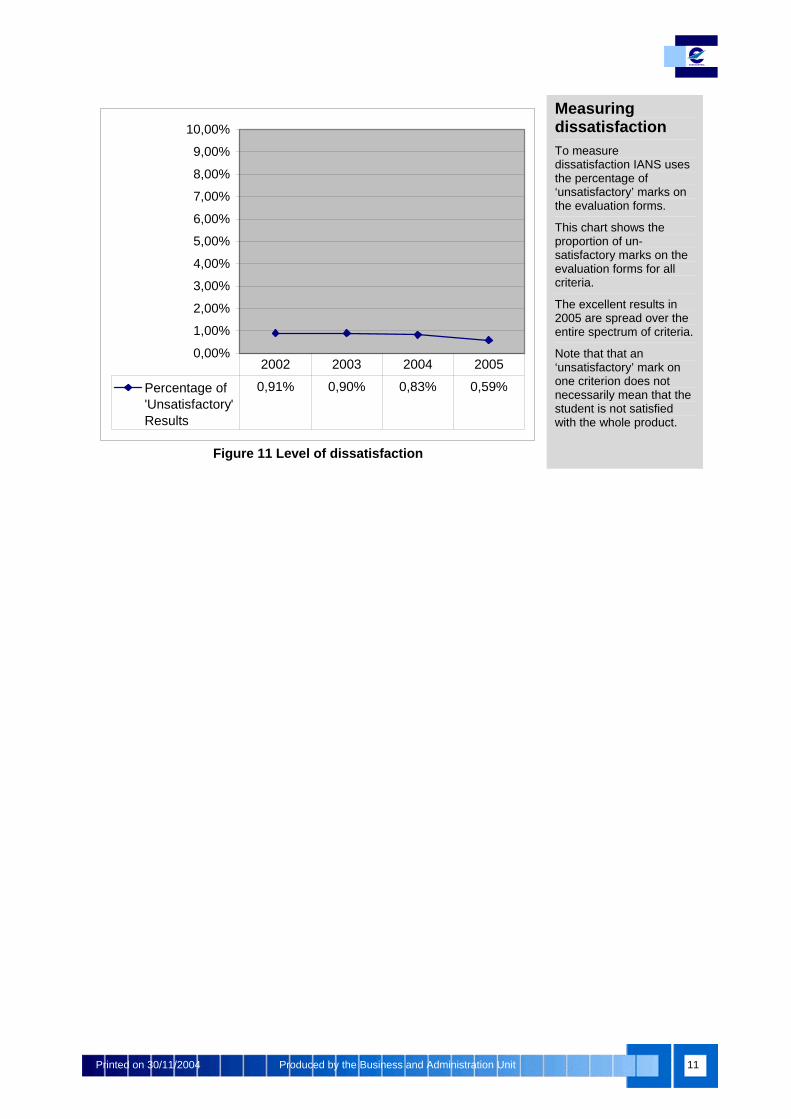
0,91% 0,90% 0,83% 0,59%
2002 2003 2004 2005
Figure 11 Level of dissatisfaction
Measuring dissatisfaction To measure dissatisfaction IANS uses the percentage of ‘unsatisfactory’ marks on the evaluation forms.
This chart shows the proportion of un-satisfactory marks on the evaluation forms for all criteria.
The excellent results in 2005 are spread over the entire spectrum of criteria.
Note that that an ‘unsatisfactory’ mark on one criterion does not necessarily mean that the student is not satisfied with the whole product.
Customer Satisfaction Report
12 © Copyright 2006 EUROCONTROL
ATC Training The satisfaction of ATC ab-initio students is measured using the same evaluation as the system used for measuring the satisfaction of the ATM students. Satisfaction figures of ATM and ATC students must however not be compared. The context of these courses, although delivered in the same building, is completely different: • The duration of ATM courses is maximum of
two weeks whereas ATC have a duration of several months.
• The student population of ATM courses are staff members from service providers and member states.
• The student population of ATC courses are ab-inito ATC students
• Last but not least, the ATC ab-initio students are evaluated at the end of the course. At the end of the evaluation they either pass or fail. The outcome of the evaluation tends to have a significant impact on the satisfaction of the students.
IANS believes that the critical success factor for ATC students is their validation rate (i.e. the proportion of students that obtain an ATC license). We do however present the satisfaction data in this report as it is part of our quality management tools.
50
60
70
80
90
100
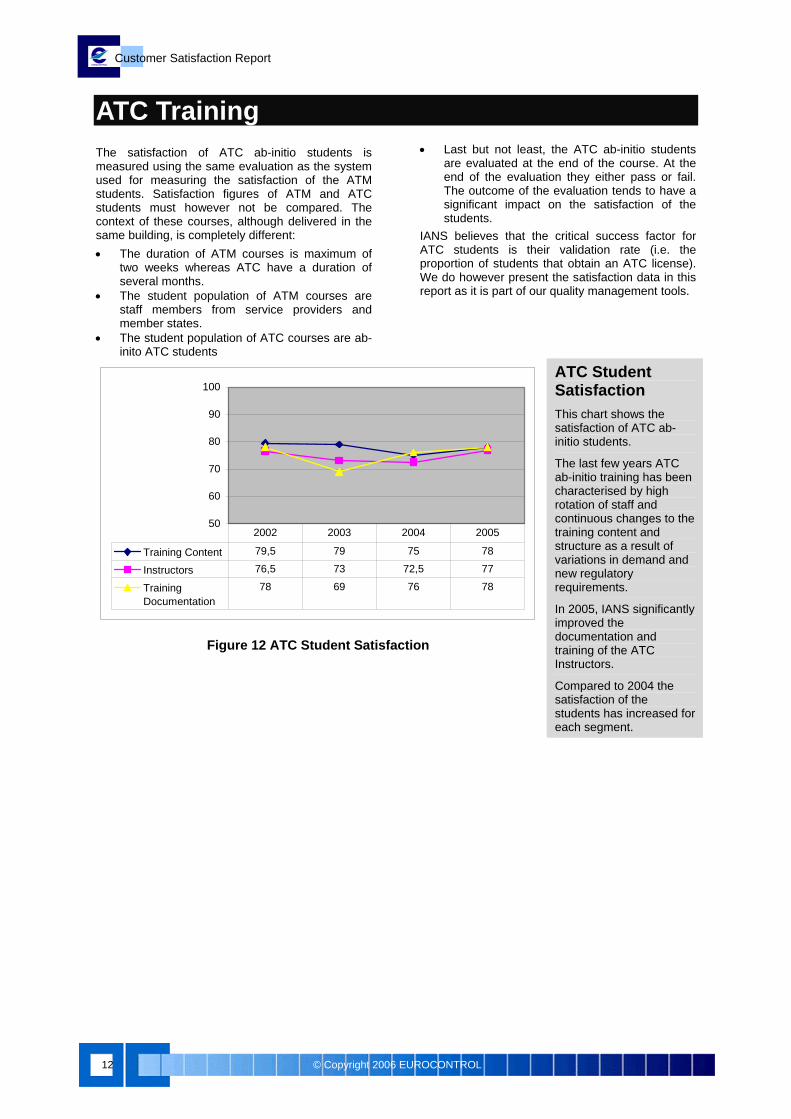
Training Content 79,5 79 75 78
Instructors 76,5 73 72,5 77
TrainingDocumentation
78 69 76 78
2002 2003 2004 2005
Figure 12 ATC Student Satisfaction
ATC Student Satisfaction This chart shows the satisfaction of ATC ab-initio students.
The last few years ATC ab-initio training has been characterised by high rotation of staff and continuous changes to the training content and structure as a result of variations in demand and new regulatory requirements.
In 2005, IANS significantly improved the documentation and training of the ATC Instructors.
Compared to 2004 the satisfaction of the students has increased for each segment.
Printed on 30/11/2004 Produced by the Business and Administration Unit 13
E-Learning IANS introduced satisfaction measurement for its e-learning products in the middle of 2004. Students are given an opportunity to evaluate each e-learning module at the end of the module. The figures presented in this report cover all the modules on the EUROCONTROL IANS on-line TrainingZone, including the CFMU modules.
In 2005, students filled in 2774 forms (800 in 2004) evaluation forms were filled in. 90% of the students identified to be ‘satisfied’ with the modules and more than 88% of the students indicated that the module met the objectives.
These figures indicate that the overall satisfaction with the e-learning modules is excellent.
1. Why are you studying this module?
Personal reasons (e.g. to further career, out of personal interest etc). My employer decided I should. It was a prerequisite for a class-room based course or programme.
2. The module agree not sure-n/a disagree followed a logical sequence, O O O was not too easy or too difficult, O O O was clear and easy to understand. O O O
3. The module was agree not sure-n/a disagree easy to use, O O O interactive and interesting. O O O
4. In order to successfully access this module, did you have to change your browser (Internet Explorer) settings? install new software (flash plug-in, java plug-in, internet explorer)? disable a popup-killer or anti-intrusion programme (e.g. Norton Internet
Security)? 5. The module agree not sure-n/a disagree
met the objectives set at the beginning,O O O allowed me to check my understanding. O O O
6. Did you enjoy studying this module: O yes O no
7. Will this module Help you directly in your current job? Help you in a future job? Increase your understanding of the industry without direct impact on your
current/future job? Help you personally (e.g. out of personal interest)?
E-Learning Evaluation Form A customised form was developed to capture student satisfaction with the e-learning modules. The form collects information related to the ‘reasons for studying’, the complexity of the module, the objectives of the module and the impact of the module on the student’s job.
0%10%20%30%40%50%60%70%80%90%
100%
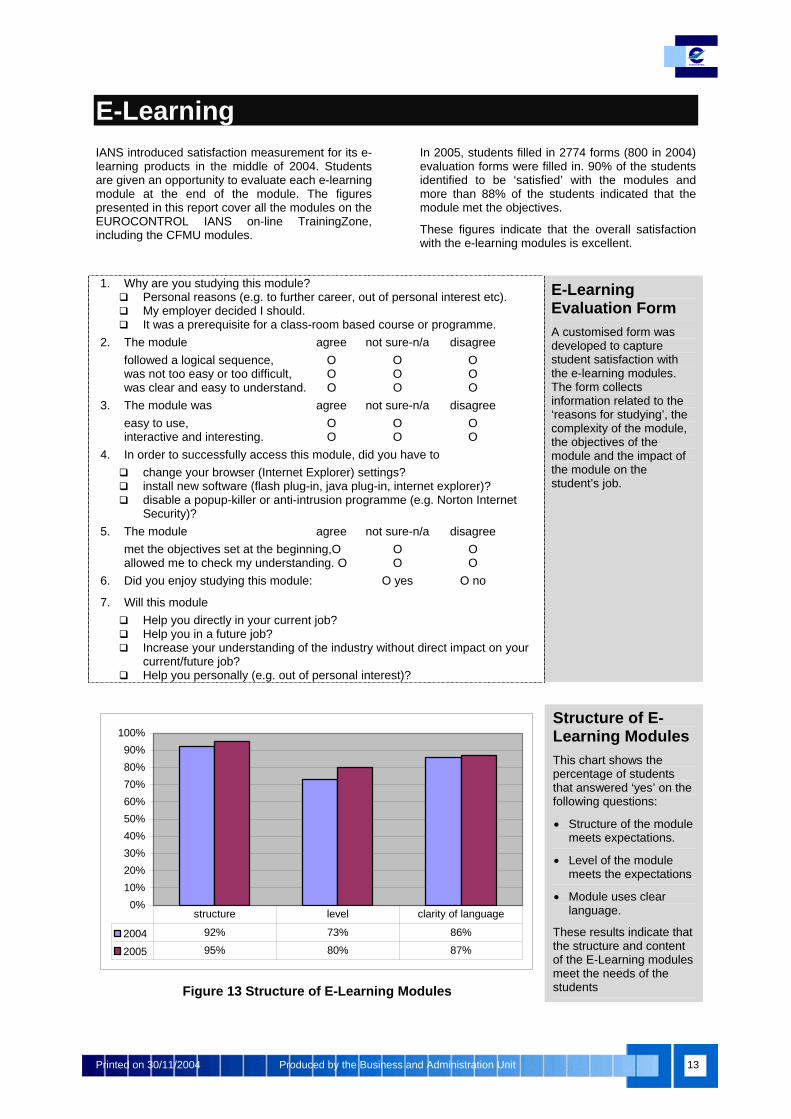
2004 92% 73% 86%
2005 95% 80% 87%
structure level clarity of language
Figure 13 Structure of E-Learning Modules
Structure of E-Learning Modules This chart shows the percentage of students that answered ‘yes’ on the following questions:
• Structure of the module meets expectations.
• Level of the module meets the expectations
• Module uses clear language.
These results indicate that the structure and content of the E-Learning modules meet the needs of the students

Customer Satisfaction Report
14 © Copyright 2006 EUROCONTROL
0%
5%10%
15%20%
25%
30%
35%
40%
45%
Self-driven 43% 28%
Employer-driven 30% 39%
Prerequisite 27% 33%
2004 2005
Figure 14 Why did students study e-learning modules
Origin of E-Learning Students It is IANS’ strategy to integrate e-learning in well defined training programmes – defined and implemented by the student’s employer - and as pre-requisite modules for classroom courses.
These results indicate that the proportion of students registered through their employer or studying as a pre-requisite module has significantly increased compared to the number of students that study out of their own initiative.
The number of students that see a direct impact on their job from studying e-learning modules has increased from 56% in 2004 to 68% in 2005.
Printed on 30/11/2004 Produced by the Business and Administration Unit 15
Stakeholder Feedback
Training Consultation Group The Stakeholder Feedback Form was distributed to the meeting participants at the end of each Training Consultation Group Meeting. The majority of the feedback indicates that the overall perception of the Institute lies between Good and Excellent (on a scale unsatisfactory – satisfactory – good –excellent).
Compared to 2004 the results related to communication (content, format and timeliness) have improved. We will continue to review and
improve our communication with the members of the consultation group.
Other stakeholders The stakeholder evaluation form was also distributed to: • Participants of the training focus group. • The training partners at IATA. The results indicate an equally high level of satisfaction of working together with IANS.
Customer Visits The Customer Visits are a process in which IANS meets stakeholders in member states on a bi-lateral basis. It is a mechanism to collect qualitative feedback from various stakeholders. The countries visited in 2005 are: Austria, Belgium, BIH, Bulgaria, Greece, Hungary, Spain, Sweden and Turkey
During the meeting of the Training Consultation Group in September 2005 it was agreed that IANS would include in its Customer Satisfaction Report information gathered during the Customer Visits.
During these customer visits, stakeholders have in general expressed a high degree of satisfaction with IANS, its staff and the services it offers. The following points have been raised: • OJTI: The delivery of OJTI courses through
partnerships is often perceived as an expensive solution (by stakeholders receiving the services). The solution is not perceived as entirely satisfactory.
• ATSEP Training: Many of the visited stakeholders are currently in the process of defining basic training for Air Traffic Safety Electronics Personnel (ATSEP). Some collaboration with EUROCONTROL and other member states could avoid duplication of effort.
• On-Site Courses: In general the demand for on-site course (i.e. courses at stakeholder premises) exceeds the capacity of IANS.
• Although most stakeholders are aware of the E-Learning products of the Institute many of them have not yet been able to assess the feasibility to use the products available.
• ATC Training Notes: IANS should develop a policy to distribute CCC aligned ATC Training Notes.
ComplaintsEvery training note distributed to students and all pages on the On-Line Trainingzone contain a clearly visible reference to IANS’ complaint procedure. The procedure enables stakeholders to submit complaints in an anonymous way or an identified complaint through e-mail. The text is as follows:
The EUROCONTROL Institute of Air Navigation Services aims to provide the services that you want and to make your stay in the Institute as enjoyable as possible. All Institute personnel are there to ensure that your stay at the Institute is successful. However, if you do have a complaint (or a
compliment) please tell us. If you are not satisfied with the service we provide or you would like to propose an improvement then please fill out the form at http://www.eurocontrol.int/ians/complaint.html, or contact [email protected] directly.
Although the procedure is clearly marked in all documentation, IANS did not receive formal complaints in 2005.
Customer Satisfaction Report
16 © Copyright 2006 EUROCONTROL
ConclusionIANS aims to be recognised by its stakeholders a Centre of Excellence in ATM Training. We continuously improve our products and processes. We measure the satisfaction of our customers with the products that we provide.
This document presented the results of the satisfaction measurement in 2005. The satisfaction with our ATM Training Products shows an upward trend in all domains for the fourth year in a row. The
satisfaction of the ATC Ab-initio students with the ATC training started increasing again in 2005. In 2005 we have further exploited satisfaction measures for the E-Learning Products and for the Stakeholders that we work with. The results in these domains show a very high degree of stakeholder satisfaction.
END OF DOCUMENT.