cvp monitoring: theory, effectiveness, & alternatives management (b... · cvp monitoring:...
TRANSCRIPT
CVP MONITORING: THEORY,
EFFECTIVENESS, & ALTERNATIVES
Korbin Haycock, M.D., F.A.C.E.P.
Riverside County Regional Medical Center
Department of Emergency Medicine
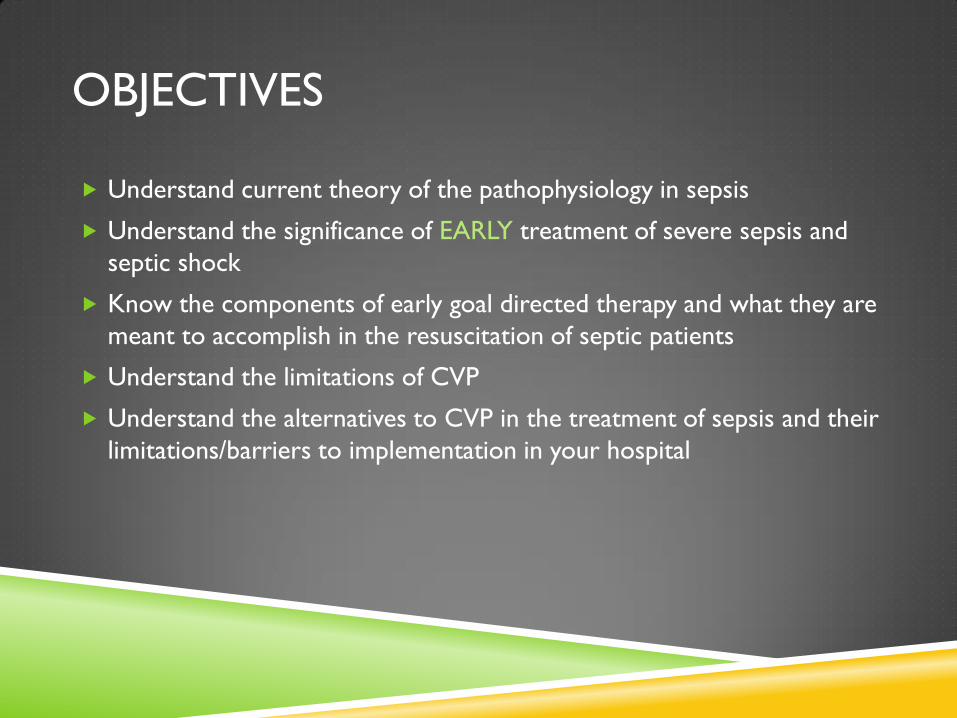
OBJECTIVES
Understand current theory of the pathophysiology in sepsis
Understand the significance of EARLY treatment of severe sepsis and
septic shock
Know the components of early goal directed therapy and what they are
meant to accomplish in the resuscitation of septic patients
Understand the limitations of CVP
Understand the alternatives to CVP in the treatment of sepsis and their
limitations/barriers to implementation in your hospital
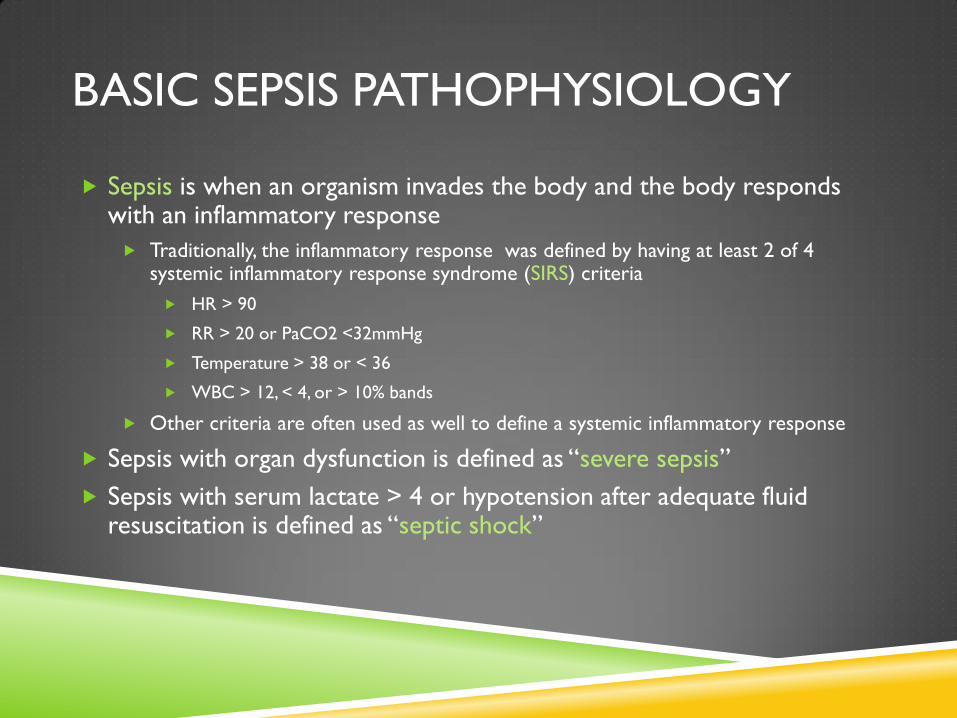
BASIC SEPSIS PATHOPHYSIOLOGY
Sepsis is when an organism invades the body and the body responds with an inflammatory response
Traditionally, the inflammatory response was defined by having at least 2 of 4 systemic inflammatory response syndrome (SIRS) criteria
HR > 90
RR > 20 or PaCO2 <32mmHg
Temperature > 38 or < 36
WBC > 12, < 4, or > 10% bands
Other criteria are often used as well to define a systemic inflammatory response
Sepsis with organ dysfunction is defined as “severe sepsis”
Sepsis with serum lactate > 4 or hypotension after adequate fluid resuscitation is defined as “septic shock”
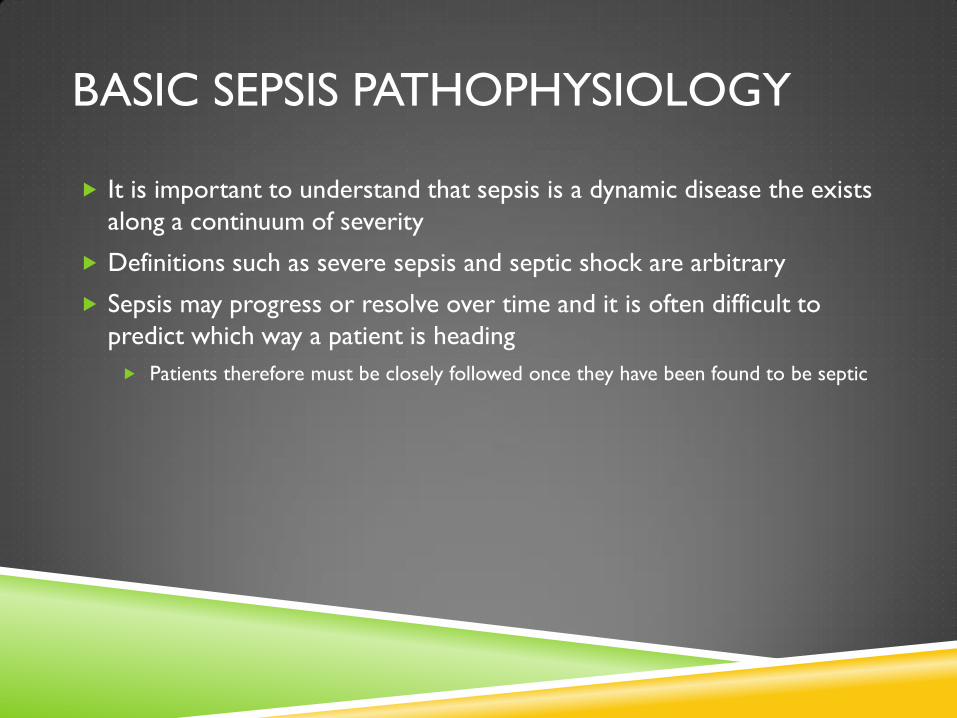
BASIC SEPSIS PATHOPHYSIOLOGY
It is important to understand that sepsis is a dynamic disease the exists
along a continuum of severity
Definitions such as severe sepsis and septic shock are arbitrary
Sepsis may progress or resolve over time and it is often difficult to
predict which way a patient is heading
Patients therefore must be closely followed once they have been found to be septic
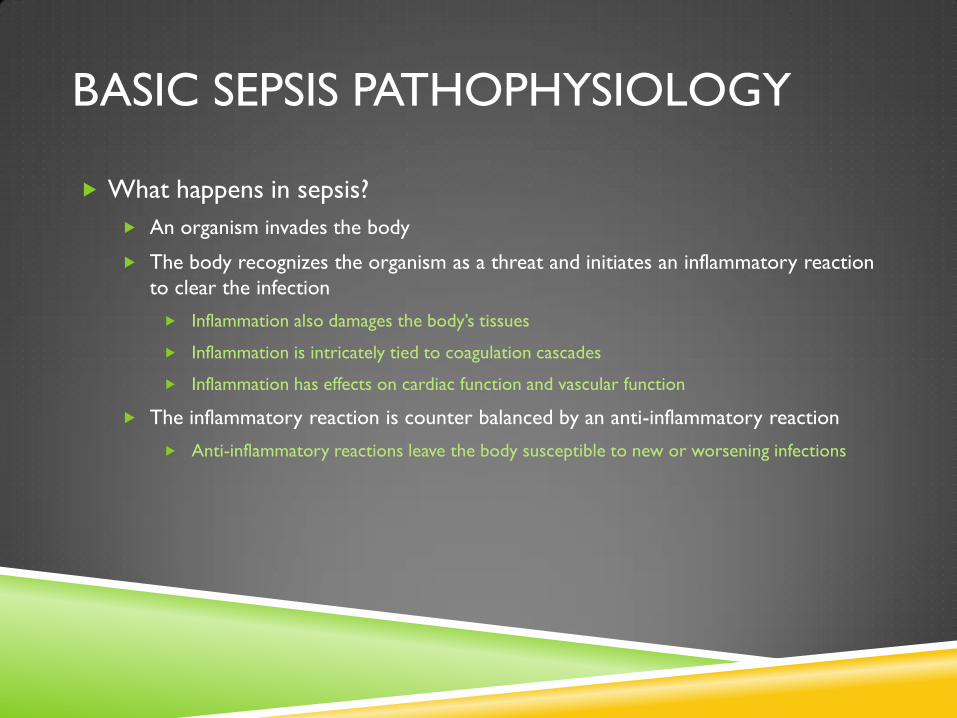
BASIC SEPSIS PATHOPHYSIOLOGY
What happens in sepsis?
An organism invades the body
The body recognizes the organism as a threat and initiates an inflammatory reaction
to clear the infection
Inflammation also damages the body’s tissues
Inflammation is intricately tied to coagulation cascades
Inflammation has effects on cardiac function and vascular function
The inflammatory reaction is counter balanced by an anti-inflammatory reaction
Anti-inflammatory reactions leave the body susceptible to new or worsening infections
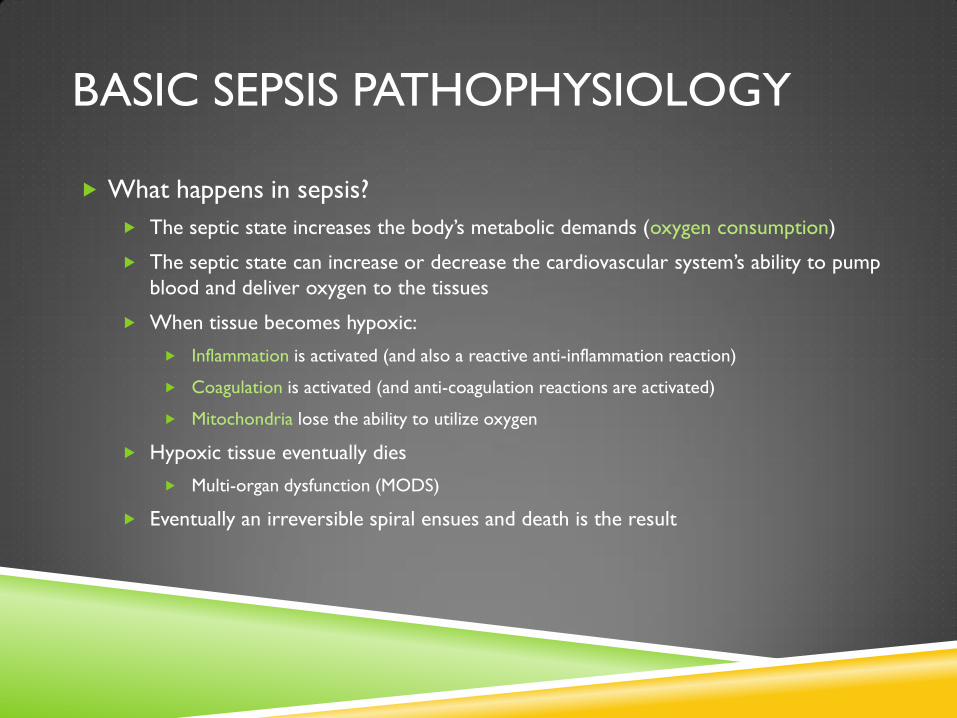
BASIC SEPSIS PATHOPHYSIOLOGY
What happens in sepsis?
The septic state increases the body’s metabolic demands (oxygen consumption)
The septic state can increase or decrease the cardiovascular system’s ability to pump
blood and deliver oxygen to the tissues
When tissue becomes hypoxic:
Inflammation is activated (and also a reactive anti-inflammation reaction)
Coagulation is activated (and anti-coagulation reactions are activated)
Mitochondria lose the ability to utilize oxygen
Hypoxic tissue eventually dies
Multi-organ dysfunction (MODS)
Eventually an irreversible spiral ensues and death is the result
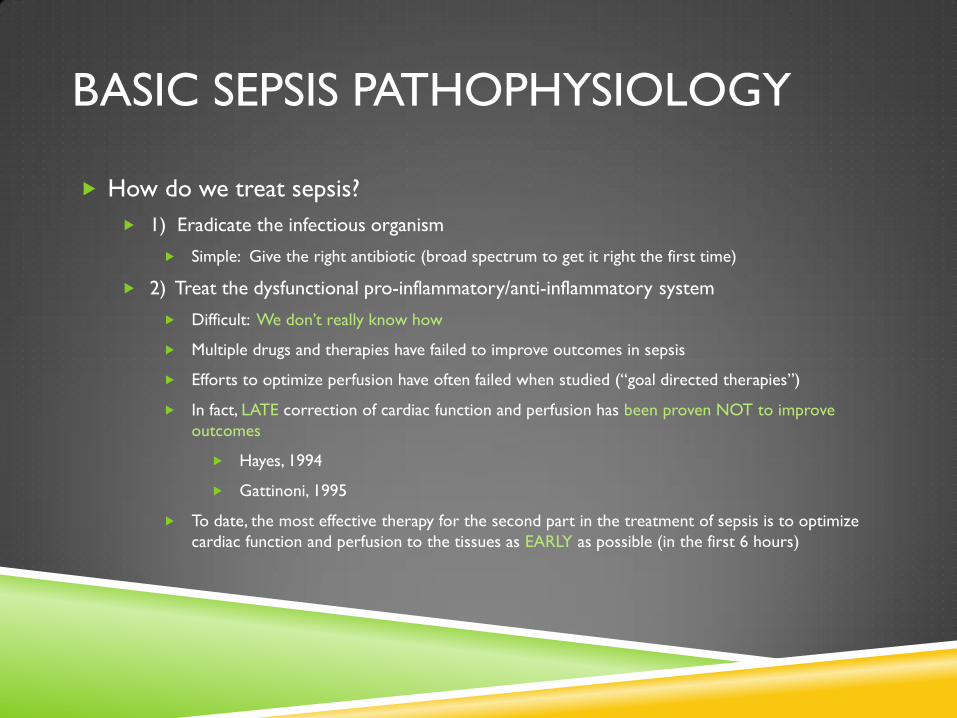
BASIC SEPSIS PATHOPHYSIOLOGY
How do we treat sepsis?
1) Eradicate the infectious organism
Simple: Give the right antibiotic (broad spectrum to get it right the first time)
2) Treat the dysfunctional pro-inflammatory/anti-inflammatory system
Difficult: We don’t really know how
Multiple drugs and therapies have failed to improve outcomes in sepsis
Efforts to optimize perfusion have often failed when studied (“goal directed therapies”)
In fact, LATE correction of cardiac function and perfusion has been proven NOT to improve
outcomes
Hayes, 1994
Gattinoni, 1995
To date, the most effective therapy for the second part in the treatment of sepsis is to optimize
cardiac function and perfusion to the tissues as EARLY as possible (in the first 6 hours)
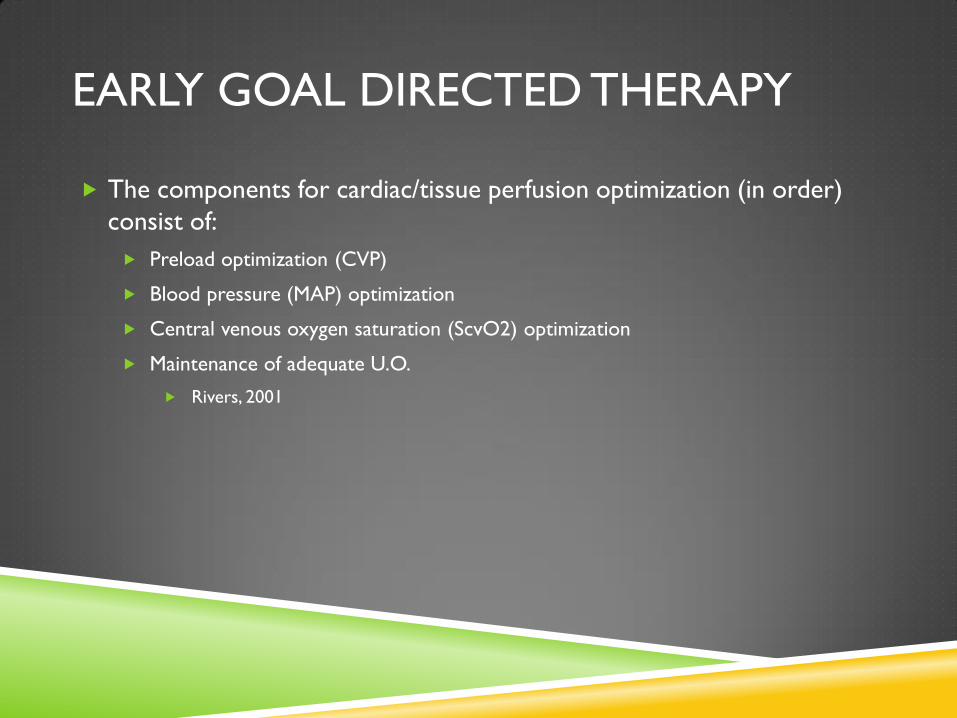
EARLY GOAL DIRECTED THERAPY
The components for cardiac/tissue perfusion optimization (in order)
consist of:
Preload optimization (CVP)
Blood pressure (MAP) optimization
Central venous oxygen saturation (ScvO2) optimization
Maintenance of adequate U.O.
Rivers, 2001

CVP: THE THEORY
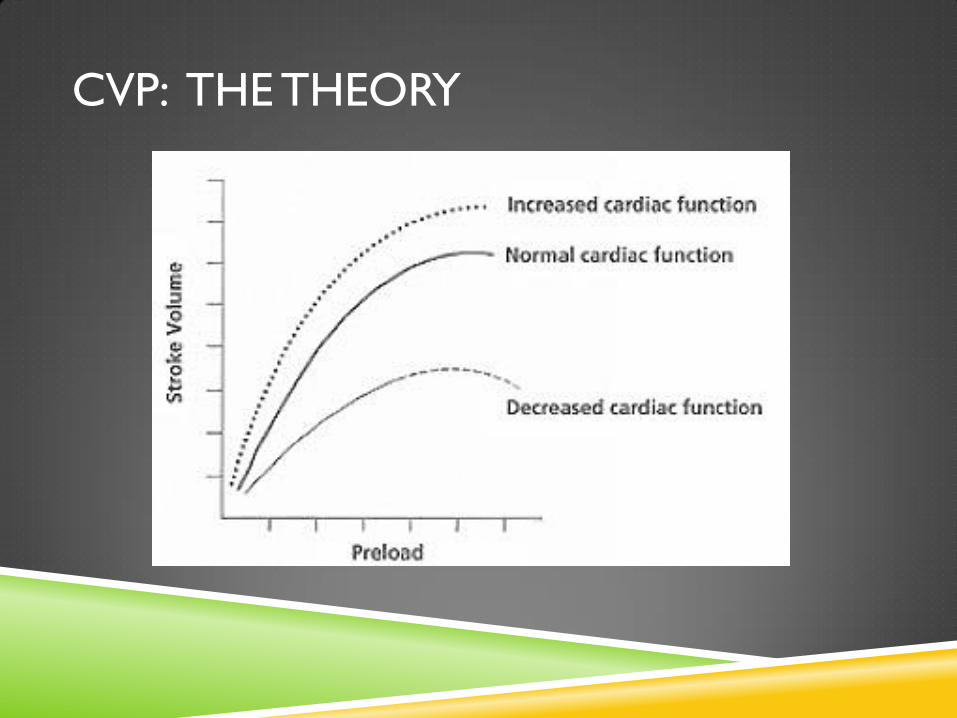
In order to get the heart to pump at its maximal potential, the optimum
amount of “stretch” should be put on the muscle fibers
Too little stretch or too much stretch will negatively effect contractility
“Stretch” on the muscle fibers is called preload
The idea is to do everything you can to make the heart pump well on
its own, before giving drugs to make it work harder
CVP: THE THEORY
CVP: THE THEORY
CVP is a pressure measurement
Preload is a measure of how full (and thus stretched) the ventricle is
before it contracts
Pressure is NOT Preload
CVP is used to give us an idea of what the preload is
It is assumed that measuring pressure near the right atrium will give us an idea of
how much preload there is on the left ventricle before it contracts
When we use CVP to estimate preload we are making multiple assumptions
CVP: THE THEORY
The Assumptions:
1) Pressures correlates with preload
Importantly, given a certain pressure range, we can predict optimum preload
2) Pressures near the right atrium can give us an idea of what the pressures are in the right ventricle and/or the pulmonary circulation
3) Pressures in the right ventricle/pulmonary circulation can give us an idea about pressures in the left ventricle
Once again, we are assuming that certain pressure ranges predict optimum preload
4) Sepsis does not “stiffen” or “relax” the heart muscle/pulmonary circulation to any significant degree that would affect our pressure measurements’ ability to predict preload
5) Our patient does not have any other condition that can affect our pressure measurements’ ability to predict preload
CVP: THE THEORY
The Reality:
Pressures near the right atrium DO correlate with pressures in the right ventricle
and pulmonary circulation
Pressures near the right atrium don’t reliably correlate with pressures in the left
ventricle
Pressures near the right atrium don’t correlate with preload in either the right
ventricle or left ventricle (except at very low pressures)
Sepsis often affects how stiff (and resistant to stretch) the ventricle is
Patients often have medical conditions that affect ventricular stiffness
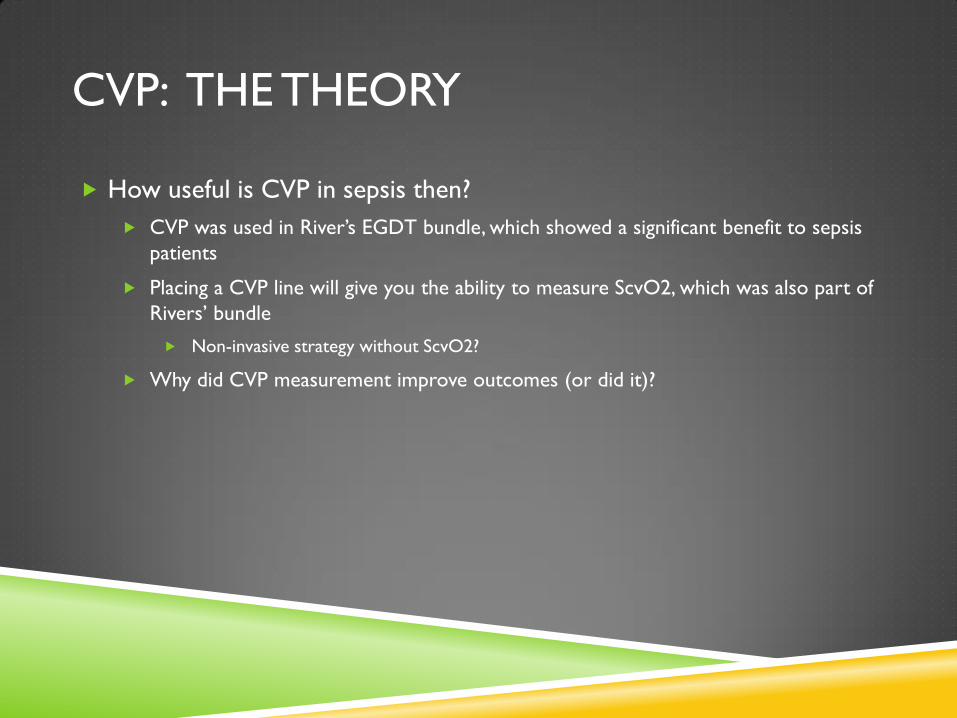
CVP: THE THEORY
How useful is CVP in sepsis then?
CVP was used in River’s EGDT bundle, which showed a significant benefit to sepsis
patients
Placing a CVP line will give you the ability to measure ScvO2, which was also part of
Rivers’ bundle
Non-invasive strategy without ScvO2?
Why did CVP measurement improve outcomes (or did it)?
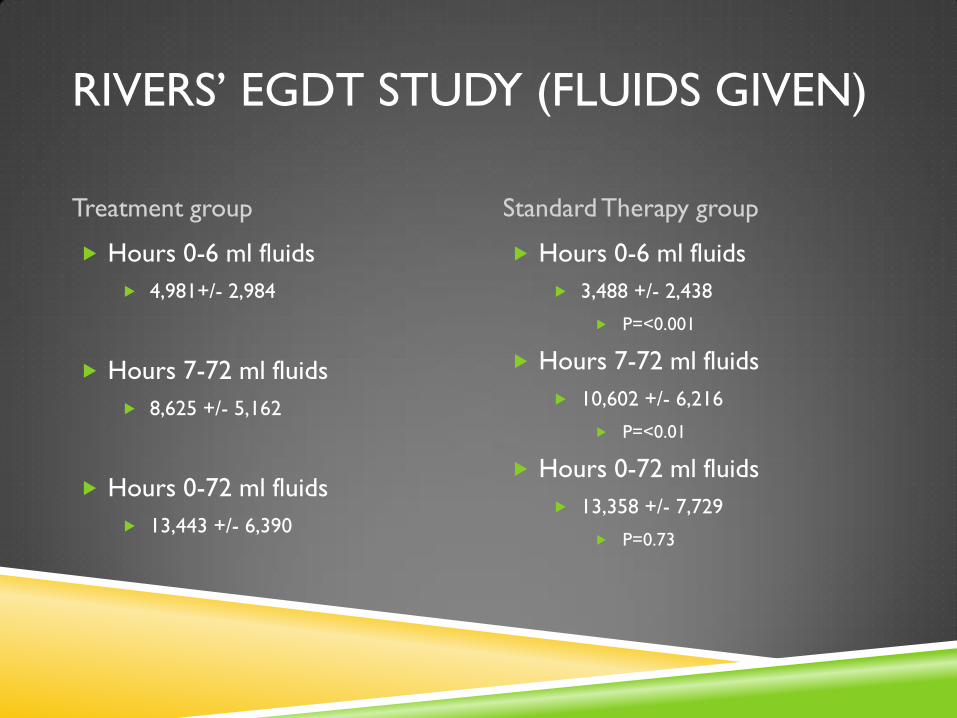
RIVERS’ EGDT STUDY (FLUIDS GIVEN)
Treatment group Standard Therapy group
Hours 0-6 ml fluids
4,981+/- 2,984
Hours 7-72 ml fluids
8,625 +/- 5,162
Hours 0-72 ml fluids
13,443 +/- 6,390
Hours 0-6 ml fluids
3,488 +/- 2,438
P=<0.001
Hours 7-72 ml fluids
10,602 +/- 6,216
P=<0.01
Hours 0-72 ml fluids
13,358 +/- 7,729
P=0.73
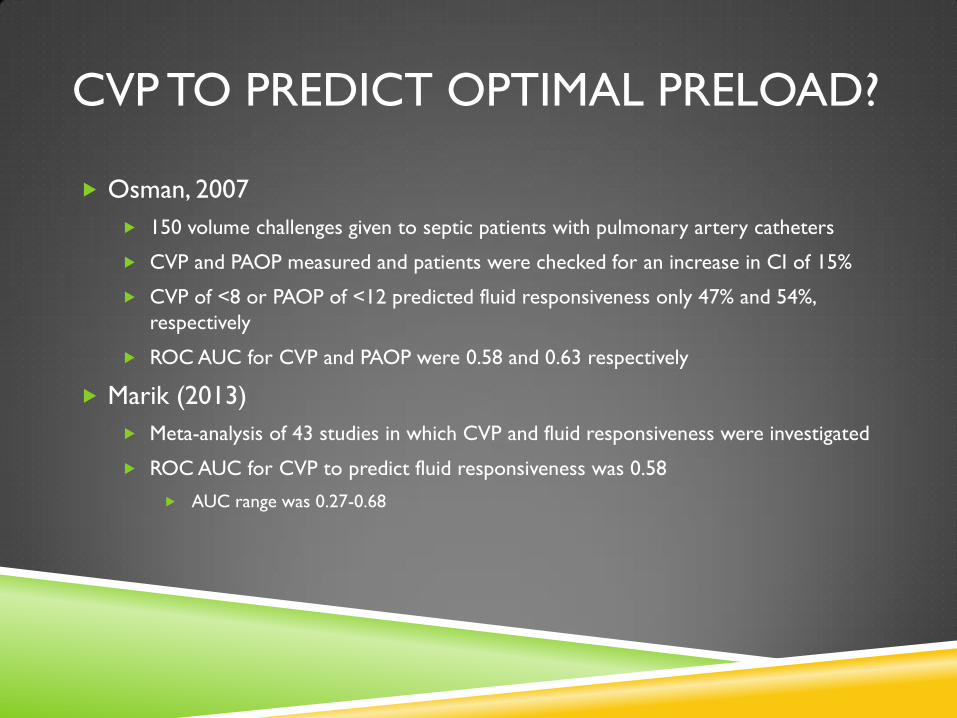
CVP TO PREDICT OPTIMAL PRELOAD?
Osman, 2007
150 volume challenges given to septic patients with pulmonary artery catheters
CVP and PAOP measured and patients were checked for an increase in CI of 15%
CVP of <8 or PAOP of <12 predicted fluid responsiveness only 47% and 54%,
respectively
ROC AUC for CVP and PAOP were 0.58 and 0.63 respectively
Marik (2013)
Meta-analysis of 43 studies in which CVP and fluid responsiveness were investigated
ROC AUC for CVP to predict fluid responsiveness was 0.58
AUC range was 0.27-0.68
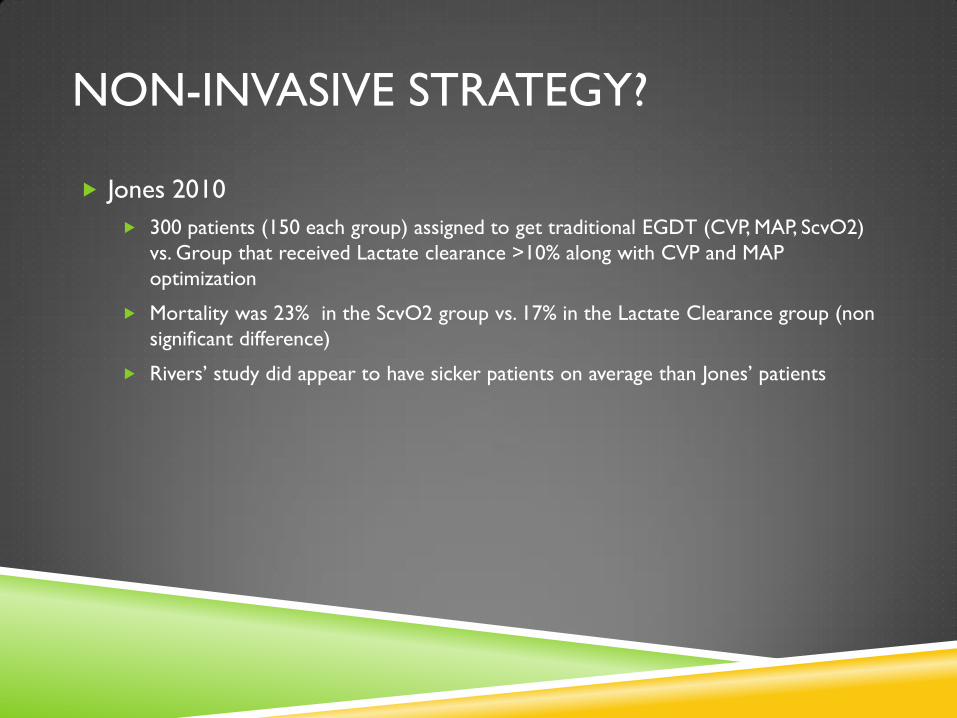
NON-INVASIVE STRATEGY?
Jones 2010
300 patients (150 each group) assigned to get traditional EGDT (CVP, MAP, ScvO2)
vs. Group that received Lactate clearance >10% along with CVP and MAP
optimization
Mortality was 23% in the ScvO2 group vs. 17% in the Lactate Clearance group (non
significant difference)
Rivers’ study did appear to have sicker patients on average than Jones’ patients
BEYOND CVP
So CVP doesn’t predict how much fluid we need to give patients, but when used in a bundle, outcomes improve
Lactate clearance is non-inferior to ScvO2 (unless, at least, the patients are no sicker than Jones’ patients)
What alternatives do we have to CVP measurement?
Are there tools we can use that give us an idea of what preload actually is?
Are the tools easy to use?
Do the tools require a lot of training?
Are the tools more expensive then CVP monitoring?
Are the tools as safe as CVP?
THE TOOLS
Ultrasound for CVP
Ultrasound of the IVC and IVC collapse
Stroke volume monitoring
Stroke volume variability and fluid challenge
Aortic or brachial artery peak flow measurement
Stroke volume variability and fluid challenge
Bioreactance cardiac output monitoring
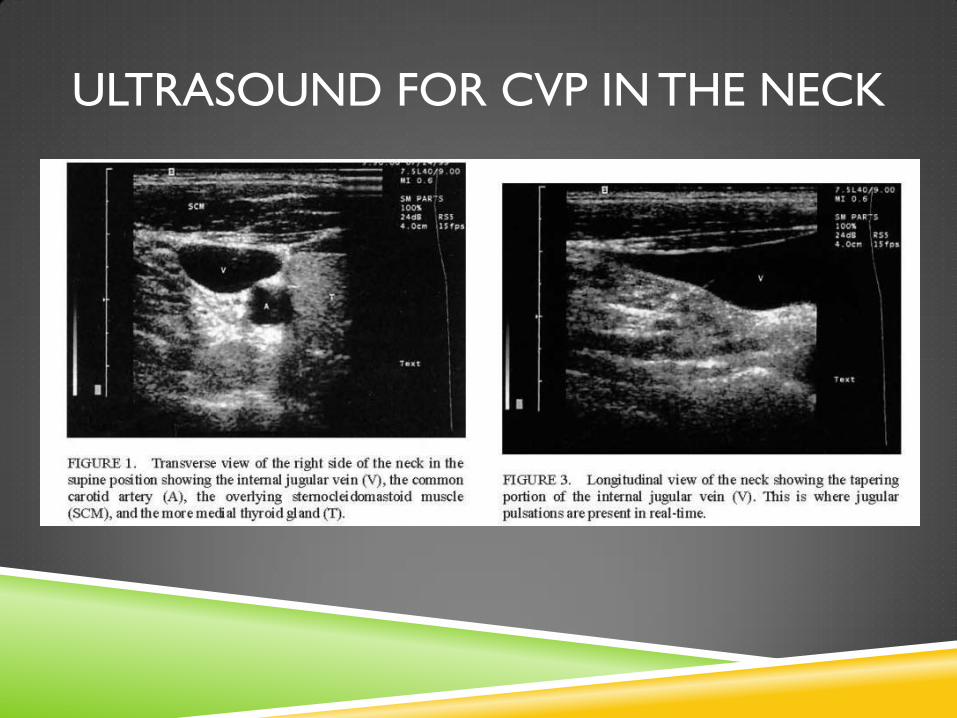
ULTRASOUND FOR CVP IN THE NECK
IVC ULTRASOUND
Can be used as a surrogate for CVP or as its own estimate of optimal
preload
IVC collapse may have additional use in that is gives
respiratory/hemodynamic information related to fluid status
IVC can be interpreted in two clinical scenarios
1) Evaluation of low fluid status
2) Reassurance that the patient has not reached maximal fluid tolerance
IVC potentially can be used in intubated patients or patients with
spontaneous respirations
IVC U/S AS SURROGATE FOR CVP
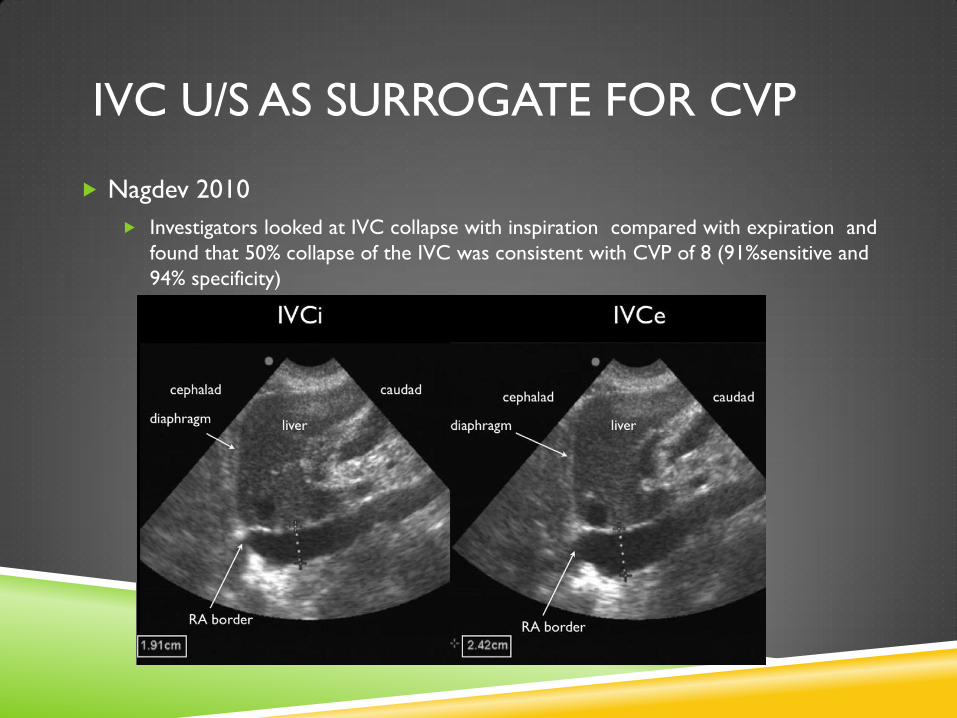
Nagdev 2010
Investigators looked at IVC collapse with inspiration compared with expiration and
found that 50% collapse of the IVC was consistent with CVP of 8 (91%sensitive and
94% specificity)
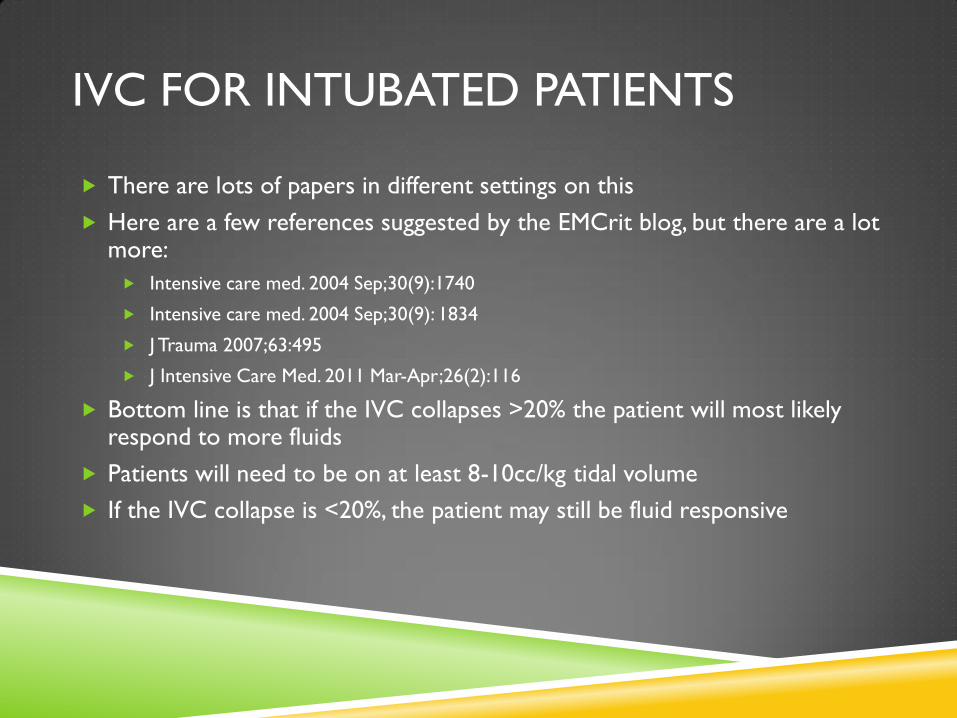
IVC FOR INTUBATED PATIENTS
There are lots of papers in different settings on this
Here are a few references suggested by the EMCrit blog, but there are a lot more:
Intensive care med. 2004 Sep;30(9):1740
Intensive care med. 2004 Sep;30(9): 1834
J Trauma 2007;63:495
J Intensive Care Med. 2011 Mar-Apr;26(2):116
Bottom line is that if the IVC collapses >20% the patient will most likely respond to more fluids
Patients will need to be on at least 8-10cc/kg tidal volume
If the IVC collapse is <20%, the patient may still be fluid responsive
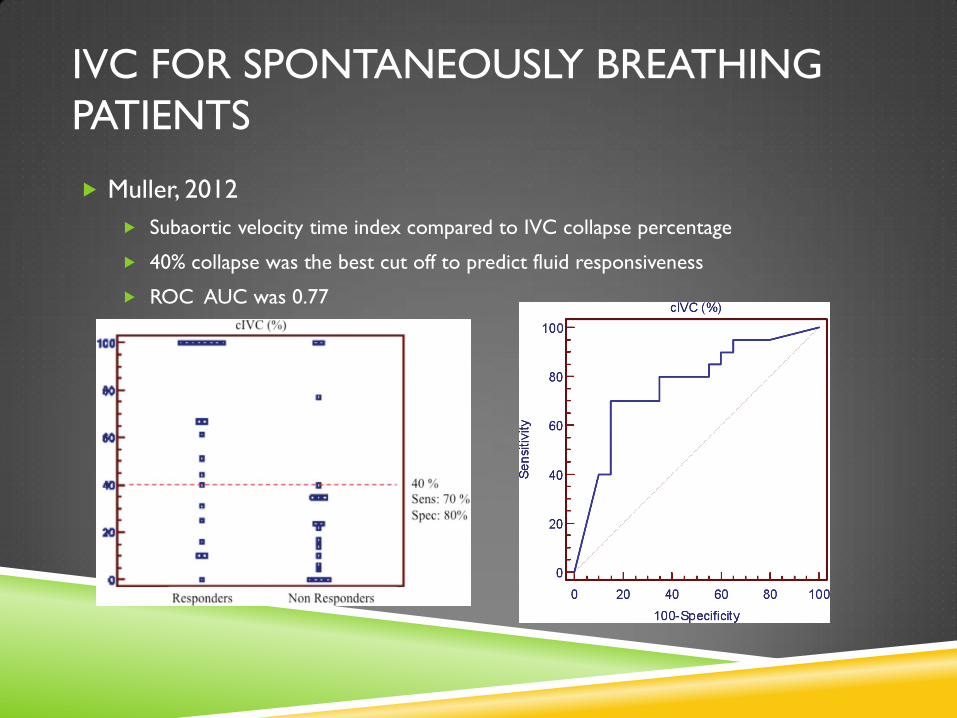
IVC FOR SPONTANEOUSLY BREATHING
PATIENTS
Muller, 2012
Subaortic velocity time index compared to IVC collapse percentage
40% collapse was the best cut off to predict fluid responsiveness
ROC AUC was 0.77
CARDIAC OUTPUT OR SV MONITORING
Multiple methods are available to detect changes in SV or CO to either fluid challenges or ventilator breaths
Lithium Dilution & Pulse Contour Analysis (LiDCO)
Transpulmonary Thermodilution and Pulse Contour Analysis (PiCOO)
Pressure recording analytic Method (PRAM)
Flotrac
Others as well
(Marik, 2013)
Many methods are too invasive/complicated to make them practical for use in the ED
Many require special training and can be user dependent, thus limiting usefulness
FLOTRAC
Requires a radial artery line or a femoral artery line
Samples arterial pressure waveform every 20 seconds at 1,000 Hz
Gives SVV, SV, CO, SVI, and CI values
If slaved to a CVP line, can give you SVR and SVRI as well
Can be used to assess optimal fluid status in 2 ways:
Intubated patients with Stroke Volume Variation
Non-intubated patients with SV response to fluid challenge
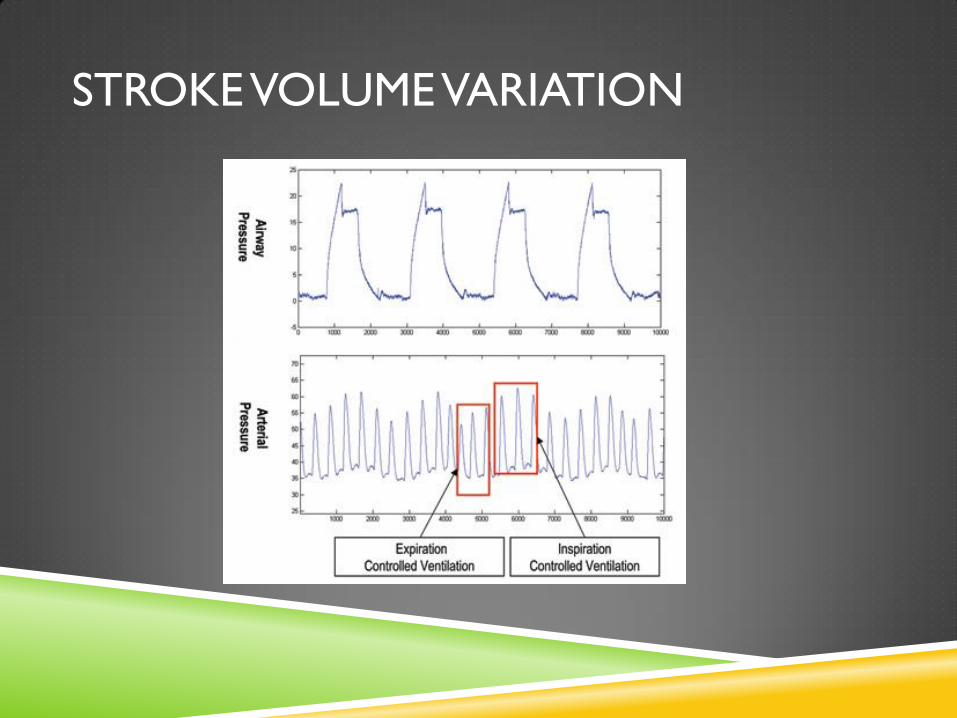
STROKE VOLUME VARIATION
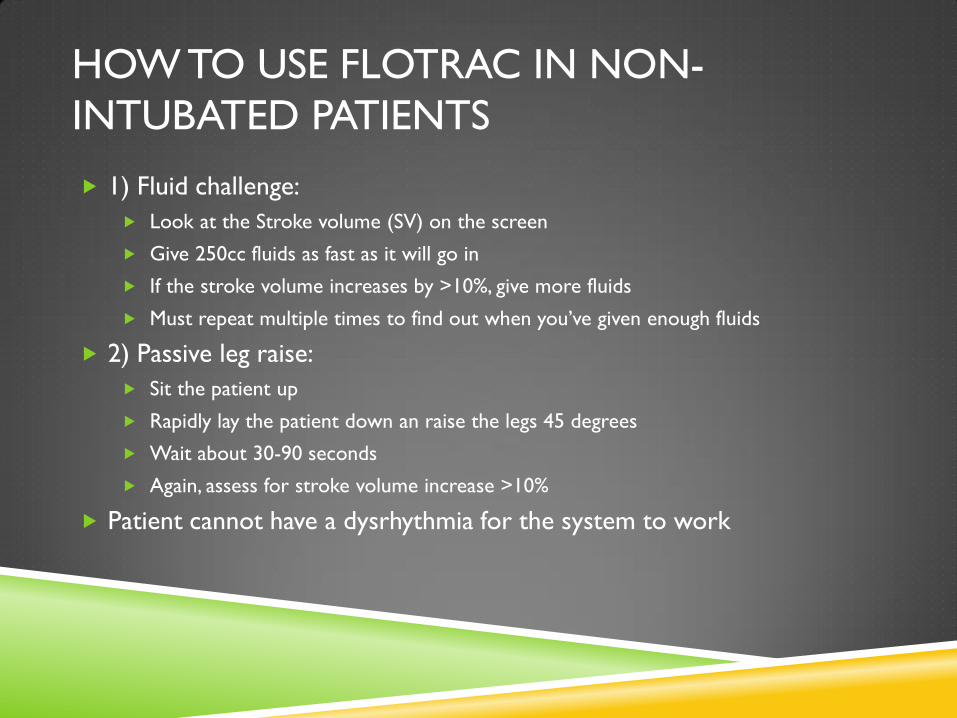
HOW TO USE FLOTRAC IN NON-
INTUBATED PATIENTS
1) Fluid challenge:
Look at the Stroke volume (SV) on the screen
Give 250cc fluids as fast as it will go in
If the stroke volume increases by >10%, give more fluids
Must repeat multiple times to find out when you’ve given enough fluids
2) Passive leg raise:
Sit the patient up
Rapidly lay the patient down an raise the legs 45 degrees
Wait about 30-90 seconds
Again, assess for stroke volume increase >10%
Patient cannot have a dysrhythmia for the system to work
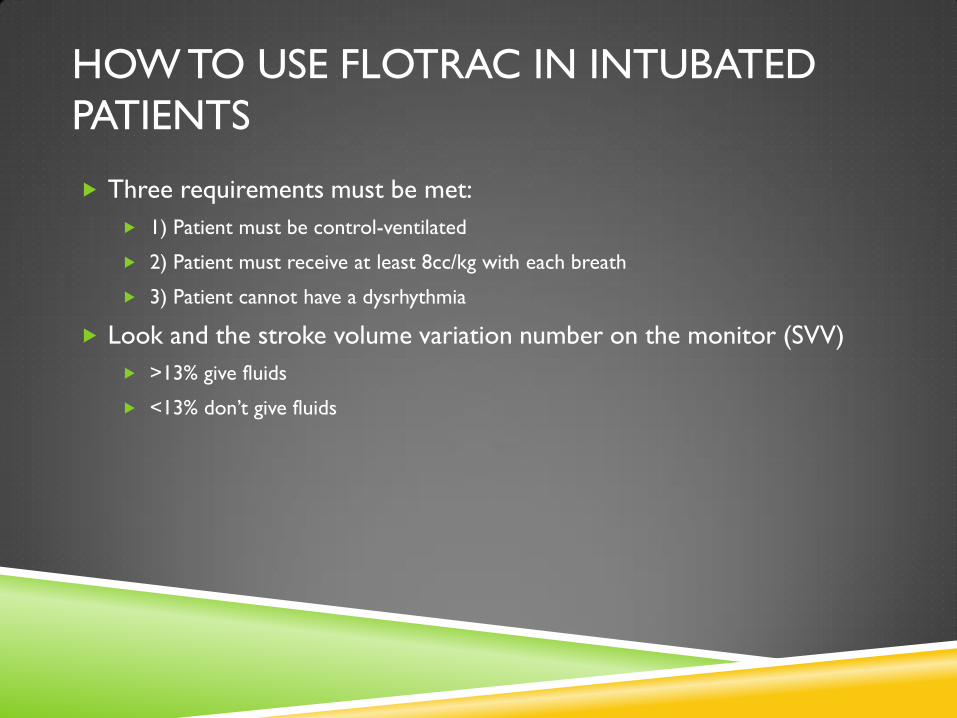
HOW TO USE FLOTRAC IN INTUBATED
PATIENTS
Three requirements must be met:
1) Patient must be control-ventilated
2) Patient must receive at least 8cc/kg with each breath
3) Patient cannot have a dysrhythmia
Look and the stroke volume variation number on the monitor (SVV)
>13% give fluids
<13% don’t give fluids
HOW ACCURATE IS FLOTRAC?
FloTrac appears to predict fluid responsiveness accurately in patients
whose SVR is normal
When SVR is low (as in advanced sepsis) FloTrac has had problems with
reliability to predict fluid responsiveness
3rd generation software has attempted to address this issue
De Backer, 2011
Compared thermodilution techniques of CO monitoring (gold standard) to 2nd and
3rd generation FloTrac software in patients with septic shock and low SVR
2nd generation FloTrac failed to accurately predict fluid responsiveness
3rd generation had significant, but weak differences in accuracy to predict fluid
responsiveness if the radial artery was used but not if the femoral artery was used
BRACHIAL ARTERY PEAK FLOW
MEASUREMENT (INTUBATED PATIENTS)
Patients were intubated and had no dysrhythmia
Brachial artery evaluated 5-10 cm above the antecubital fossa.
Probe is angled < 60 degrees to artery
Velocity waveform measured from center of the artery
Peak velocity variation was equal to:
100 x (Vpeakmax-Vpeakmin)/((Vpeakmax +Vpeakmin)/2)
Peak velocity variation > 10% predicted fluid responsiveness
(Garcia, 2009)
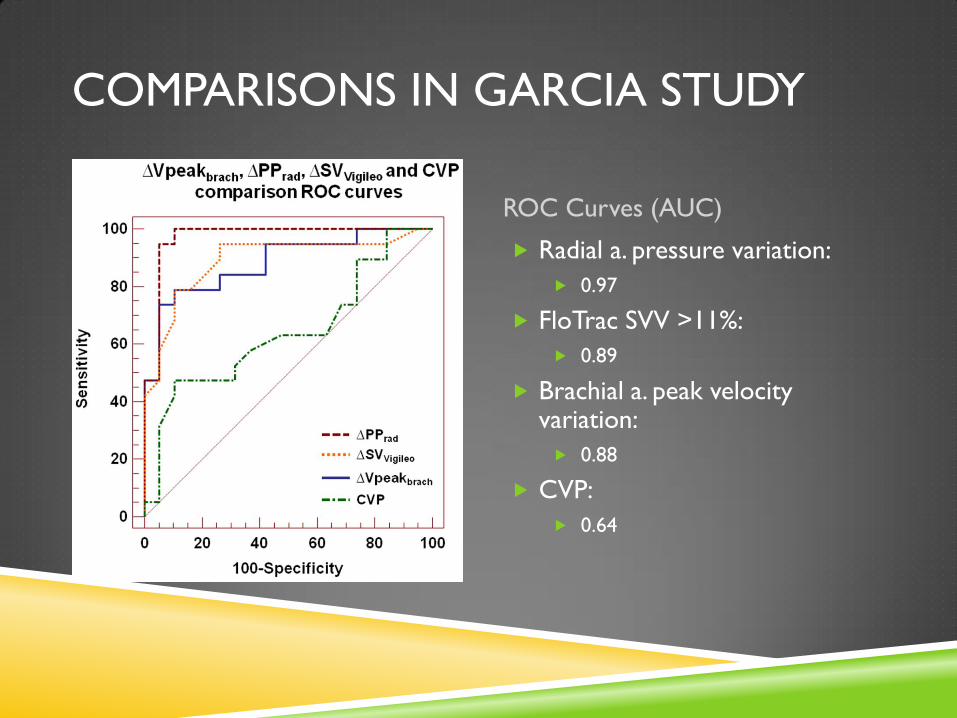
COMPARISONS IN GARCIA STUDY
ROC Curves (AUC)
Radial a. pressure variation:
0.97
FloTrac SVV >11%:
0.89
Brachial a. peak velocity variation:
0.88
CVP:
0.64
SUMMARY
Sepsis is a dynamic process that requires close monitoring to avert an
irreversible progression that leads to death
Early and aggressive treatment of sepsis is the only proven method to
improve mortality
EGDT components are CVP, MAP, ScvO2 and O.U., however CVP has
been proven not to be helpful to guide fluid management
Alternative methods to guide fluid management exist, but each have
their limitations. A complete and vigilant assessment of the patient and
aggressive early interventions remain the best course of action in the
treatment of septic shock

REFERENCES Barbier et al. Respiratory changes in inferior vena cava diameter are helpful in predicting fluid responsiveness in ventilated septic patients.
Intensive Care Med. 2004 Sept;30(9):1740-6
Baumann et al. Resuscitation. Estimation of central venous pressure by ultrasound. 2005 Feb;64(2):193-9
Carr BG, Dean AJ, Everett WW, et al. Intensivist bedside ultrasound (INBU) for volume assessment in the intensive care unit: a pilot study. J Trauma 2007;63:495–500; discussion 500–502
de Backer B, Marx G, Tan A, Junker C, Van Nuffelen M, Hu¨ ter L, Ching W, Michard F, Vincent JLArterial pressure-based cardiac output monitoring: a multicenter validation of the third-generation software in septic Patients. Intensive Care Med DOI 10.1007/s00134-010-2098-8
Feissel et al. The respiratory variation in inferior vena cava diameter as a guide to fluid therapy. Intensive Care Med. 2004 Sept;30(9): 1834-7
Garcia et al. Brachial artery peak velocity variation to predict fluid responsiveness in mechanically ventilated patients. Critical Care 2009 Sept;13(5)
Gattinoni et al. N Engl J Med 333:1025, 1995
Hayes et al. N Engl J Med 330:1717, 1994
Machare-Delgado et al. Inferior vena cava variation compared to pulse contour analysis as predictors of fluid responsiveness: a prospective cohort study. J Intensive Care Med . 2011Mar-Apr;26(2):116
Marik et al. Does Central Venous Pressure Predict Fluid Responsiveness? An Updated Meta-Analysis and a plea for some Common Sense. Crit Care Med 2013;41:1774-1781
Marik. Noninvasive Cardiac Output Monitors: A State of the Art Review. Journal of Cardiothoracic and Vascular Anesthesia. 2013 Feb;27(1):121-134
Muller et al. Respiratory variations of inferior vena cava diameter to predict fluid responsiveness in spontaneously breathing patients with acute circulatory failure: need for a cautious use. Critical Care 2012, 16:R188
Nagdev et al. Emergency department bedside ultrasound measurement of the caval index for noninvasive determination of low central venous pressure. Ann Emerg Med. 2010;55:290-295
Osman et al. Cardiac filling pressures are not appropriate to predict hemodynamic response to volume challenge. Crit Care Med 2007;35(1)
Rivers E, Nguyen B, Havstad S, et al. Early goal-directed therapy in the treatment of severe sepsis and septic shock. N Engl J Med 2001,345:1368-137