cw retail cool streets report
TRANSCRIPT

Explore the hottest urban retail markets across North America
COOL
2016 Edition

This is a question that clearly has
no objective answer — ask 100
people to define what they think
is cool and you are likely to get
100 different answers. What
people define as cool is clearly a
matter of subjective personal
taste, and even if you could
define it, it would only be for a
moment in time because cool is a
moving target. For economists or
real estate analysts who usually
strive to work in the realm of
numbers and hard data,
answering the question “what is
cool?” almost seems frivolous.
Except that it is not.
In fact, for retail the stakes couldn’t be higher. Ignore cool at your own peril.
WHAT IS COOL?
2 CUSHMAN & WAKEFIELD

CO
NT
EN
TS
2 Introduction
4 Top 15 Cool Streets
12 Brooklyn / Sunset Park
14 Chicago / Logan Square
16 Cincinnati / Over-the-Rhine
18 Denver / RiNo
20 Los Angeles / Silver Lake
22 Miami / Wynwood
24 Minneapolis / North Loop
26 Phoenix / Roosevelt Row
28 Richmond / Carytown
30 San Diego / East Village
32 San Francisco / Jackson Square
34 St. Louis / Delmar Loop
36 Toronto / West Queen West
38 Vancouver / Mount Pleasant / Main Street
40 Washington D.C. / Shaw
42 Report Methodology
43 Top 100 Cool Streets
3Cool Streets Report

THE COOL STREETS OF NORTH AMERICA
Retail lives and dies by cool. Concepts connect,
build loyalty, and grow by being cool. They also
disengage, wither, and die by not being cool. If
nothing else, the history of fashion is the history
of what is cool and what is desirable.
But, as anyone in retail will tell you, fashion can be a fickle mistress. Every generation has had its own definition of cool, but cool constantly evolves. In today’s media-saturated age some may argue that the issue of what is cool has never been more important to consumers, nor has it ever been as likely to change with lightning speed as it is now.
If retailers live and die by cool, the same also holds true of retail properties, shopping centers and entire neighborhoods. Whenever we speak about real estate, the issue of location and a number of other factors come into play, but the reality is that cool matters. In an age of frugal consumers, e-commerce encroachment, and vast gaps in performance between trophy malls and Class B and C centers, cool matters now more than ever.
How Do You Define Cool?“I know it when I see it…”
Supreme Court Justice Potter Stewart describing his threshold test for obscenity in the landmark 1964 case Jacobellis v. Ohio
4 CUSHMAN & WAKEFIELD

The last few months have been a scary time for many retail categories. For mall-based apparel and hard goods chains, it has been downright brutal. These challenges have also been particularly acute for many chains historically active at mid-level price points. For them, retail bankruptcies and store closures are up, and publicly traded entities are under more pressure than ever from Wall Street to “right-size” for the new omni-channel world of e-commerce by shuttering storefronts. Some speculate that the bricks-and-mortar retail world of tomorrow will be about discount and luxury, no middle.
Discount and off-price retail now accounts for the lion’s share of growth in North America — primarily in suburban centers. In both the United States and Canada, the expansion of top luxury and upscale concepts continues, albeit at an increasingly conservative pace.
However, a new breed of retailers is connecting with Millennial consumers largely on their own terms and, more often than not, at that seemingly disappearing mid-market price point. This phenomenon is not happening in the malls, whether they are thriving trophy centers or dying Class C properties. Nor is it happening in urban high street markets like Fifth Avenue, the Magnificent Mile, Rodeo Drive, or Union Square, or even in suburban community, neighborhood, and power centers where discount is the name of the game. It is not happening on the High streets or on the Main streets, but on what we call the Cool Streets.
In this report, we explore the rise of dozens of exciting new retail districts across the United States and Canada in urban (and urbane) neighborhoods profoundly impacted
by the rise of the Millennial consumer. Make no mistake about it, these are largely “hipster” neighborhoods notable for their embrace of the unconventional, the out-of-the-box, and the cool. In some cases, these are longstanding bohemian enclaves known as focal points for local arts, music or LGBT communities. But most of the neighborhoods featured in this report are up-and-coming trade areas driven by dramatic demographic shifts and the strong Millennial preference for urban living. The renaissance occurring on these Cool Streets has been driven by an explosion of new restaurant and retail concepts that connect with the seemingly elusive Millennial consumer like no other. The story of this growth alone is noteworthy. However, what may be most important is that in an age of increasing retail uncertainty, Cool Streets serve as an incubator of sorts for what will likely be the hottest new retail concepts of tomorrow.
The Cool Streets of North America report details these trends and lists what we believe to be the 100 most important Cool Streets in North America right now. We will
It’s not happening on the High Streets or on the Main Streets, it’s happening on what we call the Cool Streets.
5Cool Streets Report

also attempt to do the impossible: to give an objective perspective on the eternally subjective issue of cool.
What is a Cool Street?
The cycle of growth, decay and rebirth in our cities is nothing new. Macro trends such as the rise of the suburbs in the 1960's, new urbanism in the 2010's, or countless waves of immigration over the past couple of hundred years have impacted and sped those timetables along. However, at the neighborhood level, real estate costs have always been the primary force driving this
cycle. That has not changed and it never will. But while neighborhood amenities, particularly cultural ones, have always played a role in urban renewal efforts, many neighborhoods have gone through such transformations without the issue of “hipness” ever entering into the discussion.
Most great cities have had their traditional bohemian enclaves where literature, the arts, and culture (or counter-culture) have flourished. But the rise and fall of those neighborhoods typically was slow, organic and non-commercial. It was more likely to be driven by philosophical or intellectual movements than by any sort of demographic trend. And while these neighborhoods tended to attract unique niche subcultures, their appeal rarely carried over to the
mainstream. This is where the current Cool Streets trend differs. Hip neighborhoods are now a mainstream aspiration.
The Cool Street Cycle: From Edgy to Prime Hipness to Mainstream
The pattern of urban renewal has not changed much over the past 50 years; a neighborhood endures a period of neglect, rising crime and social ills drive home values down, cheap real estate eventually lures new residents, and the neighborhood stabilizes and then rebounds as additional waves of residents and new businesses move in. Historically, this process often took decades. What also might be most different about the current Cool Street trend is the sheer speed with which a neighborhood can reinvent itself. Some of the Cool Street neighborhoods in our report have moved from “troubled” to “prime hipness” in a matter of just a few years. Likewise, the path from “prime hipness” to “gone mainstream” has never been shorter. Just ask the former hipster residents of Williamsburg.
Brooklyn’s Williamsburg neighborhood might be the poster child for the current Cool Streets movement. Through the 1990's, it was a mostly working class immigrant community that struggled with varying degrees of neglect and urban decay over the previous four decades. While Manhattan apartment rents consistently grew at an annual rate of 10% or more from 1995 to 2000, rates remained relatively flat in Williamsburg. In fact, housing costs there typically averaged anywhere from one third to one half of those across the East River. On paper the trends were a world apart, not just the reality of one subway stop.
Cool Streets are serving as an incubator of sorts for what will likely be the hottest new retail concepts of tomorrow...
THE COOL STREETS OF NORTH AMERICA
6 CUSHMAN & WAKEFIELD

Starting around 1999, Williamsburg began to see an influx of new residents priced out of Manhattan. This initial wave consisted of a mix of creatives, artists, musicians, hipsters and the LGBT community willing to take their chances in a neighborhood that could best be described at that time as “edgy.” They brought with them a counterculture philosophy that infused Williamsburg’s commercial corridors. New bars, music venues, art galleries and boutiques catering to their tastes sprang up in the area. The Cool Street cycle was set in motion, and Williamsburg’s appeal grew — as did its rents. Within just a few years, residential rents in Williamsburg were on par with top Manhattan apartment rates. National chain retailers engaged in bidding wars over prime corner shop space while
quirky independents were priced out. Hipsters began fleeing to all other points Brooklyn bemoaning that “Williamsburg was over.” For the record, we disagree with that statement. Though it may now be quite pricey, Williamsburg is still a Cool Street. But has it gone mainstream? Absolutely.
Cool Street = Millennial Street
Millennials have overtaken Baby Boomers as the largest single age demographic in both the United States (85 million) and Canada (10 million). While other key demographic shifts will continue to play out in both countries, this single factor will do more to shape the retail landscape over the next few years than any other trend. The rise of the Cool Streets is just one of the ways that this is playing out.
Millennials Are Urban...
At the heart of the Cool Streets trend is the fact that Millennials consistently demonstrate a preference for urban living. According to the Urban Land Institute (ULI), 46% of Millennials would prefer to live in an urban setting, compared to 24% for suburban and 30% for rural environments.
Millennials prefer cities, but affordability is increasingly becoming an issue.
Source: Urban Land Institute: America in 2015: A ULI Survey of Views on Housing, Transportation, and Community, 2015.
46%
7Cool Streets Report

This corresponds with U.S. Census Bureau statistics that reflect the increasing urbanization of America; between 2000 and 2010, the U.S. urban population grew by 12.1% compared to an overall growth rate of 9.7% for this same period. The most recent Census estimates indicate that urban growth outpaced suburban growth in 33 of the 51 largest U.S. cities last year.
Millennials are at the center of this trend. In its poll, the ULI found that Millennials consistently ranked a number of typically urban community attributes as preferences —and did so at numbers that far outpaced averages for other age groups or all age groups together. Walkability ranked as important for 54% of Millennials, compared to 50% for all adults. Convenient public transportation ranked high for 39% of Millennials, while only 32% of the overall population saw this as critical. Meanwhile, 44% of Millennials ranked access to shopping and entertainment as one of their top priorities compared to just 36% of Generation X-ers and 43% of Baby Boomers.
But there is evidence that the trend of urbanization is starting to slow. The Census Bureau estimates that this trend peaked in 2011 when 26.7% of U.S. population growth was focused in urban areas. Last year, estimates put this number at 20.0%. Affordability is the likely culprit of this decline. Our tracking of apartment rents for Downtown or Prime CBD markets across 16 top U.S. markets between 2010 and 2015 indicates an average increase of 33.2%.
On the surface the issue of affordability might seem to contradict the strength that we are reporting in these emerging new Cool Street markets. But the issue of affordability has actually been one of the driving forces behind this movement. With few exceptions, the Cool Street districts springing up are not in tonier, long-established neighborhoods areas where rents and housing costs are increasingly prohibitive. Nearly all of the Cool Streets in our survey are transitional neighborhoods where more affordable rents have served as an initial catalyst for growth.
Cool Street Experiential
In May 2016, Whole Foods opened the first of its Whole Foods 365 stores in Los Angeles’ Silver Lake neighborhood. The Whole Foods 365 concept appears
Their success has come from the fact that they engage their consumers on the most basic experiential level—they keep their stores interesting.
THE COOL STREETS OF NORTH AMERICA
8 CUSHMAN & WAKEFIELD

tailor-made for Cool Streets; the stores use a smaller urban footprint — typically in the 20,000 to 30,000 square foot (sf) range — and require less parking than normal Whole Foods locations. Much of its inventory consists of internal brands, so Whole Foods 365’s price points are cheaper than what you would find at namesake Whole Foods stores. This is important because it connects with one of the touchstones of the Millennial consumer: frugality. Yet perhaps most interesting of all is the fact that Whole Foods 365 stores will feature ever-changing pop-up retail space in their stores and will consider anything from vinyl record retailers to tattoo parlors as temporary tenants.
Since debuting in 2011, Shinola has grown at a rate of five or six new stores annually and will close in on 30 locations by the end of this year. This Detroit-based chain has been one of the most active Cool Streets players from Miami to Portland and beyond (the company recently opened a London store and are planning Canadian boutiques as well). Boutiques typically range from 2,000 to 5,000 sf of space. But what exactly is the concept? Shinola sells watches. It also sells bicycles, leather goods, journals, and some apparel. But Shinola is definitely not just a watch or a bicycle or a leather goods store. Shinola is a lifestyle store for Millennials.
As a group, Millennials seem to value experience over material goods. In June 2016, MetLife released a report that analyzed expenditure data from the U.S. Bureau of Labor Statistics that found that Millennials spend 15% more of their disposable income on experiences than generations past. Because of this, hard goods retailers must find ways to create meaningful shopping experiences if they want to truly engage with the Millennial consumer.
At its most basic level, experiential retail is about simply being interesting. This as where many of the smaller chains and independents active on the Cool Streets have an advantage over their larger, less nimble competitors. Smaller regional chains such as Lizard Thicket or independents like House of Woo find it easier to experiment with their fall line and take chances than the Abercrombies or Gaps or Ann Taylors.
Larger chains, particularly the publicly-traded ones, are not only challenged by size and scope, but also the necessity of answering to an increasingly jittery Wall Street. Too often, the result of these limitations is retailers with shelves full of homogenous goods in increasingly empty homogenous stores situated in dying homogenous malls. The irony in all of this is that by being too conservative while navigating this new challenging landscape of omnichannel retail, brick-and-mortar retailers may actually inadvertently drive their customers online by simply being boring.
9Cool Streets Report
Cool Street Cantinas
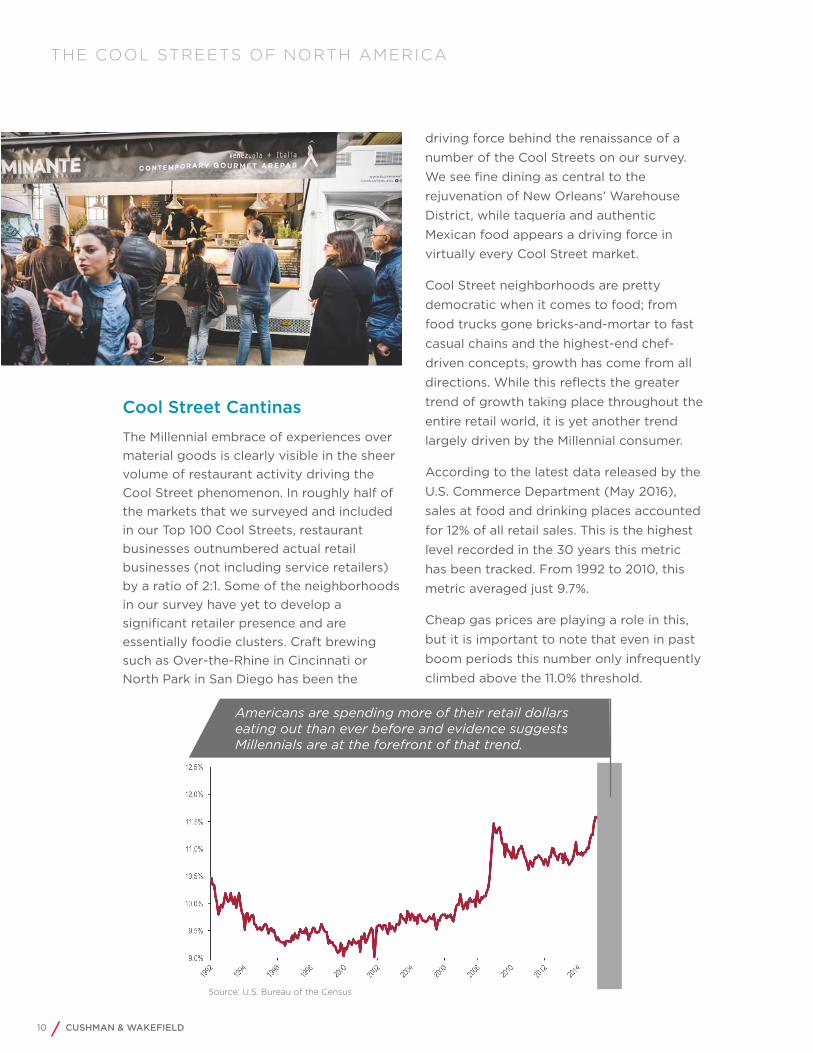
The Millennial embrace of experiences over material goods is clearly visible in the sheer volume of restaurant activity driving the Cool Street phenomenon. In roughly half of the markets that we surveyed and included in our Top 100 Cool Streets, restaurant businesses outnumbered actual retail businesses (not including service retailers) by a ratio of 2:1. Some of the neighborhoods in our survey have yet to develop a significant retailer presence and are essentially foodie clusters. Craft brewing such as Over-the-Rhine in Cincinnati or North Park in San Diego has been the
driving force behind the renaissance of a number of the Cool Streets on our survey. We see fine dining as central to the rejuvenation of New Orleans’ Warehouse District, while taqueria and authentic Mexican food appears a driving force in virtually every Cool Street market.
Cool Street neighborhoods are pretty democratic when it comes to food; from food trucks gone bricks-and-mortar to fast casual chains and the highest-end chef-driven concepts, growth has come from all directions. While this reflects the greater trend of growth taking place throughout the entire retail world, it is yet another trend largely driven by the Millennial consumer.
According to the latest data released by the U.S. Commerce Department (May 2016), sales at food and drinking places accounted for 12% of all retail sales. This is the highest level recorded in the 30 years this metric has been tracked. From 1992 to 2010, this metric averaged just 9.7%.
Cheap gas prices are playing a role in this, but it is important to note that even in past boom periods this number only infrequently climbed above the 11.0% threshold.
Source: U.S. Bureau of the Census
THE COOL STREETS OF NORTH AMERICA
Americans are spending more of their retail dollars eating out than ever before and evidence suggests Millennials are at the forefront of that trend.
10 CUSHMAN & WAKEFIELD

These statistics include all U.S. consumers, and could simply be a trend impacting all Americans. We do think that is the case, however, as Millennials are likely at the forefront of this trend. To prove this theory, below we sliced the numbers up along generational fault lines. Sure enough, we saw some clear distinctions. With most Millennials just entering their prime earning years, these trends will probably continue in the near future.
Cool Street Incubators
The retailers active on Cool Streets are a mix of the new and the old (often with a twist). Clicks-to-bricks players such as Warby Parker, Bonobos, Marine Layer and others have been active, as have the occasional upscale mall or lifestyle center retailer. Meanwhile, brands like Kit and Ace and Shinola have flourished by putting Cool Street locations at the forefront of their real estate strategies.
Independent retailers remain the heart and soul of the Cool Street phenomenon. Small chains, start-ups and little guys are those most thriving in those locations. Rents play a big role in this. Across the 100 markets included in this year’s report, average rents in Cool Street neighborhoods stood at roughly 55% the average asking rate of the nearest Class A mall or High Street shopping district. One of the challenges of these neighborhoods is that most of them
are in transition; where they stand in the Cool Street cycle dictates everything. Their rising popularity may bring a new wave of tenants, but it could be at the cost of their role as incubators.
Looking ahead, many more mainstream retailers will likely look for Cool Street shop space in the months and years to come. This holds particularly true for beleaguered mall apparel concepts. Many of these chains are under immense pressure from Wall Street to close underperforming locations as they “right-size” for e-commerce; the mandate is to reduce portfolios to only the Class A or trophy locations with the highest sales. However, Class A landlords know this and many are aggressively raising rents. This situation may force many traditional mall tenants to rethink their real estate strategies and begin looking for creative alternatives. Cool Streets will be one of them.
...where they stand in the Cool Street cycle dictates everything. Their rising popularity may bring a new wave of tenants, but it could be at the cost of their role as incubators.
Retail Sales at Food Service and Drinking Places As a Percent of Total Retail Sales
1995 – 2005 (Generation X) 9.5%
2006 – Current (Millennials) 10.8%
2010 – Current (Millennials, Post-recession) 11.1%
11Cool Streets Report
BR
OO
KLY
N
NY
As Williamsburg has become more fashionable and pricey (and mainstream), its bohemian residents have been driven to other neighborhoods in search of more affordable rents. The same thing has happened with many of the independent retailers that initially set in motion Williamsburg’s retail renaissance. In fact, the question should not be which Brooklyn neighborhood is going to emerge as the next Cool Street, but which neighborhoods? Certainly, cases can be made for Bedford-Stuyvesant, Bushwick, Crown Heights, Fort Greene and a few others. But this report is not just about identifying the next hipster residential enclaves, it is also about finding the emerging Cool Streets with the most retail growth potential.
Sunset Park is situated on Brooklyn’s western waterfront and is bordered by Park Slope and Greenwood Heights to the north, Borough Park to the east and Bay Ridge to the south. Largely an industrial neighborhood since the early 1900s, Sunset Park had been in decline for much of the latter half of the past century. That began to change a couple of years ago with the opening of Bush Terminal Park and a number of rehabilitation projects along the waterfront — the most substantial of which has been the redevelopment of Industry City.
The Industry City complex consists of roughly 6.0 million square feet (sf) of formerly vacant industrial space redeveloped as creative mixed-use office, retail, and industrial. The retail component alone totals 500,000 sf and is already home to Bed Bath & Beyond, BuyBuy Baby, Cost Plus, and Saks Off Fifth (expected to open later this year). These retailers do not usually appear on a roster of Cool Street tenants, but Industry City offers an urban rarity: existing, large footprint availability in a desirable marketplace. Industry City has reportedly leased all but 1.8 million sf of its 6.0 million sf of space to more than 400 companies, with tenants like West Elm, the Brooklyn Nets and Time joining e-commerce and tech players like Shyp and BaubleBar.
Residential realtors already report skyrocketing demand for row houses on the perimeter of Industry City, while numerous loft projects backfilled long-vacant industrial space. Because of the big box retail deals, one might question whether independent retailers will be active here at all.. Even as more mainstream retail box concepts continue to ink deals at Industry City, a number of independents, start-ups, and mom-and-pops have been actively looking on Sunset Park’s prime corridors. With retail asking rents generally ranging from $75 to $175 per sf, expect even more interest from a steady stream of retailers of all stripes in this area in the future.
26.9% Millennial Population
$81,529 Average Household Income
Sunset Park: Where Boxes and Independents Co-exist

Even as box concepts continue to ink deals at Industry City, a number of independents have been actively looking on Sunset Park’s prime corridors.
13Cool Streets Report
HIP-O-METER
Select Hot Spots
CH
IC
AG
OWhen discussing North America’s top Cool Street neighborhoods, Chicago’s Logan Square deserves to be near the top of the list. Logan Square is characterized by tree-lined streets, stately greystones and large bungalow-style housing. The neighborhood surrounds namesake Logan Square Park on Chicago’s near northwest side at the three-way intersection of Kedzie and Logan Boulevards and Milwaukee Avenue. Logan Square’s early residents were of English or Scandinavian origin. Subsequent waves of growth were driven by Polish, Jewish and eventually Mexican and Puerto Rican immigrants, making this one of the most ethnically diverse of the Cool Street neighborhoods featured in this report.
Logan Square’s fortunes have long been tied to its more well-known neighbor, Wicker Park. That neighborhood had been the center of Chicago’s independent art and music scene going back to the early 1990s. But as Wicker Park became more popular, its rents started pricing out its arts community. Beginning approximately 20 years ago many of these creative types began moving to the edgier (and cheaper) environs of Logan Square. That influx of artists has helped to drive projects like the
recently restored Hairpin Lofts. This LEED-certified, six-story flatiron, landmark building at the intersection of Milwaukee and Diversey offers live/work residences for creatives.
While Logan Square’s emergence as a Cool Street began with the arts community nearly two decades ago, the momentum behind this neighborhood’s growth has kicked in fairly recently. The arrival of the Logan Square Farmer’s Market in 2007 was a major touchstone, but the real growth has been since 2010 and it has largely been driven by new restaurants and bars. Multiple eateries have popped up ranging from fast casual to upscale, and from some of Chicago’s most notable new white tablecloth eateries to former food truck concepts gone bricks and mortar. Logan Square’s dining scene now is a mix of creative concepts, dive bars, craft breweries and cocktail lounges. Meanwhile, the city has made some additional investments to improve transit, bike infrastructure, and spur economic development. A number of large residential developments are in the pipeline and this will surely drive further growth in the immediate future. Not surprisingly, many in the arts community are already concerned that Logan Square may be on the verge of mainstreaming… but that is the cost of popularity.
34.3% Millennial Population
$84,529 Average Household Income
Logan Square: Midwest Headquarters of Hip

15Cool Streets Report
Logan Square’s dining scene now is a mix of creative concepts, dive bars, craft breweries and cocktail lounges.
HIP-O-METERSelect Hot Spots

CIN
CIN
NA
TI
Over-The-Rhine (OTR) is a historic neighborhood located just north of Downtown Cincinnati. It is one of the largest urban historic districts in the United States and is known for its abundance of architecturally significant buildings and homes. The area has a rich cultural scene due to its proximity to the Art Academy of Cincinnati, the Cincinnati Symphony/Pops, the Cincinnati Opera, the School for Creative and Performing Arts, Memorial Hall, and other artistic points of interest. Historic Findlay Market (Ohio’s oldest continuously operated public market) was founded in 1852 and is of OTR’s most cherished institutions. Surrounding Findlay Market is the Brewery District, which celebrates OTR’s brewing heritage (the neighborhood was originally settled by German immigrants in the mid-1850s). By the early 2000s the neighborhood had bottomed out with the highest crime rate in the city and a landscape littered with more than 500 vacant buildings and 700 vacant lots. It was so bad that director Steven Soderbergh chose the OTR as the location for the gritty drug scenes in his 2000 film Traffic.
36.9% Millennial Population
$49,466Average Household Income
Over-the-Rhine: A Craft Brewed Neighborhood
The revitalization of OTR began in 2003 through the formation of the Cincinnati Center City Development Corporation (3CDC), which combined public and private resources to spur economic development of distressed properties. To date, 3CDC has invested more than $330 million into renovation, construction, and development. That investment has resulted in the opening of over 130 new businesses (almost 40 in 2015 alone), revitalizing the craft brewing industry in Cincinnati through the likes of Taft’s Ale House, and the Christian Moerlein and Rheinegeist breweries. OTR has also become a top destination for foodies. The Food Network has highlighted local eateries Senate (gourmet hot dogs), Bakersfield (tacos, whiskey and tequila) and Taste of Belgium (Belgian waffles) on Diners, Drive-Ins and Dives.
We are currently tracking retail rents that range from $16 to $40 per sf, but expect these to keep climbing. OTR is a market that is still in its ascendency. Developers remain active in the area with over 1,000 new residential units either under construction or in the planning stages. Meanwhile, we continue to see millennials embracing the live/work/play experience of urban Cool Street neighborhoods.

17Cool Streets Report
That investment has resulted in the opening of over 130 new businesses (almost 40 in 2015 alone), revitalizing the craft brewing industry in Cincinnati…
HIP-O-METER
Select Hot Spots

DE
NV
ER
The River North Arts District, or RiNo as locals refer to it, is situated immediately north of Downtown Denver at the junction of Interstates 70 and 25. Coors Field and the LoDo (Lower Downtown) neighborhood mark RiNo’s southwestern boundary, while Interstate 25 acts as its western border. Interstate 70 serves as the neighborhood’s northern edge, while the Curtis Park and Five Points neighborhoods lie immediately to the east. The RiNo neighborhood is traversed by the South Platte River, with the lion’s share of the District’s retail situated on the east side of the river. Brighton Boulevard, Larimer and Downing Streets are the primary retail arteries, though a number of other commercial corridors have seen increased activity as this region has undergone its transformation.
Denver’s arts community was already established in RiNo prior to 2010, converting many of the district’s vacant warehouses to loft and gallery space. But residential growth throughout Denver’s urban core began to explode around 2010. This first wave played out primarily in the adjacent Downtown and LoHi (Lower Highlands) neighborhoods, but as these
areas redeveloped with higher-end multifamily housing, residential growth increasingly moved northeast to the RiNo District. According to the Brookings Institute, Denver has become the number one destination for millennials, with its Downtown neighborhoods expected to grow by 18% over the next five years.
A number of notable projects in RiNo have helped to speed the area’s retail evolution over the past few years, including The Source, a 26,000 SF artisanal food hall, which opened in a former steel foundry building on Brighton Boulevard in late 2013. Other food additions have included everything from high-end local favorite The Populist to authentic Mexican restaurant Los Chingones. RiNo has also increasingly become a focal point of Denver’s music and nightlife scene through a mix of live venues. Yet even with this recent prosperity, RiNo stands as one of the few areas remaining in Denver’s urban core with available land and vacant buildings. Because of this, development is skyrocketing, with ongoing projects ranging from office (Zeppelin Station) to housing (Taxi), hospitality (The Source Hotel), and mixed-use (DriveTrain—a multifamily, retail/restaurant and boutique hotel).
39.6% Millennial Population
$69,790Average Household Income
RiNo (River North) Arts District: Ground Zero for Mile High Millennials

19Cool Streets Report
HIP-O-METER
RiNo has also increasingly become a focal point of Denver’s music and nightlife scene through a mix of live venues.
Select Hot Spots

LOS
AN
GEL
ESThe Silver Lake neighborhood is located northwest of downtown Los Angeles around the city reservoir for which it is named. Silver Lake is bordered by Los Feliz to the northwest, Atwater Village and Elysian Valley to the northeast, Echo Park on the southeast, and East Hollywood to the west. Tom Mix and Walt Disney both built movie studios here in the 1920s and 1930s. Encouraged by city planners, residential development took center stage by the mid-1930s. Thanks to many now world-renown architects (Lautner, Neutra, Wright, etc.) active in Silver Lake in the 1930s, the neighborhood is esteemed for its inventory of architecturally significant homes (largely in the Spanish Mediterranean style). By the late 1970s, Silver Lake became the center of Los Angeles’ gay leather subculture. Over the past two decades, the young Hollywood set has increasingly embraced Silver Lake, with such notable actors as Rachel McAdams and Ryan Gosling taking up residences here at various times.
While the retail districts in most of the Cool Street report are literally focused on one actual cool street corridor, Silver Lake actually has a number of major thoroughfares of note. Significant retail corridors exist on Glendale, Santa Monica and Silver Lake Boulevards, Hyperion Avenue and a few other streets. Whole Foods chose a location on Glendale Boulevard for the rollout of its very first Whole Foods 365 store in May 2016. However, Sunset Boulevard is arguably the dominant retail corridor when it comes to boutique and restaurant hot spots. Chic French boutique A.P.C. recently opened there, and the street is also home to some of the most acclaimed eateries in the area (Night + Market Song, Cliff’s Edge, El Cochinito, among others).
Silver Lake is a mature trade area with little undeveloped land remaining. We estimate current overall retail vacancy in the area at just under 5.0%. Our survey found a wide range of current asking rents ($30 to $80 per sf); however, what little modern space does exist has typically leased quickly at the highest end of that range, if not beyond. That being said, the older retail product that lines Silver Lake’s many retail corridors is prime for redevelopment activity.
26.6.% Millennial Population
$80,375 Average Household Income
Silver Lake: Where Hollywood and Hip Collide

21Cool Streets Report
Whole Foods chose a location on Glendale Boulevard for the rollout of its very first Whole Foods 365 store in May 2016.
HIP-O-METER
Select Hot Spots

The Wynwood Arts & Fashion District is a rapidly emerging neighborhood located in the heart of Miami’s east side renaissance. Wynwood is located north of Downtown Miami and is bordered by Interstate 95 to the west, North Miami Avenue to the east, NW 29th Street to the north and NW 20th Street to the south. Once one of Miami’s thriving warehouse districts, thanks to the former Florida East Coast Railroad, these structures started becoming vacant in the 1970s as freight transport increasingly shifted away from rail. During the drug wars of the early 1980s Wynwood sank into a tailspin of urban decay and neglect that lasted into the 2000s. During the building boom of the early 2000s, Wynwood emerged as a “Cool Street” among millennials and creatives, attracting art galleries and event planners who were seeking relief from escalating market rents and found value in re-purposing large warehouse buildings. Its industrial history has provided great open spaces and dramatic exterior canvasses for creativity, and by 2005, the efforts of a number of groups resulted in street art and murals replacing graffiti stains. Miami’s explosive population growth since 2010 has further catapulted the area. As many of the market’s warehouses go through the adaptive reuse process, their physical qualities have attracted a variety of retailers from home accessories to contemporary apparel.
Today, Wynwood is both an incubator for creative office users and magnet for hip, emerging brands that appreciate its edgy quality; as well as a focal point for established brands that see Wynwood as the only place they fit in the greater Miami market. Fueled by small, functional spaces, manageable rents and the audience it attracts, Wynwood has quickly become Miami’s answer to neighborhoods like SoHo of the 1980s and the Meatpacking District. The main retail artery serving Wynwood is Northwest 2nd Avenue, but side streets, like NW 25th and NW 26th Streets have emerged as strong options to the higher-rent demands of the avenue.
Asking retail rents range from $45 to $80 PSF NNN. With a steady stream of new investment from established national and regional developers, this Cool Street has begun to expand in all directions. Its next wave of development is underway via large-scale mixed-use developments, which will increase the daytime population and further bolster pedestrian traffic.
26.9% Millennial Population
$44,350 Average Household Income
Wynwood: South Florida’s Arts Mecca
MI
AM
I

23Cool Streets Report
…lower rents in Wynwood could prove attractive to many cutting edge chains… Wynwood is unlikely to ‘go mainstream’ this cycle.
HIP-O-METER
Select Hot Spots

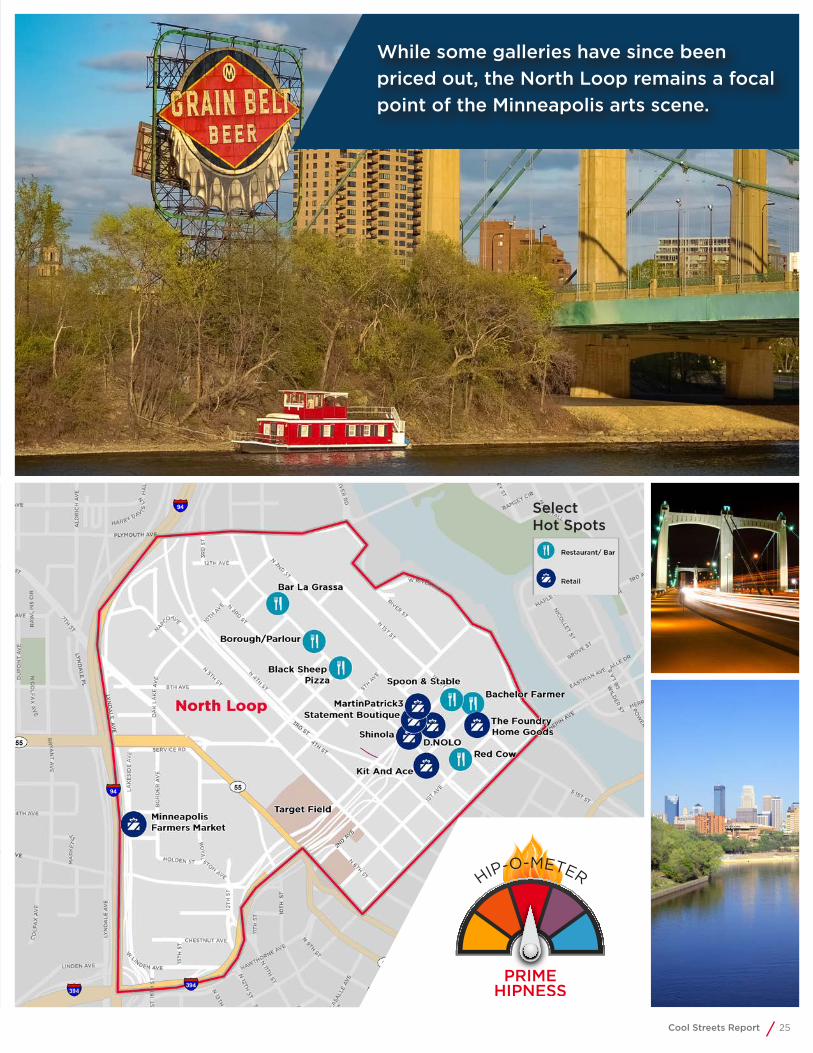
The Warehouse Historic District, or the North Loop, is situated immediately northwest of Downtown Minneapolis. The neighborhood is bounded by Hennepin Avenue to the southeast, North 4th Street to the southwest, Plymouth Avenue to the northwest and the Mississippi River to the northeast. Historically, the North Loop was the center of Minneapolis’ river trade and home to a large railyard and inland port. Most of the warehouses here were built in the early 20th century for the storage and wholesaling of goods related to milling and manufacturing. Today, more than 60 of these structures still exist — most six to eight stories high and enjoying a new life as high-end residential lofts. Washington Avenue is the prime retail corridor; however, nearly all of the North Loop’s major commercial streets have seen increasing retail activity.
Starting in the 1960s, significant portions of the Warehouse District were abandoned and left to decay. It was not until the mid-1990s that the North Loop experienced its revival as artists and creative types started moving in, converting long-vacant industrial spaces to lofts and art galleries. Throughout the early 2000s, this neighborhood saw a slow, but
steady, stream of redevelopment projects as Downtown workers increasingly discovered the area. The construction of Target Field on the Warehouse District’s southwestern edge in 2010 helped to spur another wave of in-migration, this time dominated by young, millennial workers and supported by a booming Downtown office market. About 1,500 new multifamily units have come online since that period alone. Another 530 units are either already under construction or in the final planning stages. With Minneapolis’ local economy far outpacing most other Midwestern economies, we do not see this ending anytime soon.
While some of the thrift shops and galleries that initially spearheaded this neighborhood’s revival have since been priced out, the North Loop remains a focal point of the Minneapolis arts scene. But it now also has emerged as one of the city’s most vibrant restaurant and bar hot spots as well. Demand for shop space has also skyrocketed. Recent arrivals to join longtime local boutiques and design studios include national upstart chains like Filson, Kit and Ace, and Shinola. While rents are climbing, we are still tracking a basic range between about $18 and $42 per sf, leaving plenty of room for growth.
39.4% Millennial Population
$61,767 Average Household Income
North Loop / Warehouse Historic District: Loft Revival
MIN
NE
AP
OL
IS
25Cool Streets Report
While some galleries have since been priced out, the North Loop remains a focal point of the Minneapolis arts scene.
HIP-O-METER
Select Hot Spots

As Phoenix, a once sleepy railroad stop, began to grow with new residents in the early 1900s, East Roosevelt became one of the first neighborhoods to emerge. By the 1920s, it was a streetcar suburb with developers building Craftsman and California bungalows as well as architecturally significant Period Revival houses. The area started to decline beginning in 1960, however, due to the construction of the local freeway system. Historic homes were razed. Others were chopped up and turned into halfway homes. By the late 1980s, East Roosevelt was a blighted area known primarily as a drug neighborhood. The seeds of what is now known as Roosevelt Row (or increasingly known as “RoRo” by locals) were sown in the early 1990s when the area’s cheap rents began to lure an adventurous arts crowd. But while Roosevelt Row became known as Phoenix’s arts neighborhood , the full renaissance of the neighborhood really did not begin until relatively recently. In 2006, Arizona State University opened a satellite campus. This was followed in 2008 by a new Metro Light
Rail line that connects Roosevelt Row to Downtown Phoenix much the way streetcars once had decades ago. In the years since, the area has seen an influx of millennials drawn to its arts vibe, historic architecture, and surprising level of walkability in a city otherwise known for sprawl.
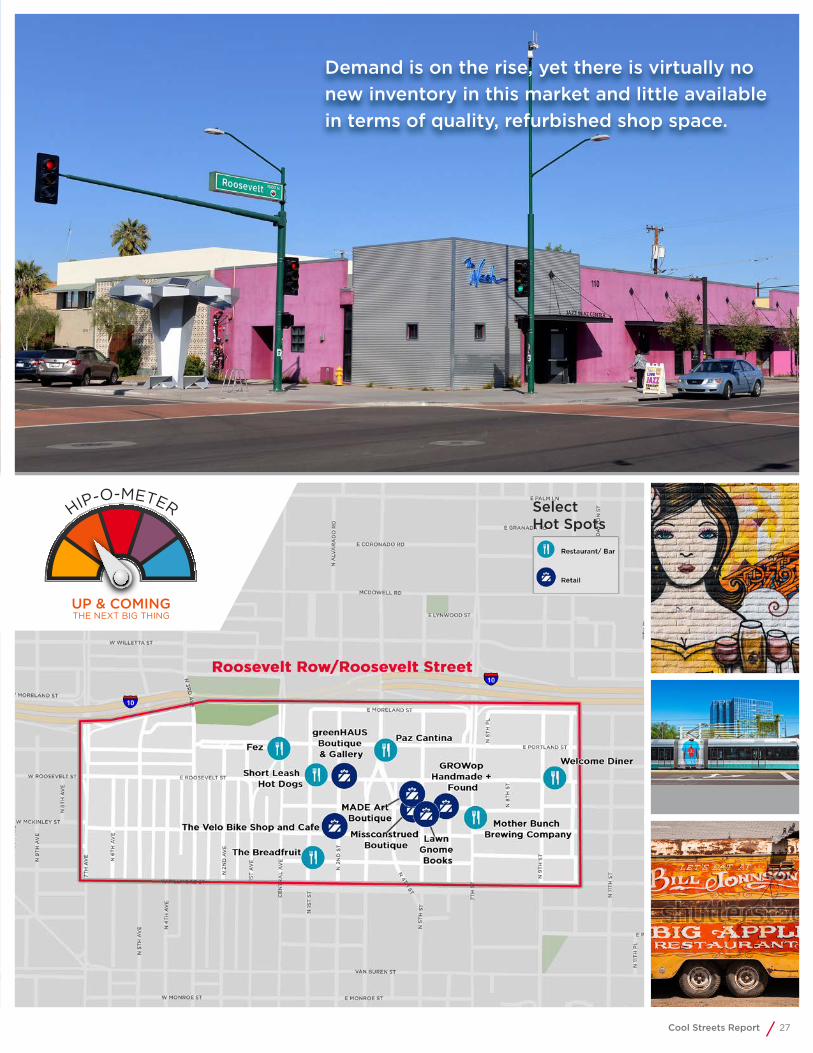
Roosevelt Row is situated immediately northeast of Downtown Phoenix and southeast of the junction of Interstate 10 and Highway 51. The prime east-west retail corridor is East Roosevelt Street, between North 7th Avenue and North 16th Street. North Central Avenue is the dominant north-south commercial strip. Retail rents typically range from $18 to $28 per sf, though we have occasionally seen deals beyond that range in either direction. Rents have climbed steadily despite the fact that overall retail vacancy in the neighborhood is close to 9%. But nearly all of that is older space (the average age of retail inventory here is more than 55 years) that borders on being functionally obsolete. Demand is on the rise, yet there is virtually no new inventory in this market and little available in terms of quality, refurbished shop space. In other words, conditions are ripe for major redevelopment plays.
26.0% Millennial Population
$47,541Average Household Income
Roosevelt Row: Streetcar Suburb Once More
PH
OE
NI
X
27Cool Streets Report
HIP-O-METER Select Hot Spots
Demand is on the rise, yet there is virtually no new inventory in this market and little available in terms of quality, refurbished shop space.
Carytown is located northeast of Downtown Richmond. Highway 161 effectively marks its eastern boundary, while Interstate 195 serves as both its southern and western borders. Carytown and its immediately adjacent neighbors (the Museum District and the Fan District) are historic neighborhoods — most of the commercial buildings here were built in the 1930s while many of the residential structures go back even further. The dividing line between Carytown and the Museum District consists primarily of Ellwood Avenue. Meanwhile, the Fan District (home of Virginia Commonwealth University) lies to the east of Carytown across Highway 161. Due in large part to the allure of historic architecture and central locations, all three of these districts have seen a steady influx of new urban dwellers (primarily millennials) over the past few years. Each has also benefited from the relative strengths of their neighbors. While the Museum District remains primarily a residential neighborhood, the Fan District has seen an explosion of nightlife and dining activity. Carytown has seen the greatest balance and mix between retail and restaurant activity over the past few years.
This is one of the smaller trade areas featured in our report; West Cary Street is the primary retail corridor and its most active segment is only about a mile in length. Still, that one mile is home to about 950,000 sf of retail inventory and more than 300 boutiques, shops, restaurants and bars. Local retail consists of a mix of independents and upscale boutiques as well as some main street shopping. The Byrd Theatre, a restored cinema that has operated continuously since 1928, is located in Carytown, providing insight into the makeup of the neighborhood. The average age of retail inventory in the area is roughly 80 years old. Despite this, Carytown has little in the way of existing vacancy; we estimate it at approximately 4%. Asking rents range from $12 to $40 per sf, with modern or refurbished properties at the top of that scale. With no new major redevelopment projects currently under way, we expect those rates to rise — particularly for refinished or repurposed quality retail space.
43.1% Millennial Population
$81,444Average Household Income
Carytown: The Mile of Style
RIC
HM
ON
D
VA

29Cool Streets Report
With no new major redevelopment projects currently under way, we expect lease rates to rise — particularly for refinished or repurposed quality retail space.
HIP-O-METER
Select Hot Spots
Downtown San Diego has been in a constant state of reinvention for the past 30 years. The original catalyst was the delivery of Horton Plaza in 1985, which was followed by a new waterfront Convention Center in 1989 and the restoration of the Gaslamp Quarter in the 1990s. With each new project came successive waves of residential high-rise development that added thousands of housing units and transformed the city’s skyline. With the 2004 completion of Petco Park, the path of redevelopment continued to move eastward into what was once the industrial underbelly of San Diego, and that trend continues today in the East Village.
The East Village is situated between the Gaslamp District to the west and Interstate 5 to the east, and extends northward from Harbor Drive to Balboa Park. This former industrial area fell into neglect in the 1970s and continued its downward spiral until discovered by the local arts community in the 1990s. But its renaissance did not pick up much steam until the arrival of Petco Park. Now, most of the East Village’s warehouses have been converted into lofts, galleries, restaurants, and shops. The area
has few trendy retailers or vintage shops; instead, the retail revolution (so far) has been driven by creative dining concepts and a collection of craft beer and cocktail venues that regularly attract locals, tourists, and the post-game crowd from the ballpark.
The Village is poised for rapid growth ahead with thousands of housing units either already under construction or in various stages of proposal. Local partnership The IDEA (Innovation, Design, Education and Arts) District plans to add at least 13,000 design and tech jobs in the East Village over the next 12 years as it pursues a vision of a sustainable live/work/play neighborhood. The organization intends on doing this through a mix of new projects ranging from creative office to retail/restaurant space and startup housing — some of which are already under construction (Maker’s Quarter, IDEA1). Projects in the pipeline essentially guarantee the emergence of the East Village as one of the West Coast’s major new Cool Streets over the next couple of years. Should plans to build a new football stadium for the San Diego Chargers here actually come to fruition (a proposal will be on the ballot in November), the East Village’s total retail transformation could happen virtually overnight.
32.7% Millennial Population
$74,414 Average Household Income
East Village: San Diego’s Next Reinvention
SA
ND
IEG
O

31Cool Streets Report
HIP-O-METER
Should plans to build a new football stadium for the San Diego Chargers here actually come to fruition, the East Village’s transformation could happen virtually overnight.
Select Hot Spots

San Francisco’s most famous redevelopment is the Mission District, where an influx of tech-industry millennials has transformed the neighborhood into the city’s hottest restaurant and bar scene. It certainly is a Cool Street, and probably more of an actual hipster haven than historic Jackson Square (most of the buildings here pre-date the 1906 earthquake). So why are we not focusing on the Mission District? Because it has nowhere near the retail upside of Jackson Square.
San Francisco’s restrictive “formula retail” code effectively locks out chains with more than 11 locations internationally unless they obtain a conditional use permit. Even when successful, this is a cumbersome process that takes retailers months to navigate and usually costs tens of thousands of dollars. Supporters believe that by keeping larger chains out they are maintaining the character of San Francisco’s many neighborhood retail districts and also protecting mom-and-pop retailers. But by setting the definition of “formula retail” at just 11 units, the law basically makes it cost prohibitive for many smaller new retail concepts to expand in the City by the Bay.
This is despite the fact that most of these chains have a track record of boosting local foot traffic — a factor that would help, not hurt, the mom-and-pop businesses this law was meant to protect. There are, however, a few exceptions to San Francisco’s formula retail code both in terms of categories (groceries and most financial services retail are exempt, for example) and geography. Jackson Square is one of the few San Francisco districts where significant portions of the neighborhood are exempt from this code.
Jackson Square is only approximately 10 square blocks and is almost entirely a commercial district. Lodged between San Francisco’s booming Financial District and the tourism-rich enclaves of Chinatown and North Beach, Jackson Square’s official boundaries are Columbus Avenue to the west, Battery Street on the east, Washington Street to the south and Broadway on the north. While San Francisco’s mid-Market area is also undergoing a retail revival, the availability of large blocks of space there is proving most alluring to off-price big box users. Meanwhile, Jackson Square is increasingly attracting hip, Cool Street concepts and upscale retailers alike due to its zoning advantages, historic flavor, and rents still averaging anywhere from half to a third of comparable Union Square rates.
34.6% Millennial Population
$107,916 Average Household Income
Jackson Square:Union Square’s New Cool Street Competitor
SAN
FRA
NC
ISCO

33Cool Streets Report
Jackson Square is increasingly attracting hip, Cool Street concepts and upscale retailers alike due to its zoning advantages, historic flavor, and rents…
HIP-O-METERHIP-O-METER
Select Hot Spots

The Delmar Loop (or “the Loop” as it is affectionately known by locals) is situated northeast of Downtown St. Louis and bordered by the University City, West End, Visitation Park and Skinker/Debaliviere neighborhoods. This Cool Street primarily consists of the Delmar Boulevard corridor between Kingsland Avenue and Clara Avenue, the end of the line for the old Delmar Boulevard streetcar that connected this neighborhood to Downtown St. Louis in the early half of the last century. Today, “the Loop” remains well served by public transit with a MetroLink station and plans in the works to build a new 2.2-mile trolley line that will connect the Loop to nearby Forest Park, home of the St. Louis Zoo and a number of major museums. The Washington University Campus is located in easy walking distance of the Loop (Washington’s Center of Creative Arts is situated on the Loop’s western boundary).
While the millennial embrace of urban living has played a major role in the resurgence of dozens of downtown districts, this trend has been more diffused in St. Louis. Ballpark Village, Soulard, Historic St. Charles and the Central West End District are just a few of the neighborhoods that have been transformed locally over the past few years. But while all of these districts have their own individual charm, the Delmar Loop has an allure of its own. It’s the home of the historic Tivoli Theater (a refurbished 1924 movie house), restaurant and music landmark Blueberry Hill (Chuck Berry used to perform there on the third Wednesday of every month) and the quirky lunar-themed boutique Moonrise Hotel. We also see it as having the greatest upside of any local retail district thanks to its central location and relative proximity to both Downtown and the bustling Clayton area.
The current rental range for competitive retail space on the Delmar Loop runs between $18 and $45 per sf, though some borderline obsolete space can be had for as low as $12 per sf. The high end of this range has risen rapidly, mostly driven by redevelopment projects. But while vacancy remains fairly low (we estimate it to be near 6.0%), the average age of inventory is 70 years. With leasing demand building and an aging inventory of relatively cheaply priced buildings, we see prime redevelopment opportunities galore.
29.8% Millennial Population
$85,425Average Household Income
Delmar Loop: No Longer End of the Line
ST
.L
OU
IS

35Cool Streets Report
The Delmar Loop has an allure of its own… We also see it as having the greatest upside of any local retail district...
HIP-O-METER
Select Hot Spots

In 2014, Vogue named West Queen West as No. 2 on its list of the Top 15 Coolest Neighborhoods in the World. What can we say after that? Well, a whole bunch, but space is limited. Let’s start with the basics, but this can be confusing. Queen Street West is one of Downtown Toronto’s major east-west thoroughfares, extending westward from Yonge Street through multiple neighborhoods to the Gardiner Expressway and Humber Bay (QSW Corridor). Queen Street West also refers to the upscale retail district at the eastern end of the QSW corridor near Toronto City Hall. This neighborhood is home to one of Canada’s premier malls, the CF Toronto Eaton Center, as well as dozens of local and international retail concepts. The district is a longtime center for the arts, telecommunications and culture due to its proximity to Ryerson University, The University of Toronto, and the Ontario College of Art & Design. But while this portion of the QSW corridor is certainly a “cool” street, Queen Street West is your standard urban high street marketplace today.
But it was not always that way. Queen Street West has undergone many changes over the past three decades, but this evolution has picked up steam over the past few years as residential rents skyrocketed under a wave of millennial
in-migration. This priced out many of the arts and creative types that once lived in the Queen Street West neighborhood. Where did they go? A lot of them just moved on down the QSW Corridor to West Queen West. Got it? No, we didn’t think so.
We define West Queen West as the neighborhood surrounding the QSW corridor between Bathurst Street and Gladstone Avenue. On this stretch of QSW you will find Canada’s largest concentration of independent art galleries, an abundance of independent boutiques, a flourishing restaurant and bar scene, and a couple of new hipster, boutique hotels. And in West Queen West, rents typically range between $30 and $60 per sf compared to rates that can top the $120 per sf mark in the tonier sections of Queen Street West). But rents are only going to climb here. Demand remains high for space in West Queen West and this Cool Street is increasingly demonstrating mainstream appeal.
75.9% Millennial Population
$92,354Average Household Income
West Queen West: Westward Ho!
TO
RO
NT
O

37Cool Streets Report
Demand remains high for space in West Queen West and this Cool Street is increasingly demonstrating mainstream appeal.
HIP-O-METER
Select Hot Spots

Mount Pleasant was historically a working class neighborhood centered around breweries located on Vancouver’s near northwest fringe. It is bounded by Cambie Street to the west and Clark Drive to the east and extends northward to the Great Northern Way. King Edward Avenue and Kingsway mark its southern edge. This neighborhood’s history goes back to 1890 when streetcars first connected it to downtown, making it one of Vancouver’s first suburban communities. Mount Pleasant is now served by the Sky Train instead of streetcars and its shift from working class to arts district began roughly 20 years ago. This transition has been on steroids over the last five years. Nowhere have the changes been more profound than near the intersections of Main Street and Broadway, which is ground zero for this Cool Street and the nexus of the neighborhood’s two primary retail arterials.
While much of Western Canada’s energy-based economy has struggled over the past 18 months due to falling oil prices, Vancouver has felt little of that — not just because of Vancouver’s more diverse economic base (though that is a major factor), but also as a result of a huge wave of in-migration driven mostly by wealthy Asian immigrants. Housing values for some Vancouver neighborhoods have tripled over the past decade and multifamily rents skyrocketed, forcing many creative types and millennials to Mount Pleasant and its relatively cheaper rents (though these are climbing rapidly as well). Trendy boutiques and eateries running the gamut from fast casual to upscale have followed.
We are currently tracking retail asking rents ranging from $20 to $43 per sf, but those rates are increasing swiftly. While most retail sectors in Canada are currently in flat or conservative growth mode, the resilience of Vancouver’s local economy has made the city a focal point of growth for many. New retail corridors in the Mount Pleasant market continue to emerge, but Main Street remains the epicenter of growth. Plentiful redevelopment opportunities, continued strong retailer demand, and competitive rents mean that this up and coming Cool Street still has a lot of runway left in its transformation.
31.3% Millennial Population
$85,689 Average Household Income
Mount Pleasant/Main Street: From Working Class to Arts Class
VA
NC
OU
VE
R

39Cool Streets Report
Nowhere have the changes been more profound than near the intersections of Main Street and Broadway, which is ground zero for this Cool Street…
HIP-O-METERSelect Hot Spots

The Shaw neighborhood sits immediately south of the Howard University campus, bound by Massachusetts Avenue NW to the south, New Jersey Avenue NW to the east, and 11th Street NW to the west. Shaw takes its name from Robert Gould Shaw, who led one of the first African-American units to fight for the Union in the Civil War. Through the early 1900s, Shaw was the pre-Harlem center of African-American intellectual and cultural life in the United States. Following the assassination of Dr. Martin Luther King in 1968, Shaw was one of the many D.C. neighborhoods that erupted in rioting. This was followed by a period of economic decline that lasted until about 2010. Shaw’s transformation since then has been unprecedented.
Shaw’s Victorian row house architecture, its central location, and D.C.’s millennial-driven housing boom have driven the rejuvenation of this neighborhood. In just a few short years, new apartment and condo complexes have risen in areas that long stood as parking lots, auto-repair shops, and vacant land. But this gentrification has not been without controversy. While Shaw remains one of the most racially diverse
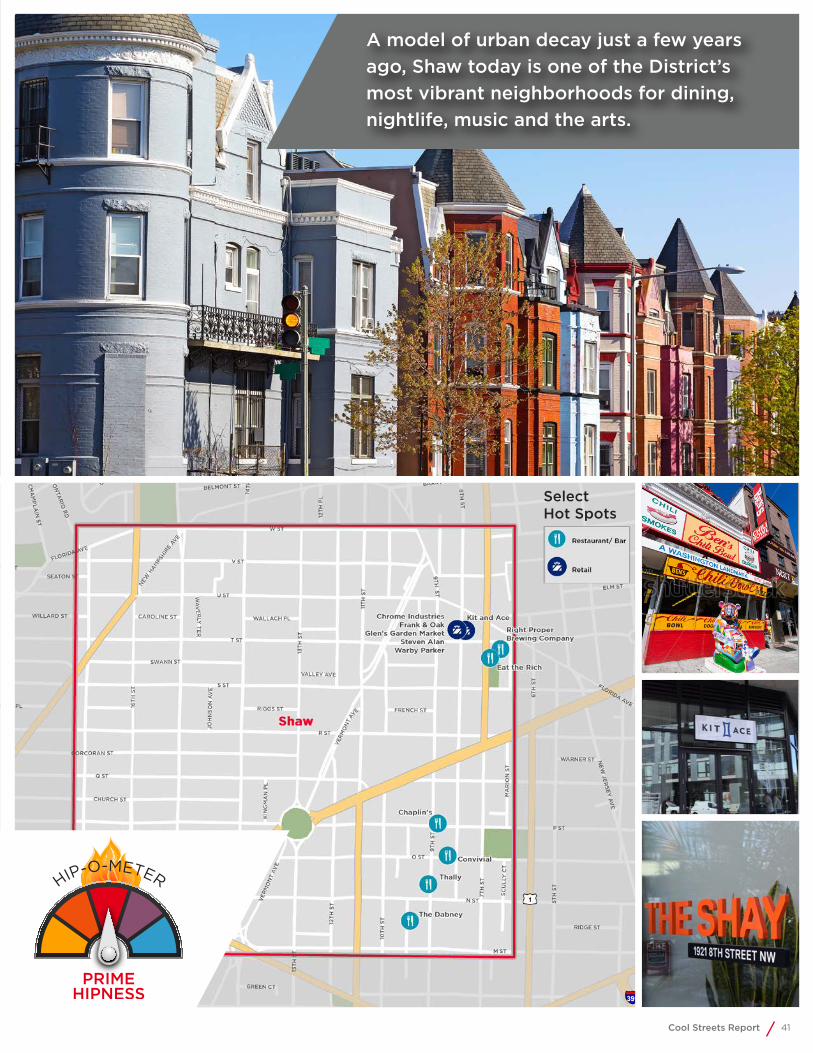
Cool Streets in our survey, rents have skyrocketed as this neighborhood’s popularity has soared, pricing out many long-time residents. A model of urban decay just a few years ago, Shaw today is home to a number of bustling retail corridors and is considered one of the District’s most vibrant neighborhoods for dining, nightlife, music and the arts.
Shaw’s retail revival continues at full throttle; recent retail arrivals include Warby Parker, Kit and Ace, as well as many highly-regarded local shops and brands. The general range of asking rents for quality street retail space here is $50 to $70 per sf and rising. While this is a mature trade area with virtually no undeveloped land, redevelopment opportunities exist and the influx of new residents continues unabated. We are currently tracking over 1,100 new multifamily units under construction in the immediate vicinity and nearly 4,000 additional proposed units. One of the more successful recent deliveries is the 310-unit Atlantic Plumbing building. This mixed-use project also features a retail component anchored by Landmark Theatres as well as a mix of boutiques and trendy eateries ranging from fast casual to upscale. Expect more projects like this in the future.
43.4% Millennial Population
$117,035 Average Household Income
Shaw: Urban Revival, Supercharged
WA
SHIN
GTO
N D
C
41Cool Streets Report
A model of urban decay just a few years ago, Shaw today is one of the District’s most vibrant neighborhoods for dining, nightlife, music and the arts.
HIP-O-METER
Select Hot Spots

42 CUSHMAN & WAKEFIELD
The Hip-O-MeterWe asked all survey participants to rank where they saw individual neighborhoods in terms of where they are in the Cool Street cycle. The rankings are as follows:
Edgy/Cool
Up & Coming
Prime Hipness
Still Cool, But Going Mainstream
Gone Mainstream
Livability and Retail FlavorAll survey participants were asked to rank on a scale of one to four, the strength of key neighborhood amenities and attributes dealing with Livability and Retail Flavor. The rankings are as follows:1 Not at all2 Slightly/Somewhat3 Getting There4 Absolutely
Residential RentsAll survey participants were asked to rank on a scale of one to four dollar signs, how expensive this neighborhood’s rents were in comparison to the norm for that market as a whole. Hence, these are not apples-to-apples comparisons across markets. A $$$$ ranking in Omaha is comparable to a $$$$ ranking in Manhattan. The rankings are as follows:$ Starving artist cheap$$ Middle of the road pricing$$$ Hipsters being priced out$$$$ Upscale mainstream pricing
Retail RentsCommercial rent ranges were compiled by our brokerage and research staff.
DemographicsThe demographic data reflected in this report comes from the U.S. Census Bureau and Statistics Canada. The United States data reflects U.S. Census Bureau estimates as of 2015. Demographic data from Statistics Canada reflects 2016 estimates. Demographic values represented reflect a two-mile radius taken from a spot we deemed near the exact geographic center of the trade area.
Garrick BrownVice PresidentRetail Research for the Americas+1 916 508 [email protected]
Pamela FloraDirectorRetail Research+1 858 558 [email protected]
For more information about Cushman & Wakefield Research, contact:
Cool Streets of North AmericaReport MethodologyHow does one quantify something as intangible and subjective as Cool? They do it with surveys! For this report we surveyed hundreds of our real estate professionals across all of our offices in the United States and Canada. Survey participants included commercial real estate brokers, property managers, appraisers, consultants, research and marketing professionals and executives

43Cool Streets Report
ATLANTA LIVABILITY SCORES RETAIL FLAVOR DEMOGRAPHICS
LITTLE FIVE POINTS (L5P)
Walkability 4
FoodieScore
4Total Population (2 Mile Radius)
72,832Retail Rent Range
$18.00 - $32.00
Bicycle Friendly
3NightlifeScore
4Average Household Income
$92,837Public Transportation
1MusicScore
4% College Educated (2 Mile Radius)
81.6%Diversity
4ArtsScore
4% 20-34 Year Old (2 Mile Radius)
34.4%Access to Higher Education
2
Vintage/ ThriftScore
4
% Renters (2 Mile Radius)
52.0%
Residential Rents
$$
ATLANTA LIVABILITY SCORES RETAIL FLAVOR DEMOGRAPHICS
OLD FOURTH WARD (O4W)
Walkability 3
FoodieScore
4Total Population (2 Mile Radius)
90,284Retail Rent Range
$18.00 - $30.00
Bicycle Friendly
3NightlifeScore
4Average Household Income
$88,605Public Transportation
1MusicScore
3% College Educated (2 Mile Radius)
83.0%Diversity
4ArtsScore
3% 20-34 Year Old (2 Mile Radius)
40.2%Access to Higher Education
2
Vintage/ ThriftScore
2
% Renters (2 Mile Radius)
54.8%
Residential Rents
$$$
AUSTIN LIVABILITY SCORES RETAIL FLAVOR DEMOGRAPHICS
EAST AUSTIN Walkability 2
FoodieScore
4Total Population (2 Mile Radius)
60,014Retail Rent Range
$28.00 - $50.00
Bicycle Friendly
3NightlifeScore
4Average Household Income
$53,459Public Transportation
1MusicScore
4% College Educated (2 Mile Radius)
51.2%Diversity
4ArtsScore
4% 20-34 Year Old (2 Mile Radius)
38.1%Access to Higher Education
2
Vintage/ ThriftScore
2
% Renters (2 Mile Radius)
62.2%
Residential Rents
$$$
BALTIMORE LIVABILITY SCORES RETAIL FLAVOR DEMOGRAPHICS
HAMPDEN Walkability 3
FoodieScore
4Total Population (2 Mile Radius)
119,975Retail Rent Range
$16.00 - $30.00
Bicycle Friendly
3NightlifeScore
2Average Household Income
$66,227Public Transportation
1MusicScore
3% College Educated (2 Mile Radius)
56.7%Diversity
2ArtsScore
4% 20-34 Year Old (2 Mile Radius)
28.0%Access to Higher Education
2
Vintage/ ThriftScore
4
% Renters (2 Mile Radius)
49.3%
Residential Rents
$$
ATLANTA - BALTIMORE
Little Five Points
Old Fourth Ward (04W)
East Austin
Hampden

44 CUSHMAN & WAKEFIELD
BOSTON LIVABILITY SCORES RETAIL FLAVOR DEMOGRAPHICS
JAMAICA PLAIN Walkability 3
FoodieScore
4Total Population (2 Mile Radius)
179,480Retail Rent Range
$40.00 - $80.00
Bicycle Friendly
4NightlifeScore
3Average Household Income
$89,315Public Transportation
3MusicScore
3% College Educated (2 Mile Radius)
69.9%Diversity
4ArtsScore
3% 20-34 Year Old (2 Mile Radius)
35.5%Access to Higher Education
2
Vintage/ ThriftScore
3
% Renters (2 Mile Radius)
69.4%
Residential Rents
$$$
BOSTON LIVABILITY SCORES RETAIL FLAVOR DEMOGRAPHICS
DAVIS SQUARE (SOMERVILLE, MA)
Walkability 4
FoodieScore
4Total Population (2 Mile Radius)
180,867Retail Rent Range
$48.00 - $120.00
Bicycle Friendly
3NightlifeScore
4Average Household Income
$101,968Public Transportation
3MusicScore
4% College Educated (2 Mile Radius)
75.0%Diversity
4ArtsScore
4% 20-34 Year Old (2 Mile Radius)
39.0%Access to Higher Education
4
Vintage/ ThriftScore
2
% Renters (2 Mile Radius)
62.6%
Residential Rents
$$$
BOSTON LIVABILITY SCORES RETAIL FLAVOR DEMOGRAPHICS
ALLSTON- BRIGHTON
Walkability 4
FoodieScore
4Total Population (2 Mile Radius)
202,518Retail Rent Range
$24.00 - $60.00
Bicycle Friendly
4NightlifeScore
4Average Household Income
$104,364Public Transportation
3MusicScore
3% College Educated (2 Mile Radius)
80.7%Diversity
3ArtsScore
2% 20-34 Year Old (2 Mile Radius)
49.3%Access to Higher Education
4
Vintage/ ThriftScore
3
% Renters (2 Mile Radius)
69.2%
Residential Rents
$$$$
BROOKLYN LIVABILITY SCORES RETAIL FLAVOR DEMOGRAPHICS
SUNSET PARK Walkability 4
FoodieScore
3Total Population (2 Mile Radius)
357,905Retail Rent Range
$75.00 - $175.00
Bicycle Friendly
2NightlifeScore
1Average Household Income
$81,529Public Transportation
3MusicScore
3% College Educated (2 Mile Radius)
48.9%Diversity
4ArtsScore
2% 20-34 Year Old (2 Mile Radius)
26.9%Access to Higher Education
2
Vintage/ ThriftScore
2
% Renters (2 Mile Radius)
71.8%
Residential Rents
$$
BOSTON - BROOKLYN
Jamaica Plain
Davis Square(Somerville, MA)
Allston-Brighton
Sunset Park

45Cool Streets Report
BROOKLYN LIVABILITY SCORES RETAIL FLAVOR DEMOGRAPHICS
BUSHWICK Walkability 4
FoodieScore
4Total Population (2 Mile Radius)
502,476Retail Rent Range
$40.00 - $140.00
Bicycle Friendly
2NightlifeScore
4Average Household Income
$53,774Public Transportation
4MusicScore
4% College Educated (2 Mile Radius)
42.3%Diversity
4ArtsScore
4% 20-34 Year Old (2 Mile Radius)
28.6%Access to Higher Education
3
Vintage/ ThriftScore
2
% Renters (2 Mile Radius)
78.4%
Residential Rents
$$
BROOKLYN LIVABILITY SCORES RETAIL FLAVOR DEMOGRAPHICS
WILLIAMSBURG Walkability 4
FoodieScore
4Total Population (2 Mile Radius)
528,951Retail Rent Range
$125.00 - $500.00
Bicycle Friendly
3NightlifeScore
4Average Household Income
$72,636Public Transportation
4MusicScore
4% College Educated (2 Mile Radius)
57.2%Diversity
4ArtsScore
4% 20-34 Year Old (2 Mile Radius)
32.7%Access to Higher Education
1
Vintage/ ThriftScore
2
% Renters (2 Mile Radius)
81.5%
Residential Rents
$$$$
BROOKLYN LIVABILITY SCORES RETAIL FLAVOR DEMOGRAPHICS
DUMBO Walkability 4
FoodieScore
4Total Population (2 Mile Radius)
567,934Retail Rent Range
$125.00 - $350.00
Bicycle Friendly
3NightlifeScore
4Average Household Income
$110,433Public Transportation
4MusicScore
4% College Educated (2 Mile Radius)
68.4%Diversity
4ArtsScore
4% 20-34 Year Old (2 Mile Radius)
31.9%Access to Higher Education
2
Vintage/ ThriftScore
1
% Renters (2 Mile Radius)
74.8%
Residential Rents
$$$$
BROOKLYN LIVABILITY SCORES RETAIL FLAVOR DEMOGRAPHICS
CROWN HEIGHTS Walkability 4
FoodieScore
2Total Population (2 Mile Radius)
690,340Retail Rent Range
$60.00 - $160.00
Bicycle Friendly
3NightlifeScore
3Average Household Income
$63,105Public Transportation
4MusicScore
3% College Educated (2 Mile Radius)
51.9%Diversity
4ArtsScore
2% 20-34 Year Old (2 Mile Radius)
26.2%Access to Higher Education
2
Vintage/ ThriftScore
3
% Renters (2 Mile Radius)
77.9%
Residential Rents
$$
BROOKLYN
Bushwick
Williamsburg
DUMBO
Crown Heights

46 CUSHMAN & WAKEFIELD
BUFFALO LIVABILITY SCORES RETAIL FLAVOR DEMOGRAPHICS
ELMWOOD VILLAGE Walkability 3
FoodieScore
4Total Population (2 Mile Radius)
92,049Retail Rent Range
$20.00 - $48.00
Bicycle Friendly
2NightlifeScore
4Average Household Income
$53,710Public Transportation
1MusicScore
4% College Educated (2 Mile Radius)
60.6%Diversity
4ArtsScore
4% 20-34 Year Old (2 Mile Radius)
29.7%Access to Higher Education
3
Vintage/ ThriftScore
2
% Renters (2 Mile Radius)
57.9%
Residential Rents
$$$
CHARLOTTE LIVABILITY SCORES RETAIL FLAVOR DEMOGRAPHICS
NODA ARTS DISTRICT
Walkability 2
FoodieScore
3Total Population (2 Mile Radius)
36,878Retail Rent Range
$18.00 - $36.00
Bicycle Friendly
1NightlifeScore
4Average Household Income
$51,021Public Transportation
1MusicScore
3% College Educated (2 Mile Radius)
49.0%Diversity
3ArtsScore
4% 20-34 Year Old (2 Mile Radius)
27.5%Access to Higher Education
2
Vintage/ ThriftScore
2
% Renters (2 Mile Radius)
52.4%
Residential Rents
$
CHARLOTTE LIVABILITY SCORES RETAIL FLAVOR DEMOGRAPHICS
MONTFORD Walkability 1
FoodieScore
3Total Population (2 Mile Radius)
41,177Retail Rent Range
$30.00 - $60.00
Bicycle Friendly
1NightlifeScore
4Average Household Income
$109,057Public Transportation
2MusicScore
2% College Educated (2 Mile Radius)
82.2%Diversity
2ArtsScore
1% 20-34 Year Old (2 Mile Radius)
25.2%Access to Higher Education
2
Vintage/ ThriftScore
1
% Renters (2 Mile Radius)
38.0%
Residential Rents
$$$$
CHARLOTTE LIVABILITY SCORES RETAIL FLAVOR DEMOGRAPHICS
PLAZA-MIDWOOD Walkability 2
FoodieScore
3Total Population (2 Mile Radius)
47,084Retail Rent Range
$16.00 - $35.00
Bicycle Friendly
2NightlifeScore
4Average Household Income
$83,287Public Transportation
2MusicScore
2% College Educated (2 Mile Radius)
66.7%Diversity
4ArtsScore
4% 20-34 Year Old (2 Mile Radius)
33.7%Access to Higher Education
1
Vintage/ ThriftScore
3
% Renters (2 Mile Radius)
51.0%
Residential Rents
$$$
BUFFALO - CHARLOTTE
Elmwood Village
NoDa Arts District
Montford
Plaza-Midwood

47Cool Streets Report
CHICAGO LIVABILITY SCORES RETAIL FLAVOR DEMOGRAPHICS
WICKER PARK Walkability 4
FoodieScore
4Total Population (2 Mile Radius)
214,757Retail Rent Range
$40.00 - $70.00
Bicycle Friendly
4NightlifeScore
4Average Household Income
$102,698Public Transportation
3MusicScore
4% College Educated (2 Mile Radius)
73.1%Diversity
4ArtsScore
4% 20-34 Year Old (2 Mile Radius)
39.5%Access to Higher Education
1
Vintage/ ThriftScore
2
% Renters (2 Mile Radius)
57.7%
Residential Rents
$$$$
CHICAGO LIVABILITY SCORES RETAIL FLAVOR DEMOGRAPHICS
FULTON RIVER DISTRICT
Walkability 4
FoodieScore
4Total Population (2 Mile Radius)
225,515Retail Rent Range
$35.00 - $90.00
Bicycle Friendly
4NightlifeScore
4Average Household Income
$122,561Public Transportation
4MusicScore
2% College Educated (2 Mile Radius)
87.8%Diversity
2ArtsScore
2% 20-34 Year Old (2 Mile Radius)
43.1%Access to Higher Education
1
Vintage/ ThriftScore
1
% Renters (2 Mile Radius)
51.9%
Residential Rents
$$$
CHICAGO LIVABILITY SCORES RETAIL FLAVOR DEMOGRAPHICS
LOGAN SQUARE Walkability 4
FoodieScore
4Total Population (2 Mile Radius)
255,132Retail Rent Range
$24.00 - $65.00
Bicycle Friendly
3NightlifeScore
4Average Household Income
$84,529Public Transportation
2MusicScore
4% College Educated (2 Mile Radius)
60.5%Diversity
3ArtsScore
4% 20-34 Year Old (2 Mile Radius)
34.3%Access to Higher Education
3
Vintage/ ThriftScore
3
% Renters (2 Mile Radius)
58.0%
Residential Rents
$$$
CHICAGO LIVABILITY SCORES RETAIL FLAVOR DEMOGRAPHICS
BUCKTOWN/ DAMEN AVENUE
Walkability 4
FoodieScore
4Total Population (2 Mile Radius)
257,193Retail Rent Range
$35.00 - $80.00
Bicycle Friendly
3NightlifeScore
4Average Household Income
$109,494Public Transportation
3MusicScore
4% College Educated (2 Mile Radius)
77.2%Diversity
4ArtsScore
4% 20-34 Year Old (2 Mile Radius)
42.7%Access to Higher Education
1
Vintage/ ThriftScore
2
% Renters (2 Mile Radius)
58.4%
Residential Rents
$$$
CHICAGO
Wicker Park
Fulton River District
Logan Square
Bucktown / Damen Avenue

48 CUSHMAN & WAKEFIELD
CINCINNATI LIVABILITY SCORES RETAIL FLAVOR DEMOGRAPHICS
OVER-THE-RHINE (OTR)
Walkability 4
FoodieScore
4Total Population (2 Mile Radius)
67,517Retail Rent Range
$16.00 - $40.00
Bicycle Friendly
1NightlifeScore
4Average Household Income
$49,466Public Transportation
3MusicScore
4% College Educated (2 Mile Radius)
55.9%Diversity
4ArtsScore
4% 20-34 Year Old (2 Mile Radius)
36.9%Access to Higher Education
2
Vintage/ ThriftScore
3
% Renters (2 Mile Radius)
59.3%
Residential Rents
$$$
CLEVELAND LIVABILITY SCORES RETAIL FLAVOR DEMOGRAPHICS
THE FLATS (EAST BANK)
Walkability 2
FoodieScore
4Total Population (2 Mile Radius)
37,107Retail Rent Range
$12.00 - $36.00
Bicycle Friendly
2NightlifeScore
3Average Household Income
$44,860Public Transportation
3MusicScore
2% College Educated (2 Mile Radius)
54.0%Diversity
3ArtsScore
2% 20-34 Year Old (2 Mile Radius)
35.9%Access to Higher Education
1
Vintage/ ThriftScore
1
% Renters (2 Mile Radius)
65.0%
Residential Rents
$$
CLEVELAND LIVABILITY SCORES RETAIL FLAVOR DEMOGRAPHICS
EAST 4TH STREET/GATEWAY DISTRICT
Walkability 4
FoodieScore
4Total Population (2 Mile Radius)
38,900Retail Rent Range
$16.00 - $40.00
Bicycle Friendly
1NightlifeScore
4Average Household Income
$42,923Public Transportation
4MusicScore
4% College Educated (2 Mile Radius)
52.9%Diversity
3ArtsScore
2% 20-34 Year Old (2 Mile Radius)
35.4%Access to Higher Education
1
Vintage/ ThriftScore
1
% Renters (2 Mile Radius)
66.6%
Residential Rents
$$
COLUMBUS LIVABILITY SCORES RETAIL FLAVOR DEMOGRAPHICS
SHORT NORTH/HIGH STREET
Walkability 4
FoodieScore
4Total Population (2 Mile Radius)
74,070Retail Rent Range
$14.00 - $32.00
Bicycle Friendly
3NightlifeScore
4Average Household Income
$51,248Public Transportation
2MusicScore
4% College Educated (2 Mile Radius)
70.0%Diversity
4ArtsScore
4% 20-34 Year Old (2 Mile Radius)
51.1%Access to Higher Education
4
Vintage/ ThriftScore
2
% Renters (2 Mile Radius)
70.9%
Residential Rents
$$
CINCINNATI - COLUMBUS
Over-the-Rhine
The Flats
East 4th Street
Short North/ High Street

49Cool Streets Report
DALLAS LIVABILITY SCORES RETAIL FLAVOR DEMOGRAPHICS
BISHOP ARTS DISTRICT (OAK CLIFF)
Walkability 2
FoodieScore
4Total Population (2 Mile Radius)
65,316Retail Rent Range
$18.00 - $42.00
Bicycle Friendly
1NightlifeScore
3Average Household Income
$56,075Public Transportation
1MusicScore
3% College Educated (2 Mile Radius)
34.2%Diversity
4ArtsScore
4% 20-34 Year Old (2 Mile Radius)
24.7%Access to Higher Education
1
Vintage/ ThriftScore
2
% Renters (2 Mile Radius)
47.2%
Residential Rents
$$$
DALLAS LIVABILITY SCORES RETAIL FLAVOR DEMOGRAPHICS
LOWER GREENVILLE
Walkability 3
FoodieScore
4Total Population (2 Mile Radius)
90,804Retail Rent Range
$24.00 - $42.00
Bicycle Friendly
1NightlifeScore
4Average Household Income
$109,487Public Transportation
1MusicScore
4% College Educated (2 Mile Radius)
73.9%Diversity
4ArtsScore
2% 20-34 Year Old (2 Mile Radius)
31.3%Access to Higher Education
2
Vintage/ ThriftScore
3
% Renters (2 Mile Radius)
52.6%
Residential Rents
$$$
DENVER LIVABILITY SCORES RETAIL FLAVOR DEMOGRAPHICS
LOHI/HIGHLANDS Walkability 4
FoodieScore
4Total Population (2 Mile Radius)
85,753Retail Rent Range
$24.00 - $62.00
Bicycle Friendly
3NightlifeScore
4Average Household Income
$76,432Public Transportation
3MusicScore
3% College Educated (2 Mile Radius)
67.9%Diversity
4ArtsScore
4% 20-34 Year Old (2 Mile Radius)
35.2%Access to Higher Education
2
Vintage/ ThriftScore
2
% Renters (2 Mile Radius)
55.6%
Residential Rents
$$$
DENVER LIVABILITY SCORES RETAIL FLAVOR DEMOGRAPHICS
RINO (RIVER NORTH) ARTS DISTRICT
Walkability 4
FoodieScore
4Total Population (2 Mile Radius)
87,485Retail Rent Range
$24.00 - $70.00
Bicycle Friendly
4NightlifeScore
3Average Household Income
$69,790Public Transportation
1MusicScore
4% College Educated (2 Mile Radius)
66.3%Diversity
2ArtsScore
4% 20-34 Year Old (2 Mile Radius)
39.6%Access to Higher Education
2
Vintage/ ThriftScore
3
% Renters (2 Mile Radius)
64.4%
Residential Rents
$$$
DALLAS - DENVER
Bishop Arts District
LowerGreenville
LoHi/Highlands
RiNo

50 CUSHMAN & WAKEFIELD
DETROIT LIVABILITY SCORES RETAIL FLAVOR DEMOGRAPHICS
CORKTOWN Walkability 2
FoodieScore
3Total Population (2 Mile Radius)
41,784Retail Rent Range
$15.00 - $41.00
Bicycle Friendly
3NightlifeScore
3Average Household Income
$34,279Public Transportation
1MusicScore
3% College Educated (2 Mile Radius)
47.1%Diversity
2ArtsScore
2% 20-34 Year Old (2 Mile Radius)
29.2%Access to Higher Education
1
Vintage/ ThriftScore
2
% Renters (2 Mile Radius)
61.7%
Residential Rents
$$
EDMONTON LIVABILITY SCORES RETAIL FLAVOR DEMOGRAPHICS
OLD STRATHCONA/WHYTE AVENUE
Walkability 4
FoodieScore
2Total Population (2 Mile Radius)
47,333Retail Rent Range
$25.00 - $50.00
Bicycle Friendly
2NightlifeScore
4Average Household Income
$88,791Public Transportation
1MusicScore
2% College Educated (2 Mile Radius)
80.6%Diversity
4ArtsScore
2% 20-34 Year Old (2 Mile Radius)
40.1%Access to Higher Education
4
Vintage/ ThriftScore
1
% Renters (2 Mile Radius)
57.2%
Residential Rents
$$
HOUSTON LIVABILITY SCORES RETAIL FLAVOR DEMOGRAPHICS
LOWER WESTHEIMER/MONTROSE
Walkability 3
FoodieScore
4Total Population (2 Mile Radius)
91,175Retail Rent Range
$24.00 - $60.00
Bicycle Friendly
3NightlifeScore
4Average Household Income
$118,760Public Transportation
1MusicScore
4% College Educated (2 Mile Radius)
83.4%Diversity
4ArtsScore
4% 20-34 Year Old (2 Mile Radius)
38.2%Access to Higher Education
2
Vintage/ ThriftScore
4
% Renters (2 Mile Radius)
54.8%
Residential Rents
$$$
INDIANAPOLIS LIVABILITY SCORES RETAIL FLAVOR DEMOGRAPHICS
MASSACHUSETTS AVENUE ARTS DISTRICT
Walkability 3
FoodieScore
4Total Population (2 Mile Radius)
50,260Retail Rent Range
$20.00 - $40.00
Bicycle Friendly
3NightlifeScore
4Average Household Income
$45,364Public Transportation
3MusicScore
3% College Educated (2 Mile Radius)
49.6%Diversity
4ArtsScore
4% 20-34 Year Old (2 Mile Radius)
34.4%Access to Higher Education
2
Vintage/ ThriftScore
3
% Renters (2 Mile Radius)
52.6%
Residential Rents
$$$
DETROIT - INDIANAPOLIS
Corktown
Old Strathcona/ Whyte Avenue
Lower Westheimer/ Montrose
MassachusettsAvenue Arts District

51Cool Streets Report
INDIANAPOLIS LIVABILITY SCORES RETAIL FLAVOR DEMOGRAPHICS
FOUNTAIN SQUARE/VIRGINIA AVENUE
Walkability 2
FoodieScore
3Total Population (2 Mile Radius)
51,701Retail Rent Range
$12.00 - $25.00
Bicycle Friendly
4NightlifeScore
3Average Household Income
$42,722Public Transportation
2MusicScore
4% College Educated (2 Mile Radius)
38.9%Diversity
3ArtsScore
3% 20-34 Year Old (2 Mile Radius)
29.9%Access to Higher Education
2
Vintage/ ThriftScore
4
% Renters (2 Mile Radius)
49.2%
Residential Rents
$$
KANSAS CITY LIVABILITY SCORES RETAIL FLAVOR DEMOGRAPHICS
WESTPORT Walkability 4
FoodieScore
4Total Population (2 Mile Radius)
55,995Retail Rent Range
$18.00 - $35.00
Bicycle Friendly
2NightlifeScore
4Average Household Income
$61,021Public Transportation
1MusicScore
4% College Educated (2 Mile Radius)
70.0%Diversity
4ArtsScore
2% 20-34 Year Old (2 Mile Radius)
36.0%Access to Higher Education
2
Vintage/ ThriftScore
3
% Renters (2 Mile Radius)
52.9%
Residential Rents
$$
LAS VEGAS LIVABILITY SCORES RETAIL FLAVOR DEMOGRAPHICS
18B ARTS DISTRICT Walkability 3
FoodieScore
2Total Population (2 Mile Radius)
67,483Retail Rent Range
$15.00 - $40.00
Bicycle Friendly
3NightlifeScore
2Average Household Income
$47,134Public Transportation
2MusicScore
3% College Educated (2 Mile Radius)
42.4%Diversity
4ArtsScore
3% 20-34 Year Old (2 Mile Radius)
21.6%Access to Higher Education
1
Vintage/ ThriftScore
4
% Renters (2 Mile Radius)
56.3%
Residential Rents
$$
LOS ANGELES LIVABILITY SCORES RETAIL FLAVOR DEMOGRAPHICS
ABBOT KINNEY BLVD (VENICE, CA)
Walkability 4
FoodieScore
3Total Population (2 Mile Radius)
98,271Retail Rent Range
$66.00 - $220.00
Bicycle Friendly
4NightlifeScore
2Average Household Income
$119,253Public Transportation
2MusicScore
2% College Educated (2 Mile Radius)
82.2%Diversity
2ArtsScore
4% 20-34 Year Old (2 Mile Radius)
25.1%Access to Higher Education
1
Vintage/ ThriftScore
2
% Renters (2 Mile Radius)
63.6%
Residential Rents
$$$
INDIANAPOLIS - LOS ANGELES
Fountain Square/Virginia Avenue
Westport
18b Arts District
Abbot Kinney Blvd

52 CUSHMAN & WAKEFIELD
LOS ANGELES LIVABILITY SCORES RETAIL FLAVOR DEMOGRAPHICS
SILVER LAKE Walkability 2
FoodieScore
3Total Population (2 Mile Radius)
135,356Retail Rent Range
$30.00 - $80.00
Bicycle Friendly
2NightlifeScore
2Average Household Income
$80,375Public Transportation
2MusicScore
3% College Educated (2 Mile Radius)
62.1%Diversity
2ArtsScore
3% 20-34 Year Old (2 Mile Radius)
26.6%Access to Higher Education
1
Vintage/ ThriftScore
2
% Renters (2 Mile Radius)
68.3%
Residential Rents
$$$$
LOS ANGELES LIVABILITY SCORES RETAIL FLAVOR DEMOGRAPHICS
LOS FELIZ Walkability 2
FoodieScore
3Total Population (2 Mile Radius)
138,282Retail Rent Range
$24.00 - $70.00
Bicycle Friendly
2NightlifeScore
2Average Household Income
$76,125Public Transportation
2MusicScore
3% College Educated (2 Mile Radius)
65.2%Diversity
2ArtsScore
3% 20-34 Year Old (2 Mile Radius)
27.8%Access to Higher Education
1
Vintage/ ThriftScore
3
% Renters (2 Mile Radius)
76.9%
Residential Rents
$$$
LOS ANGELES LIVABILITY SCORES RETAIL FLAVOR DEMOGRAPHICS
DOWNTOWN LOS ANGELES/SOUTH PARK
Walkability 4
FoodieScore
2Total Population (2 Mile Radius)
262,193Retail Rent Range
$24.00 - $90.00
Bicycle Friendly
3NightlifeScore
3Average Household Income
$41,494Public Transportation
4MusicScore
3% College Educated (2 Mile Radius)
35.7%Diversity
2ArtsScore
2% 20-34 Year Old (2 Mile Radius)
32.3%Access to Higher Education
2
Vintage/ ThriftScore
2
% Renters (2 Mile Radius)
86.6%
Residential Rents
$$$
LOUISVILLE LIVABILITY SCORES RETAIL FLAVOR DEMOGRAPHICS
HIGHLANDS Walkability 3
FoodieScore
4Total Population (2 Mile Radius)
55,499Retail Rent Range
$12.00 - $27.00
Bicycle Friendly
3NightlifeScore
4Average Household Income
$54,633Public Transportation
1MusicScore
4% College Educated (2 Mile Radius)
67.2%Diversity
4ArtsScore
4% 20-34 Year Old (2 Mile Radius)
29.9%Access to Higher Education
4
Vintage/ ThriftScore
2
% Renters (2 Mile Radius)
52.1%
Residential Rents
$$$
LOS ANGELES - LOUISVILLE
Silver Lake
Los Feliz
Downtown/South Park
Highlands

53Cool Streets Report
MANHATTAN LIVABILITY SCORES RETAIL FLAVOR DEMOGRAPHICS
GRAND STREET (BETWEEN BROADWAY AND WEST BROADWAY)
Walkability 4
FoodieScore
3Total Population (2 Mile Radius)
544,338Retail Rent Range
$100.00 - $300.00
Bicycle Friendly
3NightlifeScore
1Average Household Income
$139,566Public Transportation
4MusicScore
1% College Educated (2 Mile Radius)
77.6%Diversity
3ArtsScore
1% 20-34 Year Old (2 Mile Radius)
35.1%Access to Higher Education
1
Vintage/ ThriftScore
1
% Renters (2 Mile Radius)
72.1%
Residential Rents
$$$
MANHATTAN LIVABILITY SCORES RETAIL FLAVOR DEMOGRAPHICS
BLEECKER STREET/GREENWICH VILLAGE
Walkability 4
FoodieScore
2Total Population (2 Mile Radius)
562,735Retail Rent Range
$200.00 - $500.00
Bicycle Friendly
3NightlifeScore
2Average Household Income
$141,817Public Transportation
4MusicScore
1% College Educated (2 Mile Radius)
78.6%Diversity
3ArtsScore
4% 20-34 Year Old (2 Mile Radius)
36.4%Access to Higher Education
3
Vintage/ ThriftScore
3
% Renters (2 Mile Radius)
71.7%
Residential Rents
$$$
MANHATTAN LIVABILITY SCORES RETAIL FLAVOR DEMOGRAPHICS
BOND STREET/NOHO
Walkability 4
FoodieScore
3Total Population (2 Mile Radius)
567,662Retail Rent Range
$200.00 - $475.00
Bicycle Friendly
3NightlifeScore
3Average Household Income
$139,704Public Transportation
4MusicScore
1% College Educated (2 Mile Radius)
77.9%Diversity
3ArtsScore
4% 20-34 Year Old (2 Mile Radius)
35.8%Access to Higher Education
1
Vintage/ ThriftScore
1
% Renters (2 Mile Radius)
71.9%
Residential Rents
$$$
MANHATTAN LIVABILITY SCORES RETAIL FLAVOR DEMOGRAPHICS
BOWERY / LOWER EAST SIDE
Walkability 4
FoodieScore
3Total Population (2 Mile Radius)
597,389Retail Rent Range
$200.00 - $375.00
Bicycle Friendly
4NightlifeScore
2Average Household Income
$135,917Public Transportation
4MusicScore
1% College Educated (2 Mile Radius)
76.7%Diversity
3ArtsScore
3% 20-34 Year Old (2 Mile Radius)
35.0%Access to Higher Education
1
Vintage/ ThriftScore
2
% Renters (2 Mile Radius)
72.1%
Residential Rents
$$$
MANHATTAN
Grand Street
Bleeker Street
Bond Street/ NoHo
Bowery
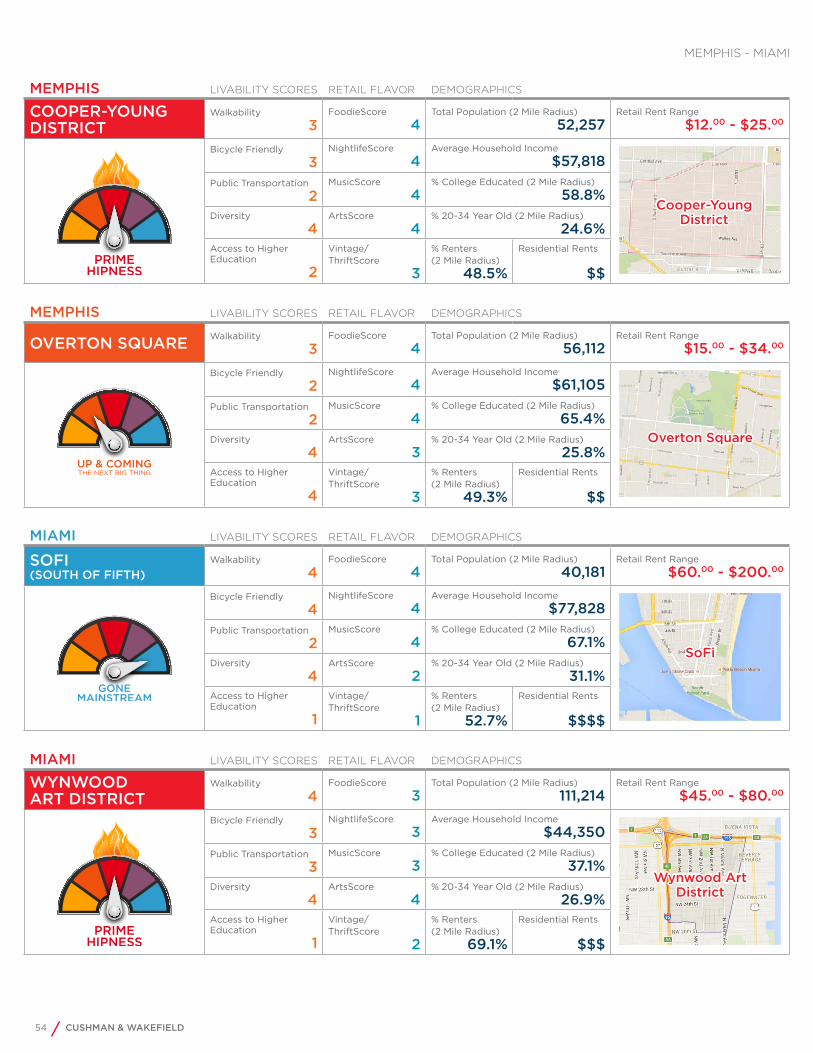
54 CUSHMAN & WAKEFIELD
MEMPHIS LIVABILITY SCORES RETAIL FLAVOR DEMOGRAPHICS
COOPER-YOUNG DISTRICT
Walkability 3
FoodieScore
4Total Population (2 Mile Radius)
52,257Retail Rent Range
$12.00 - $25.00
Bicycle Friendly
3NightlifeScore
4Average Household Income
$57,818Public Transportation
2MusicScore
4% College Educated (2 Mile Radius)
58.8%Diversity
4ArtsScore
4% 20-34 Year Old (2 Mile Radius)
24.6%Access to Higher Education
2
Vintage/ ThriftScore
3
% Renters (2 Mile Radius)
48.5%
Residential Rents
$$
MEMPHIS LIVABILITY SCORES RETAIL FLAVOR DEMOGRAPHICS
OVERTON SQUARE Walkability 3
FoodieScore
4Total Population (2 Mile Radius)
56,112Retail Rent Range
$15.00 - $34.00
Bicycle Friendly
2NightlifeScore
4Average Household Income
$61,105Public Transportation
2MusicScore
4% College Educated (2 Mile Radius)
65.4%Diversity
4ArtsScore
3% 20-34 Year Old (2 Mile Radius)
25.8%Access to Higher Education
4
Vintage/ ThriftScore
3
% Renters (2 Mile Radius)
49.3%
Residential Rents
$$
MIAMI LIVABILITY SCORES RETAIL FLAVOR DEMOGRAPHICS
SOFI (SOUTH OF FIFTH)
Walkability 4
FoodieScore
4Total Population (2 Mile Radius)
40,181Retail Rent Range
$60.00 - $200.00
Bicycle Friendly
4NightlifeScore
4Average Household Income
$77,828Public Transportation
2MusicScore
4% College Educated (2 Mile Radius)
67.1%Diversity
4ArtsScore
2% 20-34 Year Old (2 Mile Radius)
31.1%Access to Higher Education
1
Vintage/ ThriftScore
1
% Renters (2 Mile Radius)
52.7%
Residential Rents
$$$$
MIAMI LIVABILITY SCORES RETAIL FLAVOR DEMOGRAPHICS
WYNWOOD ART DISTRICT
Walkability 4
FoodieScore
3Total Population (2 Mile Radius)
111,214Retail Rent Range
$45.00 - $80.00
Bicycle Friendly
3NightlifeScore
3Average Household Income
$44,350Public Transportation
3MusicScore
3% College Educated (2 Mile Radius)
37.1%Diversity
4ArtsScore
4% 20-34 Year Old (2 Mile Radius)
26.9%Access to Higher Education
1
Vintage/ ThriftScore
2
% Renters (2 Mile Radius)
69.1%
Residential Rents
$$$
MEMPHIS - MIAMI
Cooper-Young District
Overton Square
SoFi
Wynwood Art District

55Cool Streets Report
MILWAUKEE LIVABILITY SCORES RETAIL FLAVOR DEMOGRAPHICS
HISTORIC THIRD WARD
Walkability 4
FoodieScore
3Total Population (2 Mile Radius)
77,884Retail Rent Range
$14.00 - $32.00
Bicycle Friendly
3NightlifeScore
3Average Household Income
$50,619Public Transportation
2MusicScore
3% College Educated (2 Mile Radius)
55.4%Diversity
3ArtsScore
3% 20-34 Year Old (2 Mile Radius)
41.6%Access to Higher Education2
Vintage/ ThriftScore
3
% Renters (2 Mile Radius)
72.2%
Residential Rents
$$
MINNEAPOLIS LIVABILITY SCORES RETAIL FLAVOR DEMOGRAPHICS
GRAND AVENUE (ST. PAUL)
Walkability 4
FoodieScore
3Total Population (2 Mile Radius)
92,810Retail Rent Range
$12.00 - $40.00
Bicycle Friendly
4NightlifeScore
2Average Household Income
$79,710Public Transportation
2MusicScore
2% College Educated (2 Mile Radius)
72.7%Diversity
2ArtsScore
2% 20-34 Year Old (2 Mile Radius)
28.3%Access to Higher Education
4
Vintage/ ThriftScore
2
% Renters (2 Mile Radius)
47.2%
Residential Rents
$$
MINNEAPOLIS LIVABILITY SCORES RETAIL FLAVOR DEMOGRAPHICS
UPTOWN MINNEAPOLIS (LAKE & HENNEPIN)
Walkability 4
FoodieScore
4Total Population (2 Mile Radius)
108,461Retail Rent Range
$12.00 - $50.00
Bicycle Friendly
4NightlifeScore
4Average Household Income
$78,194Public Transportation
2MusicScore
3% College Educated (2 Mile Radius)
76.2%Diversity
4ArtsScore
4% 20-34 Year Old (2 Mile Radius)
39.7%Access to Higher Education1
Vintage/ ThriftScore
2
% Renters (2 Mile Radius)
64.1%
Residential Rents
$$$
MINNEAPOLIS LIVABILITY SCORES RETAIL FLAVOR DEMOGRAPHICS
NORTH LOOP/ WAREHOUSE HISTORIC DISTRICT
Walkability 3
FoodieScore
4Total Population (2 Mile Radius)
109,824Retail Rent Range
$18.00 - $42.00
Bicycle Friendly
4NightlifeScore
4Average Household Income
$61,767Public Transportation
3MusicScore
4% College Educated (2 Mile Radius)
67.0%Diversity
4ArtsScore
3% 20-34 Year Old (2 Mile Radius)
39.4%Access to Higher Education
2
Vintage/ ThriftScore
2
% Renters (2 Mile Radius)
67.1%
Residential Rents
$$$
MILWAUKEE - MINNEAPOLIS
Historic ThirdWard
Grand Avenue
Uptown Minneapolis
North Loop
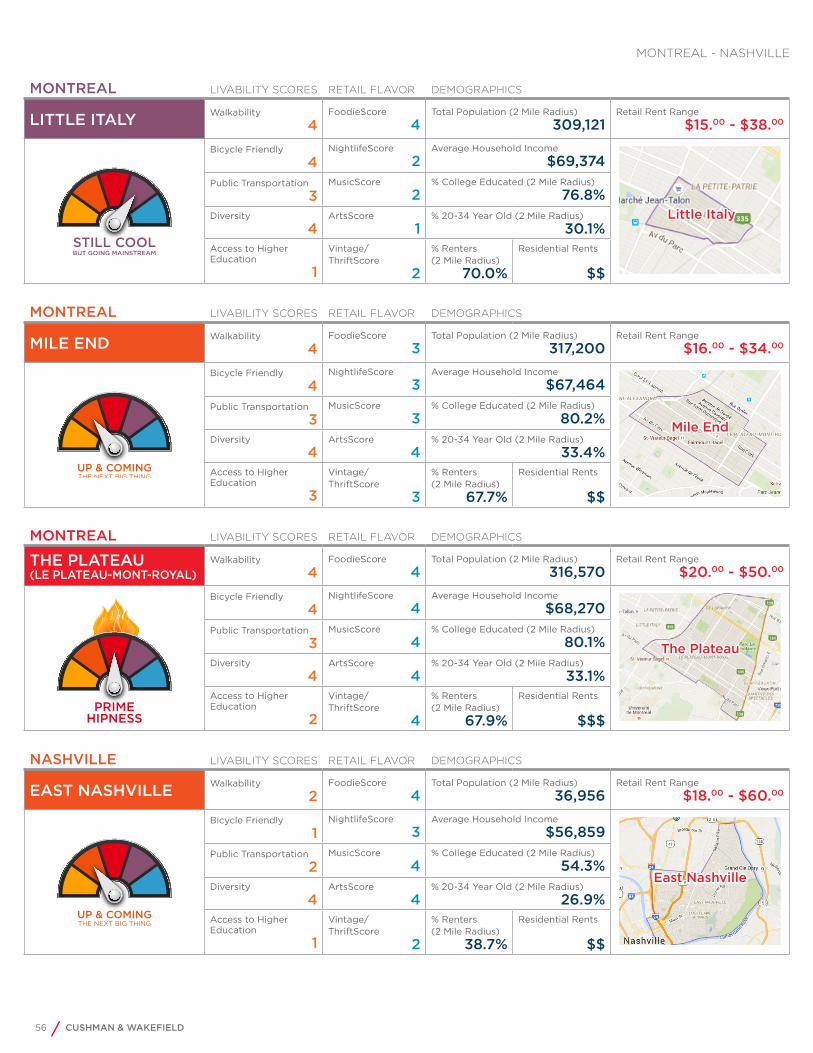
56 CUSHMAN & WAKEFIELD
MONTREAL LIVABILITY SCORES RETAIL FLAVOR DEMOGRAPHICS
LITTLE ITALY Walkability 4
FoodieScore
4Total Population (2 Mile Radius)
309,121 Retail Rent Range
$15.00 - $38.00
Bicycle Friendly
4NightlifeScore
2Average Household Income
$69,374 Public Transportation
3MusicScore
2% College Educated (2 Mile Radius)
76.8%Diversity
4ArtsScore
1% 20-34 Year Old (2 Mile Radius)
30.1%Access to Higher Education
1
Vintage/ ThriftScore
2
% Renters (2 Mile Radius)
70.0%
Residential Rents
$$
MONTREAL LIVABILITY SCORES RETAIL FLAVOR DEMOGRAPHICS
MILE END Walkability 4
FoodieScore
3Total Population (2 Mile Radius)
317,200 Retail Rent Range
$16.00 - $34.00
Bicycle Friendly
4NightlifeScore
3Average Household Income
$67,464 Public Transportation
3MusicScore
3% College Educated (2 Mile Radius)
80.2%Diversity
4ArtsScore
4% 20-34 Year Old (2 Mile Radius)
33.4%Access to Higher Education
3
Vintage/ ThriftScore
3
% Renters (2 Mile Radius)
67.7%
Residential Rents
$$
MONTREAL LIVABILITY SCORES RETAIL FLAVOR DEMOGRAPHICS
THE PLATEAU (LE PLATEAU-MONT-ROYAL)
Walkability 4
FoodieScore
4Total Population (2 Mile Radius)
316,570 Retail Rent Range
$20.00 - $50.00
Bicycle Friendly
4NightlifeScore
4Average Household Income
$68,270 Public Transportation
3MusicScore
4% College Educated (2 Mile Radius)
80.1%Diversity
4ArtsScore
4% 20-34 Year Old (2 Mile Radius)
33.1%Access to Higher Education
2
Vintage/ ThriftScore
4
% Renters (2 Mile Radius)
67.9%
Residential Rents
$$$
NASHVILLE LIVABILITY SCORES RETAIL FLAVOR DEMOGRAPHICS
EAST NASHVILLE Walkability 2
FoodieScore
4Total Population (2 Mile Radius)
36,956Retail Rent Range
$18.00 - $60.00
Bicycle Friendly
1NightlifeScore
3Average Household Income
$56,859Public Transportation
2MusicScore
4% College Educated (2 Mile Radius)
54.3%Diversity
4ArtsScore
4% 20-34 Year Old (2 Mile Radius)
26.9%Access to Higher Education
1
Vintage/ ThriftScore
2
% Renters (2 Mile Radius)
38.7%
Residential Rents
$$
MONTREAL - NASHVILLE
Little Italy
Mile End
The Plateau
East Nashville

57Cool Streets Report
NEW ORLEANS LIVABILITY SCORES RETAIL FLAVOR DEMOGRAPHICS
WAREHOUSE DISTRICT
Walkability 4
FoodieScore
4Total Population (2 Mile Radius)
87,955Retail Rent Range
$16.00 - $50.00
Bicycle Friendly
3NightlifeScore
3Average Household Income
$59,378Public Transportation
2MusicScore
3% College Educated (2 Mile Radius)
57.2%Diversity
4ArtsScore
3% 20-34 Year Old (2 Mile Radius)
30.6%Access to Higher Education
1
Vintage/ ThriftScore
2
% Renters (2 Mile Radius)
53.0%
Residential Rents
$$
OAKLAND LIVABILITY SCORES RETAIL FLAVOR DEMOGRAPHICS
JACK LONDON SQUARE
Walkability 3
FoodieScore
3Total Population (2 Mile Radius)
116,771Retail Rent Range
$32.00 - $90.00
Bicycle Friendly
4NightlifeScore
3Average Household Income
$67,152Public Transportation
2MusicScore
3% College Educated (2 Mile Radius)
67.3%Diversity
2ArtsScore
2% 20-34 Year Old (2 Mile Radius)
27.9%Access to Higher Education
2
Vintage/ ThriftScore
1
% Renters (2 Mile Radius)
75.2%
Residential Rents
$$$
OAKLAND LIVABILITY SCORES RETAIL FLAVOR DEMOGRAPHICS
TEMESCAL/ UPTOWN
Walkability 4
FoodieScore
4Total Population (2 Mile Radius)
134,501Retail Rent Range
$30.00 - $80.00
Bicycle Friendly
4NightlifeScore
4Average Household Income
$68,405Public Transportation
2MusicScore
4% College Educated (2 Mile Radius)
72.0%Diversity
4ArtsScore
4% 20-34 Year Old (2 Mile Radius)
29.3%Access to Higher Education2
Vintage/ ThriftScore
2
% Renters (2 Mile Radius)
74.1%
Residential Rents
$$$
OKLAHOMA CITY LIVABILITY SCORES RETAIL FLAVOR DEMOGRAPHICS
PASEO ARTS DISTRICT
Walkability 3
FoodieScore
3Total Population (2 Mile Radius)
48,262Retail Rent Range
$10.00 - $28.00
Bicycle Friendly
3NightlifeScore
2Average Household Income
$52,640Public Transportation
1MusicScore
3% College Educated (2 Mile Radius)
57.9%Diversity
2ArtsScore
4% 20-34 Year Old (2 Mile Radius)
31.6%Access to Higher Education
2
Vintage/ ThriftScore
3
% Renters (2 Mile Radius)
50.5%
Residential Rents
$$
NEW ORLEANS - OKLAHOMA CITY
WarehouseDistrict
Jack London Square
Temescal/Uptown
Paseo ArtsDistrict

58 CUSHMAN & WAKEFIELD
OMAHA LIVABILITY SCORES RETAIL FLAVOR DEMOGRAPHICS
BENSON Walkability 3
FoodieScore
4Total Population (2 Mile Radius)
60,486Retail Rent Range
$12.00 - $26.00
Bicycle Friendly
2NightlifeScore
3Average Household Income
$56,321Public Transportation
1MusicScore
3% College Educated (2 Mile Radius)
64.6%Diversity
3ArtsScore
2% 20-34 Year Old (2 Mile Radius)
24.3%Access to Higher Education
2
Vintage/ ThriftScore
2
% Renters (2 Mile Radius)
38.9%
Residential Rents
$$
ORLANDO LIVABILITY SCORES RETAIL FLAVOR DEMOGRAPHICS
PARK AVENUE (WINTER PARK)
Walkability 4
FoodieScore
4Total Population (2 Mile Radius)
36,386Retail Rent Range
$18.00 - $44.00
Bicycle Friendly
3NightlifeScore
2Average Household Income
$102,591Public Transportation
1MusicScore
2% College Educated (2 Mile Radius)
77.8%Diversity
1ArtsScore
1% 20-34 Year Old (2 Mile Radius)
19.2%Access to Higher Education
2
Vintage/ ThriftScore
1
% Renters (2 Mile Radius)
35.4%
Residential Rents
$$$
ORLANDO LIVABILITY SCORES RETAIL FLAVOR DEMOGRAPHICS
THORNTON PARK Walkability 2
FoodieScore
3Total Population (2 Mile Radius)
46,363Retail Rent Range
$20.00 - $35.00
Bicycle Friendly
2NightlifeScore
2Average Household Income
$67,984Public Transportation
2MusicScore
2% College Educated (2 Mile Radius)
68.1%Diversity
2ArtsScore
2% 20-34 Year Old (2 Mile Radius)
30.0%Access to Higher Education
1
Vintage/ ThriftScore
1
% Renters (2 Mile Radius)
55.7%
Residential Rents
$$$
OTTAWA LIVABILITY SCORES RETAIL FLAVOR DEMOGRAPHICS
WESTBORO Walkability 4
FoodieScore
4Total Population (2 Mile Radius)
73,229Retail Rent Range
$25.00 - $45.00
Bicycle Friendly
4NightlifeScore
3Average Household Income
$102,772Public Transportation
3MusicScore
4% College Educated (2 Mile Radius)
78.5%Diversity
3ArtsScore
4% 20-34 Year Old (2 Mile Radius)
21.1%Access to Higher Education
1
Vintage/ ThriftScore
3
% Renters (2 Mile Radius)
43.7%
Residential Rents
$$$
OMAHA - OTTAWA
Benson
Park Avenue
Thornton Park
Westboro

59Cool Streets Report
OTTAWA LIVABILITY SCORES RETAIL FLAVOR DEMOGRAPHICS
HINTONBURG Walkability 4
FoodieScore
4Total Population (2 Mile Radius)
92,364Retail Rent Range
$25.00 - $40.00
Bicycle Friendly
4NightlifeScore
3Average Household Income
$93,037Public Transportation
3MusicScore
3% College Educated (2 Mile Radius)
77.7%Diversity
3ArtsScore
3% 20-34 Year Old (2 Mile Radius)
26.5%Access to Higher Education
1
Vintage/ ThriftScore
2
% Renters (2 Mile Radius)
51.7%
Residential Rents
$$$
PHILADELPHIA LIVABILITY SCORES RETAIL FLAVOR DEMOGRAPHICS
NORTHERN LIBERTIES (NOLIBS)
Walkability 4
FoodieScore
4Total Population (2 Mile Radius)
187,976Retail Rent Range
$20.00 - $55.00
Bicycle Friendly
4NightlifeScore
4Average Household Income
$69,974Public Transportation
3MusicScore
4% College Educated (2 Mile Radius)
60.5%Diversity
3ArtsScore
2% 20-34 Year Old (2 Mile Radius)
37.7%Access to Higher Education
1
Vintage/ ThriftScore
3
% Renters (2 Mile Radius)
57.1%
Residential Rents
$$$
PHILADELPHIA LIVABILITY SCORES RETAIL FLAVOR DEMOGRAPHICS
EAST PASSYUNK CROSSING
Walkability 4
FoodieScore
4Total Population (2 Mile Radius)
220,178Retail Rent Range
$25.00 - $65.00
Bicycle Friendly
3NightlifeScore
3Average Household Income
$70,672Public Transportation
3MusicScore
3% College Educated (2 Mile Radius)
58.2%Diversity
3ArtsScore
2% 20-34 Year Old (2 Mile Radius)
33.7%Access to Higher Education
1
Vintage/ ThriftScore
2
% Renters (2 Mile Radius)
47.0%
Residential Rents
$$$
PHOENIX LIVABILITY SCORES RETAIL FLAVOR DEMOGRAPHICS
ROOSEVELT ROW (RORO)
Walkability 2
FoodieScore
3Total Population (2 Mile Radius)
60,469Retail Rent Range
$18.00 - $28.00
Bicycle Friendly
2NightlifeScore
3Average Household Income
$47,541Public Transportation
1MusicScore
3% College Educated (2 Mile Radius)
45.4%Diversity
3ArtsScore
4% 20-34 Year Old (2 Mile Radius)
26.0%Access to Higher Education
3
Vintage/ ThriftScore
2
% Renters (2 Mile Radius)
58.4%
Residential Rents
$$
OTTAWA - PHOENIX
Hintonburg
Northern Liberties
East Passyunk Crossing
Roosevelt Row

60 CUSHMAN & WAKEFIELD
PITTSBURGH LIVABILITY SCORES RETAIL FLAVOR DEMOGRAPHICS
LAWRENCEVILLE Walkability 2
FoodieScore
4Total Population (2 Mile Radius)
83,441Retail Rent Range
$19.00 - $32.00
Bicycle Friendly
3NightlifeScore
4Average Household Income
$57,397Public Transportation
1MusicScore
4% College Educated (2 Mile Radius)
62.1%Diversity
4ArtsScore
4% 20-34 Year Old (2 Mile Radius)
34.9%Access to Higher Education
1
Vintage/ ThriftScore
3
% Renters (2 Mile Radius)
53.9%
Residential Rents
$$$
PORTLAND OR LIVABILITY SCORES RETAIL FLAVOR DEMOGRAPHICS
PEARL DISTRICT Walkability 4
FoodieScore
4Total Population (2 Mile Radius)
81,822Retail Rent Range
$20.00 - $60.00
Bicycle Friendly
4NightlifeScore
3Average Household Income
$76,308Public Transportation
4MusicScore
3% College Educated (2 Mile Radius)
82.4%Diversity
2ArtsScore
3% 20-34 Year Old (2 Mile Radius)
38.3%Access to Higher Education
3
Vintage/ ThriftScore
1
% Renters (2 Mile Radius)
67.2%
Residential Rents
$$$
PORTLAND OR LIVABILITY SCORES RETAIL FLAVOR DEMOGRAPHICS
ALBERTA ARTS DISTRICT (NE ALBERTA)
Walkability 4
FoodieScore
4Total Population (2 Mile Radius)
87,407Retail Rent Range
$15.00 - $40.00
Bicycle Friendly
3NightlifeScore
3Average Household Income
$80,100Public Transportation
2MusicScore
3% College Educated (2 Mile Radius)
78.5%Diversity
2ArtsScore
4% 20-34 Year Old (2 Mile Radius)
27.3%Access to Higher Education
3
Vintage/ ThriftScore
2
% Renters (2 Mile Radius)
41.9%
Residential Rents
$$
RALEIGH LIVABILITY SCORES RETAIL FLAVOR DEMOGRAPHICS
BOYLAN HEIGHTS Walkability 3
FoodieScore
4Total Population (2 Mile Radius)
52,593Retail Rent Range
$15.00 - $30.00
Bicycle Friendly
2NightlifeScore
4Average Household Income
$65,307Public Transportation
1MusicScore
3% College Educated (2 Mile Radius)
66.0%Diversity
4ArtsScore
3% 20-34 Year Old (2 Mile Radius)
36.4%Access to Higher Education
4
Vintage/ ThriftScore
2
% Renters (2 Mile Radius)
57.9%
Residential Rents
$$$
PITTSBURGH - RALEIGH
Lawrenceville
Pearl District
Albertal Arts District
Boylan Heights

61Cool Streets Report
RICHMOND VA LIVABILITY SCORES RETAIL FLAVOR DEMOGRAPHICS
CARYTOWN Walkability 4
FoodieScore
4Total Population (2 Mile Radius)
54,835Retail Rent Range
$12.00 - $40.00
Bicycle Friendly
3NightlifeScore
4Average Household Income
$81,444Public Transportation
2MusicScore
4% College Educated (2 Mile Radius)
78.4%Diversity
4ArtsScore
4% 20-34 Year Old (2 Mile Radius)
43.1%Access to Higher Education
4
Vintage/ ThriftScore
4
% Renters (2 Mile Radius)
56.7%
Residential Rents
$$
RICHMOND VA LIVABILITY SCORES RETAIL FLAVOR DEMOGRAPHICS
FAN DISTRICT Walkability 4
FoodieScore
4Total Population (2 Mile Radius)
64,192Retail Rent Range
$12.00 - $30.00
Bicycle Friendly
3NightlifeScore
4Average Household Income
$64,485Public Transportation
2MusicScore
4% College Educated (2 Mile Radius)
69.3%Diversity
4ArtsScore
4% 20-34 Year Old (2 Mile Radius)
44.6%Access to Higher Education
4
Vintage/ ThriftScore
3
% Renters (2 Mile Radius)
64.2%
Residential Rents
$$
SACRAMENTO LIVABILITY SCORES RETAIL FLAVOR DEMOGRAPHICS
MIDTOWN Walkability 4
FoodieScore
4Total Population (2 Mile Radius)
66,366Retail Rent Range
$22.00 - $40.00
Bicycle Friendly
3NightlifeScore
4Average Household Income
$67,222Public Transportation
2MusicScore
3% College Educated (2 Mile Radius)
73.9%Diversity
3ArtsScore
3% 20-34 Year Old (2 Mile Radius)
32.2%Access to Higher Education
2
Vintage/ ThriftScore
3
% Renters (2 Mile Radius)
64.8%
Residential Rents
$$$
SALT LAKE CITY LIVABILITY SCORES RETAIL FLAVOR DEMOGRAPHICS
SUGAR HOUSE Walkability 2
FoodieScore
4Total Population (2 Mile Radius)
81,289Retail Rent Range
$15.00 - $40.00
Bicycle Friendly
2NightlifeScore
3Average Household Income
$80,545Public Transportation
1MusicScore
2% College Educated (2 Mile Radius)
77.8%Diversity
2ArtsScore
3% 20-34 Year Old (2 Mile Radius)
29.1%Access to Higher Education
4
Vintage/ ThriftScore
2
% Renters (2 Mile Radius)
41.8%
Residential Rents
$$$
RICHMOND VA - SALT LAKE CITY
Carytown
Fan District
Midtown
Sugar House

62 CUSHMAN & WAKEFIELD
SAN ANTONIO LIVABILITY SCORES RETAIL FLAVOR DEMOGRAPHICS
PEARL BREWERY DISTRICT
Walkability 2
FoodieScore
4Total Population (2 Mile Radius)
53,648Retail Rent Range
$16.00 - $32.00
Bicycle Friendly
3NightlifeScore
4Average Household Income
$49,540Public Transportation
1MusicScore
3% College Educated (2 Mile Radius)
44.0%Diversity
3ArtsScore
3% 20-34 Year Old (2 Mile Radius)
28.8%Access to Higher Education
3
Vintage/ ThriftScore
2
% Renters (2 Mile Radius)
61.4%
Residential Rents
$$$$
SAN DIEGO LIVABILITY SCORES RETAIL FLAVOR DEMOGRAPHICS
HILLCREST Walkability 3
FoodieScore
4Total Population (2 Mile Radius)
97,497Retail Rent Range
$22.00 - $48.00
Bicycle Friendly
2NightlifeScore
4Average Household Income
$78,052Public Transportation
2MusicScore
4% College Educated (2 Mile Radius)
82.1%Diversity
4ArtsScore
4% 20-34 Year Old (2 Mile Radius)
35.4%Access to Higher Education
2
Vintage/ ThriftScore
2
% Renters (2 Mile Radius)
69.0%
Residential Rents
$$$
SAN DIEGO LIVABILITY SCORES RETAIL FLAVOR DEMOGRAPHICS
EAST VILLAGE Walkability 4
FoodieScore
4Total Population (2 Mile Radius)
99,835Retail Rent Range
$24.00 - $60.00
Bicycle Friendly
3NightlifeScore
4Average Household Income
$74,414Public Transportation
4MusicScore
3% College Educated (2 Mile Radius)
65.0%Diversity
4ArtsScore
3% 20-34 Year Old (2 Mile Radius)
32.7%Access to Higher Education
2
Vintage/ ThriftScore
1
% Renters (2 Mile Radius)
68.2%
Residential Rents
$$$
SAN DIEGO LIVABILITY SCORES RETAIL FLAVOR DEMOGRAPHICS
NORTH PARK Walkability 3
FoodieScore
4Total Population (2 Mile Radius)
138,722Retail Rent Range
$18.00 - $60.00
Bicycle Friendly
2NightlifeScore
4Average Household Income
$63,968Public Transportation
2MusicScore
4% College Educated (2 Mile Radius)
66.2%Diversity
4ArtsScore
4% 20-34 Year Old (2 Mile Radius)
31.1%Access to Higher Education
2
Vintage/ ThriftScore
2
% Renters (2 Mile Radius)
73.4%
Residential Rents
$$$
SAN ANTONIO - SAN DIEGO
Pearl BreweryDistrict
Hillcrest
East Village
North Park

63Cool Streets Report
SAN FRANCISCO LIVABILITY SCORES RETAIL FLAVOR DEMOGRAPHICS
JACKSON SQUARE Walkability 4
FoodieScore
2Total Population (2 Mile Radius)
218,248Retail Rent Range
$60.00 - $80.00
Bicycle Friendly
3NightlifeScore
2Average Household Income
$107,916Public Transportation
4MusicScore
1% College Educated (2 Mile Radius)
73.6%Diversity
1ArtsScore
2% 20-34 Year Old (2 Mile Radius)
34.6%Access to Higher Education
2
Vintage/ ThriftScore
1
% Renters (2 Mile Radius)
77.7%
Residential Rents
$$$$
SAN FRANCISCO LIVABILITY SCORES RETAIL FLAVOR DEMOGRAPHICS
CHESTNUT STREET Walkability 4
FoodieScore
4Total Population (2 Mile Radius)
241,597Retail Rent Range
$48.00 - $120.00
Bicycle Friendly
3NightlifeScore
2Average Household Income
$111,629Public Transportation
3MusicScore
1% College Educated (2 Mile Radius)
75.8%Diversity
2ArtsScore
1% 20-34 Year Old (2 Mile Radius)
34.6%Access to Higher Education
2
Vintage/ ThriftScore
2
% Renters (2 Mile Radius)
78.5%
Residential Rents
$$$$
SAN FRANCISCO LIVABILITY SCORES RETAIL FLAVOR DEMOGRAPHICS
MISSION DISTRICT (PARTICULARLY MISSION & VALENCIA)
Walkability 4
FoodieScore
4Total Population (2 Mile Radius)
318,867Retail Rent Range
$45.00 - $75.00
Bicycle Friendly
4NightlifeScore
4Average Household Income
$114,217Public Transportation
4MusicScore
4% College Educated (2 Mile Radius)
78.3%Diversity
4ArtsScore
4% 20-34 Year Old (2 Mile Radius)
31.7%Access to Higher Education
2
Vintage/ ThriftScore
3
% Renters (2 Mile Radius)
71.5%
Residential Rents
$$$$
SAN JOSE LIVABILITY SCORES RETAIL FLAVOR DEMOGRAPHICS
LOS GATOS Walkability 3
FoodieScore
4Total Population (2 Mile Radius)
128,947Retail Rent Range
$30.00 - $70.00
Bicycle Friendly
4NightlifeScore
4Average Household Income
$90,991Public Transportation
2MusicScore
2% College Educated (2 Mile Radius)
55.5%Diversity
3ArtsScore
2% 20-34 Year Old (2 Mile Radius)
31.8%Access to Higher Education
2
Vintage/ ThriftScore
2
% Renters (2 Mile Radius)
63.4%
Residential Rents
$$$$
SAN FRANCISCO - SAN JOSE
Jackson Square
Chestnut Street
MissionDistrict
Los Gatos
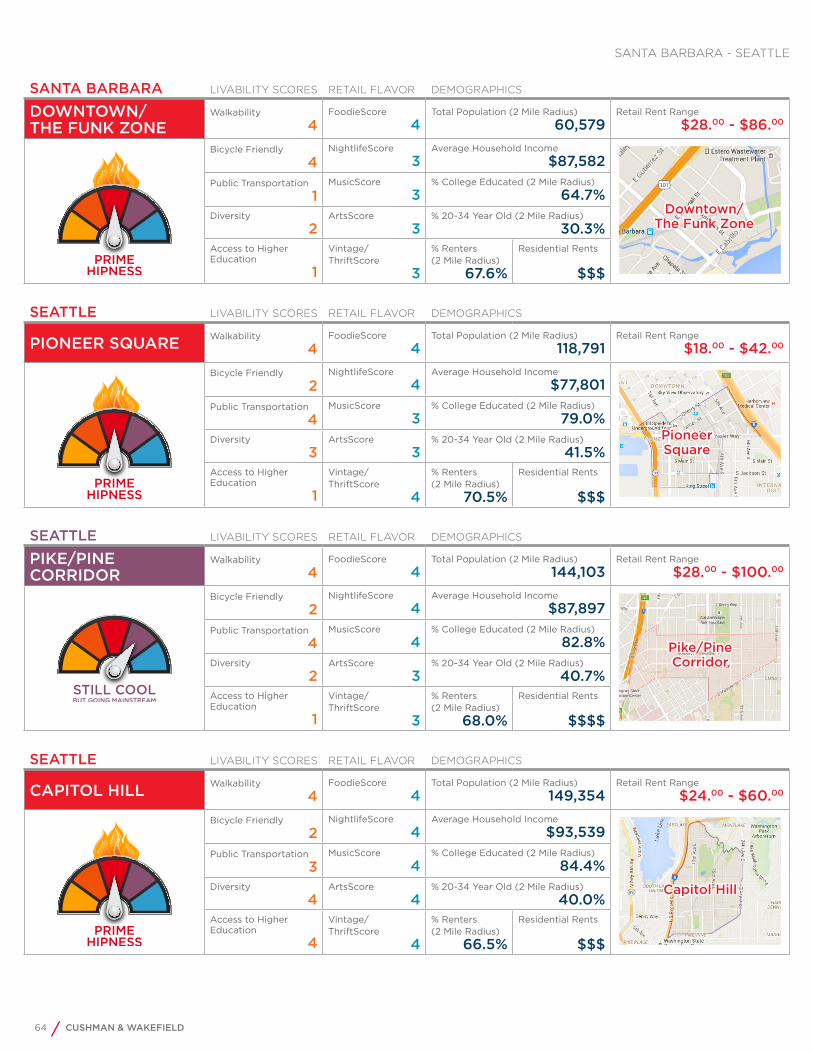
64 CUSHMAN & WAKEFIELD
SANTA BARBARA LIVABILITY SCORES RETAIL FLAVOR DEMOGRAPHICS
DOWNTOWN/ THE FUNK ZONE
Walkability 4
FoodieScore
4Total Population (2 Mile Radius)
60,579Retail Rent Range
$28.00 - $86.00
Bicycle Friendly
4NightlifeScore
3Average Household Income
$87,582Public Transportation
1MusicScore
3% College Educated (2 Mile Radius)
64.7%Diversity
2ArtsScore
3% 20-34 Year Old (2 Mile Radius)
30.3%Access to Higher Education
1
Vintage/ ThriftScore
3
% Renters (2 Mile Radius)
67.6%
Residential Rents
$$$
SEATTLE LIVABILITY SCORES RETAIL FLAVOR DEMOGRAPHICS
PIONEER SQUARE Walkability 4
FoodieScore
4Total Population (2 Mile Radius)
118,791Retail Rent Range
$18.00 - $42.00
Bicycle Friendly
2NightlifeScore
4Average Household Income
$77,801Public Transportation
4MusicScore
3% College Educated (2 Mile Radius)
79.0%Diversity
3ArtsScore
3% 20-34 Year Old (2 Mile Radius)
41.5%Access to Higher Education
1
Vintage/ ThriftScore
4
% Renters (2 Mile Radius)
70.5%
Residential Rents
$$$
SEATTLE LIVABILITY SCORES RETAIL FLAVOR DEMOGRAPHICS
PIKE/PINE CORRIDOR
Walkability 4
FoodieScore
4Total Population (2 Mile Radius)
144,103Retail Rent Range
$28.00 - $100.00
Bicycle Friendly
2NightlifeScore
4Average Household Income
$87,897Public Transportation
4MusicScore
4% College Educated (2 Mile Radius)
82.8%Diversity
2ArtsScore
3% 20-34 Year Old (2 Mile Radius)
40.7%Access to Higher Education
1
Vintage/ ThriftScore
3
% Renters (2 Mile Radius)
68.0%
Residential Rents
$$$$
SEATTLE LIVABILITY SCORES RETAIL FLAVOR DEMOGRAPHICS
CAPITOL HILL Walkability 4
FoodieScore
4Total Population (2 Mile Radius)
149,354Retail Rent Range
$24.00 - $60.00
Bicycle Friendly
2NightlifeScore
4Average Household Income
$93,539Public Transportation
3MusicScore
4% College Educated (2 Mile Radius)
84.4%Diversity
4ArtsScore
4% 20-34 Year Old (2 Mile Radius)
40.0%Access to Higher Education
4
Vintage/ ThriftScore
4
% Renters (2 Mile Radius)
66.5%
Residential Rents
$$$
SANTA BARBARA - SEATTLE
Downtown/ The Funk Zone
PioneerSquare
Pike/PineCorridor
Capitol Hill

65Cool Streets Report
ST. LOUIS LIVABILITY SCORES RETAIL FLAVOR DEMOGRAPHICS
DELMAR LOOP/ THE LOOP
Walkability 4
FoodieScore
4Total Population (2 Mile Radius)
69,180Retail Rent Range
$18.00 - $45.00
Bicycle Friendly
3NightlifeScore
4Average Household Income
$85,425Public Transportation
3MusicScore
4% College Educated (2 Mile Radius)
74.7%Diversity
4ArtsScore
4% 20-34 Year Old (2 Mile Radius)
29.8%Access to Higher Education
4
Vintage/ ThriftScore
2
% Renters (2 Mile Radius)
44.0%
Residential Rents
$$
TAMPA LIVABILITY SCORES RETAIL FLAVOR DEMOGRAPHICS
SEMINOLE HEIGHTS Walkability 2
FoodieScore
4Total Population (2 Mile Radius)
61,192Retail Rent Range
$15.00 - $40.00
Bicycle Friendly
1NightlifeScore
3Average Household Income
$47,291Public Transportation
1MusicScore
2% College Educated (2 Mile Radius)
45.2%Diversity
4ArtsScore
1% 20-34 Year Old (2 Mile Radius)
21.1%Access to Higher Education
1
Vintage/ ThriftScore
3
% Renters (2 Mile Radius)
39.6%
Residential Rents
$$
TORONTO LIVABILITY SCORES RETAIL FLAVOR DEMOGRAPHICS
DISTILLERY HISTORIC DISTRICT
Walkability 4
FoodieScore
2Total Population (2 Mile Radius)
245,204 Retail Rent Range
$20.00 - $60.00
Bicycle Friendly
4NightlifeScore
1Average Household Income
$88,513 Public Transportation
4MusicScore
2% College Educated (2 Mile Radius)
80.1%Diversity
2ArtsScore
3% 20-34 Year Old (2 Mile Radius)
35.4%Access to Higher Education
1
Vintage/ ThriftScore
1
% Renters (2 Mile Radius)
56.8%
Residential Rents
$$$
TORONTO LIVABILITY SCORES RETAIL FLAVOR DEMOGRAPHICS
WEST QUEEN WEST Walkability 4
FoodieScore
3Total Population (2 Mile Radius)
309,389 Retail Rent Range
$30.00 - $60.00
Bicycle Friendly
3NightlifeScore
3Average Household Income
$92,354 Public Transportation
4MusicScore
4% College Educated (2 Mile Radius)
79.3%Diversity
3ArtsScore
2% 20-34 Year Old (2 Mile Radius)
75.9%Access to Higher Education
2
Vintage/ ThriftScore
2
% Renters (2 Mile Radius)
54.4%
Residential Rents
$$$
ST. LOUIS - TORONTO
Delmar Loop
Seminole Heights
Distillery Historic District
West Queen West

66 CUSHMAN & WAKEFIELD
TORONTO LIVABILITY SCORES RETAIL FLAVOR DEMOGRAPHICS
KENSINGTON MARKET
Walkability 4
FoodieScore
3Total Population (2 Mile Radius)
319,052 Retail Rent Range
$24.00 - $44.00
Bicycle Friendly
3NightlifeScore
3Average Household Income
$95,178 Public Transportation
4MusicScore
4% College Educated (2 Mile Radius)
79.6%Diversity
4ArtsScore
4% 20-34 Year Old (2 Mile Radius)
37.0%Access to Higher Education
3
Vintage/ ThriftScore
4
% Renters (2 Mile Radius)
54.1%
Residential Rents
$$$
TULSA LIVABILITY SCORES RETAIL FLAVOR DEMOGRAPHICS
BLUE DOME DISTRICT
Walkability 2
FoodieScore
4Total Population (2 Mile Radius)
38,558Retail Rent Range
$10.00 - $20.00
Bicycle Friendly
2NightlifeScore
4Average Household Income
$52,201Public Transportation
1MusicScore
3% College Educated (2 Mile Radius)
53.0%Diversity
2ArtsScore
2% 20-34 Year Old (2 Mile Radius)
27.4%Access to Higher Education
2
Vintage/ ThriftScore
1
% Renters (2 Mile Radius)
51.8%
Residential Rents
$$
VANCOUVER LIVABILITY SCORES RETAIL FLAVOR DEMOGRAPHICS
GASTOWN Walkability 4
FoodieScore
4Total Population (2 Mile Radius)
195,686 Retail Rent Range
$35.00 - $55.00
Bicycle Friendly
4NightlifeScore
4Average Household Income
$81,201 Public Transportation
4MusicScore
3% College Educated (2 Mile Radius)
79.1%Diversity
1ArtsScore
3% 20-34 Year Old (2 Mile Radius)
60.1%Access to Higher Education
1
Vintage/ ThriftScore
2
% Renters (2 Mile Radius)
60.9%
Residential Rents
$$$
VANCOUVER LIVABILITY SCORES RETAIL FLAVOR DEMOGRAPHICS
MOUNT PLEASANT/MAIN STREET
Walkability 3
FoodieScore
4Total Population (2 Mile Radius)
231,778 Retail Rent Range
$20.00 - $43.00
Bicycle Friendly
4NightlifeScore
3Average Household Income
$85,689 Public Transportation
2MusicScore
3% College Educated (2 Mile Radius)
77.2%Diversity
2ArtsScore
4% 20-34 Year Old (2 Mile Radius)
31.3%Access to Higher Education
2
Vintage/ ThriftScore
2
% Renters (2 Mile Radius)
56.3%
Residential Rents
$$$
TORONTO - VANCOUVER
KensingtonMarket
Blue Dome District
Gastown
Mount Pleasant

67Cool Streets Report
WASHINGTON DC LIVABILITY SCORES RETAIL FLAVOR DEMOGRAPHICS
H STREET CORRIDOR
Walkability 4
FoodieScore
4Total Population (2 Mile Radius)
155,001Retail Rent Range
$40.00 - $60.00
Bicycle Friendly
4NightlifeScore
4Average Household Income
$105,012Public Transportation
3MusicScore
4% College Educated (2 Mile Radius)
68.6%Diversity
4ArtsScore
4% 20-34 Year Old (2 Mile Radius)
35.4%Access to Higher Education
2
Vintage/ ThriftScore
3
% Renters (2 Mile Radius)
59.2%
Residential Rents
$$$
WASHINGTON DC LIVABILITY SCORES RETAIL FLAVOR DEMOGRAPHICS
UNION MARKET Walkability 4
FoodieScore
4Total Population (2 Mile Radius)
168,125Retail Rent Range
$40.00 - $60.00
Bicycle Friendly
3NightlifeScore
3Average Household Income
$108,717Public Transportation
3MusicScore
2% College Educated (2 Mile Radius)
71.0%Diversity
4ArtsScore
2% 20-34 Year Old (2 Mile Radius)
36.1%Access to Higher Education
4
Vintage/ ThriftScore
3
% Renters (2 Mile Radius)
58.6%
Residential Rents
$$$
WASHINGTON DC LIVABILITY SCORES RETAIL FLAVOR DEMOGRAPHICS
SHAW (BETWEEN 11TH AND 7TH STREETS, W AND M STREETS NW)
Walkability 4
FoodieScore
4Total Population (2 Mile Radius)
220,634Retail Rent Range
$50.00 - $70.00
Bicycle Friendly
4NightlifeScore
4Average Household Income
$117,035Public Transportation
3MusicScore
4% College Educated (2 Mile Radius)
77.4%Diversity
4ArtsScore
3% 20-34 Year Old (2 Mile Radius)
43.4%Access to Higher Education
4
Vintage/ ThriftScore
2
% Renters (2 Mile Radius)
64.0%
Residential Rents
$$$
WASHINGTON DC LIVABILITY SCORES RETAIL FLAVOR DEMOGRAPHICS
U STREET/14TH STREET CORRIDOR
Walkability 4
FoodieScore
4Total Population (2 Mile Radius)
231,073Retail Rent Range
$60.00 - $80.00
Bicycle Friendly
4NightlifeScore
4Average Household Income
$115,126Public Transportation
4MusicScore
4% College Educated (2 Mile Radius)
75.5%Diversity
4ArtsScore
4% 20-34 Year Old (2 Mile Radius)
42.6%Access to Higher Education
2
Vintage/ ThriftScore
2
% Renters (2 Mile Radius)
64.9%
Residential Rents
$$$$
WASHINGTON DC
H Street Corridor
Union Market
Shaw
U Street

2016 Edition
Copyright © 2016 Cushman & Wakefield. All rights reserved. The information contained within this report is gathered from multiple sources considered to be reliable. The information may contain errors or omissions and is presented without any warranty or representations as to its accuracy.
Our 43,000 employees in more than 60 countries help investors and occupiers optimize the value of their real estate by combining our global perspective and deep local knowledge with an impressive platform of real estate solutions. Cushman & Wakefield is among the largest commercial real estate services firms with revenue of $5 billion across our core services of agency leasing, asset services, capital markets, facility services (C&W Services), global occupier services, investment & asset management (DTZ Investors), project & development services, tenant representation, and valuation & advisory.
Cushman & Wakefield is a leading global real estate services firm that helps clients transform the way people work, shop, and live.
Garrick H. BrownVice PresidentRetail Research, [email protected]