cyclic performance of self-centering post …
TRANSCRIPT
CYCLIC PERFORMANCE OF SELF-CENTERING POST-TENSIONED STEEL BEAM-COLUMN CONNECTIONS USING SHAPE MEMORY ALLOY ENERGY
DISSIPATORS
by
Md Arman Chowdhury
B.Sc., Ahsanullah University of Science and Technology, 2013
A THESIS SUBMITTED IN PARTIAL FULFILLMENT
OF THE REQUIREMENTS FOR THE DEGREE OF
MASTER OF APPLIED SCIENCE
in
The College of Graduate Studies
(Civil Engineering)
THE UNIVERSITY OF BRITISH COLUMBIA
(Okanagan)
November 2018
© Md Arman Chowdhury, 2018

ii
The following individuals certify that they have read, and recommend to the College of Graduate Studies for acceptance, a thesis entitled:
CYCLIC PERFORMANCE OF SELF-CENTERING POST TENSIONED STEEL BEAM COLUMN CONNECTIONS USING SHAPE MEMORY ALLOY ENERGY DISSIPATORS
Submitted by Md Arman Chowdhury in partial fulfillment of the requirement of the degree of
Master of Applied Science
Dr. M. Shahria Alam, Associate Professor, School of Engineering, UBC Supervisor
Dr. Solomon Tesfamariam, Professor, School of Engineering, UBC Supervisory Committee Member
Dr. Abbas S. Milani, Professor, School of Engineering, UBC Supervisory Committee Member
Dr. Homayoun Najjaran, Professor, School of Engineering, UBC University Examiner

iii
Abstract
Driven by a need to reduce repair costs and downtime in structures following a major
earthquake, self-centering (SC) systems have been introduced. Post-tensioned (PT) high strength
steel strands have shown promising results in providing the SC capability in steel frames, where
the beams are compressed to columns.
In this study, the lateral cyclic performance of the SC connections is assessed through finite
element analysis. At the beginning, the lateral load-deformation behavior of previously tested
experimental specimens is validated with three-dimensional finite element models. The validated
models are then modified accordingly to investigate the applicability of other techniques, i.e.
stiffened angle connection, or other types of materials, i.e. shape memory alloy (SMA). Through
design of experiment methodology, parametric studies in component level, i.e. stiffened angle, are
conducted to provide some insight into the effect of different stiffener sizes on the strength and
energy dissipation capacity of the connection. Afterward, four different techniques of
incorporating SMA in the SC connections are proposed based on extensive parametric studies.
Segmented PT connection is possible with shorter length SMA strand which can even sustain
higher drift demand compared to the SC connections with steel strand. Hybrid strand, i.e.
combination of steel strand and SMA strand, can further reduce the amount of SMA material in
the connection. The use of SMA angles as energy dissipaters will remove the need for the
replacement of the energy dissipating elements due to damage. Lastly, the applicability of SMA
bolts in end-plate based interior and exterior connections are investigated through a parametric
study.

iv
Lay Summary
During an earthquake, structures such as buildings and bridges experience excessive ground
shaking. Recent building codes permit the designer to design the building in such a way that it can
deform during a seismic activity, but it should not collapse completely. However, the concept of
collapse prevention was recently proved to be uneconomical because the damaged structure can
put an immense economic burden on the overall economy of a country. This study intended to
contribute to the knowledge of damage free connection which is also known as the SC structures.
Smart materials such as shape memory alloys (SMA) can remember their original shape and can
return to their previous shape after the removal of the applied load. By combining the concept of
the SC structures with SMA, next generation structure can completely prevent structural damage
which was proven and further investigated in this study with the use of three-dimensional finite
element models.
v
Preface
A portion of this research work has been submitted to peer-reviewed journals for publication.
All analytical modeling, literature review and mathematical calculations presented in the following
journal papers have been solely carried out by the author. The thesis supervisor was responsible
for the research guidance and review of the work produced by the author. All publications listed
below are used with permission. Permissions from all the co-authors were also taken.
List of Publications Related to this thesis
A version of chapter 4 has been published in the following conference. This study was written
and conducted by Md Arman Chowdhury, further reviewed by Ahmad Rahmzadeh and Saber
Moradi, under the supervision of Dr. Shahria Alam:
• Md Arman Chowdhury, Ahmad Rahmzadeh, Saber Moradi, M. Shahria Alam. (2017).
“Cyclic behavior of post-tensioned steel beam-column connections with reduced length
strands”. 6th Int Conference on Engineering Mechanics and Materials, CSCE,
Vancouver, BC, May-June 2017, Paper ID: 519
A portion of Chapter 3 and 4 is in the submission process for journal publication. Md Arman
Chowdhury is preparing the following article and Ahmad Rahmzadeh is reviewing the
manuscript under the supervision of Dr. Shahria Alam:
• Md Arman Chowdhury, Ahmad Rahmzadeh, and M. Shahria Alam (2018). “Techniques
to improve the seismic performance of the self-centering posttensioned connections.”
(To be submitted in the Journal of Smart Materials and Structures).

vi
A portion of Chapter 4 has been accepted for publication to the Journal of Intelligent Material
Systems and Structures, as listed below. This study was written and conducted by Md Arman
Chowdhury, further reviewed by Ahmad Rahmzadeh and Saber Moradi, under the supervision
of Dr. Shahria Alam:
• Md Arman Chowdhury, Ahmad Rahmzadeh, Saber Moradi and M. Shahria Alam
(2018). “Feasibility of using reduced length superelastic shape memory alloy strands
in post-tensioned steel beam-column connections.” Journal of Intelligent Material
Systems and Structures (Accepted for publication).
A portion of Chapter 4 is in the submission process for journal publication. Md Arman
Chowdhury is preparing the following article and Ahmad Rahmzadeh is reviewing the
manuscript under the supervision of Dr. Shahria Alam:
• Md Arman Chowdhury, Ahmad Rahmzadeh, and M. Shahria Alam (2018). “Finite
element simulation study on the cyclic behavior of stiffened angle connection.” (To
be submitted in the Journal of Constructional Steel Research).
A portion of Chapter 4 is in the submission process for journal publication. Md Arman Chowdhury
is preparing the following article and Ahmad Rahmzadeh is reviewing the manuscript under the
supervision of Dr. Shahria Alam:
• Md Arman Chowdhury, Ahmad Rahmzadeh, and M. Shahria Alam (2018). “Cyclic
performance of post-tensioned steel beam-column connection with end plates and
shape memory alloy bars” (To be submitted in the Journal of Constructional Steel
Research).

vii
Table of Contents
Abstract .................................................................................................................................... iii
Lay Summary ........................................................................................................................... iv
Preface ....................................................................................................................................... v
Table of Contents .................................................................................................................... vii
List of Tables ......................................................................................................................... xiii
List of Figures ......................................................................................................................... xv
List of Notations ..................................................................................................................... xx
Acknowledgements .............................................................................................................. xxiv
Dedication ............................................................................................................................ xxvi
Chapter 1 Introduction ........................................................................................................... 1
1.1 General ...................................................................................................................... 1
1.2 Objectives ................................................................................................................. 3
1.3 Organization of the Thesis ........................................................................................ 4
Chapter 2 Literature Review .................................................................................................. 6
2.1 General ...................................................................................................................... 6
2.2 Background and Research Motivation ...................................................................... 7
2.2.1 Design Practice before the Northridge Earthquake ........................................... 7

viii
2.2.2 Performance of MRFs during the Northridge Earthquake ................................ 8
2.2.3 Design Changes after the Northridge Earthquake ............................................. 9
2.3 PT Steel Beam-Column Connections ..................................................................... 13
2.3.1 PT Connection with Top-and Seat Angles ...................................................... 14
2.3.2 PT Connection with ED Bars .......................................................................... 15
2.3.3 PT Connection with Friction Damped Device ................................................ 17
2.3.4 PT Connection with WHP ............................................................................... 19
2.4 SMA based SC Connections ................................................................................... 20
2.4.1 General............................................................................................................. 20
2.4.2 SMA Tendon ................................................................................................... 22
2.4.3 End Plate-based Connection ............................................................................ 24
2.4.4 Others............................................................................................................... 27
2.5 Summary of Review ............................................................................................... 28
Chapter 3 Finite Element Model Development and Validation ........................................... 30
3.1 General .................................................................................................................... 30
3.2 Methodology and Model Development .................................................................. 30
3.3 FE Model Validation............................................................................................... 38
3.4 Parametric Study on Stiffened Angle PT Connection ............................................ 42

ix
3.4.1 Effect of Stiffener Thickness ........................................................................... 43
3.4.2 Effect of Gage Length ..................................................................................... 45
3.4.3 Effect of Flange Reinforcing Plate Thickness ................................................. 48
3.5 FE Modeling and Validation of Top-and-seat Angle ............................................. 51
3.5.1 General............................................................................................................. 51
3.5.2 Experimental Setup.......................................................................................... 51
3.5.3 Model Development and Validation ................................................................ 56
3.5.4 Top-and-Seat Angle with Stiffener.................................................................. 59
3.5.5 Parametric Study on Stiffened Angle .............................................................. 61
3.5.5.1 Result and discussion ................................................................................... 62
3.6 Summary ................................................................................................................. 66
Chapter 4 Application of SMA in Self-Centering Beam-Column Connections .................. 68
4.1 General .................................................................................................................... 68
4.2 Cyclic Response of PT Connection with Shorter Length Steel and SMA Strand .. 69
4.2.1 Incorporating Shorter Length PT Steel Strand ................................................ 69
4.2.1.1 Effect of PT Strand Length .......................................................................... 70
4.2.1.2 Effect of PT force ......................................................................................... 75
4.2.2 Incorporating SMA Strand .............................................................................. 76

x
4.2.2.1 Introduction .................................................................................................. 76
4.2.2.2 Effect of SMA Strand in PT Connection ..................................................... 78
4.2.2.3 Effect of Initial PT force on SMA Strand .................................................... 90
4.3 Cyclic Response of Hybrid Strands ........................................................................ 93
4.4 Cyclic Response of PT Connection with SMA Angle ............................................ 97
4.4.1 General............................................................................................................. 97
4.4.2 Discussion on Plastic Strain .......................................................................... 102
4.4.3 Discussion on Energy Dissipation Capacity .................................................. 103
4.4.4 Discussion on the Slippage of Bolts .............................................................. 105
4.4.5 Discussion on the Limit States of Bolts ........................................................ 106
4.5 Cyclic Response of SMA based End plate Connection ........................................ 108
4.5.1 General........................................................................................................... 108
4.5.2 Exterior Beam-Column Connection .............................................................. 109
4.5.2.1 Reference SC Connection with SMA Bolts (Fang et al. 2012) .................. 109
4.5.2.2 Reference SC Connection with SMA Bolts (Ma et al. 2007) .................... 112
4.5.2.3 Model Development and Validation .......................................................... 112
4.5.2.4 Parametric Study on Ma et al. 2007 ........................................................... 113
4.5.2.5 Parametric Study on SMA Bolt with PT Cable .......................................... 117

xi
4.5.3 Interior End plate Connection........................................................................ 121
4.5.3.1 Model Development ................................................................................... 121
4.5.3.2 Selection of SMA and Endplate Thickness ................................................ 123
4.5.3.3 Sensitivity Analysis .................................................................................... 125
4.5.3.4 2k Factorial Design .................................................................................... 128
4.5.3.5 Initial Stiffness (Ki) .................................................................................... 129
4.5.3.6 Load Capacity (Fmax) .................................................................................. 130
4.5.3.7 Energy Dissipation (Ed) .............................................................................. 130
4.5.3.8 Residual Displacement (Rd) ....................................................................... 131
4.5.3.9 Verification of Sensitivity Analysis ........................................................... 133
4.5.3.10 Effect of High Strength SMA Tendon ..................................................... 135
4.6 Summary ............................................................................................................... 136
Chapter 5 Summary, Conclusions, and Recommended Future Research .......................... 138
5.1 General .................................................................................................................. 138
5.2 Contribution of this Research ............................................................................... 139
5.3 Conclusions ........................................................................................................... 140
5.3.1 Development of FE Models and Parametric Study ....................................... 140
5.3.2 Application of SMA in SC Connection ......................................................... 141

xii
5.4 Recommendation for Future Research .................................................................. 144
References ............................................................................................................................. 146
xiii
List of Tables
Table 3.1 Response parameters..................................................................................................... 44
Table 3.2 Response parameters for different gage length ............................................................. 46
Table 3.3 Response parameter for different reinforcing plate thickness ...................................... 50
Table 3.4 Experimental test matrix of bolted top and seat angles ................................................ 54
Table 3.5 Loading history for experimental study ........................................................................ 55
Table 3.6 factor selection for factorial analysis ............................................................................ 61
Table 3.7 factorial analysis results ................................................................................................ 63
Table 4.1 Response values observed at 3.5% drift ....................................................................... 72
Table 4.2 Material properties of SMA used in this study ............................................................. 77
Table 4.3 Response values observed for different SMA at a story drift of 3.5% ......................... 86
Table 4.4 Strain on SMA strand ................................................................................................... 87
Table 4.5 SMA Properties............................................................................................................. 97
Table 4.6 Cyclic response of SMA angle connection ................................................................... 99
Table 4.7 Material properties of SMA bolts ............................................................................... 111
Table 4.8 SMA Properties*......................................................................................................... 123
Table 4.9 Factors and levels considered for factorial analysis ................................................... 125
Table 4.10 Full factorial design (24 = 16 models). ..................................................................... 126
Table 4.11 Response quantities................................................................................................... 127
Table 4.12 Coefficient of regression model for each response ................................................... 134

xiv
Table 4.13 Response of verification models ............................................................................... 134

xv
List of Figures
Figure 1.1 Outline of the thesis ....................................................................................................... 5
Figure 2.1 Bolted web welded flange connection ........................................................................... 8
Figure 2.2 Welding connection before Northridge ........................................................................ 9
Figure 2.3 Conventional hysteretic behavior of Steel moment resisting frame (Chancellor et al.,
2014) .......................................................................................................................... 10
Figure 2.4 Hysteretic behavior of Steel moment resisting frame with RBS (Chancellor et al.,
2014) .......................................................................................................................... 11
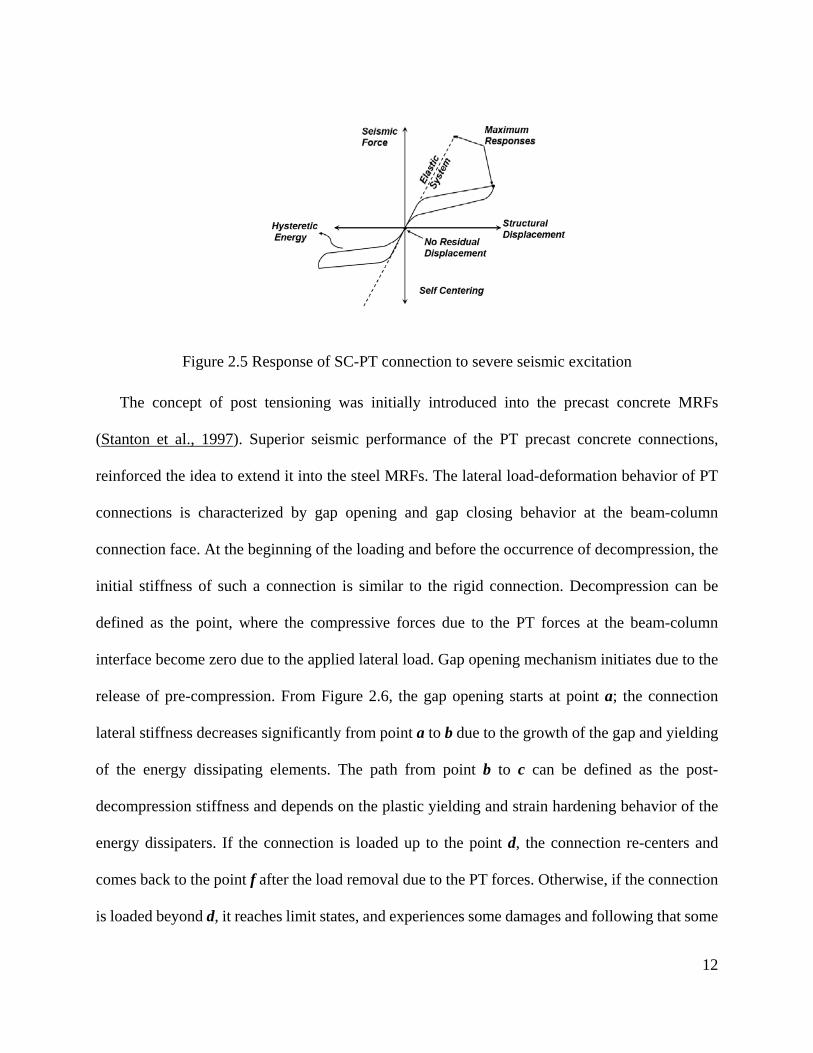
Figure 2.5 Response of SC-PT connection to severe seismic excitation ...................................... 12
Figure 2.6 Lateral load-displacement behavior of SC-PT connection Adapted from (Moradi and
Alam, 2017a) ............................................................................................................. 13
Figure 2.7 Bolted connection with ED bar (Adapted from Ma et al. (2007))............................... 16
Figure 2.8 PT connection with friction based device at the bottom flange .................................. 17
Figure 2.9 PT connection with web hourglass pin to dissipate energy ......................................... 20
Figure 3.1 Geometry of the PT beam-column connection. Adapted from Ricles et al. (2002) .... 32
Figure 3.2 Contact between structural components of PC4 connection ....................................... 33
Figure 3.3 Material properties assumed for (a) bilinear kinematic for all steel components and
trilinear kinematic for steel angles, and (b) boundary conditions used in FE model 34
Figure 3.4 Gap opening/closing behavior of a posttensioned connection. ................................... 35
Figure 3.5 Models for mesh sensitivity analysis of the angles: (i) coarse mesh, (ii) current mesh,
and (iii) finer mesh. .................................................................................................... 36
Figure 3.6 Beam flange mesh sensitivity with coarser, current and finer meshes. ....................... 37

xvi
Figure 3.7 Sensitivity analysis result for (i) top and seat angle, and (ii) beam flange. ................. 37
Figure 3.8 Meshed elements (a) Angle, (b) Bolt, and (c) Full specimen ...................................... 38
Figure 3.9 Typical diagram of (a) Bilinear kinematic model in large strains and (b) Trilinear
kinematic model in large strains ................................................................................ 40
Figure 3.10 Analytical results in comparison with the test results: (a) previous FE results
(Adapted from Moradi and Alam, 2015), and (b) Current study .............................. 41
Figure 3.11 Finite element model (a) full specimen, and (b) stiffened angle ............................... 43
Figure 3.12 Load-displacement behavior of PC4 with the stiffener thickness of (a) 0.5 mm, (b)
1.0 mm, and (c) 1.5 mm ............................................................................................. 45
Figure 3.13 Load-displacement behavior of PC4 with stiffened angles and gage lengths of (a)
63.6 mm (g/t = 4.0), (b) 113.6 mm (g/t = 7.10), and (c) 163.6 mm (g/t = 10.2) ....... 48
Figure 3.14 Load-displacement behavior of PC4 with reinforcing plate thickness of (a) 12.7 mm,
and (b) 25.4 mm ......................................................................................................... 49
Figure 3.15 Stiffened angle with two different reinforcing plate thickness (zoom in view of
compared models in the right side) at largest drift .................................................... 50
Figure 3.16 (a) Experimental setup of top and seat angle connection, (b) Angle deformation
behavior in actual connection, and (c) Angle deformation in simulated setup. ........ 53
Figure 3.17 Experimental setup used by Garlock et al. (2003) .................................................... 56
Figure 3.18 Developed FE model for top-and-seat angle connection .......................................... 57
Figure 3.19 (a)-(g) Comparison between experimental and finite element analysis results ......... 59
Figure 3.20 Response of L8-58-4 NW specimen with (a) full-length stiffener and (b) half-length
stiffener ...................................................................................................................... 60
Figure 3.21 Effect of stiffener thickness on load-displacement behavior .................................... 62

xvii
Figure 3.22 (a-p) Load-deflection behavior of model 1-16 .......................................................... 66
Figure 4.1 PT strand length (a) PC4-RL1 (1019 mm), (b) PC4-RL2 (1528 mm), (c) PC4-RL3
(2038 mm), (d) PC4-RL4 (2292 mm), and (e) PC4-OL (3057 mm) ......................... 70
Figure 4.2 Analytical response of specimens (a) PC4-RL1, (b) PC4-RL2, (c) PC4-RL3, and (d)
PC4-RL4 compared to the original specimen PC4-OL ............................................. 71
Figure 4.3 Energy dissipation capacity of PT connections with different strand length .............. 73
Figure 4.4 (a) Posttensioning force of specimen PC4, and (b) Posttensioning force of specimen
PC4 RL1 .................................................................................................................... 75
Figure 4.5 Load-displacement behavior for reduced force in specimen (a) PC4-RL1 and (b) PC4-
RL2 ............................................................................................................................ 76
Figure 4.6 Idealized behavior of superelastic SMA ...................................................................... 78
Figure 4.7 Free body diagram of PT connection .......................................................................... 79
Figure 4.8 (a), (b) and (c): Load-displacement behavior of shorter length NiTi and FeMnAlNi
alloy ........................................................................................................................... 82
Figure 4.9 (a) and (b) Comparison of FeNCATB alloy with both original (PC4-OL) and reduced
length strand specimen (PC4-RL1) ........................................................................... 83
Figure 4.10 (a) and (b) Comparison of CuAlMn alloy with both original length (PC4-OL) and
reduced length strand (PC4-RL1) specimen .............................................................. 84
Figure 4.11 Energy dissipation capacity of different SMA compared to the original specimen
(PC4-OL) ................................................................................................................... 85
Figure 4.12 Posttensioning forces in (a) steel, (b) FeMnAlNi, (c) NiTi, (d) FeNCATB, and (e)
CuAlMn strands ......................................................................................................... 89
Figure 4.13 Response between SMA and steel strand at 5% drift ................................................ 90

xviii
Figure 4.14 Load-displacement behavior of specimens with (a) NiTi strands, (b) FeMnAlNi
strands, and (c) FeNCATB strands having different post-tensioning forces ............. 91
Figure 4.15 Beam stress contour of FeNCATB-RL1 at 3.5% drift for (a) PT=0.34Fu, (b)
PT=0.60Fu, and (c) PT=0.80Fu forces ...................................................................... 93
Figure 4.16 FE model of hybrid strands connection ..................................................................... 95
Figure 4.17 Load displacement behavior of PT connection with composite tendon (a) NiTi, (b)
FeMnAlNi, and (c) FeNCATB .................................................................................. 96
Figure 4.18 Posttensioning force-displacement response of NiTi strand with full-length SMA
strand and hybrid strand ............................................................................................. 96
Figure 4.19 Load displacement behavior of PC4 and PC2 with (a) – (b) SMA1, (c)-(d) SMA2,
(e)-(f) SMA3, and (g)-(h) SMA4 ............................................................................. 102
Figure 4.20 Equivalent plastic strain (a) at largest drift for PC4 SMA1 and (b) after analysis for
PC4 SMA1, (c) at largest drift for PC4, and (d) at the end of analysis for PC4 ...... 103
Figure 4.21 (a) SC behavior of SDOF system, and (b) Nonlinear load-drift response of SDOF
system (Adapted from (Christopoulos et al., 2002a)) .............................................. 105
Figure 4.22 (a) Load-displacement behavior of PC2 SMA4, and (b) Slippage of the bolt at the
largest drift ............................................................................................................... 106
Figure 4.23 (a) Von Mises stress at the largest drift, (b) Normalized bolt depth, (c) Rupture Index
(RI) of bolts, and (d) Plasticity Index (PI) of bolts .................................................. 108
Figure 4.24 Connection details for SMA-D10-240-d: general layout and beam section layout 110
Figure 4.25 (a) Model development of external end plate connection, and (b) Moment-rotation
response of specimen SMA-D10-240-d .................................................................. 111
Figure 4.26 (a) FE model and (b) validation of external SMA based end plate connection ...... 113
xix
Figure 4.27 End plate connection with (a) NiTi alloy, (b) FeMnAlNi alloy, (c) FeNCATB alloy,
and (d) CuAlMn alloy .............................................................................................. 115
Figure 4.28 End plate connection with (a) NiTi alloy, (b) FeMnAlNi alloy, (c) FeNCATB alloy,
and (d) CuAlMn alloy .............................................................................................. 117
Figure 4.29 End plate connection with (a) NiTi alloy, (b) FeMnAlNi alloy, (c) FeNCATB alloy,
and (d) CuAlMn alloy .............................................................................................. 119
Figure 4.30 End plate connection with (a) NiTi alloy, (b) FeMnAlNi alloy, (c) FeNCATB alloy,
and (d) CuAlMn alloy .............................................................................................. 121
Figure 4.31 (a) FE model of end plate connection, (b) end plate, and (c) SMA tendon ............. 123
Figure 4.32 Gap opening behavior of SMA based end plate connection ................................... 129
Figure 4.33 Factor interaction plot (a) initial stiffness, (b) load capacity, (c) energy dissipation,
and (d) residual displacement .................................................................................. 132
Figure 4.34 Lateral load-displacement behavior of model 9, 10, 14, and 15 ............................. 135
Figure 4.35 end plate connection behavior with (a) NiTi alloy, and (b) FeNCATB alloy ......... 136

xx
List of Notations
α Strain hardening parameter
ki initial stiffness
Mp The maximum plastic moment
t angle thickness
g gage length
Ed The energy dissipation capacity
Rd The residual deformation
Fmax the load capacity
Kd The post-decompression stiffness
σy Yield stress
σu Ultimate strength
Δ Applied displacement
fy austenite to martensite starting stress
fp1 austenite to martensite finishing stress
fT1 martensite to austenite starting stress

xxi
fT2 martensite to austenite finishing stress
εs maximum recoverable strain
αt ratio of transformation stresses under tension and compression
εi initial strain
εy yield strain
εPT strain in PT at any level
σi the amount of initial stress
EPT2 post-yield modulus
θ the total rotation of the beam
dPT the depth of strand from the centroid of the contact area
Lpt the length of the SMA strand
Eb the modulus of elasticity of the beam
Ab the cross-sectional area of the beam
Apt the cross-sectional area of the SMA strand
δ Residual displacement at a story drift of 3.5%
Ftheory Theoretical force

xxii
FFE Force from FE analysis
ls Length of steel strand
lSMA Length of SMA strand
εst Strain in steel strand
εSMA Strain in SMA strand
PI plasticity index
RI rupture index
PEEQ the equivalent plastic strain
p the hydrostatic stress
q the von Mises stress
treq the required end plate thickness
Mnp the moment induced by the bolt rows
yp the yield line mechanism parameter
Fyp the yield strength of the end plate
bp the end plate width
hi the distance between compression flange centerline to the edge of the
tension side bolts

xxiii
Pf0 the distance between the inside beam tension flange to the nearest outside
bolt row
s the distance from centerline of the most inside or outside tension bolt row
to the edge of the yield line pattern

xxiv
Acknowledgements
I would like to express my sincere gratitude toward my supervisor, Dr. M. Shahria Alam for
providing me with an opportunity to work with him at The University of British Columbia, Okanagan.
I couldn’t have asked more for a better mentor and guide for my MASc program. I am also grateful to
Ahmad Rahmzadeh (PhD Student, UBC Okanagan). I really appreciate all the support, guidance, and
motivation that he has provided me through my study at UBC. He has been instrumental with
knowledge, support, and mentoring that made my graduate experience at UBC so impeccably
productive and rewarding and made a great contribution to the success of this research. Having coffee
together every day was a great excuse and opportunity for me to discuss about the research related
questions and to have his strong criticism on every steps of my research.
I would like to thank my committee members, Dr. Solomon Tesfamariam and Dr. Abbas Milani
for always supporting my research work and providing me with great feedback from time to time,
helping me improve the quality of my work immensely. Graduate school at UBC’s Okanagan campus
has provided an excellent educational experience. I would also like to acknowledge CMC
Microsystems for the provision of products and services that facilitated this research, including
ANSYS Multiphysics. The University Graduate Fellowship (UGF) and other scholarships awarded by
the University of British Columbia are also acknowledged.
I felt privileged to get the opportunity to work with such an excellent group of graduate students in
the Applied Laboratory for Advanced Materials & Structures (ALAMS) research group, who helped
me during my numerical simulation study and offered technical knowledge, and friendship. Besides,
Friday afternoon was a great relief from all the stresses because of this bunch of enthusiastic badminton
playing researchers.

xxv
I am truly grateful for the unconditional support of my family, without which I would likely not be
here today. My parents have offered endless support, wise advice, and love. I cannot appreciate enough
the assistance and encouragement from my wife Punam. I want to thank her for showing patience,
giving space and for sacrificing some beautiful summer days in last few months during the evenings
and over the weekends.

xxvi
Dedication
Dedicated to my parents and my wife
1
Chapter 1 Introduction
1.1 General
During the 1960’s, welded steel beam-column connections were considered to be the most
ductile system against earthquakes (Bruneau et al., 2011). In these connections, the beam web and
flanges are welded to the column flange to get maximum plastic moment (Christopoulos et al.,
2002b). Confidence in designing welded steel beam-column connection encouraged manufacturers
to introduce a variety of member sizes, frame dimensions, flange weld processes, and different
system configurations (Youssef et al., 1995). Therefore, a number of industrial and commercial
buildings were constructed using moment resisting frames (specifically in the western part of the
United States) during the 1960’s. However, the 1994 Northridge earthquake indicated that welded
connections were susceptible to brittle fracture at the beam-column joints. This failure mode was
observed even for structures subjected to a moderate level of ground shaking. Although, these
buildings did not collapse (which is a design objective in building codes), the connection
performance was not as expected. The investigation revealed that similar damage was observed in
a limited number of buildings during 1992 Landers, 1992 Big Bear and 1989 Loma Prieta
earthquakes (FEMA (2000)). Further studies revealed that the main cause of failure was the low
rotational capacity of the beam-to-column welded connections (Christopoulos et al., 2002b). Based
on the aforementioned investigations, significant amendments were introduced to the pre-
Northridge moment resisting frame (MRF) design approach (Engelhardt and Sabol, 1998).

2
A substantial amount of research has been conducted over the past decades to avoid the brittle
failure at the beam-column connections of the existing MRFs. The idea was to shift the plastic
hinges away from the beam-column joint. In this case, beam flanges will be subjected to severe
local buckling with permanent residual deformations; however, total collapse of the structure can
be prevented by ensuring life safety. Plastic hinge relocation can be achieved by reducing the beam
section (RBS) close to the joint (Tremblay and Filiatrault, 1997), adding reinforcing cover plates
on beam flanges close to the joint (Engelhardt and Sabol, 1998) and applying haunches at the joint
(Uang et al., 2000).
For new construction, significant design changes have been made after the 1994 Northridge
earthquake allowing limited residual deformation. However, residual deformations that may exist
after an earthquake can require expensive repair and, in some cases, the demolition of the damaged
structures is required. Depending on the scenario, the total cost of demolition or repair work can
be a burden to the overall economy of a country. The earthquake of magnitude 6.5 occurred in
Christchurch, New Zealand in May 2014 can be an example. The repair works of which required
$40 billion (New Zealand’s dollar) that was approximately 20% of the total GDP of the country.
This indicates that the repair and reconstruction of structures with high residual drift is not often
economically feasible (McCormick et al., 2008).
To address the above-mentioned issues, a new class of lateral force resisting system has been
developed where beams are pre-compressed to columns by using high strength steel strands,
providing the re-centering ability into the connection against lateral forces (Ricles et al., 2001).
Moreover, ductility in a PT connection is provided by a gap opening mechanism. Due to the gap
opening between the steel columns and beams, a reduction in stiffness occurs, which is desirable

3
in the sense that the system attracts less forces and softening occurs without structural damage
(Chancellor et al., 2014). Since PT steel strands are not responsible for energy dissipation during
cyclic loading, additional components based on the yielding or friction mechanism are attached to
the connection to dissipate energy.
Although different studies have confirmed the applicability of SC connections in moment
resisting frames, a limited number of studies focused on implementing smart materials such as
shape memory alloy (SMA). Moreover, there is no current seismic design guideline for designing
the connection with SMA materials. Therefore, research is still needed to further investigate the
feasibility of SMA in SC structures.
1.2 Objectives
The overall objective of this study is to develop design guideline for smart materials-based SC
connections and at the same time improving the seismic performance of existing top and seat
angle-based connections. The three structural subassemblies are investigated numerically in this
research
1. Top and seat angle-based PT connection
2. Stiffened angle-based PT connection, and
3. End plate based interior and exterior PT connection
The study has the following specific objectives:
• To improve the numerical modeling approach for investigating the seismic performance of
SC-PT connection.

4
• To optimize the SC PT connection parameters that characterize the hysteretic behavior in
order to optimize the global performance of the structure.
• To investigate the cyclic behaviour of SMA angle-based PT connection.
• To investigate the cyclic behaviour of SMA bolt based end plate connection.
1.3 Organization of the Thesis
Existing literature is reviewed thoroughly in the next chapter (Chapter 2) to present the
development and the state-of-the art in steel SC-PT connection techniques. References could be
extended to SC reinforced or timber structures, which is beyond the scope of this study.
Chapter 3 explained the numerical simulation model development stages that have been used
in this study. Different modeling techniques have been used to increase the efficiency and
reliability of the existing modeling techniques that already exist in the literature. This section also
introduces the concept of stiffened angle connection. A validated model was modified to
investigate the influence of stiffened angle with different thickness, gage length, and different
reinforcing plate thickness. To further optimize the performance of stiffener parameters, different
angle sizes with different geometric and material properties were investigated numerically.
In Chapter 4, the feasibility of utilizing SMA in SC connection has been introduced. Four
different concepts have been introduced such as (i) shorter length SMA strand in SC-PT
connections, (ii) hybrid strand-based connection, (iii) SMA angle-based connection, and (iv) SMA
bolt based end-plate connection. The results are summarized based on extensive parametric
studies.

5
Chapter 5 presents the findings and conclusions of the research along with some
recommendations for future study. The outline of this thesis is shown in Figure 1.1.
Figure 1.1 Outline of the thesis
6
Chapter 2 Literature Review
2.1 General
In the past earthquakes, the traditional moment resisting frames suffered serious damages.
Most of the connection cracked in the regions of beam-column connections in a brittle manner.
After the hazardous behavior of steel moment resisting frames, concerns were raised among the
researchers about the performance of those connections. As a result, partially restrained
connections (PR), have been developed and attracted considerable attention over the past few years
(Ricles et al., 2002). Fully restrained connections have shown poor hysteretic behavior and are
found to be inefficient during strong earthquakes. Different techniques such as the use of flange
reinforcing plate, bolted haunch brackets and welded haunch brackets are also investigated by
Fang et al., (2014) and Wolski et al., (2009). However, the damage of steel moment resisting
frames under moderate to severe earthquakes is still unavoidable.
Due to the permanent deformation of a steel moment resisting frame after a severe earthquake,
it is almost impossible to repair it afterward. In some cases, the cost involved in repairing the
deformation is much higher and not economically feasible. To minimize or remove the permanent
deformation, research has been done on some smart materials (i.e shape memory alloy) to evaluate
its applicability. Shape memory alloys (SMAs) have shown good prospect to be used in steel
moment resisting frames, bracing systems, isolation of structures and retrofitting purposes (Alam
et al., 2007). However, the major concern is the cost. Shape memory alloy is expensive. A large
amount of material is needed for civil engineering applications. This high cost is due to its complex
manufacturing and training process along with its costly metals used in the alloy (Alam et al.,
7
2007). However, use of superelastic SMA could be advantageous as they do not experience
permanenet deformation even undergoing large plastic deformation. Structures can incorporate
SMA in some energy dissipation techniques in such a way that the damage is confined to those
elements. Besides SMA, other energy dissipation devices could be used. These elements undergo
inelastic deformation while other structural components such as beams and columns remain
essentially elastic, a concept similar to the use of the partially restrained connection. However,
the performance of partially restrained connections can be further improved by introducing post-
tensioning into the moment resisting (Ocel et al., 2004; Qiu and Zhu, 2014; Wang et al., 2016;
Wolski et al., 2009). The connections have the ability to re-center and absorb energy during lateral
loading and damaged components can be repaired afterward. These connections use PT high
strength steel strands to assemble beams and columns. Shim plates are used in the beam-column
connection face to prevent localized stress. Depending on the mechanism of energy dissipation of
the connection, different combinations of elements have been studied (Christopoulos et al., 2002b;
Rojas et al., 2005; Vasdravellis et al., 2012).
The aim of this study is to present the state of the art for SC steel moment resisting frames for
buildings. The current research challenges are identified and future research direction for SC-PT
steel moment resisting frames are also outlined.
2.2 Background and Research Motivation
2.2.1 Design Practice before the Northridge Earthquake
Before the Northridge Earthquake, it was believed by most of the designer and researcher that,
welded steel MRFs are the most ductile system among all other available systems. This lateral
force resisting systems were also assigned the largest force reduction factor of 8.5 (according to

8
uniform building code). The concept of this connection was to weld the beam web and flanges to
the column flange to get a maximum plastic moment. However, researchers came up with a more
economic section by introducing bolted shear connection at the beam web portion. Schematics of
the interior and exterior connection details are shown in Figure 2.1.
Figure 2.1 Bolted web welded flange connection
2.2.2 Performance of MRFs during the Northridge Earthquake
A devastating 6.7 magnitude earthquake occurred in the Los Angeles, California on January
17, 1994. This severe earthquake caused unexpected damage to more than 100 MRFs. Although
all of the buildings prevented collapse, the initial investigation revealed that there are signs of
inelastic deformation which is unexpected. Most of the failures initiated at the beam-column
connection. To be more specific, the initiation point was the bottom groove weld. A typical crack
initiation pattern is shown in Figure 2.2.

9
Figure 2.2 Welding connection before Northridge
A list of possible reasons behind these failures was listed in SAC (1997), and Bruneau et al.
(2011). The main reasons were: i) poor workmanship and lack of proper inspection of the welded
joints, ii) poor welding at the bottom portion of the beam due to the presence of beam web, iii)
Ignorance of the larger strain at the bottom flange of the beam due to the composite action between
the concrete floor slab and steel beams, iv) loading rate effect was not considered, as most the
connection tested under quasi-static loading before the Northridge earthquake, and iii) elevated
yield strength of steel. During that time, steel manufacturers started producing high strength steel
so that it can easily accommodate lower yield strength. Higher yield strength significantly
increased the connection strength, on the other hand, the stress concentration and strength demand
on the “connection weld” increased simultaneously.
2.2.3 Design Changes after the Northridge Earthquake
Significant design changes have been made after the Northridge earthquake in steel MRF
system. Post-Northridge structures are designed in such a way that it is still expected to sustain
damage during severe earthquakes but without affecting the life safety limit (Chancellor et al.,
2014). However, the residual deformation that may exist after the earthquake can require expensive

10
repair works and in some cases the demolition of total structures. Depending on the scenario, the
total cost of demolition or repair work can be a burden to the overall economy of a country. An
example can be the earthquake of magnitude 6.5 that occurred in Christchurch, New Zealand in
May 2014. The amount of building sustained significant damage was enormous, and the total
repair work required 40$ billion (New Zealand’s dollar) which was approximately 20% of the total
GDP of the country. Besides, the repair and reconstruction of structures with high residual drift is
not often a feasible option to consider (McCormick et al., 2008).
The hysteretic behavior of a typical steel moment resisting frame is shown in Figure 2.3, which
can be characterized by a wide hysteresis loop. This high energy dissipation is expected, although,
it may expect large residual deformation after the lateral loads are removed.
Figure 2.3 Conventional hysteretic behavior of Steel moment resisting frame (Chancellor et
al., 2014)
This seismic lateral force resisting system entirely depends on the inelastic properties of the
primary structural elements to resist collapse. Therefore, these systems are still inefficient in
limiting structural damage or residual drifts.
-3 -2 -1 0 1 2 3
Displacement (mm)
-100
-50
0
50
100
Late
ral l
oad
(kN
)
Pre-Northridge

11
In this regard, research has been done to improve the performance by introducing reduced
beam sections (RBSs) (Tremblay and Filiatrault, 1997), connection reinforced with cover plates
(Engelhardt and Sabol, 1998), haunches (Uang et al., 2000), and side plates (Shiravand and
Deylami, 2010). However, the existence of residual deformation after the severe earthquake is still
present (Figure 2.4).
Figure 2.4 Hysteretic behavior of Steel moment resisting frame with RBS (Chancellor et al.,
2014)
An innovative steel moment resisting frames with SC capability has been developed and tested
by Ricles et al. (2002). The concepts were first applied for external post-tensioning of concrete
moment resisting frames and also showed significant prospect in steel design. In this type of
connection, post-tensioning strands are used to compress the beam section against the column
flanges. This induces SC behavior into the connection. At the same time, additional energy
dissipative elements are introduced to dissipate sufficient energy which is explained in the later
section of this study. A typical SC connection behavior is shown in Figure 2.5.
-10 -5 0 5 10
Displacement (mm)
-150
-100
-50
0
50
100
150
Late
ral l
oad
(kN
)
Reduced Beam Section (RBS)
12
Figure 2.5 Response of SC-PT connection to severe seismic excitation
The concept of post tensioning was initially introduced into the precast concrete MRFs
(Stanton et al., 1997). Superior seismic performance of the PT precast concrete connections,
reinforced the idea to extend it into the steel MRFs. The lateral load-deformation behavior of PT
connections is characterized by gap opening and gap closing behavior at the beam-column
connection face. At the beginning of the loading and before the occurrence of decompression, the
initial stiffness of such a connection is similar to the rigid connection. Decompression can be
defined as the point, where the compressive forces due to the PT forces at the beam-column
interface become zero due to the applied lateral load. Gap opening mechanism initiates due to the
release of pre-compression. From Figure 2.6, the gap opening starts at point a; the connection
lateral stiffness decreases significantly from point a to b due to the growth of the gap and yielding
of the energy dissipating elements. The path from point b to c can be defined as the post-
decompression stiffness and depends on the plastic yielding and strain hardening behavior of the
energy dissipaters. If the connection is loaded up to the point d, the connection re-centers and
comes back to the point f after the load removal due to the PT forces. Otherwise, if the connection
is loaded beyond d, it reaches limit states, and experiences some damages and following that some

13
residual deformations. Several mechanisms and techniques have already been proposed to
introduce the energy dissipation into the PT connection such as top and seat angles, web hourglass
pin (WHP), friction-based element and shape memory alloy (SMA) bars or tendons.
Figure 2.6 Lateral load-displacement behavior of SC-PT connection Adapted from (Moradi
and Alam, 2017a)
2.3 PT Steel Beam-Column Connections
The objective of this section is to systematically categorize the type of PT steel beam-column
connections available. Both experimental and numerical research works are studied and presented
herein. PT high strength steel provides the restoring force required for the re-centering system. As
these elements are not responsible for energy dissipation during cyclic loading, an additional
system based on yielding or friction mechanism should be attached to the connection to dissipate
energy. Based on energy dissipation mechanism, PT connection can be classified as i) top-and-
seat angle PT connection, ii) friction damped PT connection, iii) Energy dissipative (ED) bar-
based PT connection, iv) rocking base moment resisting PT frame, and v) other PT connections
(e.g. web hourglass pin).

14
2.3.1 PT Connection with Top-and Seat Angles
Most Pre-Northridge connection consisted of welded beam flanges and a shear tab, which was
often field-bolted to the beam web. This connection gained popularity due to its easy fabrication
process and cost-effectiveness. Ricles et al. (2002) proposed SC beam-column connections with
PT high strength steel strands. The proposed alternative avoids the use of field welding, reduces
damage in the beams and reduces the residual drift significantly after an earthquake. To investigate
the seismic behavior of the innovative PT connection, five cruciform shaped beam column
specimens were tested. Smaller residual and maximum drifts were observed for PT frames
subjected to earthquakes. In consequence of the test results in 2001, Nine large scale PT
connection were tested to investigate further. Those results obtained from the experiment was
compared with the fully restrained welded connection. The test results were used to validate a
simple design model proposed by the author (Ricles et al., 2002). The investigation of connection
parameter (e.g. flange reinforcing plate and shim plates) are included in the Garlock et al. (2005),
which was not included in the previous study. This study also considered the effects of beam size
on the connection behavior of steel beam-column connection. (Garlock et al., 2005) performed the
cyclic test (applying loading up to 4% story drift) on six full-scale interior connections. The test
result showed that the inelastic deformations were confined to the angles while the beams and
column remained elastic and stable SC hysteresis was achieved. To investigate the behavior of
angles in a bolted beam-column connection. Garlock et al. (2003) tested seven bolted angle
specimens. The effects of angle size and bolt gage length on the connection stiffness, strength,
energy dissipation capacity, and resistance to low-cycle fatigue were explored. The study was
focused on angles appropriate for PT connection applications. The influence of washer plate on

15
the hinge formation of angle was found to be insignificant and therefore not recommended to use
in bolted top and seat angles.
An SC moment resisting frame can be characterized by gap opening and closing under
earthquake loading. This behavior can directly affect the behavior of adjacent floor diaphragm
system. Garlock et al. (2006) studied this behavior analytically. The results showed that it
significantly affects the seismic performance of steel beam-column connections and need to be
considered during the design of this system. In this regard, Garlock and Li (2008) derived closed-
form equations for predicting the beam axial force, and the moment at the beam-column
connections of an SC frame system including floor diaphragms. Collector beams represented the
floor diaphragm.
2.3.2 PT Connection with ED Bars
Although the erection procedure for bolted seat angle PT connection is convenient, the
modeling and evaluation of this connection under inelastic cyclic loading are rather complex due
to geometric nonlinearities and appropriate boundary condition. This motivated Christopoulos et
al. (2002a) to work on steel moment connections with PT high strength steel bars and energy
dissipating bars (Figure 2.7). They expanded the concept of the hybrid precast concrete connection
reported by Stanton et al. (1997). The energy dissipating bars are restrained in steel cylinders to
prevent them from buckling. Christopoulos et al. (2002b) developed an analytical model for the
moment-rotation behavior of the Post-Tensioned Energy Dissipating (PTED) connection along
with a simple design procedure. Through examining the cyclic response of a large-scale exterior
beam-column connection, the numerical modeling and the design method were validated. The
tested PTED connection displayed a full SC capability even at the maximum inter-story drift of

16
4%. The seismic performance of this SC-PT connection was further evaluated by Wang and
Filiatrault (2008) by conducting shake table testing on three stories two bay steel plane frame
model. The building performance was compared with the similar model with conventional welded
connections. Based on the results of the tests using various ground motions of increasing intensity,
similar displacement responses were observed for the frames, while the acceleration response was
reduced for the SC-PT building. The effect of different type of composite slab on the SC behavior
of the beam-column connection was experimentally evaluated by Chou et al. (2009).
Figure 2.7 Bolted connection with ED bar (Adapted from Ma et al. (2007))
Faggiano et al. (2008) numerically studied the cyclic behavior of a PT connection with
buckling-restrained energy dissipating bars. From the finite element analysis, it was recognized
that local rotations of the PT bars cause an increase in the stress values due to the contact with the
column flange holes. Apostolakis et al. (2012) proposed a computational framework for the
optimal design of SC connections based on a genetic algorithm. The results of this study showed
that the moment frames with PT connections were superior to conventional welded frames.

17
2.3.3 PT Connection with Friction Damped Device
In PT connections with angles, energy is dissipated through yielding of angles. To the contrary,
friction damped PT connections dissipate energy when the relative motions occur between friction
surfaces. Therefore, there is no need for yielding and the appearance of damages in the elements.
Three different types of energy dissipation techniques were applied based on friction between two
elements such as i) friction plates/pads, ii) Web friction device, and iii) bottom flange friction
device. Ricles et al. (2005) introduced a new connection combining high strength PT steel strands
with friction components (e.g plates) on the beam flanges. Figure 2.8 shows a schematic view of
this connection. A six-story steel moment frame with PT friction damped connections was
designed in accordance with a performance-based design approach. In another study, Kim and
Christopoulos (2008) presented a comprehensive design procedure for the proposed connections.
The design method was used for the design of a six-story building and was validated by performing
time-history analyses.
Figure 2.8 PT connection with friction based device at the bottom flange
Ricles et al. (2006) experimentally investigated the cyclic response of a one-sided PT
connection with a friction device. This friction device was placed below the beam bottom flange

18
to avoid the interference with the composite slab. (Guo et al., 2011) presented the numerical
simulation of PT beam-column connections with bottom flange friction devices using the
OpenSEES program. To simulate the gap opening and the energy dissipation due to friction, zero-
length elements and truss elements were employed, respectively. The developed model is capable
of capturing the seismic and cyclic response of SC moment frames. The seismic fragility of steel
frames with web friction devices has been presented in Guo et al. (2015). In contrary to the
previous study, the analytical study performed by Iyama et al. (2009) shows that the unsymmetrical
behavior of moment frames with bottom flange friction devices leads to an increased inelastic
strain in the beam top flange. This may, in turn, lead to the beam flange buckling. These inelastic
strains can be reduced by using larger beam sections or longer top flange reinforcing plates, which
increase fabrication costs. Because of the difference in the positive and negative moment capacity
of the connections with bottom flange friction devices, the frame possesses less lateral force
capacity compared to a frame with friction devices on the top and bottom beam flanges. However,
the maximum and residual deformations of both frames were similar.
Recent years, an ongoing project named FREEDOM (free from damage connections) is being
conducted by four collaborative universities (such as the University of Liege, University of
Salerno, University of Naples and University of Coimbra) and two industrial partners (FIP
Industriale and OFFLIZ). The main objective of this project is to introduce one friction-based
damage free connection and provide comprehensive design guideline.
Under FREEDOM project, D’Antimo et al. (2017) studied the loss of prestress on bolts
throughout its service life and creep of steel plates. In this regard, experimental tests on only
friction device were conducted which consists of long slotted holes and preloaded bolts. This study

19
concludes that the highest loss of pre-stress occurs within the first 12 hr from the tightening of the
bolts. Therefore, short-term loss can reliably be used for predicting the total loss in the next 50
years.
2.3.4 PT Connection with WHP
Recently, Vasdravellis et al. (2013) proposed a new SC-PT steel connection. Along with PT
high strength steel bars, cylindrical pins of hourglass shape were used as novel steel energy
dissipaters. The cyclic SC behavior of the full-scale connection, designed according to a simplified
performance-based procedure, was experimentally validated. The proposed connection showed the
potential to eliminate residual deformations, avoiding damage in the beam for drifts up to 6%. By
repeating the tests, it was confirmed that the proposed energy dissipation elements could be easily
replaced after severe loading.
Dimopoulos et al. (2013) reported on the seismic design, modeling, and performance
assessment of SC moment frames with web hourglass pins. The results of static monotonic, static
cyclic, and dynamic analysis of an SC building were discussed in comparison with a conventional
moment-resisting frame.
Cyclic tests of web hourglass shape pins showed stable hysteretic behavior as shown in Figure
2.9, with high fracture capacity for these energy dissipation devices, as reported by (Vasdravellis
et al., 2014). More recently, Tzimas et al. (2015) presented the seismic design and assessment of
SC frames with hourglass shape pins and supplemental viscous dampers.

20
Figure 2.9 PT connection with web hourglass pin to dissipate energy
2.4 SMA based SC Connections
2.4.1 General
The importance of SMA in civil engineering application is increasing rapidly due to its
capability of large strain recovery, this e absence of residual strain upon unloading and high energy
dissipation ability. This exceptional property can be used in the earthquake resistant design. To
date, about 30 alloys are reported to show a shape memory effect. Hence, they belong to the group
of SMAs. However, not all of them have the potential for being used in civil structures. This is due
to the special mechanical properties required, the specific temperature conditions in civil structures
and above all, the cost involved should also need to be considered (Janke et al., 2005; Li et al.,
2017; Moradi and Alam, 2015a; Ozbulut et al., 2015; Zhu and Qiu, 2014).
SMA can show two distinct characteristics such as i) Superelasticity, and ii) Shape memory
effect. This behavior is possible due to its three-different crystal structure (i.e. twinned martensite,
detwinned martensite, and austenite). Martensite is formed at lower temperature than austenite.
21
The temperature ranges for determining the martensitic or austenite phase highly depends on the
training of SMA during the manufacturing process. The crystal structures are in most stable
condition during its elevated temperature phase that is austenite phase. Changes in ambient
temperature (e.g. lower temperature) generates intermolecular stress and twinned martensite is
formed. The slight deformation that occurs in the atomic structure is invisible from outside. This
alloy shows the shape memory effect at this stage if external loading is applied. Due to the
application of external load, twinned martensite deforms further and forms detwinned martensite
with visible bends. Residual deformation of SMA can be recovered fully by heating it up. An
increase in temperature will transform the detwinned martensite into highly stable austenite. SMA
in austenite phase shows superelastic behavior. It can recover up to 8% strain in case of NiTi alloy
and 13.5% strain in FeNCATB alloy. Both superelastic behavior and shape memory effect can be
used in civil engineering application but need further extensive research. This study will consider
only the superelastic property of NiTi, CuAlMn, FeMnAlNi, and FeNCATB alloy.
According to Sampath (2005) and Feng et al. (2016), the energy dissipation capacity of SMA
is largely dependent on the annealing temperature since it can change the transformation stress of
SMA. Due to the change in annealing temperature, the transformation stress will change, which
will eventually affect the superelastic behavior of SMA at elevated temperature (Ozbulut and
Hurlebaus, 2010; Yoon and Yeo, 2008). Although the behavior of different SMAs at elevated
temperature will be different, additional investigation is required to understand their effect in
beam-column connection; however, this is out of the scope for this current study.
22
2.4.2 SMA Tendon
Speicher et al. (2011) experimentally studied the interior steel beam-column connection with
tendons made of steel, superelastic NiTi, martensitic NiTi, and superelastic NiTi paralleled with
aluminum. A shear tab connection was used to transfer shear force between the beam and the
column. For all specimen, 0.5% pre-strain was applied. The connections with superelastic NiTi
SMA tendon recovered up to 85% of its deformation at 5% drift level. A simple OpenSEES model
was developed and presented to capture the load-deformation behavior with accumulated residual
deformation.
DesRoches and Smith (2004) studied the cyclic response of superelastic NiTi bar to evaluate the
feasibility in seismic resistant design and application. Two different bar sizes (i.e., wires and bars)
were tested under both static and dynamic loading and the response parameters such as strength,
equivalent damping, and re-centering properties were compared.
Steel beam-column connection with SMA in martensitic form was used by Ocel et al. (2004)
to evaluate the feasibility. Martensitic SMA can dissipate the higher amount of energy compared
to the superelastic SMA by accommodating large residual deformation which can be recovered
upon heating. The connection sustained 4% drift with high energy dissipation, whereas, no strength
degradation was observed. The connection with martensitic SMA recovered up to 54% of the beam
tip displacement without load.
Due to the unique SC capability of SMA, Sgambitterra et al. (2016) used this material in the
Belleville washer to investigate the performance of NiTi SMA Belleville washer under cyclic
loading. The thermos mechanical response of washer with different geometric configuration was
analyzed through finite element simulation.

23
Wang et al. (2015) investigated the seismic performance of steel beam-column joint with SMA
tendons strengthened by steel angle. Two angles with 6 and 8 mm thickness were considered for
experimental investigation while SMA tendons of 8 mm diameter were used for recentering the
connection. The experimental results were validated through finite element analysis and validated
models were used for further study. The parameters considered were the tendons’ initial prestress
on SMA tendon and the angle thickness. Results confirmed that the thinner angle reduces the
connection stiffness and energy dissipation capacity. However, promising recentering capability
was guaranteed. Higher prestress on the SMA tendons also helps to improve the connections SC
capacity.
Wang et al. (2017) revealed the potential of using superelastic SMA bolts and steel angles for
SC steel beam-column connections. Several controlling parameters such as bolt pre-strain, bolt
length, angle thickness, and layout of bolts and angles were considered for experimental testing.
The inelastic deformation was accumulated on SMA bolts and angles with no residual deformation
on the beam-column sections. The fracture of SMA bolts was identified as the governing failure
mode. On the other hand, steel angle showed satisfactory deformability during cyclic loading. The
energy dissipation capacity of this connection was moderate, and the maximum equivalent viscous
damping ranged between 11 to 15% at 3% drift. A design framework for this type of connection
was proposed with an illustrative example. The predictive result of the specimen that was designed
according to the proposed framework was validated against the test results in terms of residual
connection rotation.
A numerical simulation study on two innovative classes of steel beam-column connections
equipped with superelastic SMA tendons and shear tab or web hourglass pin (WHP) was
24
conducted by Farmani and Ghassemieh (2017). SMA bolts of different lengths were introduced
which can be attached to the beam flanges by using special cast high strength brackets. This study
concludes that higher length of SMA tendon and additional energy dissipating elements such as
shear tabs or WHPs have positive impact on the total moment capacity, energy dissipation
capacity, initial stiffness, and shear resistance of the connection.
2.4.3 End Plate-based Connection
The feasibility of utilizing the superelastic behavior of SMA was introduced into the steel
beam-column connection by Ma et al. (2007). The connections were designed in such a way that
it avoids the plastic hinge formation mechanism by introducing SMA bolt in the beam-column
interface. This study concludes that the ductility of SMA bolt based connection is significantly
influenced by the length of the SMA bolts. A shank length up to 2.2 times the length of the normal
bolts was suggested.
A detailed FE study has been carried out on the SMA based extended end plate connection by
Yam et al. (2015). Seven previously tested full-scale specimens were validated with good
accuracy. The finite element analysis presented the non-uniform stress distribution on SMA bolts
which was occurred due to minor bending. Therefore, this study suggested that stockier bolt should
be avoided since it may cause more non-uniform stresses near the bolt ends. Although shorter
length SMA could result in higher equivalent viscous damping, it reduces significantly if the stress
in the bolt at higher drift exceeds the martensitic finish stress.
The shear resistance of only SMA bolt based connection can be critical which was recognized
by this study. Therefore, a hybrid connection consisting of high strength steel bolt and SMA bolts

25
has been proposed where plastic deformation on high strength steel bolts was avoided by using
SMA Belleville washer.
Fang et al. (2014) studied eight full-scale extended end-plate connections, including seven
SMA tendon based connection and one conventional high strength steel bolt based connection.
The conventional steel bolt based connection dissipated the good amount of energy and showed
higher ductility. However, permanent or residual deformation was also very high. In case of SMA
tendon based connection, it showed excellent SC capability with moderate energy dissipation. The
ductility capacity of the SMA tendon based connection ranged between 2-4% drift which is mostly
governed by the inelastic deformation of SMA bolts which can be recovered upon load removal.
At higher drifts, SMA bolts fractured in the threaded section and this study suggested increasing
the threaded to net section area ratio in order to avoid it. Moreover, longer length and smaller
diameter of SMA tendons were shown to have higher ductility and better hysteretic response.
Most of the SMA tendon based connection experienced bolt fracture which limited the scope
of investigating the influence of SMA bolt length on seismic performance. To investigate further,
a preliminary finite element model was developed with Abaqus and validated against experimental
results. All the FE models were loaded up to 6% drift. Shorter length SMA bolt experienced
complete transformation into detwinned martensite since the stress was beyond martensitic finish
stress. This phase transformation can be characterized by a sharp spiky part of the load-drift curve
at largest drift. Although the moment capacity and initial energy dissipation capacity of shorter
length SMA tendon based connection are higher, it eventually decreases with the increase in drift
and number of cycles. The spiky part of the load-drift curve is the reason behind this decrease.

26
Therefore, a balanced design considering strength, energy dissipation and ductility was
recommended.
A proof-of-concept study of an innovative ring spring system was introduced by Fang et al.
(2015). The proposed SMA ring spring system consists of several alternations of mating taper
faces where inner ring is made of high strength steel (HSS) and the outer ring is made of
superelastic SMA. The superelastic behavior of SMA enables the outer ring to be expanded
significantly under the horizontal components of the contacting force over the taper face. The
vertical component of the force on the contracting taper face is resisted by the frictional resistance
between two surfaces. When the applied load is removed whole ring spring system can recover its
original shape due to the strain recovery of SMA itself. Based on the results of finite element
analysis, two potential application of SMA ring spring systems were proposed, namely, SC HS-
SMA ring spring connections and SC SMA ring spring dampers.
A numerical simulation study with finite element software ANSYS was conducted on extended
end-plate connections by Fanaiea and Monfared (2016). The experimental specimen was designed
as a semi-rigid connection with four SMA bolts. For SMA bolts, four different prestress levels
such as 40, 50, 60 and 70% of its yield strength was applied. An increase in initial pre-stress shows
a positive effect on the strength, stiffness, moment capacity, energy dissipation capacity, and SC
capacity. However, if the stress level on SMA bolts exceeds the martensitic finish stress, it
decreases the energy dissipation and SC capacity of the connection. According to AISC and
Eurocode8, all SMA bolt based end-plate connection can be classified as semi-rigid or partial
strength connections, respectively. Whereas, all HS bolts and/or combination of SMA and HS bolt
based end-plate connection can be classified as rigid or full strength connections.

27
Fang et al. (2015) conducted both experimental and numerical simulation on SMA Belleville
washer or springs to show the potential of using such components for seismic resisting devices.
Based on stack combination of washers and also the ambient temperature (preferably 10 to 23
degrees Celsius), this component can show satisfactory SC ability, repeatability, and energy
dissipation capacity. SC capacity of washer plate was significantly affected at low temperatures
(i.e. 0 and -20 degrees Celsius) and temperatures above 40 degrees Celsius). A phenomenological
model, following the experimental and numerical simulation, was developed and presented which
included the effect of degradation and varied temperatures.
2.4.4 Others
In order to reduce the plastic deformation in the link beams in seismic resistant structures, a
new concept of SC link beam by using PT SMA rods were introduced (Xu et al., 2016). Two
possible link arrangements were proposed. An analytical model which is capable of capturing the
cyclic behavior was used to further investigate and optimize the performance parameters.
The amount of SMA material used by Xu et al. 2016 was further reduced by introducing the
concept of composite tendon. The composite tendon consists of SMA rods and steel rods instead
of pure steel throughout the full length. Based on analytical and finite element analysis results, a
preliminary design guideline was proposed for SC link systems (Xu et al., 2017).
Fang et al. (2015) introduced the concept of superelastic Belleville washer for the seismic
application. With different stack combination and room temperature, the washers were tested
experimentally, and stable hysteretic behavior was observed with slight strength degradation. A
phenomenological model to account for the degradation effect under varied temperature was
developed and used for further numerical analysis.

28
Wang et al. (2017) presented superelastic ring spring systems for seismic applications in their
paper. The strength, stiffness, and energy dissipation capacity of SMA ring spring largely depends
on the treatment of the contacting taper face as well as the ring size. This study was extended with
a parametric study considering other influencing factors such as ring pre-compression, taper face
friction, ring size, and shear tab bolt pre-load.
2.5 Summary of Review
Modern seismic codes allow structures to deform plastically while maintaining collapse
prevention. The socio-economic growth of the modern ages challenging this era by demanding
higher performance in terms of damage. Low or no residual deformation after the earthquake is
becoming the target performance level for next-generation structures. To obtain this performance,
researchers all over the world are coming up with new and innovative ideas. Ideas based on SC
connections are promising and, therefore, reviewed thoroughly in this section.
PT steel strands/bars have been used in SC structures while additional energy dissipating
element can dissipate more energy. This dissipating mechanism can be based on steel angles, web
hourglass pin, buckling restrained bar, friction device etc. By using the concept of capacity-based
design, some studies have already developed and presented design guidelines. These guidelines
can make sure that the damages will be accumulated in the energy dissipating element alone and
SC PT strands/bars will be within its elastic limit. After each earthquake, these energy dissipating
elements should be replaced.
In the second stage of this literature review, the feasibility of using smart materials such as
superelastic SMA in SC structure was reviewed. SMA strands/bars are the most widely used and
available for being used in civil engineering structures. The major challenges related to the wide

29
application is the cost. Although, due to its superior performance, the cost of SMA is decreasing
rapidly. A number of experimental studies have already been conducted and extensive finite
element analysis followed by validating those experimental studies are crucial.

30
Chapter 3 Finite Element Model Development and Validation
3.1 General
The applicability of SC connections in moment resisting frames is still under research. In-depth
understanding of the connection and its components are vital to facilitate the application of this
type of connections. Due to time and cost constraints, an experimental investigation is not always
feasible, instead, finite element analysis approach can be used rigorously to investigate the
performance of the connections.
The modeling techniques used in previous techniques can be extended to different SC connections.
This study aimed at improving the modeling techniques to capture the load-deformation behavior
of top and seat angle based SC connection with higher accuracy and reliability.
3.2 Methodology and Model Development
As shown in Figure 3.1, the experimental details of an interior PT beam-column connection
(specimen PC4) from Ricles et al. (2002) is used as a basis for the verification of the FE
simulations. The connection consists of a column, beams, angles, shim plates, reinforcing plates,
washer plates, and bolts. The column and beam sections were W14×311 and W24×62,
respectively. The column was of sufficient thickness to avoid bolt prying action and did not require
continuity plates (Ricles et al., 2002). To ensure construction fit up and force bearing between
beam and column flanges, shim plates were used in this connection. Two flange reinforcing plates
of 254×57×12.7 mm was used in the inner side of the beam flange to avoid yielding in the beam
flange portion. The beams were supported by two roller supports and the distance of each roller

31
support from the column centerline was 3048 mm. The lateral load was applied by displacing the
top of the column through a series of symmetric lateral displacement cycles of increasing
amplitude. Four high strength steel strands passed through the column from one end of beam to
the other end. These strands are PT to create SC behavior within the connection. The diameter of
the holes in the column flanges was 25 mm. The cross-sectional area of each strand was about 140
mm2. The PT strands, with the ultimate strength of 1864 MPa, was initially PT by a force of 34%
of their ultimate tensile strength. Top and seat angles were the main energy dissipation elements
of the PT connection. Top angles and shim plates were connected to the column flanges with four
high strength bolts. Seat angles were connected to the beam flanges with eight A36 bolts in total.
The angle size was L203×203×15.9 with a g/t ratio of 4.0, where, g is the gage length and t are the
thickness of the angle. The angles were A36 steel with a yield strength of 236 MPa and ultimate
strength of 465 MPa. The beam flanges and web were A36 steel with yield strength of 230 MPa
and 266 MPa, respectively. Ultimate strength of these components was 421 MPa and 450 MPa,
respectively. High strength steel with an average yield and ultimate strength of 843 MPa and 895
MPa were used for flange reinforcing plate to avoid yielding in the beam flanges. Total height of
the column was 3658 mm and length of beams were 6039 mm.
Figure 3.1 shows the geometry of the developed model. Considering the symmetry condition,
half of the total connection was modeled to reduce the computational time. The main challenge
during the validation study was to overcome the convergence difficulties. For modeling the steel
components of PT connection, a bilinear kinematic behavior was used, except for the steel angles
for which a tri-linear stress-strain behavior was considered (Figure 3.3). The strain hardening
parameter (α) was assumed to be 0.02 for beam web and flange, flange reinforcing plate, shim
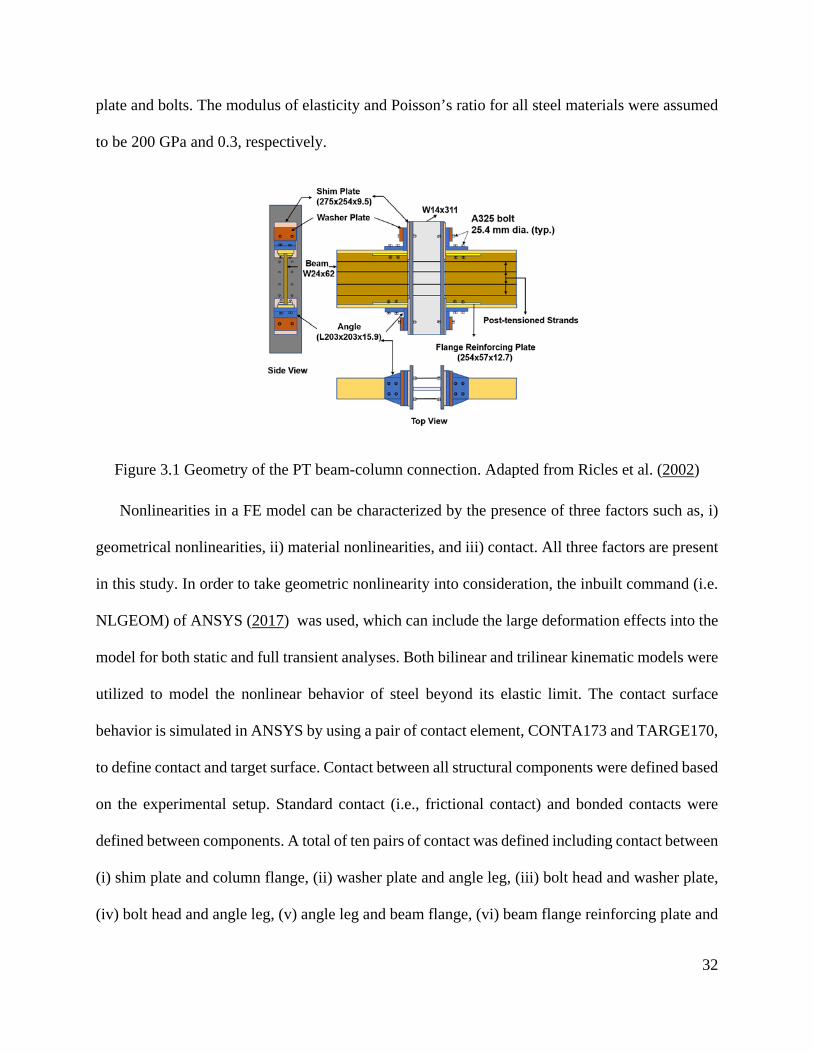
32
plate and bolts. The modulus of elasticity and Poisson’s ratio for all steel materials were assumed
to be 200 GPa and 0.3, respectively.
Figure 3.1 Geometry of the PT beam-column connection. Adapted from Ricles et al. (2002)
Nonlinearities in a FE model can be characterized by the presence of three factors such as, i)
geometrical nonlinearities, ii) material nonlinearities, and iii) contact. All three factors are present
in this study. In order to take geometric nonlinearity into consideration, the inbuilt command (i.e.
NLGEOM) of ANSYS (2017) was used, which can include the large deformation effects into the
model for both static and full transient analyses. Both bilinear and trilinear kinematic models were
utilized to model the nonlinear behavior of steel beyond its elastic limit. The contact surface
behavior is simulated in ANSYS by using a pair of contact element, CONTA173 and TARGE170,
to define contact and target surface. Contact between all structural components were defined based
on the experimental setup. Standard contact (i.e., frictional contact) and bonded contacts were
defined between components. A total of ten pairs of contact was defined including contact between
(i) shim plate and column flange, (ii) washer plate and angle leg, (iii) bolt head and washer plate,
(iv) bolt head and angle leg, (v) angle leg and beam flange, (vi) beam flange reinforcing plate and

33
bolt head, (vii) beam flange reinforcing plate and beam flange, (viii) bolt head and column flange,
(ix) PT strand and column holes, and (x) PT strand head and end plate. All contacts were defined
as standard contact except (i) and (vii). All defined contacts are shown in Figure 3.2.
Figure 3.2 Contact between structural components of PC4 connection
The shim plates and beam flange reinforcing plates were welded to the column flanges and
beam flanges, respectively, therefore, bonded contacts were considered in those cases. Since, half
of the total beam-column connection is simulated in this study, the symmetry boundary condition
was applied in the horizontal direction of this connection (Figure 3.1). Roller support conditions
were considered at 3048 mm of the beam length, i.e., the vertical displacement equals to zero. The
displacement of the bottom nodes of the column was constrained in the x and y directions by using
the MPC184 elements to represent the pin support conditions. The following properties were used
to solve the divergence problems as used by Moradi and Alam (2015b).
• Gauss point detection was used to detect the location of contact.
• Both initial geometric penetration (gap) and offset were excluded from the analysis.

34
• The contact algorithm was set to penalty function.
(a) (b)
Figure 3.3 Material properties assumed for (a) bilinear kinematic for all steel components
and trilinear kinematic for steel angles, and (b) boundary conditions used in FE model
A different meshing approach has been used in this study from that used by Moradi and Alam
(2015a). A mesh only element (i.e. MESH200) is used from the element library of ANSYS to have
better control over the mesh density. The MESH200 element does not contribute to the solution
and it can be extruded to another solid element type. This mesh element is used to extrude a low
dimensional mesh to a high dimensional mesh. The mesh density is controlled at the point of
interest where there is a higher possibility of stress concentration (Figure 3.8). Eight-noded solid
homogenous elements (SOLID 185) are used for volumes. SOLID185 is generally used for three-
dimensional modeling since it has plasticity, hyperelasticity, stress stiffening, creep, large
deflection, and large strain capabilities. Each solid element is defined with eight nodes having
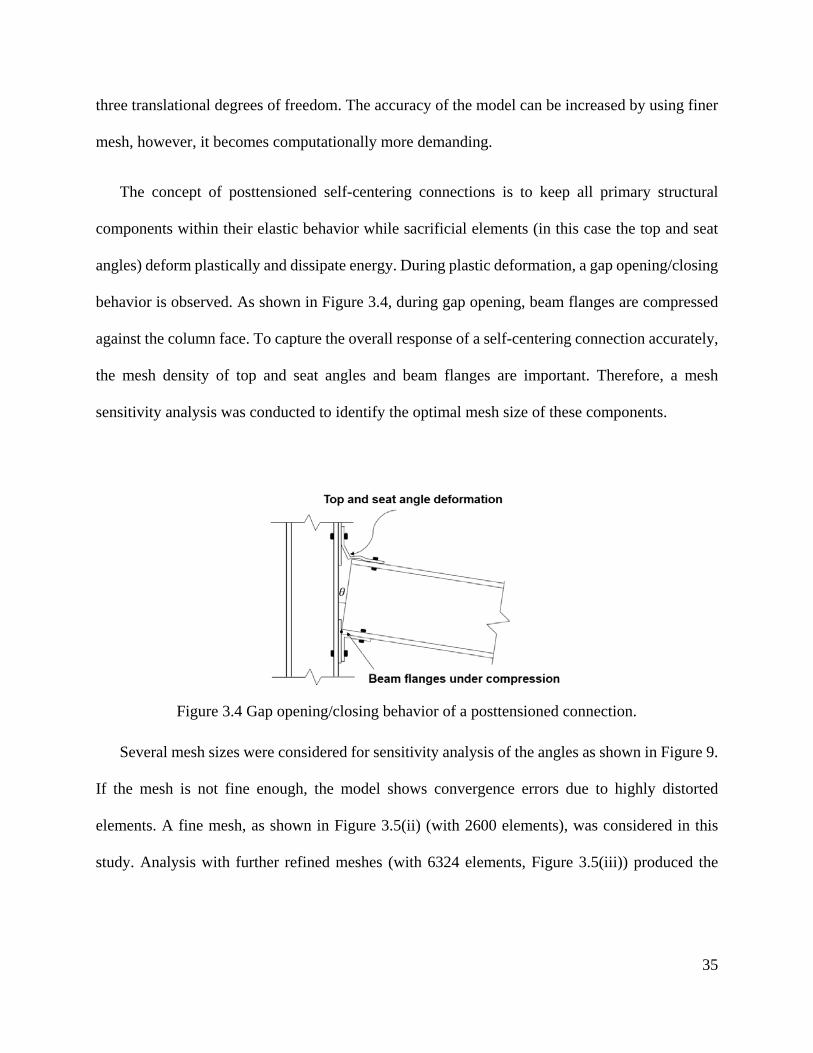
35
three translational degrees of freedom. The accuracy of the model can be increased by using finer
mesh, however, it becomes computationally more demanding.
The concept of posttensioned self-centering connections is to keep all primary structural
components within their elastic behavior while sacrificial elements (in this case the top and seat
angles) deform plastically and dissipate energy. During plastic deformation, a gap opening/closing
behavior is observed. As shown in Figure 3.4, during gap opening, beam flanges are compressed
against the column face. To capture the overall response of a self-centering connection accurately,
the mesh density of top and seat angles and beam flanges are important. Therefore, a mesh
sensitivity analysis was conducted to identify the optimal mesh size of these components.
Figure 3.4 Gap opening/closing behavior of a posttensioned connection.
Several mesh sizes were considered for sensitivity analysis of the angles as shown in Figure 9.
If the mesh is not fine enough, the model shows convergence errors due to highly distorted
elements. A fine mesh, as shown in Figure 3.5(ii) (with 2600 elements), was considered in this
study. Analysis with further refined meshes (with 6324 elements, Figure 3.5(iii)) produced the

36
same behavior while made the analysis computationally demanding. Hence, the mesh shown in
Figure 3.5(ii) was chosen as the optimal mesh.
(i) (ii) (iii)
Figure 3.5 Models for mesh sensitivity analysis of the angles: (i) coarse mesh, (ii) current
mesh, and (iii) finer mesh.
Different mesh sizes for beam flanges were also selected and analyzed (Figure 3.6). Coarser
mesh (with 686 elements) as shown in Figure 3.7 predicts slightly higher capacity compared to
that of the current mesh (with 1758 elements). While using a finer mesh (with 3780 elements)
than the current mesh, it does not change the response (Figure 3.7), however, increases the solution
time.

37
Figure 3.6 Beam flange mesh sensitivity with coarser, current and finer meshes.
(i) (ii)
Figure 3.7 Sensitivity analysis result for (i) top and seat angle, and (ii) beam flange.
The FE model for specimen PC4 consists of 10817 key points, 25342 lines, 19485 areas, 4972
volumes, 92268 nodes, and 77966 elements.
-150 -100 -50 0 50 100 150
Displacement (mm)
-300
-200
-100
0
100
200
300
Late
ral l
oad
(kN
)
Current mesh
Finer mesh
-150 -100 -50 0 50 100 150
Displacement (mm)
-300
-200
-100
0
100
200
300La
tera
l loa
d (k
N)
Coarser mesh
Current mesh
Finer mesh

38
(a) (b) (c)
Figure 3.8 Meshed elements (a) Angle, (b) Bolt, and (c) Full specimen
3.3 FE Model Validation
Prior to the application of lateral load on the top of the column, pretension elements were
created, and preloads were applied on bolts and PT strands. The study follows the actual loading
sequence; that is, first pretension loads were applied to each bolt and then post-tensioning was
applied. Pretension section was defined by the PSMESH command in ANSYS APDL. Another
command, SLOAD, is used to apply the desired pretension load on the sections defined by the
PSMESH command. About 70% of the tensile strength of bolts were applied according to the
ASTM specification. Nonlinear static analysis with the unsymmetrical Newton-Rapson method is
utilized to run the analysis. Large deformations were also permitted due to the possible geometric
nonlinearity (Moradi and Alam, 2015b). To avoid convergence issue, small time steps were
predefined using the DELTIM command.
The loading sequence is determined to simulate the actual loading condition. At initial time
steps, the pretension force of about 230 kN was applied in the bolt (Ricles et al., 2002). The post-

39
tensioning forces in the strands were applied afterward, the amount of which on each strand is
about 88 kN. The horizontal loading is applied on the top nodes of the column in accordance to
the actual test. The loading cycles applied on the column have the amplitudes of 0.1, 0.2, 0.3, 0.4,
0.5, 0.7, 1, 1.5, 2, 2.5, and 3%. A more detailed explanation of the modeling procedure can be
found in (Moradi and Alam, 2015b; Moradi and Alam, 2017a; Moradi and Alam, 2017b). The
following modifications were made to (Moradi and Alam, 2017a) procedure (Rahmzadeh and
Alam, 2017):
In a previous study by Moradi and Alam (2015b), a bilinear kinematic strain hardening model
was used for the steel material in the FE simulation of PT beam-column connections with bolted
angles. In such connections, the angles as energy dissipators are subjected to severe plastic
straining. Due to damage, the actual behavior of steel degrades in large strains while in a bilinear
kinematic model the stress linearly increases with straining. Hence, a bilinear kinematic model
cannot truly represent the steel material behavior in terms of stress-strain. Besides, it also fails in
predicting the dissipated energy owing to the Bauschinger effect. A more accurate and practical
approach to model components which are expected to experience large strains can be the use of a
kinematic trilinear model. In this material model, the response hardens after the yielding, reaches
the ultimate stress and following that flattens to perfectly plastic. This is way, even by considering
the Bauschinger effect, the unloading part can take more stresses which leads to a more precise
prediction of the energy dissipation property. A trilinear kinematic material model, as shown in
Figure 3.9(b), was used for the angles. Compared to a bilinear model (Figure 3.9a), this model
(Figure 3.9b) has a cutoff value that makes it more realistic.

40
σy
2σy
Stress
Strain
σy
2σy
σu
Stress
Strain
(a) (b)
Figure 3.9 Typical diagram of (a) Bilinear kinematic model in large strains and (b) Trilinear
kinematic model in large strains
Since there was no failure in the bolts in the actual test by Ricles et al. (2002), the bolt diameter
was not reduced.
By adopting these modifications, the FE resulted in an increase of 30.5% in the energy
dissipation and could better simulate the response of PT steel connections as can be observed in
Figure 3.10 (a) and (b). However, maximum load capacity was better captured by previous study.

41
(a) (b)
Figure 3.10 Analytical results in comparison with the test results: (a) previous FE results
(Adapted from Moradi and Alam, 2015), and (b) Current study
As can be seen in Figure 3.10 (b), the FE model predicts the PT beam-column connection
behavior with satisfactory agreement. Although, the analysis takes 12 hours which is only 4 hours
more than the previous study.
The initial stiffness obtained from the FE is only 4.76% greater than the experimental stiffness
of 10074 kN/m. The decompression happened at a drift of 0.27% for both experimental and FE
model. The stiffness of the connection reduces after the decompression and the percentage of
reduction depends on the stiffness of the angles and the PT strands. The post-decompression
moment for FE model was 3578 kN-m which is similar to the experimental data. The maximum
moment capacity of the FE model is found to be less than the experimental value. The maximum
plastic moment (Mp) from the experimental specimen (PC4) was 576 MPa. The decompression
and maximum moment capacity were found to be about 0.36 Mp and 0.85 Mp, respectively.
-150 -100 -50 0 50 100 150
Displacement (mm)
-400
-200
0
200
400La
tera
l loa
d (k
N)
Ricles et al. 2002
Moradi and Alam 2015b
Current Study (PC4 OL)
-150 -100 -50 0 50 100 150
Displacement (mm)
-400
-200
0
200
400
Late
ral l
oad
(kN
)
Ricles et al. 2002
Current Study (PC4-OL)

42
3.4 Parametric Study on Stiffened Angle PT Connection
The energy dissipation capacity of PT connection with top and seat angle is comparatively
lower than the welded beam-column connection (Garlock et al. 2003). However, several energy
dissipating elements and techniques have been introduced in the past few years to increase this
property. In the case of top and seat angle connection, energy dissipation capacity can be increased
by increasing angle thickness (t) or decreasing angle gage length (g). However, increasing the
angle thickness leads to larger tensile forces in the bolts and decreasing the gage length may lead
to the low-cycle fatigue failure of the angles (Ricles et al., 2002). Moradi and Alam (2017b)
conducted extensive sensitivity analysis on top and seat angle PT connections and concluded the
same. Another convenient way of increasing the energy dissipation capacity is to include a stiffener
in between the angle legs which can be termed as the stiffened angle.
A numerical study was recently done by Shiravand and Mahboubi (2016), to investigate the
response of stiffened angle PT connection. The connection resistance increased significantly under
higher drifts and dissipated more energy compared to the top and seat angle connection. When
using such an energy dissipative element, additional forces are developed due to the increased load
capacity. Hence, the performance of other components such as the beams, PT strands, and steel
bolts need to be investigated. Therefore, this study fills the gap by performing a parametric study
on stiffened angle PT connection by considering three controlling parameters including the
stiffener thickness, gage length and reinforcing plate thickness to investigate the seismic
performance of such connections (Figure 3.11).
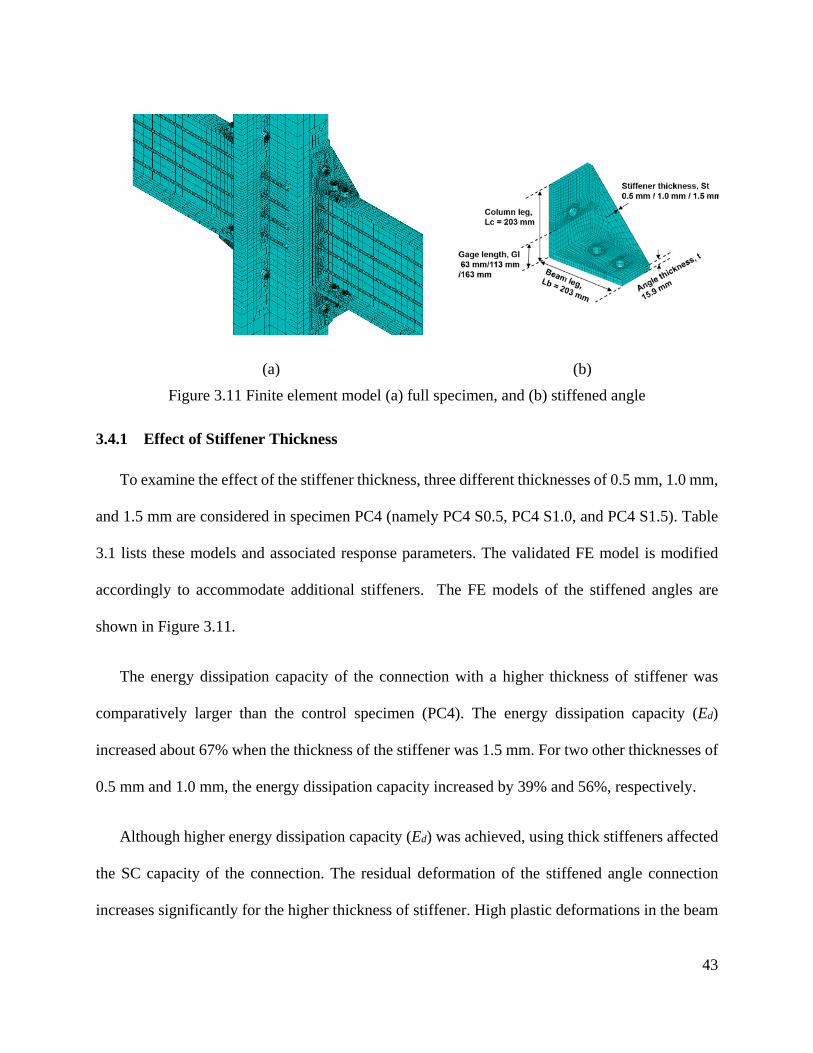
43
(a) (b)
Figure 3.11 Finite element model (a) full specimen, and (b) stiffened angle
3.4.1 Effect of Stiffener Thickness
To examine the effect of the stiffener thickness, three different thicknesses of 0.5 mm, 1.0 mm,
and 1.5 mm are considered in specimen PC4 (namely PC4 S0.5, PC4 S1.0, and PC4 S1.5). Table
3.1 lists these models and associated response parameters. The validated FE model is modified
accordingly to accommodate additional stiffeners. The FE models of the stiffened angles are
shown in Figure 3.11.
The energy dissipation capacity of the connection with a higher thickness of stiffener was
comparatively larger than the control specimen (PC4). The energy dissipation capacity (Ed)
increased about 67% when the thickness of the stiffener was 1.5 mm. For two other thicknesses of
0.5 mm and 1.0 mm, the energy dissipation capacity increased by 39% and 56%, respectively.
Although higher energy dissipation capacity (Ed) was achieved, using thick stiffeners affected
the SC capacity of the connection. The residual deformation of the stiffened angle connection
increases significantly for the higher thickness of stiffener. High plastic deformations in the beam

44
flanges are the reason for the reduction in SC capability. To prevent local buckling of the beam
due to the effects of stiffeners, the length of the flange reinforcing plate increased up to 554 mm
(i.e. 300 mm additional length of the plate). The residual deformation (Rd) of the specimen with a
0.5 mm thick stiffener was 11.64 mm, whereas, it increased up to 21.45 mm for the specimen with
a 1.5 mm thick stiffener.
The maximum load capacity increases with the increase in the stiffener thickness. For the
considered cases, the load capacity (Fmax) were found to be 373.25, 378.57, and 392.49 kN for the
specimen with 0.5, 1.0, and 1.5 mm, respectively. In all cases, the capacity is almost 29 to 38%
higher than the original specimen (PC4).
Table 3.1 Response parameters. Specimen Stiffener
thickness, St Rd Kd Fmax Ed
(mm) (mm) (kN/m) (kN) (kN-m) PC4 - 5.82 1282 265.67 96.212 PC4 S1.5 1.5 23.1 2035 (1.58)* 392.49 (1.36) 160.45 (1.67) PC4 S1.0 1.0 20.2 2005 (1.56) 378.57 (1.31) 151.54 (1.56) PC4 S0.5 0.5 11.64 1960 (1.52) 373.25 (1.29) 133.94 (1.39)
*Ratio between the response of PC4 and corresponding specimen
The post-decompression stiffness (Kd), beside the beam sizes, is also related to the axial
stiffness of PT strand and stiffness of angle (point b to c in Figure 2.6). The addition of the stiffener
increases the stiffness of the angle and following that the overall post-decompression stiffness of
the connection (Figure 3.12). The post-decompression stiffness for thicker stiffener was as high as
2112 kN/m which is 1.65 times greater than the original specimen (PC4). This stiffness for three
other thickness are 2035, 2005, and 1960 kN/m for specimen PC4 S1.5, PC4 S1.0, and PC4 S0.5,
respectively.

45
(a) (b)
(c)
Figure 3.12 Load-displacement behavior of PC4 with the stiffener thickness of (a) 0.5 mm, (b)
1.0 mm, and (c) 1.5 mm
3.4.2 Effect of Gage Length
An experimental investigation of seven bolted angle connections was conducted by Garlock et
al. 2003. One L152×152×7.9 angle was tested with two different gage lengths of 44.2 mm and
87.1 mm, respectively. Gage length (g) can be defined as the distance between the top of the angle
leg and the edge of the horizontal bolt as shown in Figure 3.11. The ratio of gage length and
thickness of angle (g/t) is an important parameter to illustrate the load-deformation behavior. The
-150 -100 -50 0 50 100 150
Displacement (mm)
-400
-200
0
200
400La
tera
l loa
d (k
N)
PC4 S0.5
PC4
-150 -100 -50 0 50 100 150
Displacement (mm)
-400
-200
0
200
400
Late
ral l
oad
(kN
)
PC4 S1.0
PC4
-150 -100 -50 0 50 100 150
Displacement (mm)
-400
-200
0
200
400
Late
ral l
oad
(kN
)
PC4 S1.5
PC4
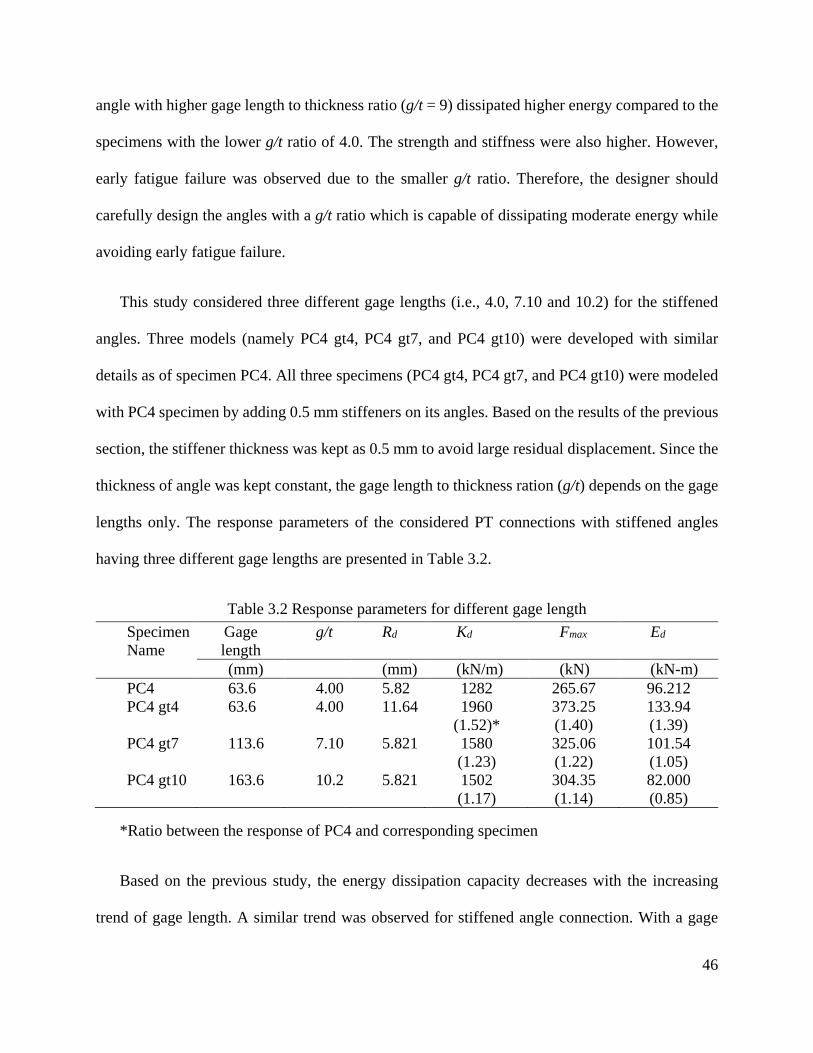
46
angle with higher gage length to thickness ratio (g/t = 9) dissipated higher energy compared to the
specimens with the lower g/t ratio of 4.0. The strength and stiffness were also higher. However,
early fatigue failure was observed due to the smaller g/t ratio. Therefore, the designer should
carefully design the angles with a g/t ratio which is capable of dissipating moderate energy while
avoiding early fatigue failure.
This study considered three different gage lengths (i.e., 4.0, 7.10 and 10.2) for the stiffened
angles. Three models (namely PC4 gt4, PC4 gt7, and PC4 gt10) were developed with similar
details as of specimen PC4. All three specimens (PC4 gt4, PC4 gt7, and PC4 gt10) were modeled
with PC4 specimen by adding 0.5 mm stiffeners on its angles. Based on the results of the previous
section, the stiffener thickness was kept as 0.5 mm to avoid large residual displacement. Since the
thickness of angle was kept constant, the gage length to thickness ration (g/t) depends on the gage
lengths only. The response parameters of the considered PT connections with stiffened angles
having three different gage lengths are presented in Table 3.2.
Table 3.2 Response parameters for different gage length Specimen Name
Gage length
g/t Rd Kd Fmax Ed
(mm) (mm) (kN/m) (kN) (kN-m) PC4 63.6 4.00 5.82 1282 265.67 96.212 PC4 gt4 63.6 4.00 11.64 1960
(1.52)* 373.25 (1.40)
133.94 (1.39)
PC4 gt7 113.6 7.10 5.821 1580 (1.23)
325.06 (1.22)
101.54 (1.05)
PC4 gt10 163.6 10.2 5.821 1502 (1.17)
304.35 (1.14)
82.000 (0.85)
*Ratio between the response of PC4 and corresponding specimen
Based on the previous study, the energy dissipation capacity decreases with the increasing
trend of gage length. A similar trend was observed for stiffened angle connection. With a gage

47
length of 163.6 mm, the connection dissipated 82 kN-m which is about 14% lower than the
specimen (PC4 gt4). PC4 gt7 specimen showed the energy dissipation capacity of 101.54 kN-m.
Since the moment arm increases with the increasing gage length, stiffened angle bends easily under
lateral loading and dissipates less energy. On the other hand, stress induced in the angle with higher
gage length is comparatively lower than the specimen with lower gage length. This indicates less
plastic deformation of angles with higher gage length. This eventually helps the connection to self-
center without any or less residual deformation. In this study, the connection fully self-centers with
a gage length of 113.6 mm and 163.6 mm. This indicates a probable solution for stiffened angle
connection with thick stiffener, where the connection dissipates more energy with minimum or no
residual deformations. Figure 3.13 shows the load-displacement behavior of the considered
specimens.
The post-decompression stiffness of PC4 specimen with a gage length of 163.6 mm is 1502
kN/m which is 30% less than the PC4 gt4 specimen. The reason for this reduction is the same as
discussed before. However, the post-decompression stiffness and energy dissipation capacity of
the PC4 gt4 specimen are 23% and 14% higher than the specimen without stiffened angles (i.e.,
PC4), respectively.

48
(a) (b)
(c)
Figure 3.13 Load-displacement behavior of PC4 with stiffened angles and gage lengths of (a)
63.6 mm (g/t = 4.0), (b) 113.6 mm (g/t = 7.10), and (c) 163.6 mm (g/t = 10.2)
3.4.3 Effect of Flange Reinforcing Plate Thickness
The formation of the plastic hinges in the beam flanges can be delayed by providing longer
flange reinforcing plate. Moreover, the beam flange can be strengthened by increasing the flange
reinforcing plate thickness. Therefore, to prevent local damage of the beam flanges, the length of
flange reinforcing plate was increased from 254 mm to 554 mm. To investigate the effect of flange
reinforcing plate thickness, existing plate thickness (12.7 mm) was increased up to 25.4 mm
-150 -100 -50 0 50 100 150
Displacement (mm)
-400
-200
0
200
400La
tera
l loa
d (k
N)
PC4 GL 63.6
PC4
-150 -100 -50 0 50 100 150
Displacement (mm)
-400
-200
0
200
400
Late
ral l
oad
(kN
)
PC4 GL 113.6
PC4
-150 -100 -50 0 50 100 150
Displacement (mm)
-400
-200
0
200
400
Late
ral l
oad
(kN
)
PC4 GL 163.6
PC4
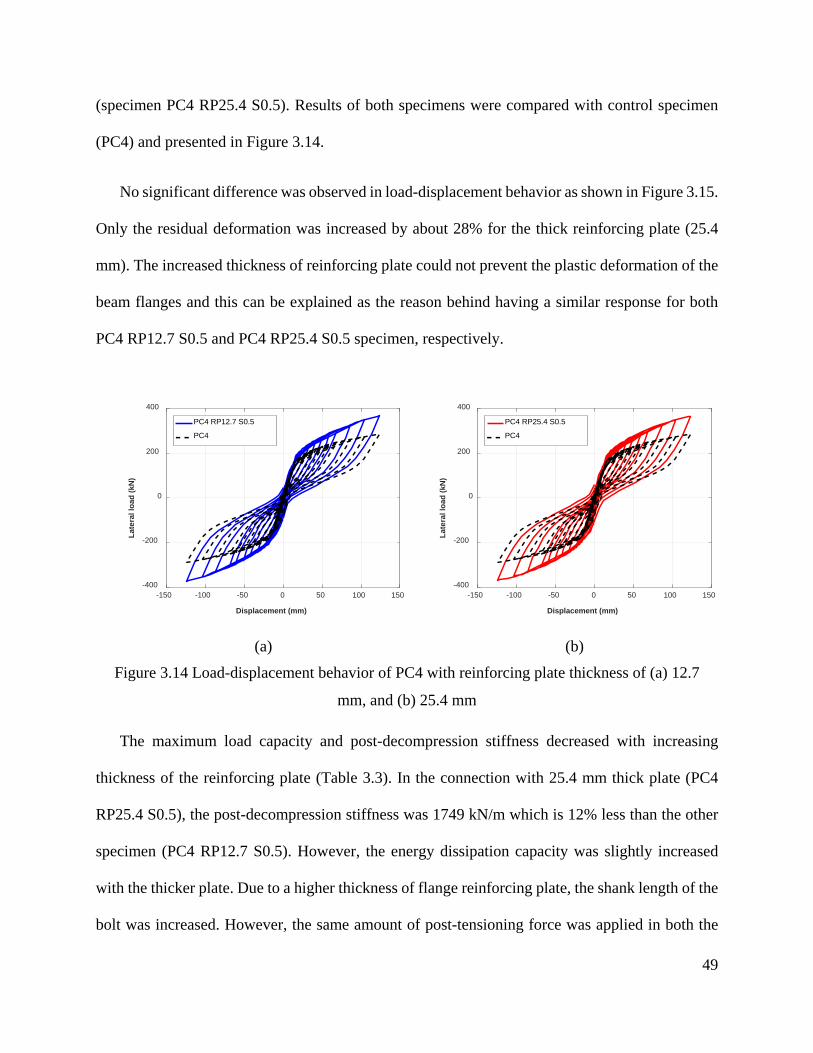
49
(specimen PC4 RP25.4 S0.5). Results of both specimens were compared with control specimen
(PC4) and presented in Figure 3.14.
No significant difference was observed in load-displacement behavior as shown in Figure 3.15.
Only the residual deformation was increased by about 28% for the thick reinforcing plate (25.4
mm). The increased thickness of reinforcing plate could not prevent the plastic deformation of the
beam flanges and this can be explained as the reason behind having a similar response for both
PC4 RP12.7 S0.5 and PC4 RP25.4 S0.5 specimen, respectively.
(a) (b)
Figure 3.14 Load-displacement behavior of PC4 with reinforcing plate thickness of (a) 12.7
mm, and (b) 25.4 mm
The maximum load capacity and post-decompression stiffness decreased with increasing
thickness of the reinforcing plate (Table 3.3). In the connection with 25.4 mm thick plate (PC4
RP25.4 S0.5), the post-decompression stiffness was 1749 kN/m which is 12% less than the other
specimen (PC4 RP12.7 S0.5). However, the energy dissipation capacity was slightly increased
with the thicker plate. Due to a higher thickness of flange reinforcing plate, the shank length of the
bolt was increased. However, the same amount of post-tensioning force was applied in both the
-150 -100 -50 0 50 100 150
Displacement (mm)
-400
-200
0
200
400
Late
ral l
oad
(kN
)
PC4 RP12.7 S0.5
PC4
-150 -100 -50 0 50 100 150
Displacement (mm)
-400
-200
0
200
400
Late
ral l
oad
(kN
)
PC4 RP25.4 S0.5
PC4

50
connections. For specimen PC4 RP25.4 S0.5, the strain in the bolts was less than the other
specimen PC4 RP12.7 S0.5. This contributed to the reduction of post-decompression stiffness, and
load capacity of the PC4 RP25.4 S0.5 specimen.
Table 3.3 Response parameter for different reinforcing plate thickness
SL No
Specimen Name
Reinforcing plate thickness
Rd Kd Fmax Ed
(mm) (mm) (kN/m) (kN) (kN-m)
1 PC4 12.7 5.82 1282 265.67 96.212 2 PC4 RP12.7 S0.5 12.7 11.64 1960
(1.52) 373.25 (1.40)
133.94 (1.39)
3 PC4 RP25.4 S0.5 25.4 15.00 1749 (1.36)
366.83 (1.38)
139.01 (1.44)
Figure 3.15 Stiffened angle with two different reinforcing plate thickness (zoom in view of
compared models in the right side) at largest drift
At largest drift, both connections (PC4 RP12.7 S0.5 and PC4 RP25.4 S0.5) accumulated
residual deformation. This residual deformation is only attributed to the plastic deformation of
beam flanges. Therefore, increasing the reinforcing plate thickness is not an appropriate solution
-150 -100 -50 0 50 100 150
Displacement (mm)
-400
-200
0
200
400
Late
ral l
oad
(kN
)
PC4 RP12.7 S0.5
PC4 RP25.4 S0.5
-50 0 50
Displacement (mm)
-100
-50
0
50
100
Late
ral l
oad
(kN
)
PC4 RP12.7 S0.5
PC4 RP25.4 S0.5

51
to remove residual deformation. Since the PC4 specimen is not designed for the additional
stiffener, the performance cannot be estimated with the existing configuration.
The limitation of this study is that it was not designed for an additional stiffener. Due to the
forces on the beam flanges, the connection loses SC. Therefore, the following section was limited
to the study of the component itself. A parametric study followed by a set of parametric studies
was conducted to optimize the performance of stiffened angle in SC connection.
3.5 FE Modeling and Validation of Top-and-seat Angle
3.5.1 General
The performance of bolted top-and-seat angle connections was investigated by (Garlock et al.,
2003) in terms of stiffness, strength, energy dissipation capacity, and resistance to low cycle
fatigue. Although several other researchers investigated the behavior of bolted angles before, the
angle properties used in those studies were not appropriate (i.e., the legs were too short, the
thickness were insufficient, or the material strength was too low) for SC-PT connection. Therefore,
the specimen used in Garlock et al. (2003) was redesigned with a stiffener to investigate in this
study.
3.5.2 Experimental Setup
Two angles were placed back to back and were connected to the beam flange and column
section as shown in Figure 3.16. The whole section was rotated 90° counterclockwise so that the
strong column is horizontal to the floor. A T-stub section connected to the actuator and the angles
legs were used to simulate a beam flange. The column section was strong enough (W360 x 262/
W14 x 176) to avoid any plastic deformation during the tests. This test setup does not account for

52
the rotation that can be generated in the angle legs due to the relative rotation of the beam and
column section. However, this rotational effect can be neglected since it is only about 10% of the
total rotation of the connection.
(a)
(b)
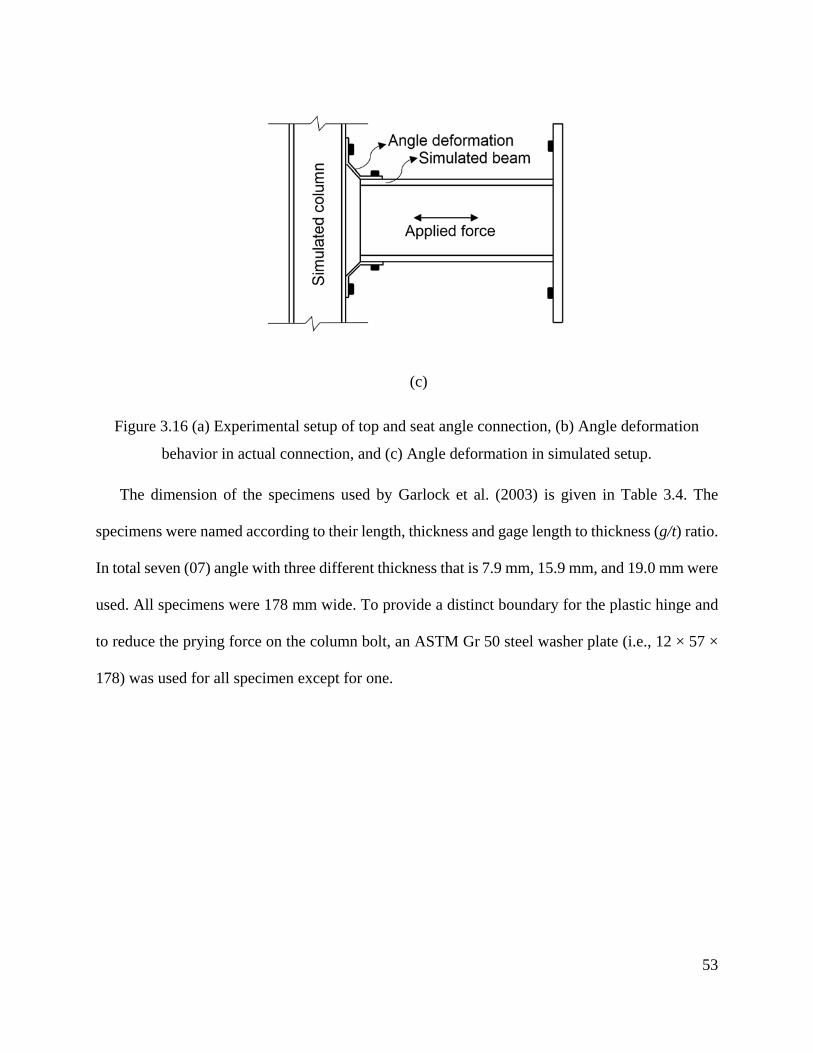
53
(c)
Figure 3.16 (a) Experimental setup of top and seat angle connection, (b) Angle deformation
behavior in actual connection, and (c) Angle deformation in simulated setup.
The dimension of the specimens used by Garlock et al. (2003) is given in Table 3.4. The
specimens were named according to their length, thickness and gage length to thickness (g/t) ratio.
In total seven (07) angle with three different thickness that is 7.9 mm, 15.9 mm, and 19.0 mm were
used. All specimens were 178 mm wide. To provide a distinct boundary for the plastic hinge and
to reduce the prying force on the column bolt, an ASTM Gr 50 steel washer plate (i.e., 12 × 57 ×
178) was used for all specimen except for one.

54
Table 3.4 Experimental test matrix of bolted top and seat angles Specimen Angle size (mm) t (mm) g1 (mm) g2 (mm) L1 (mm) L2 (mm) Column
bolts σy
(MPa) σu
(MPa) L6-516-4 L152×152×7.9 8.2 44.2 31.8 42.6 30.2 A325 332 507 L6-516-9 L152×152×7.9 8.1 87.1 74.6 42.7 30.2 A325 332 507 L8-58-4 L203×203×15.9 16.4 78.9 63.5 34.4 19.1 A325 332 543 L8-58-4-NW L203×203×15.9 16.3 83.8 68.3 34.5 19.1 A325 332 543
L8-58-7 L203×203×15.9 16.3 130.0 114 34.5 19.1 A325 332 543 L8-34-4 L203×203×19.0 19.2 91.9 76.2 31.6 15.9 A490 383 545 L8-34-6 L203×203×19.0 19.3 127 111 31.5 15.9 A490 383 545

55
To avoid failure of bolts due to prying force, A325 and A490 bolts were used. The column and
beam bolts were 25 mm and 32 mm, respectively. A325 bolts were used for 7.9 mm and 15.9 mm
bolts where A490 bolts were used for 19.0 mm diameter. The material properties presented in
Table 3.5 was used for the validation study. For specimen L6-516-4 and L6-516-9, A36 steel was
used. All other specimens were of ASTM A572 Grade 50 steel.
The loading history applied on bolted top-and-seat angle connection was determined from the
experimental study on PT steel beam-column connection by Ricles et al. (2001). The angle
displacement corresponding to the story drift was recorded and modified according to the SAC
joint venture testing protocol (SAC, 1997).
Table 3.5 Loading history for experimental study Load step
No. of cycles in load step
Cycle number Δ (mm) Corresponding story drift
1 2 1-2 0.3 0 2 6 3-8 0.6 <0.0075 3 6 9-14 1.3 0.0075 4 4 15-18 3.2 0.01 5 2 19-20 1.3 0.0075 6 2 21-22 7.0 0.015 7 2 23-24 1.3 0.0075 8 2 25-26 11.4 0.02 9 2 27-28 1.3 0.0075 10 2 29-30 18.4 0.03 11 2 31-32 1.3 0.0075 12 2 33- 26.0 0.04

56
3.5.3 Model Development and Validation
The experimental setup of top and seat angle connection in Figure 3.17 represents the actual
self-centering beam column connection. The load-deformation behavior of the angle is similar to
the previously tested PC4 specimen. However, top and seat angle in PC4 connection experience
additional moment due to rotation which was neglected in this setup.
To reduce the computational time, only half of the model was developed, and the symmetry
condition was applied to restrain any movement in the horizontal direction. In the experimental
setup, column section was horizontal to the ground and considered fixed, therefore, fixed boundary
condition was applied in the FE model. The mesh density was controlled in the angle section to
capture accurate load-deformation behavior. MESH200 and SOLID185 element were used to
develop the meshed area and solid volumes, respectively.
Figure 3.17 Experimental setup used by Garlock et al. (2003)
Instead of engineering stress-strain, true stress-strain of steel materials was used. The modulus
of elasticity and strain hardening ratio was 200 GPa and 0.05, respectively. The developed model

57
is shown in Figure 3.18. The total number of nodes, areas, volumes, and elements generated were
106612, 1514, 334, and 117827, respectively.
Figure 3.18 Developed FE model for top-and-seat angle connection
Seven experimental specimens presented in Table 3.4 tested by Garlock et al. (2003) was
developed FE analysis platform. In order to assess the accuracy of the finite element analysis, the
numerical results for all seven bolted angle models were compared with the experimental results.
Figure 3.19 shows the load-displacement behavior of the experimental specimen alongside the
experimental test results. These comparisons indicate that the finite element analysis can
accurately capture the cyclic response of bolted angle connection in terms of initial stiffness,
strength, and dissipated energy.
The specimen L8-58-4-NW was identical to the specimen L8-58-4 except a standard washer
was used instead of washer plate. From Figure 3.19 (g), the FE model overpredicts the capacity of
the specimen L8-58-4-NW, the reason behind this can be explained as the effect of nut orientation.
Since the angle load-deformation behavior is very sensitive to the gage length, the orientation of
the nut head can change the gage length and therefore, affected the behavior.
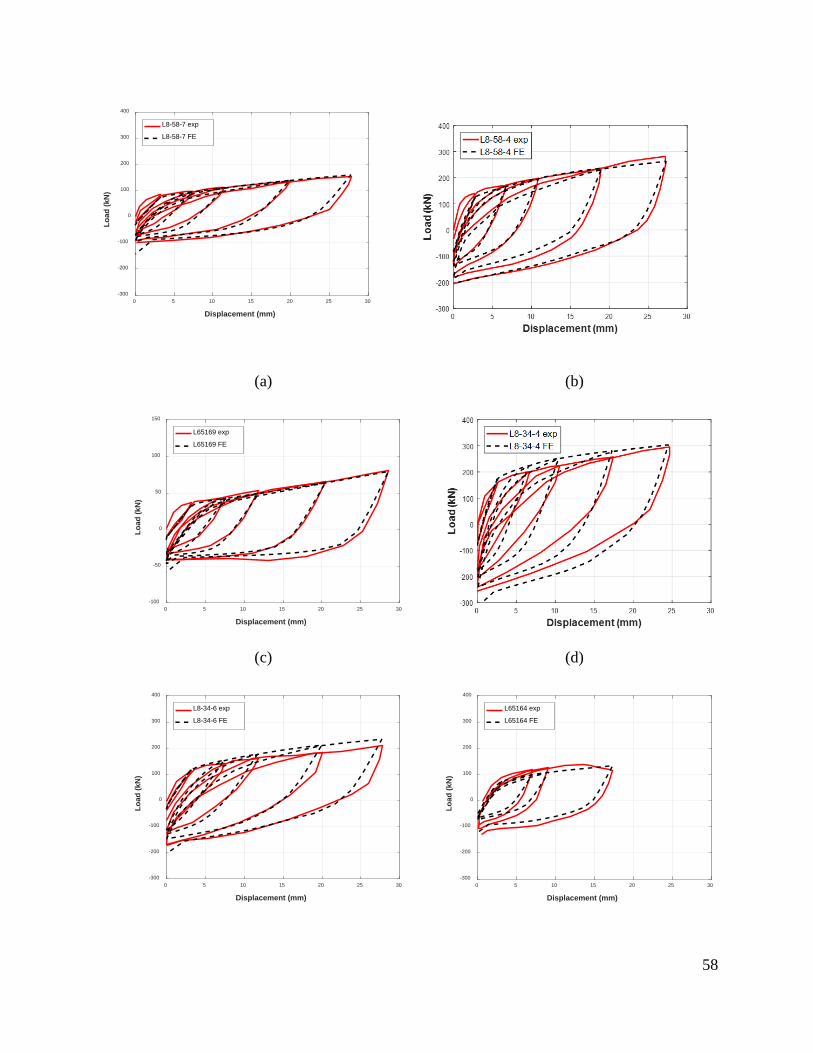
58
(a) (b)
(c) (d)
0 5 10 15 20 25 30
Displacement (mm)
-100
-50
0
50
100
150
Load
(kN
)
L65169 exp
L65169 FE
0 5 10 15 20 25 30
Displacement (mm)
-300
-200
-100
0
100
200
300
400
Load
(kN
)
L8-34-6 exp
L8-34-6 FE
0 5 10 15 20 25 30
Displacement (mm)
-300
-200
-100
0
100
200
300
400
Load
(kN
)
L65164 exp
L65164 FE
0 5 10 15 20 25 30
Displacement (mm)
-300
-200
-100
0
100
200
300
400Lo
ad (k
N)
L8-58-7 exp
L8-58-7 FE

59
(e) (f)
(g)
Figure 3.19 (a)-(g) Comparison between experimental and finite element analysis results
3.5.4 Top-and-Seat Angle with Stiffener
In order to improve the performance of bolted top-and-seat angle, a few adjustments were
considered for the validated finite element models. As shown in Figure 3.20, two different
configurations of stiffener were considered. At the preliminary stage, stiffener thickness was
considered as 5 mm. The load-displacement response shown in Figure 3.20 indicates that the
performance of bolted angle connection can be improved by adding stiffener into it. For stiffener
up to half-length, the load capacity increased by about 19.6%, whereas, it increased by about 82.7%
for stiffener in full length.
0 5 10 15 20 25 30
Displacement (mm)
-300
-200
-100
0
100
200
300
Load
(kN
)
L8584 NW exp
L8584 NW FE

60
(a)
(b)
Figure 3.20 Response of L8-58-4 NW specimen with (a) full-length stiffener and (b) half-
length stiffener
The energy dissipation capacity for the full length of stiffener was higher compared to the half-
length stiffener. The total amount of energy dissipated by full-length stiffener was about 24.84 kN-
m which is 131.72% more than the specimen without any stiffener. Since, during plastic
deformation, angle develops three plastic hinges, to dissipate more energy, the stiffener should
overlap with these hinge lengths. For the half-length specimen, the stiffener only connects these
three hinges without overlapping them, therefore, the improvement in terms of capacity and energy
dissipation is not high. The angle performance with additional stiffener is promising and therefore,

61
further parametric study was conducted to optimize the combination of angle size and stiffener
thickness.
3.5.5 Parametric Study on Stiffened Angle
In the current literature, to the best of the knowledge of the author, no parametric study on
stiffened angle connection was found. To optimize the performance of energy dissipating element
in SC-PT connection, a full factorial design approach was used. Four parameters such as (a) gage
length, (b) angle thickness, (c) yield strength of angle material, and (d) stiffener thickness were
considered to evaluate the performance in terms of initial stiffness, load capacity and energy
dissipation capacity. For each parameter, one high value (denoted as “+”) and one low value
(denoted as “-“) was considered (Table 3.6).
Table 3.6 factor selection for factorial analysis Factor Parameter name High (+1) Low (-1) Units A Stiffener thickness 10 3 mm B Yield strength 690 250 MPa C Gage length 114 90 mm D Angle thickness 25.4 12.7 mm
To determine the minimum and maximum thickness of stiffener, L8-58-4 NW specimen was
modified with three different thickness such as 5 mm, 8 mm, and 10 mm. From Figure 3.21, it was
evident that the effect of stiffener decreases with increasing thickness. Therefore, increasing the
thickness after that will increase the cost without contributing to the capacity of the connection.
On the other hand, a thickness less than 3 mm will initiate plate buckling during the welding
process. To this end, stiffener thickness between 3 mm and 10 mm was considered and
recommended for stiffened angle connection.

62
Figure 3.21 Effect of stiffener thickness on load-displacement behavior
3.5.5.1 Result and discussion
Based on four factors, in total, 16 models were developed and analyzed to investigate the cyclic
behavior. For each factor combination, the load-deformation response is presented in Figure 3.22.
A wide range of cyclic response was observed for these models. Model responses in terms of initial
stiffness, load capacity and energy dissipation capacity are presented in Table 3.7. The angle
thickness was the same (i.e., 25.4 mm) for the first eight model, whereas, stiffener thickness,
material yield strength, and gage length were varied.
0 5 10 15 20 25 30
Displacement (mm)
-500
-400
-300
-200
-100
0
100
200
300
400
500
Load
(kN
)
L8584 NW exp
L8584 NW S2.5F
L8584 NW S4.0F
L8584 NW S5.0F

63
Table 3.7 factorial analysis results SL No
Run Factors Responses
A (mm)
B (N/mm2)
C (mm)
D (mm)
Fmax (kN)
Ed (kN.m)
1 2 3 690 90 25.4 368 20.63 2 3 3 250 90 25.4 248 16.52 3 4 10 250 90 25.4 303 21.13 4 5 10 690 120 25.4 391 18.65 5 8 10 690 90 25.4 458 23.60 6 10 3 250 120 25.4 205 12.53 7 13 3 690 120 25.4 311 16.50 8 15 10 250 120 25.4 254 17.27 9 1 10 690 120 12.7 266 14.81 10 6 10 250 90 12.7 166 11.72 11 7 10 690 90 12.7 293 16.81 12 9 3 250 120 12.7 104 7.720 13 11 10 250 120 12.7 146 10.43 14 12 3 250 90 12.7 124 9.330 15 14 3 690 120 12.7 180 12.33 16 16 3 690 90 12.7 213 14.77
The results indicate that the load capacity and energy dissipation capacity of angle connection can
be increased by increasing the stiffener thickness or material yield strength. At the same time, the
gage length should be lower. From previous literature, it was observed that lower gage length can
lead to early fatigue failure of the specimen. This study shows that higher capacity is also
achievable with higher gage length by adding thick stiffener plate.
Model 8-16 consists of angle with smaller thickness (i.e., 12.7 mm). The load capacity ranges from
124 kN to 293 kN. The energy dissipation capacity can reach up to 16.81 kN.m. All model’s
responses were compared with the experimentally tested specimen L8-58-4-NW. The angle
thickness was about 15.9 mm for this specimen. From Figure 3.22, it is evident that even with
smaller angles higher capacity can be achieved by adding stiffener into the angles.
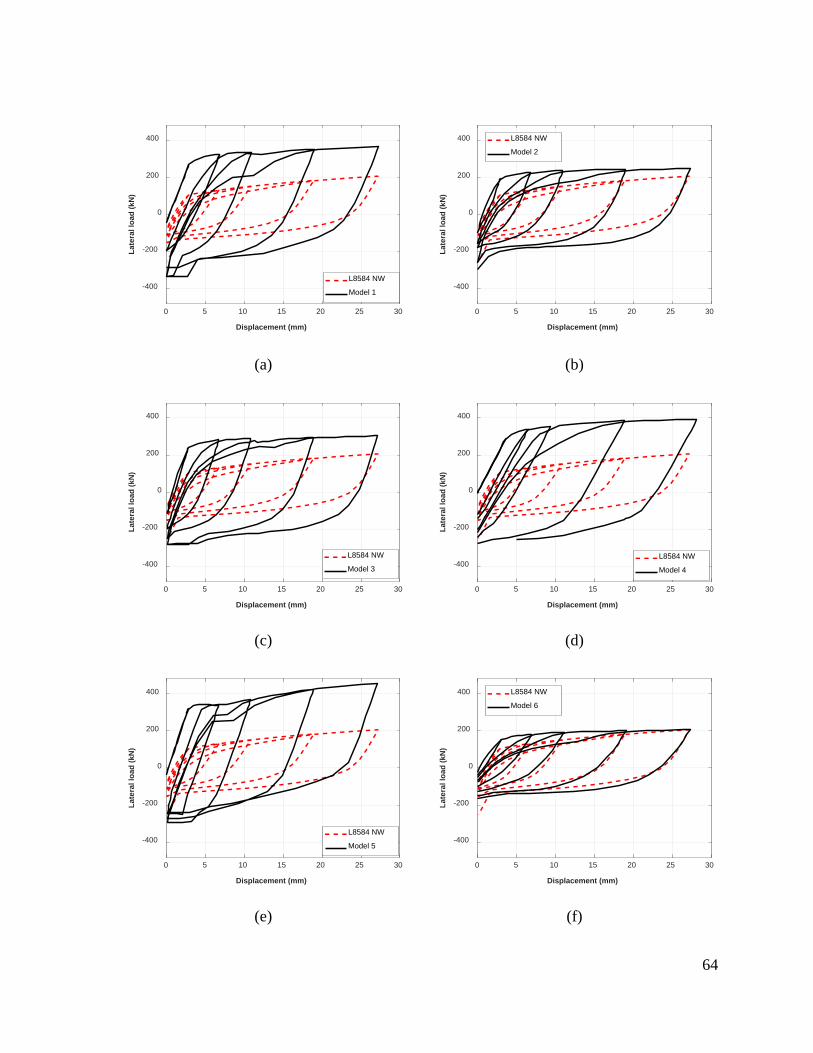
64
(a) (b)
(c) (d)
(e) (f)
0 5 10 15 20 25 30
Displacement (mm)
-400
-200
0
200
400La
tera
l loa
d (k
N)
L8584 NW
Model 1
0 5 10 15 20 25 30
Displacement (mm)
-400
-200
0
200
400
Late
ral l
oad
(kN
)
L8584 NW
Model 2
0 5 10 15 20 25 30
Displacement (mm)
-400
-200
0
200
400
Late
ral l
oad
(kN
)
L8584 NW
Model 3
0 5 10 15 20 25 30
Displacement (mm)
-400
-200
0
200
400
Late
ral l
oad
(kN
)
L8584 NW
Model 4
0 5 10 15 20 25 30
Displacement (mm)
-400
-200
0
200
400
Late
ral l
oad
(kN
)
L8584 NW
Model 5
0 5 10 15 20 25 30
Displacement (mm)
-400
-200
0
200
400
Late
ral l
oad
(kN
)
L8584 NW
Model 6

65
(g) (h)
(i) (j)
(k) (l)
0 5 10 15 20 25 30
Displacement (mm)
-400
-200
0
200
400La
tera
l loa
d (k
N)
L8584 NW
Model 7
0 5 10 15 20 25 30
Displacement (mm)
-400
-200
0
200
400
Late
ral l
oad
(kN
)
L8584 NW
Model 8
0 5 10 15 20 25 30
Displacement (mm)
-400
-200
0
200
400
Late
ral l
oad
(kN
)
L8584 NW
Model 9
0 5 10 15 20 25 30
Displacement (mm)
-400
-200
0
200
400
Late
ral l
oad
(kN
)
L8584 NW
Model 10
0 5 10 15 20 25 30
Displacement (mm)
-400
-200
0
200
400
Late
ral l
oad
(kN
)
L8584 NW
Model 11
0 5 10 15 20 25 30
Displacement (mm)
-400
-200
0
200
400
Late
ral l
oad
(kN
)
L8584 NW
Model 12

66
(m) (n)
(o) (p)
Figure 3.22 (a-p) Load-deflection behavior of model 1-16
3.6 Summary
The three-dimensional finite element model developed and validated in the previous chapter was
used in this study. The top and seat angle was modified by adding additional stiffener on it. After
developing the solid model, a parametric study was carried out to examine the effects of three
controlling factors such as (i) stiffener thickness, (ii) gage length of the angle and (iii) reinforcing
plate thickness. An increase in stiffener thickness leads to higher capacity and higher energy
0 5 10 15 20 25 30
Displacement (mm)
-400
-200
0
200
400La
tera
l loa
d (k
N)
L8584 NW
Model 13
0 5 10 15 20 25 30
Displacement (mm)
-400
-200
0
200
400
Late
ral l
oad
(kN
)
L8584 NW
Model 14
0 5 10 15 20 25 30
Displacement (mm)
-400
-200
0
200
400
Late
ral l
oad
(kN
)
L8584 NW
Model 15
0 5 10 15 20 25 30
Displacement (mm)
-400
-200
0
200
400
Late
ral l
oad
(kN
)
L8584 NW
Model 16

67
dissipation, however, residual deformation of the connection also increased simultaneously. On
the other hand, increasing the gage length can have a negative effect on energy dissipation capacity
but it will remove residual deformation from the connection. Since stiffener was increasing the
plastic deformation in the beam flanges compare to the top and seat angle alone, the effect of flange
reinforcing plate thickness to strengthen the beam flanges were also investigated.
In order to optimize the top and seat angle connection with different stiffener thickness, gage
length, and angle sizes, a full factorial analysis was conducted and presented in the next section of
this study. Higher load capacity and energy dissipation capacity can be achieved by using smaller
angle with stiffener. Smaller gage length can help the angle to increase the load carrying capacity,
but the previously tested experimental specimen shows that it initiates early fatigue failure.
Therefore, the gage length of the stiffened angle connection can be used to balance between the
load capacity and the probability of early fatigue failure.
68
Chapter 4 Application of SMA in Self-Centering Beam-Column Connections
4.1 General
The SC ability of a PT connection is directly related to the post-tensioning elements, e.g., the
high strength steel strands are widely used as such elements. However, since these PT elements
should remain elastic during loading, the application of steel strands is limited to small to moderate
drift levels. Otherwise, at a large drift level, the PT elements will yield and lose their SC capability.
Besides, such long post-tensioning strand is susceptible to corrosion and fire-induced damage,
which can affect multiple spans of a moment resisting frame and can result in collapse. Such a
failure scenario can be avoided by using short-length strands/tendons. Moreover, quality control
is easier if non-continuous post-tensioning strands are used. Repairing and retrofitting of a
damaged component is easier. It can be done without affecting the whole SC system if PT strands
are not continuous throughout the length. However, shorter length steel strand will not provide the
strain required to apply the post-tensioning force and hence, will reach yield strain. On the other
hand, superelastic SMA can serve the purpose. Although the application of SMA material in SC
connection has been studied previously, it is mostly used for both energy dissipation and SC
purpose at the same time. The novelty of this study lies in the application of a shorter length of
SMA tendons in post-tensioning beam-column connection. No previous studies have looked into
the behavior of shorter length PT steel or SMA strand in steel beam-column connection, which
could not only reduce the length of SMA and its relevant cost but also help self-center the structure
even after an earthquake.

69
Hence, this study investigates the influence of reduced length PT steel strands on the lateral
load-drift response of PT connections using nonlinear finite element analysis. The second objective
of this thesis is to study the feasibility of using superelastic SMA strands in steel beam-column
connections, which provide higher energy dissipation along with SC capability. Moreover, steel
connections with SMA strands do not require major maintenance. Superelastic SMAs can recover
up to a strain percentage of 6-13%. The finite element study includes the feasibility of using four
different SMAs, including FeMnAlNi, FeNCATB, CuAlMn, and NiTi, based on the availability
and desired mechanical properties of SMA materials.
4.2 Cyclic Response of PT Connection with Shorter Length Steel and SMA Strand
4.2.1 Incorporating Shorter Length PT Steel Strand
The effect of shorter length PT strand was investigated to observe the response of PT
connection. The validated FE model is used further to conduct this parametric study. Four different
lengths of PT strand excluding an original length of 3057 mm were considered in this study. As
listed in Table 4.1, one-third, half, two-thirds, and three-quarter of the original length were taken
as the strand lengths in developing the FE models. Each specimen designation consists of two
parts; the initial part is PC4 which is the same for all five specimens. The later part indicates the
reduced length (RL) in comparison to the original length (OL) (Figure 4.1 (a)-(e)). Beam flanges
in the original specimen were pre-compressed to the columns with the anchorage plates which are
placed at the outer edge of the connection. However, end plates need to be placed at the inner side
of the beam flanges for shorter length strand. The connection detailing for the end plate (anchorage
plate) and beam flange connection can be considered as a bolted connection. To simplify the

70
connection geometry, bonded contact between an anchorage plate and beam flanges was
considered in the FE modeling.
Figure 4.1 PT strand length (a) PC4-RL1 (1019 mm), (b) PC4-RL2 (1528 mm), (c) PC4-RL3
(2038 mm), (d) PC4-RL4 (2292 mm), and (e) PC4-OL (3057 mm)
4.2.1.1 Effect of PT Strand Length
Four different lengths of PT strands, other than the original specimen (PC4-RL1, PC4-RL2,
PC4-RL3, and PC4-RL4) were considered for this parametric study. Table 4.1 lists these models

71
alongside the response parameters. Kd, Mmax, and Ed indicate the post-decompression stiffness,
maximum moment capacity, and energy dissipation capacity, respectively. The lateral load-
displacement response is shown in Figure 4.2 and is compared with the validated model (PC4-
OL).
(a) (b)
(c) (d)
Figure 4.2 Analytical response of specimens (a) PC4-RL1, (b) PC4-RL2, (c) PC4-RL3, and (d)
PC4-RL4 compared to the original specimen PC4-OL
To determine the initial stiffness, pushover analysis was done on each specimen. The initial
stiffness value is taken as the secant stiffness at 0.3% drift. Since the stiffness of a PT strand is
-150 -100 -50 0 50 100 150
Displacement (mm)
-400
-200
0
200
400
Late
ral l
oad
(kN
)
PC4-RL1
PC4-OL
-150 -100 -50 0 50 100 150
Displacement (mm)
-400
-200
0
200
400
Late
ral l
oad
(kN
)
PC4-RL2
PC4-OL
-150 -100 -50 0 50 100 150
Displacement (mm)
-400
-200
0
200
400
Late
ral l
oad
(kN
)
PC4-RL3
PC4-OL
-150 -100 -50 0 50 100 150
Displacement (mm)
-400
-200
0
200
400
Late
ral l
oad
(kN
)
PC4-RL4
PC4-OL

72
relatively low compared to the stiffness of the beams, the initial stiffness did not change much for
specimens with reduced length.
Table 4.1 Response values observed at 3.5% drift Specimen PT strand length
(mm) Kd
(kN/m)
Mmax (kN-m)
Ed (kN-m)
PC4-RL1 1019 2406 (87.67%) 514.17 (5.45%) 110.06 PC4-RL2 1528 2378 (85.49%) 509.03 (4.39%) 103.14 PC4-RL3 2038 1692 (31.98%) 507.47 (4.07%) 100.83 PC4-RL4 2292 1607 (25.35%) 504.63 (3.49%) 100.13 PC4-OL 3057 1282 487.58 96.212
When decompression occurs in such connections with bolted angles, a gap opens between the
column and beam face and steel angles start deforming to allow further deformation. During this
time, the overall stiffness of the connection reduces, which mostly depends on the stiffness of steel
angle and elastic stiffness of the PT strand (Garlock et al., 2005). This stiffness can be termed as
post-decompression stiffness (Kd). As stiffness is inversely proportional to the length of the PT
strand, an increase in stiffness for shorter length strand was observed. This eventually contributed
to increasing the maximum moment capacity of the connection. The maximum moment capacity
for PC4-RL1 was 514.17 kN-m which is 5.45% higher than the original specimen. The moment
capacity ranges for all other specimen were from 504 to 509 kN-m. The amount of increase in the
moment capacity of PC4-RL4, PC4-RL3, PC4-RL2 is 3.49, 4.07, and 4.39%, respectively
compared to the original one.
The strands in a PT connection must remain elastic since the system loses its re-centering
capability once the strands are yielded. The residual deformation of a PT connection increases with
the decrease in PT strand length. This is due to beam local buckling and the stress concentration
on each strand. In small drifts, the steel strand shows higher capacity and SC is achieved, however
at large displacements, residual strains appear. The PT connection with one-third strand length can
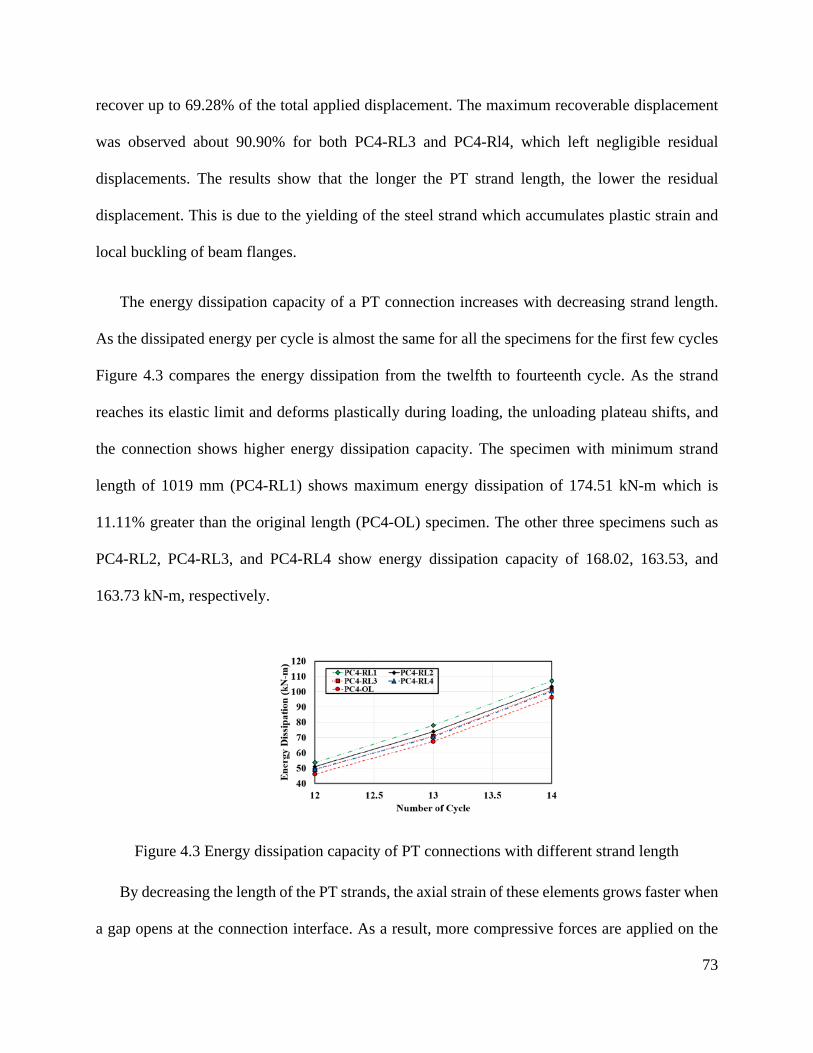
73
recover up to 69.28% of the total applied displacement. The maximum recoverable displacement
was observed about 90.90% for both PC4-RL3 and PC4-Rl4, which left negligible residual
displacements. The results show that the longer the PT strand length, the lower the residual
displacement. This is due to the yielding of the steel strand which accumulates plastic strain and
local buckling of beam flanges.
The energy dissipation capacity of a PT connection increases with decreasing strand length.
As the dissipated energy per cycle is almost the same for all the specimens for the first few cycles
Figure 4.3 compares the energy dissipation from the twelfth to fourteenth cycle. As the strand
reaches its elastic limit and deforms plastically during loading, the unloading plateau shifts, and
the connection shows higher energy dissipation capacity. The specimen with minimum strand
length of 1019 mm (PC4-RL1) shows maximum energy dissipation of 174.51 kN-m which is
11.11% greater than the original length (PC4-OL) specimen. The other three specimens such as
PC4-RL2, PC4-RL3, and PC4-RL4 show energy dissipation capacity of 168.02, 163.53, and
163.73 kN-m, respectively.
Figure 4.3 Energy dissipation capacity of PT connections with different strand length
By decreasing the length of the PT strands, the axial strain of these elements grows faster when
a gap opens at the connection interface. As a result, more compressive forces are applied on the

74
beam flanges at the beam-column interface. This might cause plastification at large drifts following
plastic buckling of the beam flanges. However, in this study, the beam flanges are reinforced.
Although the beam flanges showed minor out-of-plane deformation at large drifts, buckling did
not happen as the load-displacement response of the system did not degrade. On the other hand,
plastic deformation of the beam flanges results in beam shortening following the loss in post-
tensioning forces. The effect of stand length on post-tensioning forces for specimens PC4 and PC4
RL1 (one-third length) is illustrated in Figure 4.4 (a)-(b).

75
(a)
(b)
Figure 4.4 (a) Posttensioning force of specimen PC4, and (b) Posttensioning force of specimen
PC4 RL1
4.2.1.2 Effect of PT force
The SC behavior of PT connections is highly dependent on the amount of initial post-
tensioning force applied to the PT strands (Moradi and Alam, 2017a; Moradi and Alam, 2017b).
Thus, this section aims at reducing the residual deformation by reducing initial post-tensioning
force on the connection. To prevent the strand yielding at the earlier stage of loading, Garlock et
al. (2005) suggested restricting the amount of post-tensioning force. Therefore, in this section,
10% and 25% of the strand ultimate strength were applied on two connections (such as PC4-RL1
-150 -100 -50 0 50 100 150
Displacement (mm)
0
50
100
150
Post
tens
ioni
ng fo
rce
(kN
)
-150 -100 -50 0 50 100 150
Displacement (mm)
0
50
100
150
Post
tens
ioni
ng fo
rce
(kN
)

76
and PC4-RL2) as the post-tensioning force was to observe the effect of initial post-tensioning force
on the connection behavior (Figure 4.5).
(a) (b)
Figure 4.5 Load-displacement behavior for reduced force in specimen (a) PC4-RL1 and (b)
PC4-RL2
Due to the lower post-tensioning forces, the connections experienced lower post-
decompression stiffness and lower maximum moment capacity.
4.2.2 Incorporating SMA Strand
4.2.2.1 Introduction
An earlier study indicated that shorter length of PT strands has positive effects on the initial
stiffness, post-decompression stiffness, strength and moment capacity of the connection
(Chowdhury et al., 2017). However, the strand yielding is inevitable in the case of shorter length.
Smart materials such as SMA can solve the yielding issue and in addition to this, this material has
other benefits. The initial cost may seem higher for this type of material compared to the high
strength steel. This cost will eventually help the structure sustain major earthquakes without
accumulating significant residual deformation.
-150 -100 -50 0 50 100 150
Displacement (mm)
-400
-200
0
200
400
Late
ral l
oad
(kN
)
PC4-RL1 34% PT force
PC4-RL1 10% PT force
-150 -100 -50 0 50 100 150
Displacement (mm)
-400
-200
0
200
400
Late
ral l
oad
(kN
)
PC4-RL2 34% PT force
PC4-RL2 25% PT force

77
Due to the large recoverable strain of SMA, the re-centering capability of PT connections can
also be preserved with shorter length strand. Based on this concept, four different types of SMA
were considered in this study. Iron (Fe) based alloys are gaining popularity due to their workability
and low cost. However, the major drawback of Fe based SMA is their inability to retain
superelasticity at room temperature. Tanaka et al. (2010) proposed an innovative combination of
Fe based shape memory alloy which can recover up to 13.5% strain at room temperature. This
ferrous superelastic alloy with a composition of Fe-28Ni-17Co-11.5Al-2.5Ta-0.05B is called
FeNCATB alloy and yield strength of this alloy is 750MPa. NiTi alloy shows large recoverable
strain up to 8% due to superelasticity. The main advantage of NiTi over the aforementioned alloy
is its availability. As the use of SMA increasing rapidly, the cost of NiTi SMA is also decreasing
(Alam et al., 2007). Shrestha et al. (2013), used Cu based alloy with a recoverable strain of 6%. Fe
based alloys are cheaper compared to other alloys. Due to the presence of iron, it introduces ductile
behavior in alloys. Therefore, this study considered two iron-based alloys. Omari et al. (2011)
proposed FeAlMnNi alloy which shows very small temperature dependence. As the characteristics
of SMA highly depends on temperature ranges, it is necessary to use less temperature sensitive
alloys. The mechanical properties used for each SMAs are presented in Table 4.2.
Table 4.2 Material properties of SMA used in this study SL No Alloy εs
(%)
εr (%)
E (GPa)
fy
(MPa) fp1
(MPa) fT1
(MPa) fT2
(MPa) Reference
1 NiTi45 8 0.5 68 435.0 535.0 335.0 170.0 (Ghassemieh and Kari, 2013)
2 FeNCATB 13.5 1.5 46.9 750.0 1200 300.0 200.0 (Tanaka et al., 2010)
3 CuAlMn 9 0.4 28 210.0 275.0 200.0 150.0 (Shrestha et al., 2013)
4 FeMnAlNi 6.13 0.7 98.4 320.0 442.5 210.8 122.0 (Omori et al., 2011)

78
The superelastic behavior of SMA was employed in ANSYS using the inbuilt Auricchio’s
model (Auricchio, 2001). The typical stress-strain behavior of SMA is shown in Figure 4.6. The
input parameters of ANSYS can be defined as i) austenite to martensite starting stress (fy), ii)
austenite to martensite finishing stress (fp1), iii) martensite to austenite starting stress (fT1), iv)
martensite to austenite finishing stress (fT2), v) maximum recoverable strain (εs), vii) modulus of
elasticity for martensite and austenite phase, and vii) ratio of transformation stresses under tension
and compression (αt). There are some limitations in the SMA modeling in ANSYS such as i) this
model is temperature and rate independent, ii) this model does not account for accumulated
residual deformation under cyclic loading (Moradi and Alam, 2015b).
Figure 4.6 Idealized behavior of superelastic SMA
4.2.2.2 Effect of SMA Strand in PT Connection
One of the advantages of using superelastic SMA strand is that it can self-center without any
residual deformation even after yielding. This yielding phenomenon will increase the energy
dissipation capacity of the connection. However, the stress at the PT strand should not go beyond
its martensitic finish stress (i.e., ultimate strength). The designer can design the SMA strand and
its initial post-tensioning force based on the following strain equations. Three different equations
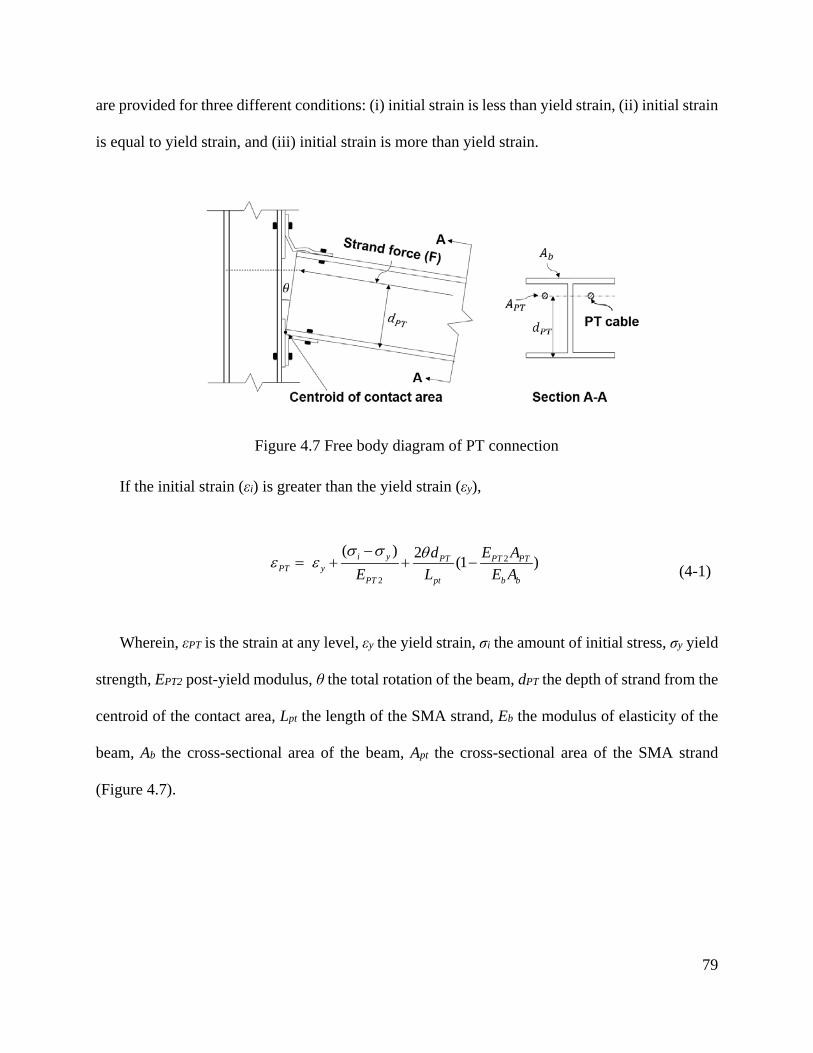
79
are provided for three different conditions: (i) initial strain is less than yield strain, (ii) initial strain
is equal to yield strain, and (iii) initial strain is more than yield strain.
Figure 4.7 Free body diagram of PT connection
If the initial strain (εi) is greater than the yield strain (εy),
2
2
( ) 2 (1 )i y PT PT PTPT y
PT pt b b
d E AE L E A
σ σ θε ε−
= + + −
(4-1)
Wherein, εPT is the strain at any level, εy the yield strain, σi the amount of initial stress, σy yield
strength, EPT2 post-yield modulus, θ the total rotation of the beam, dPT the depth of strand from the
centroid of the contact area, Lpt the length of the SMA strand, Eb the modulus of elasticity of the
beam, Ab the cross-sectional area of the beam, Apt the cross-sectional area of the SMA strand
(Figure 4.7).

80
If initial strain (εi) is equal to the yield strain (εy),
22 (1 )PT PT PTPT y
pt b b
d E AL E Aθε ε= + −
(4-2)
If initial strain (εi) is less than the yield strain (εy), the yield strain can be calculated by using
the following equation,
12
(1 )y PT PT PTy i
pt b b
d E AL E A
θε ε= + −
(4-3)
Where, yield rotation can be calculated as,
1 2(1 )
y in pty
PT PT PT
b b
LE A d
E A
ε εθ
− = −
(4-4)
Hence, strain at any drift level can be calculated by,
22( )
(1 )y PT PT PTPT y
pt b b
d E AL E A
θ θε ε
−= + −
(4-5)
For the alloys, the post-tensioning force was calculated based on their certain percentage of
ultimate strength. This force is determined in such a way that, the maximum stress on the SMA
strand should be lower than its ultimate strength or martensitic finishing stress. The ultimate
strength of NiTi and FeMnAlNi are 535 MPa and 442 MPa, respectively. The post-tensioning

81
forces applied on each strand were 25 kN and 21 kN, respectively, which are about 34% of their
ultimate strengths. However, the amount of post-tensioning force that was applied in high strength
steel strand was about 88 kN. This indicates the amount of force applied for keeping the SC
capability of the connection which is about 71.6% and 76.13% lower for NiTi and FeMnAlNi
alloy, respectively. Based on the simulation results (Figure 4.8), it was observed that the initial
stiffness, post decompression stiffness, maximum moment capacity, and energy dissipation
capacity of the beam-column connection decreased significantly, and large residual deformation
was also observed for these two alloys. The moment capacity of the connections with FeMnAlNi
and NiTi alloys are 327.85 kN-m and 344.66 kN-m, respectively. The moment capacity of the
connection is mostly determined by the amount of post-tensioning force and its ultimate strength.
Therefore, all other parameters including the moment capacity of FeMnAlNi alloy specimen are
less than those of the NiTi alloy specimen. Higher residual deformation of FeMnAlNi alloy can
be justified by the fact that the recoverable strain capability of this alloy is less than the NiTi alloy
(i.e., 8%). The comparison between the responses of these two alloys is shown in Figure 4.8 (a) to
(c). The Fe (Iron) alloy-based connection shows slightly higher energy dissipation capacity (2%)
than the NiTi alloy based connection. The yield strength or martensitic starting stress of FeMnAlNi
is 320 MPa and 435 MPa for NiTi, respectively. Therefore, at the same level of loading, Fe alloy-
based connection (FeMnAlNi-RL1-RF) will go beyond its elastic limit earlier than NiTi alloy
based connection (NiTi-RL1-RF), which will increase the energy dissipation capacity of the
connection.

82
(a) (b)
(c)
Figure 4.8 (a), (b) and (c): Load-displacement behavior of shorter length NiTi and FeMnAlNi
alloy
The performance of high strength SMAs such as the FeNCATB alloy based connection
(FeNCATB-RL1) can outperform original specimen (PC4-OL) and shorter length specimen (PC4-
RL1) even with the existing strand diameter (i.e., 13.35 mm) and shorter length (i.e., 1019 mm).
The yield strength or martensitic starting stress of the FeNCATB alloy is 750 MPa which is much
higher compared to the three other alloys considered in this study. Due to higher allowable post-
tensioning force and large recoverable strain of up to 13.5%, it can re-center the PT connection at
-150 -100 -50 0 50 100 150
Displacement (mm)
-400
-200
0
200
400La
tera
l loa
d (k
N)
PC4-RL1
NiTi-RL1-RF
-150 -100 -50 0 50 100 150
Displacement (mm)
-400
-200
0
200
400
Late
ral l
oad
(kN
)
PC4-RL1
FeMnAlNi-RL1-RF
-150 -100 -50 0 50 100 150
Displacement (mm)
-200
-100
0
100
200
Late
ral l
oad
(kN
)
NiTi-RL1-RF
FeMnAlNi-RL1-RF

83
largest drift with shorter length strand. From Figure 4.9 (a), the post-decompression stiffness of
shorter strand length specimen (FeNCATB-RL1) is 1250 kN/m which is almost 49% lower than
shorter length steel strand (PC4-RL1) and only 3% lower than the original specimen (PC4-OL).
The lower modulus of elasticity is the controlling factor in this case. The maximum moment
capacity of this connection is 451.55 kN-m which is only 7.35% lower than the original specimen
(PC4-OL). The response of this alloy is almost identical to the original length specimen with 12%
higher energy dissipation. It should be noted that the length of the FeNCATB alloy specimen
(FeNCATB-R1) is 1019 mm which is only one-third of the total length of high strength steel strand
(i.e., 3057 mm). Therefore, FeNCATB alloy can be an excellent candidate for SMA based SC
connections.
(a) (b)
Figure 4.9 (a) and (b) Comparison of FeNCATB alloy with both original (PC4-OL) and
reduced length strand specimen (PC4-RL1)
The potential of using the Cu based alloy such as CuAlMn for seismic application is still the
topic of ongoing research. Due to its low cost and moderate ductility, this study investigated the
performance of this alloy numerically. Since the yield strength of this alloy is low compared to the
-150 -100 -50 0 50 100 150
Displacement (mm)
-400
-200
0
200
400
Late
ral l
oad
(kN
)
PC4-RL1
FeNCATB-RL1
-150 -100 -50 0 50 100 150
Displacement (mm)
-400
-200
0
200
400
Late
ral l
oad
(kN
)
PC4-OL
FeNCATB-RL1
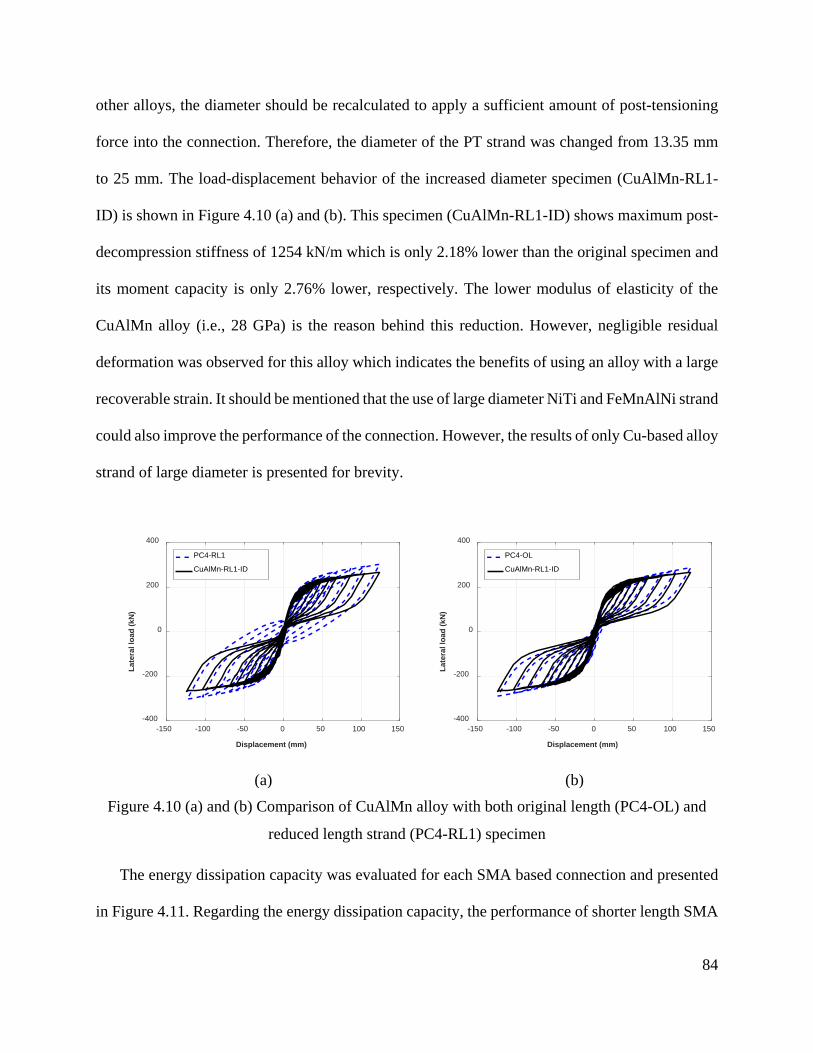
84
other alloys, the diameter should be recalculated to apply a sufficient amount of post-tensioning
force into the connection. Therefore, the diameter of the PT strand was changed from 13.35 mm
to 25 mm. The load-displacement behavior of the increased diameter specimen (CuAlMn-RL1-
ID) is shown in Figure 4.10 (a) and (b). This specimen (CuAlMn-RL1-ID) shows maximum post-
decompression stiffness of 1254 kN/m which is only 2.18% lower than the original specimen and
its moment capacity is only 2.76% lower, respectively. The lower modulus of elasticity of the
CuAlMn alloy (i.e., 28 GPa) is the reason behind this reduction. However, negligible residual
deformation was observed for this alloy which indicates the benefits of using an alloy with a large
recoverable strain. It should be mentioned that the use of large diameter NiTi and FeMnAlNi strand
could also improve the performance of the connection. However, the results of only Cu-based alloy
strand of large diameter is presented for brevity.
(a) (b)
Figure 4.10 (a) and (b) Comparison of CuAlMn alloy with both original length (PC4-OL) and
reduced length strand (PC4-RL1) specimen
The energy dissipation capacity was evaluated for each SMA based connection and presented
in Figure 4.11. Regarding the energy dissipation capacity, the performance of shorter length SMA
-150 -100 -50 0 50 100 150
Displacement (mm)
-400
-200
0
200
400
Late
ral l
oad
(kN
)
PC4-RL1
CuAlMn-RL1-ID
-150 -100 -50 0 50 100 150
Displacement (mm)
-400
-200
0
200
400
Late
ral l
oad
(kN
)
PC4-OL
CuAlMn-RL1-ID

85
based connection was comparable to the performance of the original specimen (PC4-OL). This
indicates the feasibility of using SMA in the SC structure. FeMnAlNi showed a maximum energy
dissipation capacity of 110.17 kN-m. The energy dissipation capacity of the other three alloy
ranges from 99.14 to 103.31 kN-m. All alloys are capable of dissipating higher energy compared
to the control specimen with steel strands (PC4-OL) (Figure 4.11). However, the energy
dissipation capacity of the NiTi and FeMnAlNi alloys are mostly followed by large residual
deformation. Although NiTi and FeMnAlNi show energy dissipation capacity of 99.148 kN-m and
110.17 kN-m, respectively, their residual displacements are almost similar to the shorter length
steel connection (PC4-RL1).
Figure 4.11 Energy dissipation capacity of different SMA compared to the original specimen
(PC4-OL)
In this study, the application of NiTi and FeMnAlNi alloys are found unsuitable due to their
low recovery strain and hence, large residual deformation. However, comparable performance was
achieved for the FeNCATB and CuAlMn alloys. Since the CuAlMn alloy is a low strength alloy,
the diameter of this alloy was increased to achieve full SC of the connection. The maximum
moment capacities of FeNCATB-RL1 and CuAlMn-RL1-ID are 470 kN-m and 474.12 kN-m,
respectively which are only 2.89% and 2.06% less than the original length specimen (PC4-OL)

86
(table 4). The energy dissipation capacity and maximum moment capacity of CuAlMn-RL1-ID are
higher than the FeNCATB-RL1 specimen. Moreover, the residual deformation is also less for the
Cu-based alloy. Therefore, this study indicates the potential of using Cu based (i.e., CuAlMn alloy)
and Fe based (i.e., FeNCATB alloy) SMAs in SC structure with reduced length strands.
Table 4.3 Response values observed for different SMA at a story drift of 3.5% SL No.
Specimen δ (mm)*
Mmax
(kN-m) Kd
(kN/m) Ed
(kN-m) 1 NiTi-RL1-RF 42.23 344.66 1215 99.148 2 FeNCATB-RL1 9.78 470.76 1250 97.259 3 CuAlMn-RL1-ID 3.51 474.12 1254 103.31 4 FeMnAlNi-RL1-RF 62.38 327.85 1124 110.17
*Residual displacement at a story drift of 3.5%.
The initial strain applied for each specimen is presented in table 5. Using equations (4-1) to (4-
-5), the initial strain was determined so that the maximum strain at 4% drift would be less than the
maximum recoverable strain for each SMA. The maximum force in the SMA strand was monitored
and compared with that of the analytical equation to verify its accuracy. The analytical equations
overpredicted the post-tensioning forces for all specimens which indicates a conservative design.
The reason behind this is the loss of the post-tensioning forces due to the plastic deformation of
the beam flanges at large drifts.
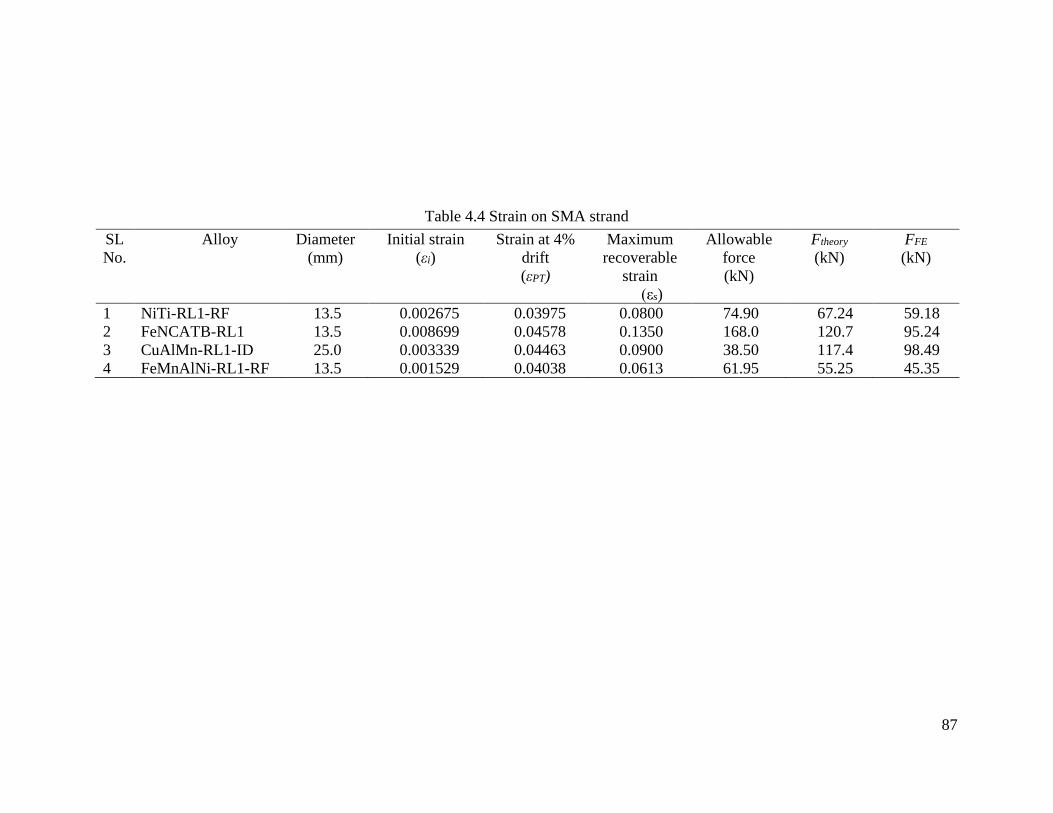
87
Table 4.4 Strain on SMA strand SL No.
Alloy Diameter (mm)
Initial strain (εi)
Strain at 4% drift (εPT)
Maximum recoverable
strain (εs)
Allowable force (kN)
Ftheory (kN)
FFE (kN)
1 NiTi-RL1-RF 13.5 0.002675 0.03975 0.0800 74.90 67.24 59.18 2 FeNCATB-RL1 13.5 0.008699 0.04578 0.1350 168.0 120.7 95.24 3 CuAlMn-RL1-ID 25.0 0.003339 0.04463 0.0900 38.50 117.4 98.49 4 FeMnAlNi-RL1-RF 13.5 0.001529 0.04038 0.0613 61.95 55.25 45.35

88
The post-tensioning force versus displacement behavior of specimens PC4, NiTi RL1 RF,
FeNCATB RL1, FeMnAlNi RL1 RF, and CuAlMn RL1 ID is presented in Figure 4.12 (a)-(e).
Since the steel strands in specimen PC4 were designed to remain elastic, its maximum force is well
below its capacity (i.e., Fallow = 182 kN). For the SMA strand, since it has an inherent re-centering
behavior, it can yield but it should not reach the ultimate capacity. However, as discussed earlier,
the initial post-tensioning force should be limited to avoid plastic deformation of the beam flanges
and that the subsequent loss in the post-tensioning force. The dotted lines in Figure 4.12 represent
the allowable force limit for each SMA strand.
(a) (b)

89
(c) (d)
(e)
Figure 4.12 Posttensioning forces in (a) steel, (b) FeMnAlNi, (c) NiTi, (d) FeNCATB, and (e)
CuAlMn strands
To ensure the advantages of using SMA instead of steel strand an additional analysis has been
done on original length steel strand specimen (PC4-OL) and iron-based alloy specimen with one-
third length (FeNCATB-RL1). Although the post-tensioning cables are designed accordingly to
provide SC during an earthquake; due to the uncertainty in nature, the structure may experience
higher drift than usual. Figure 4.13 shows that the PC4 connection loses SC capability at 5% drift.
However, if reduced length SMA is being used in this case, it will remain intact at 5% drift which
warrants the utilization of relatively costly material for long-term benefits and safety of the
structure.

90
Figure 4.13 Response between SMA and steel strand at 5% drift
4.2.2.3 Effect of Initial PT force on SMA Strand
In this section, the effect of initial strain on SMA based SC connection is investigated. The
initial amount of post-tensioning force can be calculated in terms of strain by using equation (4-1)
to (4-5). Three different strain amounts were considered for this study including (i) initial strain
less than yield strain, (ii) initial strain equal to yield strain, and (iii) initial strain greater than yield
strain. In each case, the maximum strain in the SMA strand at the design drift level should be
below its recoverable strain. Increasing the initial stress/strain results in an increase in the
decompression moment as can be seen in Figure 4.14 (a)-(c).
-200 -100 0 100 200
Displacement (mm)
-400
-200
0
200
400
Late
ral l
oad
(kN
)
PC4-OL at 5% drift
FeNCATB alloy at 5% drift
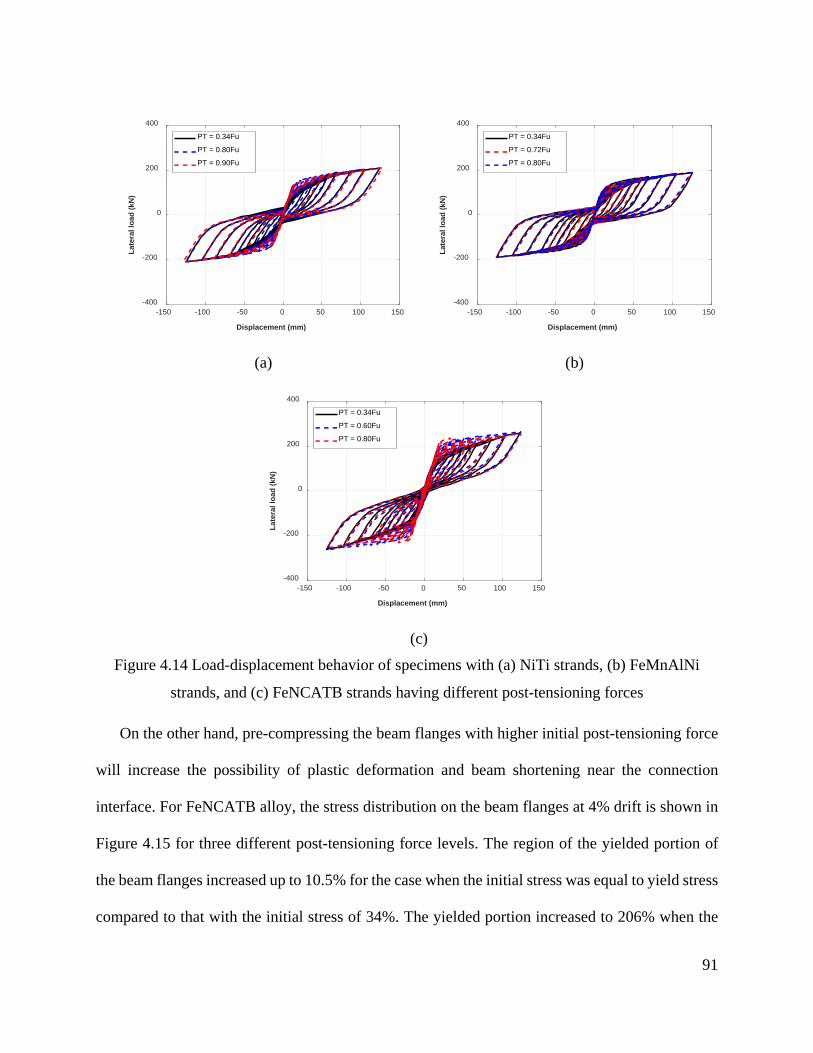
91
(a) (b)
(c)
Figure 4.14 Load-displacement behavior of specimens with (a) NiTi strands, (b) FeMnAlNi
strands, and (c) FeNCATB strands having different post-tensioning forces
On the other hand, pre-compressing the beam flanges with higher initial post-tensioning force
will increase the possibility of plastic deformation and beam shortening near the connection
interface. For FeNCATB alloy, the stress distribution on the beam flanges at 4% drift is shown in
Figure 4.15 for three different post-tensioning force levels. The region of the yielded portion of
the beam flanges increased up to 10.5% for the case when the initial stress was equal to yield stress
compared to that with the initial stress of 34%. The yielded portion increased to 206% when the
-150 -100 -50 0 50 100 150
Displacement (mm)
-400
-200
0
200
400La
tera
l loa
d (k
N)
PT = 0.34Fu
PT = 0.80Fu
PT = 0.90Fu
-150 -100 -50 0 50 100 150
Displacement (mm)
-400
-200
0
200
400
Late
ral l
oad
(kN
)
PT = 0.34Fu
PT = 0.72Fu
PT = 0.80Fu
-150 -100 -50 0 50 100 150
Displacement (mm)
-400
-200
0
200
400
Late
ral l
oad
(kN
)
PT = 0.34Fu
PT = 0.60Fu
PT = 0.80Fu

92
initial stress was more than the yield stress. Therefore, initial stress or strain on the SMA strand
should be limited, depending on the beam strength, in order to avoid excessive plastic deformation
in the beam flanges. Instead of limiting the post-tensioning forces, beam section capacity can also
be increased for the demand at the target drift.

93
(a) (b)
(c)
Figure 4.15 Beam stress contour of FeNCATB-RL1 at 3.5% drift for (a) PT=0.34Fu, (b)
PT=0.60Fu, and (c) PT=0.80Fu forces
4.3 Cyclic Response of Hybrid Strands
The use of a hybrid strand, as shown in Figure 4.16, comprising of steel and SMA strand
coupled with the mechanical device, could reduce the use of SMA material. The elongation of a
hybrid strand can be calculated using the following formula,

94
(4-6)
In which, ls and lSMA are the lengths, εs, and εSMA are the strain of steel and SMA strands,
respectively. Conservatively assuming that the total strain is accumulated in the SMA strand, then,
SMA SMAl l ε∆ ≈ (4-7)
By using equations (4-1) to (4-5), the minimum required length of SMA strand for any selected
initial post-tensioning force can be determined. Specimen PC4 with shorter length strand (i.e.,
PC4-RL1) was designed with composite strands where the minimum required lengths for
FeNCATB, NiTi, and FeMnAlNi alloys were 300 mm, 530 mm, and 635 mm, respectively. The
length of SMA for FeNCATB, NiTi, and FeMnAlNi was about 70%, 47%, and 37% less compared
to their corresponding full-length SMA strand, respectively.
s s SMA SMAl l lε ε∆ = +

95
Figure 4.16 FE model of hybrid strands connection
The load-displacement behavior of specimens incorporating hybrid strands is presented in
Figure 4.17 (a-c). The behavior is almost identical to that of full-length SMA strands’. The only
difference is the increased stiffness of the composite strand (Figure 4.18). This is due to the
contribution of the steel strand in load carrying, which was ignored during the design for the initial
post-tensioning force.
(a) (b)
-150 -100 -50 0 50 100 150
Displacement (mm)
-400
-200
0
200
400
Late
ral L
oad(
kN)
-150 -100 -50 0 50 100 150
Displacement (mm)
-400
-200
0
200
400
Late
ral L
oad(
kN)

96
(c)
Figure 4.17 Load displacement behavior of PT connection with composite tendon (a) NiTi, (b)
FeMnAlNi, and (c) FeNCATB
Figure 4.18 Posttensioning force-displacement response of NiTi strand with full-length SMA
strand and hybrid strand
-150 -100 -50 0 50 100 150
Displacement (mm)
-400
-200
0
200
400
Late
ral L
oad(
kN)
-150 -100 -50 0 50 100 150
Displacement (mm)
20
30
40
50
60
70
80
Post
tens
ioni
ng fo
rce
(kN
)
Full length SMA
Composite Tendon

97
4.4 Cyclic Response of PT Connection with SMA Angle
4.4.1 General
In seismic application, steel angles are used in the PT connection to dissipate energy by
accumulating plastic strain. The addition of stiffener, as investigated in the previous section, can
improve the energy dissipation capacity as well as the post-decompression stiffness. However,
after an earthquake of moderate to high intensity the damaged angles should be replaced. In case
of high rise structures, although there will be no or minor residual drift, the number of the
connection needs to be repaired will be numerous. The connection details and the surrounding
structural and non-structural components may create a hassle to replace those elements. Most
importantly, this replacement requires both time and money. The use of SMA angles further
reduces the repair time and cost. Due to its large recoverable strain, an SMA angle dissipates
energy without any residual deformation.
To study the effect of SMA angles, this section is focused on introducing the SMA angle by
replacing the steel angle of the benchmark specimens. The material properties used for four
different SMA angles are presented in Table 4. The alloys are named SMA1, SMA2, SMA3, and
SMA4 for simplicity.
Table 4.5 SMA Properties SMA type Alloy εs E fy fp1 fT1 fT2 References
MPa MPa MPa MPa MPa SMA1 NiTi 6.17 62500 401.0 510.0 370.0 130.0 (Alam et al., 2007)
SMA2 FeNCATB 9.47 46818 749.1 857.9 310.0 210.0 (Dezfuli and Alam, 2013)
SMA3 NiTi 8.00 68000 435.0 535.0 335.0 170.0 (Ghassemieh et al., 2012)
SMA4 FeNCATB 13.5 46900 750.0 1200.0 300.0 200.0 (Tanaka et al., 2010)

98
The SMA angles experience inelastic deformation immediately after the gap opens between
the column and the beam interface. Before the gap opening, the initial stiffness of these
connections is similar to semi-rigid connections. Therefore, the material properties of angles affect
the post-decompression stiffness and the load capacity of the connection. The yield strength of
NiTi alloy is 401 MPa which is about 52% higher than the yield strength of steel angles. As a
consequence, the load capacity of PC4 SMA1 and PC2 SMA1 is 9.12% and 9.75% more than the
load capacity of PC4 and PC2 specimens, respectively. On the other hand, the modulus of elasticity
of NiTi SMA is 62 GPa compared to the modulus of elasticity of steel which is about 200 GPa
(222 % higher). This affects the post-decompression stiffness of PC4 SMA1 and PC2 SMA1. The
calculated stiffness was about 7.73% and 7.01% less than the stiffness of PC4 and PC2 specimens,
respectively.
During the lateral deflection of the PT connection with the top-and-seat angle, the angle
deforms plastically to dissipate energy while the post-tensioning cable helps the whole connection
to self-center. Since the inherent property of SMA is to return to its plumb position immediately
after load removal, the energy dissipation capacity of SMA angle based connection is
comparatively less than the steel top-and seat angle connection. In the case of PC4 SMA1 and PC2
SMA1, the energy dissipation capacity is 217.77% and 169.36% less than the PC4 and PC2
specimens with steel top-and-seat angles, respectively. The advantage of using SMA angles over
steel angles can be justified by observing the residual deformation of the connection after load
removal. The SMA1 alloy angle can recover up to 6% strain; therefore, no residual deformation
exists after the load removal.

99
Table 4.6 Cyclic response of SMA angle connection SL No
Specimen
Angle material
Fmax Kd Mmax Ed (kN) (kN/m) (kN-m) (kN-m)
1 Steel 265.67 1282 485.90 96.21 2
PC4 SMA1 292.36 1190 534.72 30.21
3 SMA2 319.22 2060 583.85 31.46 4 SMA3 295.46 1198 540.39 32.25 5 SMA4 319.63 2069 584.60 31.66 6 Steel 226.63 1312 412.47 81.16 7
PC2 SMA1 251.11 1055 459.28 30.13
8 SMA2 263.72 1928 482.34 43.69 9 SMA3 251.10 1087 459.26 32.16 10 SMA4 265.67 1424 485.91 48.57
PC4 SMA2 and PC2 SMA2 showed almost similar behavior to PC4 SMA1 and PC2 SMA1
(Figure 4.19 (c)-(d)). However, since the yield strength of SMA2 is much higher than the SMA1,
the maximum moment capacity of this connection is higher (Table 5). The energy dissipation
capacity seems to be improved by about 3.97% and 45% compared to the previous specimens with
the SMA1 angles (i.e., PC4 SMA1 and PC2 SMA1), respectively. This can be explained by the
martensitic phase transformation of SMA2. Since the martensitic starting stress is higher in the
case of SMA2, the stress induced in this alloy is lower than the martensitic finish stress at the
largest drift, and during unloading, the SMA2 dissipates the higher amount of energy. However,
at the same time, it imposes higher forces on the bolts. In the case of the PC2 SMA2 specimen, the
shear forces generated in the vertical bolts were higher compared to the generated frictional forces
by the initial pre-tensioning forces. Therefore, at the largest drift, the slippage of the vertical bolt
was observed.
For PC4 SMA3 and PC2 SMA3, the NiTi with higher recovering strain (8%) was used (Figure
4.19 (e)-(f)). The initial stiffness, post-decompression stiffness, and maximum moment capacity
were almost similar to the earlier specimens (PC4 SMA1 and PC2 SMA1) with NiTi alloy.

100
However, the load capacity and the energy dissipation capacity of the connection with SMA3 was
slightly higher (up to 1% increase in load capacity and 6.75% increase in energy dissipation) than
the SMA1. The difference between the yield strength can be the reason for this slight increase in
the load capacity and the energy dissipation.
In case of SMA4 (i.e., PC4 SMA4 and PC2 SMA4), the recovering strain is 13.5% which is
much higher than the previous specimen (i.e., SMA2) of FeNCATB alloy (Figure 4.19 (g)-(h)).
No significant difference was observed for the SMA2 and SMA4. However, for this high strength
SMA angle, slippage of bolt occurred in the PC2 SMA2 and PC2 SMA4 specimen. The reason for
bolt slippage was investigated and presented in the latter section.
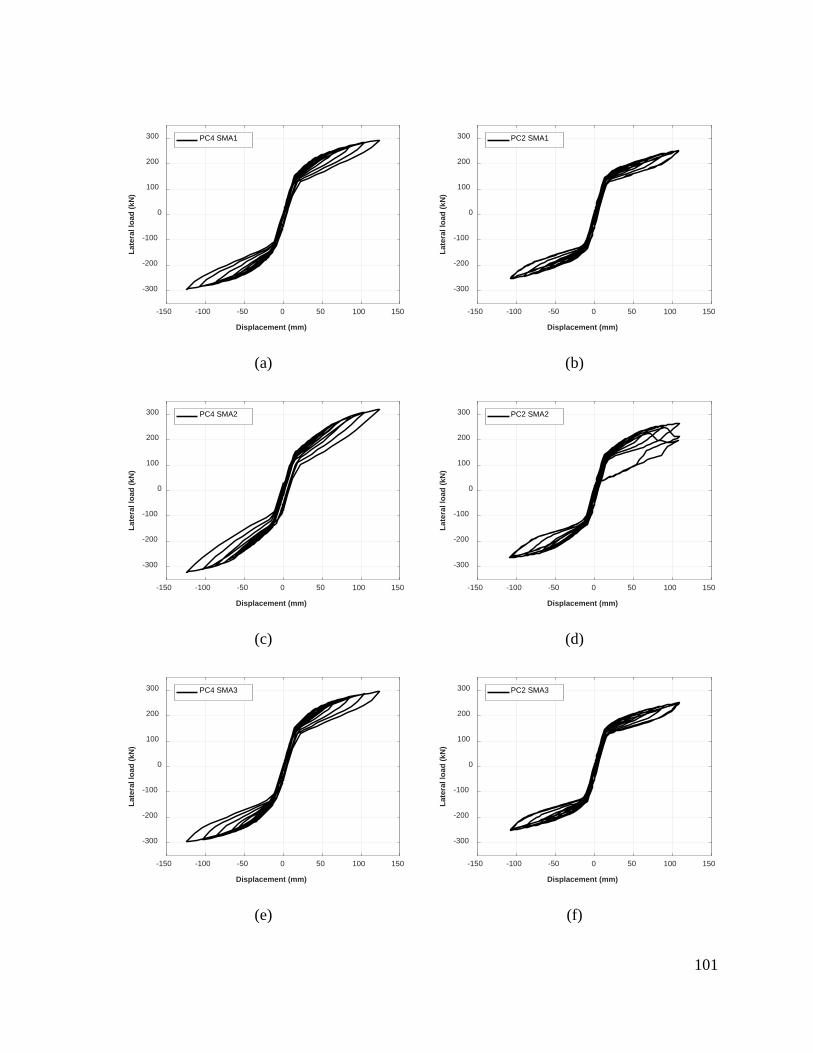
101
(a) (b)
(c) (d)
(e) (f)
-150 -100 -50 0 50 100 150
Displacement (mm)
-300
-200
-100
0
100
200
300La
tera
l loa
d (k
N)
PC4 SMA1
-150 -100 -50 0 50 100 150
Displacement (mm)
-300
-200
-100
0
100
200
300
Late
ral l
oad
(kN
)
PC2 SMA1
-150 -100 -50 0 50 100 150
Displacement (mm)
-300
-200
-100
0
100
200
300
Late
ral l
oad
(kN
)
PC4 SMA2
-150 -100 -50 0 50 100 150
Displacement (mm)
-300
-200
-100
0
100
200
300
Late
ral l
oad
(kN
)
PC2 SMA2
-150 -100 -50 0 50 100 150
Displacement (mm)
-300
-200
-100
0
100
200
300
Late
ral l
oad
(kN
)
PC4 SMA3
-150 -100 -50 0 50 100 150
Displacement (mm)
-300
-200
-100
0
100
200
300
Late
ral l
oad
(kN
)
PC2 SMA3

102
(g) (h)
Figure 4.19 Load displacement behavior of PC4 and PC2 with (a) – (b) SMA1, (c)-(d) SMA2,
(e)-(f) SMA3, and (g)-(h) SMA4
4.4.2 Discussion on Plastic Strain
Form the previous section it was concluded that the energy dissipation capacity of the existing
top and seat angle connection can be improved by introducing the stiffened steel angles. However,
it needs to be replaced due to the accumulated plastic strain after each earthquake. For the PC4
specimen, the plastic strain in the angle at the largest drift and end of the analysis is very high
(Figure 4.20 (c)-(d)), whereas, in case of SMA angle, no plastic strain was present in the angle at
the end of the analysis (Figure 4.20 (a)-(b)). Therefore, SMA angles can sustain consecutive
earthquakes without any considerable damage.
-150 -100 -50 0 50 100 150
Displacement (mm)
-300
-200
-100
0
100
200
300La
tera
l loa
d (k
N)
PC4 SMA4
-150 -100 -50 0 50 100 150
Displacement (mm)
-300
-200
-100
0
100
200
300
Late
ral l
oad
(kN
)
PC2 SMA4
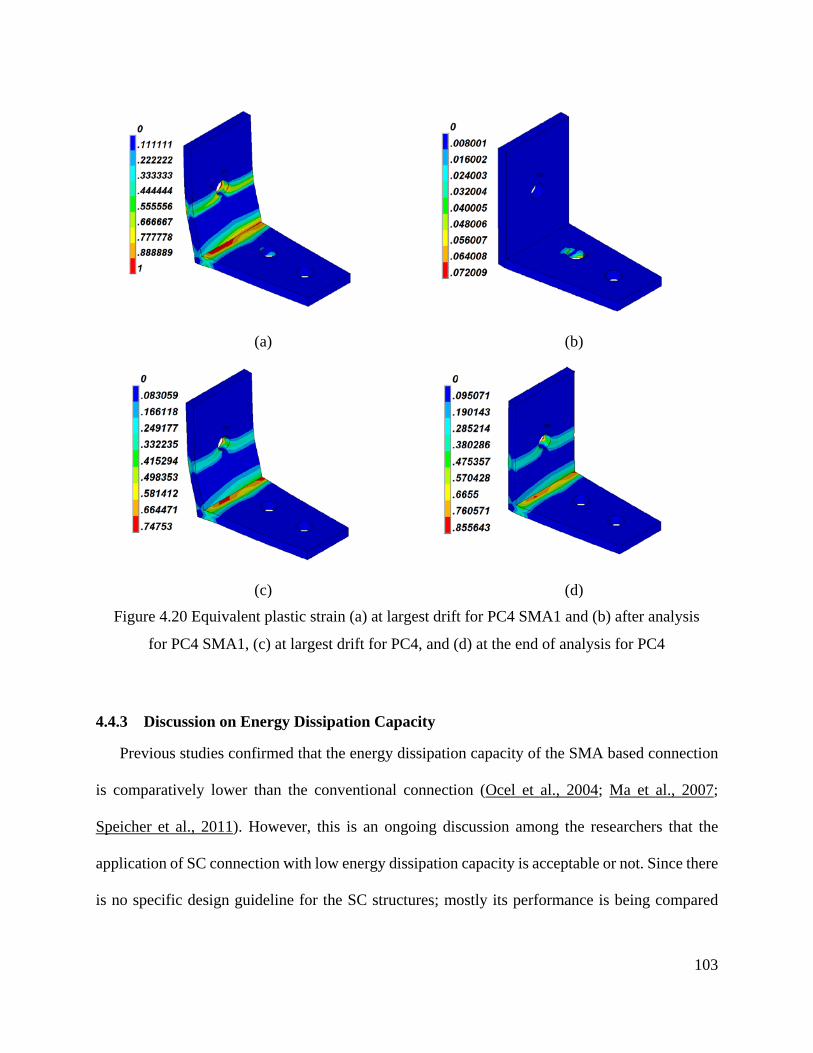
103
(a) (b)
(c) (d)
Figure 4.20 Equivalent plastic strain (a) at largest drift for PC4 SMA1 and (b) after analysis
for PC4 SMA1, (c) at largest drift for PC4, and (d) at the end of analysis for PC4
4.4.3 Discussion on Energy Dissipation Capacity
Previous studies confirmed that the energy dissipation capacity of the SMA based connection
is comparatively lower than the conventional connection (Ocel et al., 2004; Ma et al., 2007;
Speicher et al., 2011). However, this is an ongoing discussion among the researchers that the
application of SC connection with low energy dissipation capacity is acceptable or not. Since there
is no specific design guideline for the SC structures; mostly its performance is being compared

104
with the conventional ductile connection with large energy dissipation capacity. However, the
purpose of introducing high energy dissipation capacity into the structure by accumulating large
residual deformations was to reduce the ductility demand of the structures during an earthquake.
In case of superelastic SMA based connection, the ductility demand will be lower for the low rise
structures and higher for the high rise structures (DesRoches et al., 2010). In case of the other SC
systems, the ductility demand can be equal to or lower than the fully restrained connection systems
(Christopoulos et al., 2002a). However, no residual deformation will exist at the end of the
deformation cycles. Therefore, these systems are not comparable with the partially restrained
connection under current design framework. Even if the current design guideline is followed,
according to (Seo and Sause, 2005), SC systems can be designed to develop the ductility demands
similar to those of the conventional systems by combining α and β within a practical range. Where,
α is the strain hardening ratio, and β is the ratio between the maximum load capacity and load
capacity at the unloading part (Figure 4.21(a)).
(Christopoulos et al., 2002a) compared the seismic performance of one bilinear elasto-plastic
(EP) model (which represents the fully rigid MRFs) and one flag shape (FS) hysteresis system
(which represents SC MRFs). A seven-story MRFs incorporating both EP and FS systems were
investigated under 1989 Loma Prieta earthquake. As shown in Figure 4.21 (b), the EP system
deformed in one direction while the FS system showed symmetric load-deformation behavior in
both directions. Although the energy dissipation capacity of the FS system was comparatively
lower than the EP system, the system returned to its initial position without any residual
deformation. Therefore, with moderate values of alpha and beta, similar ductility demand is
achievable with the SMA angle based connection. However, extensive research is needed
specifically on the SMA angle based MRFs.

105
(a) (b)
Figure 4.21 (a) SC behavior of SDOF system, and (b) Nonlinear load-drift response of SDOF
system (Adapted from (Christopoulos et al., 2002a))
4.4.4 Discussion on the Slippage of Bolts
In this study, two high strength SMA angles were used (i.e., SMA2 and SMA4) to understand
the behavior of high strength steel bolts during cyclic loading. During large deformations, bolts
responsible for connecting SMA angle with beam flanges were subjected to large shear forces. In
case of PC2 connection, bolt pretension forces were not adequate to resist the imposed external
forces and therefore, experienced slippage. The slippage of angle bolt is shown in Figure 4.22 at
the largest drift. However, this bolt slippage problem can be solved by introducing larger
pretension forces on the bolt which will eventually increase the probability of early yielding of the
bolts due to the low cycle fatigue. Another solution is to redesign the bolt according to the shear
demand at largest drift.
-200 -100 0 100 200
Displacement (mm)
-6000
-4000
-2000
0
2000
4000
6000
Late
ral l
oad
(kN
)
Self-centering frame
Fully rigid frame
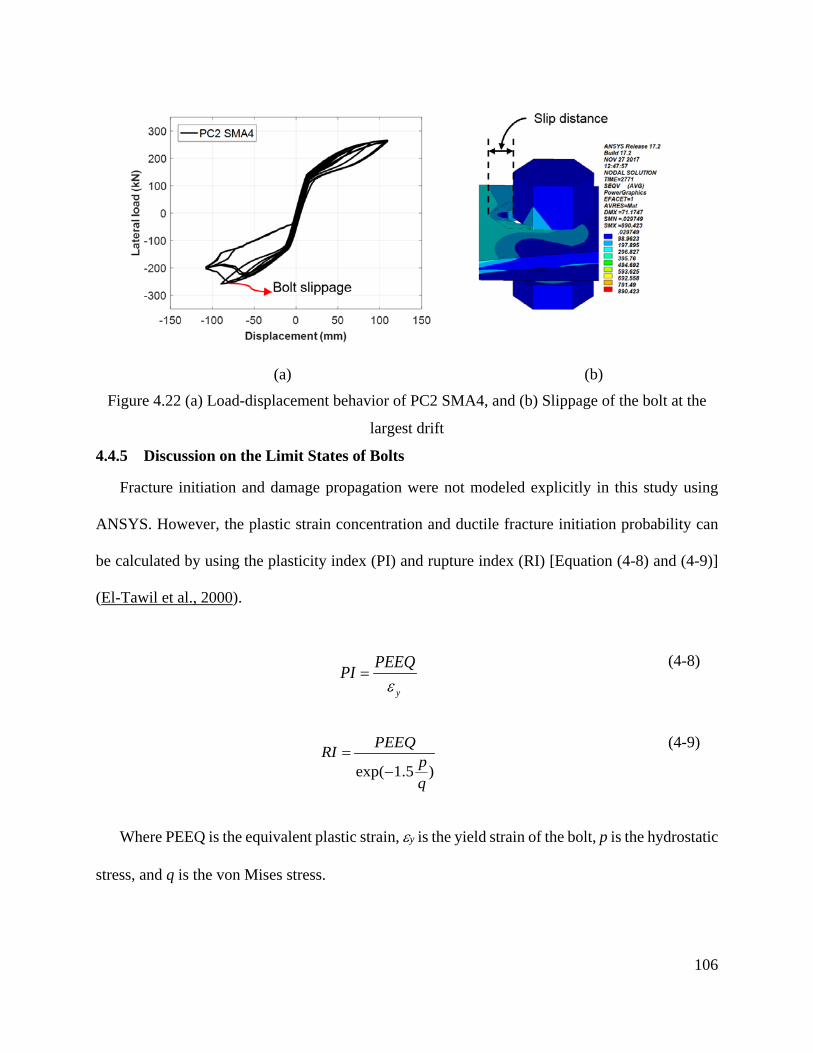
106
(a) (b)
Figure 4.22 (a) Load-displacement behavior of PC2 SMA4, and (b) Slippage of the bolt at the
largest drift
4.4.5 Discussion on the Limit States of Bolts
Fracture initiation and damage propagation were not modeled explicitly in this study using
ANSYS. However, the plastic strain concentration and ductile fracture initiation probability can
be calculated by using the plasticity index (PI) and rupture index (RI) [Equation (4-8) and (4-9)]
(El-Tawil et al., 2000).
y
PEEQPIε
= (4-8)
exp( 1.5 )
PEEQRI pq
=−
(4-9)
Where PEEQ is the equivalent plastic strain, εy is the yield strain of the bolt, p is the hydrostatic
stress, and q is the von Mises stress.

107
Vasdravellis et al. (2013) and Moradi and Alam (2017a) used this index to identify the limit
states of the PT connection. Since high strength SMA angles are used in this study instead of
ductile steel angles, it is important to identify the probability of plastic strain concentration and
fracture initiation at the largest drifts. To observe the failure probability, PI and RI were graphed
vs. the normalized bolt depth (Figure 4.23 (b)-(d)). The normalized bolt depth was computed as
the ratio between the coordinate over the length of the bolt shank and whole bolt shank length
(Brunesi et al., 2014).
The results of the control specimen (PC2) and specimen with high strength SMA angle (PC2
SMA2) have been compared. From Figure 4.23, it is identifiable that bolts of PC2 SMA2 angle
connections are more vulnerable to failure at the largest drift. Higher plasticity index (PI) and
higher rupture index (RI) of PC2 SMA2 angle connection compared to the PC2 specimen indicate
the higher probability of accumulating plastic strain and rupture during cyclic loading. The
observed von misses stress on the horizontal bolt of the PC2 specimen at the largest drift agrees
well with the presented PI and RI.

108
(a) (b)
(c) (d)
Figure 4.23 (a) Von Mises stress at the largest drift, (b) Normalized bolt depth, (c) Rupture
Index (RI) of bolts, and (d) Plasticity Index (PI) of bolts
4.5 Cyclic Response of SMA based End plate Connection
4.5.1 General
In case of the SMA based top and seat angle PT connection, no residual deformation remains
in the angle after any seismic activity. However, high-stress concentration in the bolts may
generate plastic strain which means bolts need to be replaced eventually. Redesigning the bolt may
solve the issue which is not always a feasible option. Therefore, this section presented a
comparatively simple SMA based end plate PT connection.
-0.2 0 0.2 0.4 0.6 0.8 1
Normalized bolt depth
0
5
10
15
20
25
Rup
ture
Inde
x (R
I)
PC2 bolt
PC2 SMA2 bolt
-0.2 0 0.2 0.4 0.6 0.8 1
Normalized bolt depth
-1
0
1
2
3
Plas
ticity
Inde
x (P
I)
PC2 bolt
PC2 SMA2 bolt
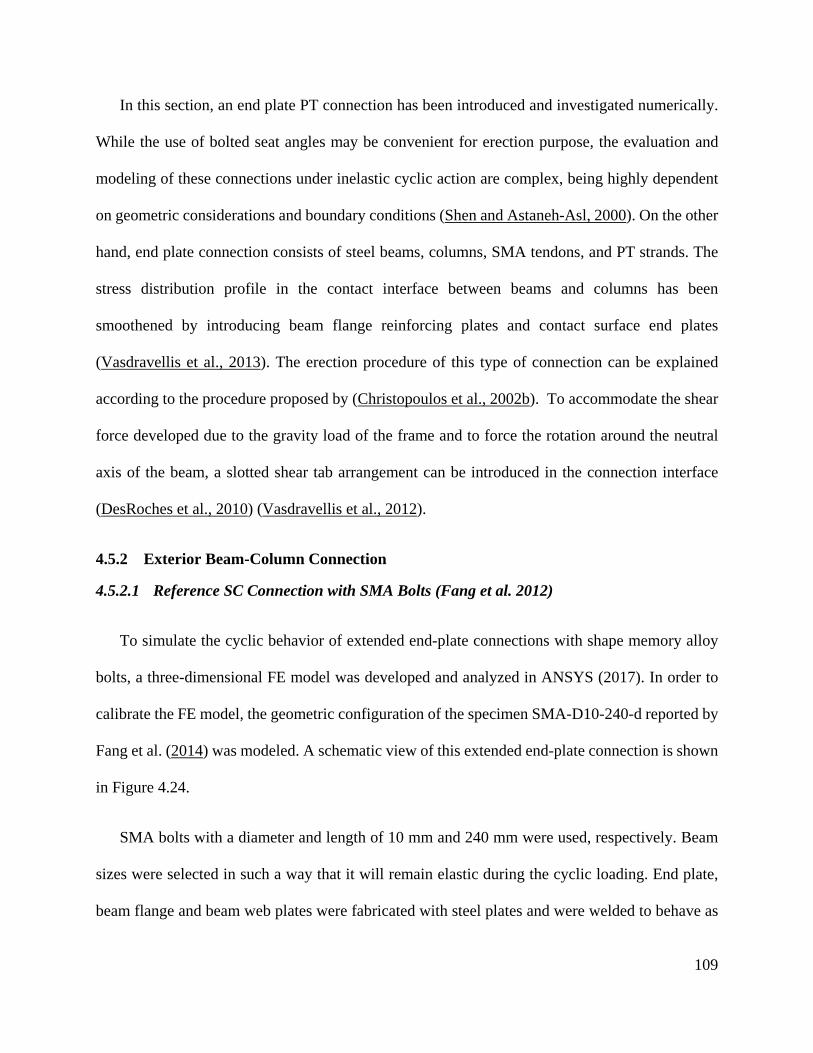
109
In this section, an end plate PT connection has been introduced and investigated numerically.
While the use of bolted seat angles may be convenient for erection purpose, the evaluation and
modeling of these connections under inelastic cyclic action are complex, being highly dependent
on geometric considerations and boundary conditions (Shen and Astaneh-Asl, 2000). On the other
hand, end plate connection consists of steel beams, columns, SMA tendons, and PT strands. The
stress distribution profile in the contact interface between beams and columns has been
smoothened by introducing beam flange reinforcing plates and contact surface end plates
(Vasdravellis et al., 2013). The erection procedure of this type of connection can be explained
according to the procedure proposed by (Christopoulos et al., 2002b). To accommodate the shear
force developed due to the gravity load of the frame and to force the rotation around the neutral
axis of the beam, a slotted shear tab arrangement can be introduced in the connection interface
(DesRoches et al., 2010) (Vasdravellis et al., 2012).
4.5.2 Exterior Beam-Column Connection
4.5.2.1 Reference SC Connection with SMA Bolts (Fang et al. 2012)
To simulate the cyclic behavior of extended end-plate connections with shape memory alloy
bolts, a three-dimensional FE model was developed and analyzed in ANSYS (2017). In order to
calibrate the FE model, the geometric configuration of the specimen SMA-D10-240-d reported by
Fang et al. (2014) was modeled. A schematic view of this extended end-plate connection is shown
in Figure 4.24.
SMA bolts with a diameter and length of 10 mm and 240 mm were used, respectively. Beam
sizes were selected in such a way that it will remain elastic during the cyclic loading. End plate,
beam flange and beam web plates were fabricated with steel plates and were welded to behave as
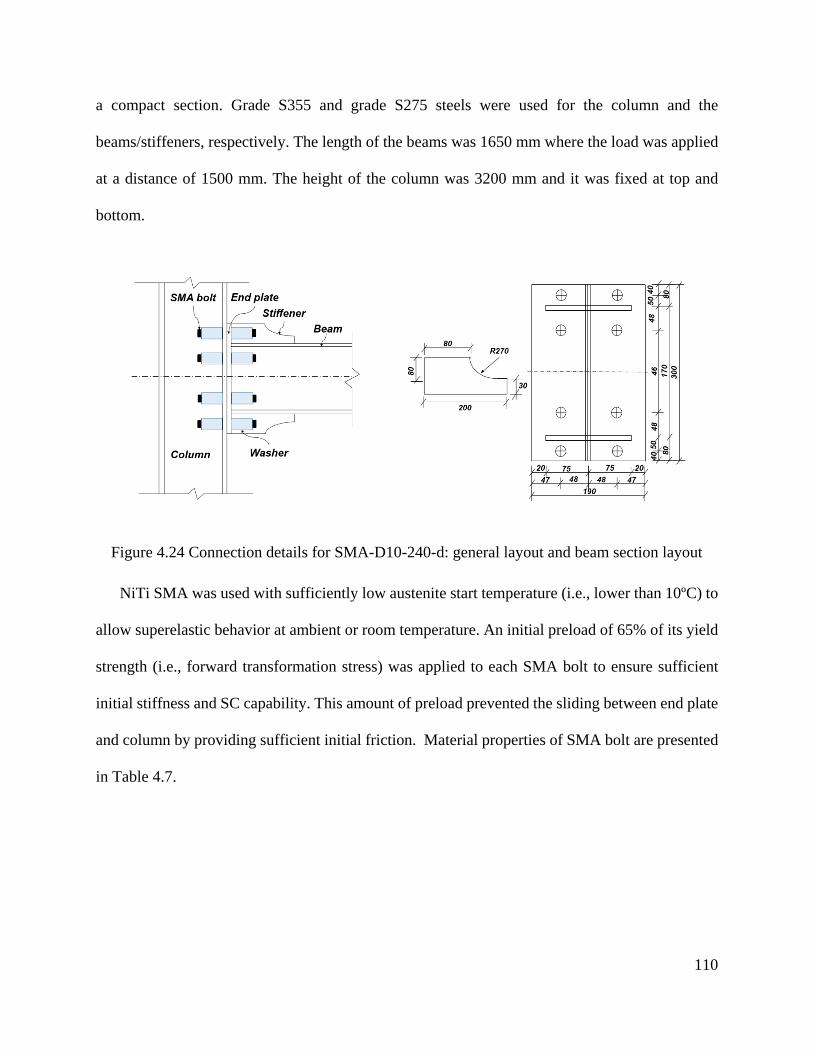
110
a compact section. Grade S355 and grade S275 steels were used for the column and the
beams/stiffeners, respectively. The length of the beams was 1650 mm where the load was applied
at a distance of 1500 mm. The height of the column was 3200 mm and it was fixed at top and
bottom.
Figure 4.24 Connection details for SMA-D10-240-d: general layout and beam section layout
NiTi SMA was used with sufficiently low austenite start temperature (i.e., lower than 10ºC) to
allow superelastic behavior at ambient or room temperature. An initial preload of 65% of its yield
strength (i.e., forward transformation stress) was applied to each SMA bolt to ensure sufficient
initial stiffness and SC capability. This amount of preload prevented the sliding between end plate
and column by providing sufficient initial friction. Material properties of SMA bolt are presented
in Table 4.7.

111
Table 4.7 Material properties of SMA bolts Fang et al. 2012 Ma et al. 2007 Starting stress of forward phase transformation 360 MPa 375 MPa Final stress of forward phase transformation 450 MPa 430 MPa Starting stress of reverse phase transformation 280 MPa 208 MPa Final stress of reverse phase transformation 130 MPa 138 MPa Maximum residual strain 0.05 0.09
To reduce the computational time, half of the model was developed and therefore, symmetry plane
was considered for this connection. The nonlinear properties of steel material were considered by
a bilinear kinematic model. The model was meshed using the SOLID 185 elements (Figure 4.25).
Inbuilt Auricchio’s model was utilized for defining the parameters of superleastic NiTi SMA. All
the contact surfaces were defined with “standard contact” to capture the sliding and gap opening
behavior.
(a) (b)
Figure 4.25 (a) Model development of external end plate connection, and (b) Moment-rotation
response of specimen SMA-D10-240-d
The comparison between the moment versus plastic rotation response of the test and FE model
is shown in Figure 4.25. The results are in good agreement indicating the capability of FE analysis.
-0.04 -0.02 0 0.02 0.04
Rotation (rad)
-80
-60
-40
-20
0
20
40
60
80
Mom
ent (
kN-m
)
SMA D10 240d Exp
FE results

112
4.5.2.2 Reference SC Connection with SMA Bolts (Ma et al. 2007)
4.5.2.3 Model Development and Validation
Advanced three-dimensional finite element model was developed by using ANSYS to
revalidate the finite element results of (Ma et al., 2007). For all steel materials, a bilinear kinematic
model with a young modulus of 200 GPa was used. A coefficient of friction of 0.45 was used for
defining contact. The boundary condition was defined according to the test setup of the
experimental specimen used by (Ma et al., 2007). During the experiment, the total rotation of the
beam against the column was determined by using a linear variable transducer (LVDT) which was
placed at a distance of 400 mm from the column face. The thickness of the end plate was 26 mm
and the diameter of NiTi SMA bolt was 16 mm. To reduce the strain demand on SMA bolt, the
length of the bolt was increased by adding 35 mm thick washer on both sides of it. In total, the
length of SMA bolt was 142 mm which is about 1.2 times longer than that of the normal bolt in
the traditional connection. Only half of the model was developed (Figure 4.26). Material properties
used in this study is presented in Table 4.7.

113
(a) (b)
Figure 4.26 (a) FE model and (b) validation of external SMA based end plate connection
An initial pretension force of 75 kN was applied which is about 86% of its ultimate strength.
An axial load of 500 kN was applied to the column top.
The results show moderate energy dissipation capacity and no/small residual deformation at a
drift level of 0.043 rad. The expected nominal elastic moment capacity of the beam was 153 kN.m
which is 25% more than the maximum moment capacity of the connection (i.e., 114 kN.m)
4.5.2.4 Parametric Study on Ma et al. 2007
Ma et al. (2007) considered only one SMA type (i.e., NiTi) to investigate the performance of
SMA based end plate connection. In this section, four different SMA such as NiTi, FeMnAlNi,
CuAlMn, and FeNCATB alloy were used to understand the performance of the connection
parameters. The results presented in Figure 4.27 indicates that low to moderate energy was
dissipated by the connection based on the strength and stiffness of each alloy.
-5 -4 -3 -2 -1 0 1 2 3 4 5
Drift (%)
-100
-50
0
50
100
Mom
ent (
kN-m
)
FE results
Experiment (Ma et al. 2007)

114
(a)
(b) (c)
-5 0 5
Drift (%)
-150
-100
-50
0
50
100
150
Mom
ent (
kN-m
)
Ma et al. 2007 (NiTi)
-4 -2 0 2 4
Drift (%)
-200
-100
0
100
200
Mom
ent (
kN-m
)
Ma et al 2007 (FeMnAlNi)

115
(d) (e)
Figure 4.27 End plate connection with (a) NiTi alloy, (b) FeMnAlNi alloy, (c) FeNCATB
alloy, and (d) CuAlMn alloy
Fang et al. (2014) extended the concept of SMA based end plate connection with further
experimental analysis which indicated that in most cases SMA bolts experienced brittle fracture
near the bolt head. Through three-dimensional finite element model, the result behind this type of
failure was examined in this study. Higher strain with vertical shear force on SMA bolt was
initiating a fracture in SMA bolts. This failure can be avoided by using long shank SMA as shown
in Figure 4.28. Although the strain in SMA will be less, the probability of failure of SMA will still
be there because of its low shear resistance.
-4 -2 0 2 4
Drift (%)
-100
-50
0
50
100M
omen
t (kN
-m)
Ma et al 2007 (CuAlMn)
-4 -2 0 2 4
Drift (%)
-200
-100
0
100
200
Mom
ent (
kN-m
)
Ma et al 2007 (FeNCATB)

116
(a)
(b) (c)
(d) (e)
-5 0 5
Drift (%)
-150
-100
-50
0
50
100
150
Mom
ent (
kN-m
)
Ma et al. 2007 (NiTi)
-5 -4 -3 -2 -1 0 1 2 3 4 5
Drift (%)
-200
-150
-100
-50
0
50
100
150
200
Mom
ent (
kN-m
)
FeMnAlNi 200mm bolt
FeMnAlNi 46mm bolt
-4 -2 0 2 4
Drift (%)
-200
-100
0
100
200
Mom
ent (
kN-m
)
Ma et al 2007 (FeNCATB)
-4 -2 0 2 4
Drift (%)
-100
-50
0
50
100
Mom
ent (
kN-m
)
Ma et al 2007 (CuAlMn)

117
Figure 4.28 End plate connection with (a) NiTi alloy, (b) FeMnAlNi alloy, (c) FeNCATB alloy, and (d)
CuAlMn alloy
4.5.2.5 Parametric Study on SMA Bolt with PT Cable
The connection layout with only SMA bolts to resist shear and tension is not practical and
needs to be modified. An effort was made to modify this existing section with PT cable in the
middle while SMA bolts will be placed on the outer face of the beam flange (Figure 4.29). Since
high strength steel strand can be designed to be in its elastic range, this cable will make sure that
the connection will have sufficient capacity to resist gravity load. On the other hand, SMA on the
outer edge of the connection will dissipate energy by using the recoverable strain capability.
Two different arrangement was considered with SC steel strand such as (i) short SMA bolt
with PT cable, and (ii) long shank SMA bolt with PT cable. Each specimen were investigated with
four different alloys to understand the behavior. The load-displacement behavior was almost
identical for both layout except for FeMnAlNi alloy. As shown in Figure 4.29 (d), for short shank
length SMA bolt, at 4% drift, a sudden spike was observed which is due to the strain in SMA
which increased beyond its recoverable strain limit. As discussed in the earlier chapter, the
-5 0 5
Drift (%)
-150
-100
-50
0
50
100
150
Mom
ent (
kN-m
)
Ma et al. 2007 (FeMnAlNi)

118
Auricchio’s model cannot capture the behavior after any SMA material reaches its ultimate
recoverable strain limit (Auricchio, 2001). Therefore, to reduce the strain in SMA bolts, long shank
SMA can be used. From the presented results in Figure 4.29 (d), it is evident that strain in SMA is
less than its recoverable strain limit.
(a)
(b) (c)
-6 -4 -2 0 2 4 6
Drift (%)
-150
-100
-50
0
50
100
150
Late
ral l
oad
(kN
)
Ma et al. 2007(SMA with PT Cable)
-6 -4 -2 0 2 4 6
Drift (%)
-100
-50
0
50
100
Late
ral l
oad
(kN
)
CuAlMn with PT cable

119
(d) (e)
Figure 4.29 End plate connection with (a) NiTi alloy, (b) FeMnAlNi alloy, (c) FeNCATB
alloy, and (d) CuAlMn alloy
On the other hand, long shank SMA bolt with PT cable can be the most efficient solution for
all above-mentioned problems (Figure 4.30). The PT cable will ensure the SC capacity of the
connection while maintaining sufficient friction between the beams and columns. SMA bolts are
placed at the outer most possible location to ensure maximum energy dissipation capacity. The
superelastic behavior of SMA bolts will aid the SC capability of the connection and shear force
demand on the bolts can be reduced by using this layout.
It is worth mentioning that except low strength alloy such as FeMnAlNi, all other alloys
showed almost identical response for short and long shank SMA bolts. Therefore, either
connection arrangement can be used provided that connections are designed carefully to limit the
maximum strain on SMA bolts.
-6 -4 -2 0 2 4 6
Drift (%)
-150
-100
-50
0
50
100
150La
tera
l loa
d (k
N)
FeNCATB with PT cable
-6 -4 -2 0 2 4 6
Drift (%)
-150
-100
-50
0
50
100
150
Late
ral l
oad
(kN
)
FeMnAlNi with PT cable

120
(a)
(b) (c)
-6 -4 -2 0 2 4 6
Drift (%)
-150
-100
-50
0
50
100
150
Late
ral l
oad
(kN
)
Ma et al. 2007(SMA with PT Cable)
-5 -4 -3 -2 -1 0 1 2 3 4 5
Drift (%)
-200
-150
-100
-50
0
50
100
150
200M
omen
t (kN
-m)
Short SMA
Long SMA

121
(d) (e)
Figure 4.30 End plate connection with (a) NiTi alloy, (b) FeMnAlNi alloy, (c) FeNCATB
alloy, and (d) CuAlMn alloy
Based on parametric studies conducted in this section, the FeMnAlNi alloy based exterior
connection needs more attention as it can reach up to its maximum recoverable strain at 4% drift.
The only parameters used in this study were the type of SMA and their layout in the end plate
based exterior connection. To understand the effect of other parameters on the seismic response of
this type of connection, in next section, an interior end plate based connection was presented and
studied considering some other controlling parameters.
4.5.3 Interior End plate Connection
4.5.3.1 Model Development
This model was developed by modifying the experimental specimen (i.e., PC4) of (Ricles et
al., 2002). Therefore, the beam and column sections were the same for this connection. Top and
seat angles have been replaced by a simple end plate which is connected to the column flange with
SMA tendons. The mesh was refined in the regions where severe plastic deformation may occur
such as in the contact area of SMA tendon and end plate. Standard contact was defined between
-6 -4 -2 0 2 4 6
Drift (%)
-150
-100
-50
0
50
100
150La
tera
l loa
d (k
N)
FeNCATB with PT cable
-6 -4 -2 0 2 4 6
Drift (%)
-100
-50
0
50
100
Late
ral l
oad
(kN
)
CuAlMn with PT cable

122
the surface of the end plate and column flange, and bolt nut and end plate. The computational time
for this model is considerably less than the top and seat angle connection.
The FE model of end plate connection consists of 6783 key points, 15897 lines, 15896 areas,
3276 volumes, 3650 nodes, and 23703 elements. As shown in Figure 4.31 (a), half of the model
was developed. Prior to applying displacement loading at the top nodes of the column, pretension
forces were applied on the PT tendons and SMA tendons. To create pretension element PSMESH
command was used. The SLOAD command was used to apply the pretension forces on the
specified sections. In case of SMA tendon, pretension amount was selected in such a way that
during displacement loading, the stress on SMA tendon will be lower than its martensitic finishing
stress ( )Mfσ (Xu et al., 2017).

123
Figure 4.31 (a) FE model of end plate connection, (b) end plate, and (c) SMA tendon
4.5.3.2 Selection of SMA and Endplate Thickness
Based on the previous research and available literature, a wide range of superelastic SMA is
now available for various civil engineering applications. SMA with a yield strength (or martensitic
starting stress ( )MSσ ) closer to steel was selected for this specific end plate connection to simulate
the partially restrained connection behavior and to allow the desired gap opening at the beam-
column interface (DesRoches et al., 2010). For the sake of brevity, only one type of the SMA
tendon was considered in this section. Since iron-based SMAs are comparatively cheaper and more
ductile, FeMnAlNi was selected and investigated by using the sensitivity analysis (Table 4.8).
Table 4.8 SMA Properties* SL No Alloy εs E fy fp1 fT1 fT2 References MPa MPa MPa MPa MPa
1 FeMnAlNi 6.13 98400 320.0 442.5 210.8 122.0 (Omori et al., 2011)

124
An end plate can be designed as “thin” or “thick” plate. A thin plate allows plastic deformation
of the plate and therefore, the maximum plastic capacity of beams cannot be achieved by using
this mechanism. Moreover, the detrimental prying action can induce premature bolt fracture. Since
SMA tendons are comparatively weaker in bending and shear, and gap opening behavior is
expected in the beam-column interface, the connection designed with the thick end plate. Varied
geometric configurations can be achieved based on the yield line theory provided on AISC Design
Guide (AISC, 2005). For this study, the adequacy of end plate thickness was calculated based on
the following equations.
1.11 npreq
b yp p
Mt
F Yφ
φ=
(4-10)
,
1 1 1 1 2 ( )2 2p
p i o i fifi fo
where
bY h h h p s
p s p g
= + + − + +
(4-11)
12 ps b g=
(4-12)
Where, treq is the required end plate thickness, Mnp is the moment induced by the bolt rows, yp
is the yield line mechanism parameter, which is given in details in (AISC design guide), Fyp is the
yield strength of the end plate, bp is the end plate width, hi is the distance between compression
flange centerline to the edge of the tension side bolts, Pf0 is the distance between the inside beam
tension flange to the nearest outside bolt row, s is the distance from centerline of the most inside
or outside tension bolt row to the edge of the yield line pattern, g is the gage between bolts. Other
parameters such as hi and pfi were related to the inside bolt row. Since no inside rows were present

125
in this connection, therefore, the value of these parameters was taken as zero. The effect of the end
plate thickness on bolted end-plate connections can be found on (Yam et al., 2015).
4.5.3.3 Sensitivity Analysis
A sensitivity analysis was conducted to understand the cyclic response of the end plate PT
connection. Four potential controlling parameters were considered for the design of experiment
framework. Three of these factors were geometry related such as the end plate length (B), gage
length (C) and bolt diameter (D) and one parameter was the pretension force on the bolt (A) (Figure
4.31(b)-(c)). Table 4.9 presents the parameters along with their high (+1) and low level (-1) values.
The parameter range was selected in such a way that the desired gap opening behavior can be
achieved during the cyclic loading (Figure 4.32). In this study, columns and beams section were
kept constant although connection performance may vary due to the beam sizes (Garlock et al.,
2005; Moradi and Alam, 2017b). Although the SMA bar up to a diameter of 1.5in (38 mm) has
already been used for partially restrained connection by (Ocel et al., 2004) and (DesRoches et al.,
2010), the diameter of the SMA tendon was kept within 1in (25.4 mm). Moreover, the lower
diameter SMA tendon shows superior performance, minimize cost and reduce difficulties in
machining and training of this material (DesRoches et al., 2004).
Table 4.9 Factors and levels considered for factorial analysis Factor Parameter name High (+1) Low (-1) Units
A Pretension on SMA tendon 380/95* 0
kN/mm2
B End Plate length 345 275 mm C Gage length 100 30 mm D Bolt diameter 25.4 12.7 mm
*Pretension forces were calculated based on bolt diameter.

126
The Design-Expert software (DX9, 2015) was used to generate the full factorial design. A full
factorial design with two-level requires 24 (=16) models. Since the computational time for each
model is only 2.5hr, the number of the run was not reduced in this study. Additionally, the main
factor effects and interactions between factors can be captured with the full factorial analysis. A
detailed procedure for a different number of factors and associated techniques to reduce the number
of the run can be found on (Moradi and Alam, 2017b) and (Montgomery, 2017). A total of 16 FE
model were developed and analyzed under cyclic loading. Model parameters and their responses
are presented in Table 4.10 and Table 4.11. The cyclic response quantities include (i) the initial
stiffness (ki), (ii) the post-decompression stiffness (kd), (iii) the residual displacement (Rd), (iv) the
energy dissipation capacity (Ed) and (v) the load capacity of each connection (Fmax).
Table 4.10 Full factorial design (24 = 16 models).
Run Factors
A B C D 1 0 275 30 12.7 2 0 275 30 25.4 3 0 275 100 12.7 4 0 275 100 25.4 5 0 345 30 12.7 6 0 345 30 25.4 7 0 345 100 12.7 8 0 345 100 25.4 9 95 275 30 12.7
10 380 275 30 25.4 11 95 275 100 12.7 12 380 275 100 25.4 13 95 345 30 12.7 14 380 345 30 25.4 15 95 345 100 12.7 16 380 345 100 25.4

127
Table 4.11 Response quantities
Run Response quantities
Fmax (kN) Rd (mm) Ed (kN.m) Ki (kN/m) Kd (kN/m) Mmax (kN.m) 1 232 0.25 21.42 5803 827 424 2 293 8.16 45.18 6723 777 536 3 236 5.82 31.12 6704 737 432 4 256 11.64 51.06 7297 600 468 5 232 1.21 21.42 6885 827 424 6 295 5.82 38.96 6439 841 540 7 240 5.85 25.99 7126 819 439 8 303 11.62 51.71 5918 441 554 9 231 5.82 24.47 6744 747 422 10 295 5.86 63.61 7924 796 540 11 237 5.85 34.88 6915 808 433 12 266 11.71 66.3 7660 516 486 13 233 5.82 24.61 6702 831 427 14 298 5.82 54.58 7487 913 545 15 241 5.82 28.21 7403 822 441 16 305 15.31 71.29 6747 423 558

128
4.5.3.4 2k Factorial Design
The Design-Expert software (DX9, 2015) was used to generate the full factorial design. A full
factorial design with two-level requires 24 (=16) models. Since the computational time for each
model is only 2.5hr, the number of the run was not reduced in this study. Additionally, the main
factor effects and interactions between factors can be captured with the full factorial analysis. A
detailed procedure for a different number of factors and associated techniques to reduce the number
of the run can be found on (Moradi and Alam, 2017b) and (Montgomery, 2017). A total of 16 FE
model were developed and analyzed under cyclic loading. Model parameters and their responses
are presented in Table A.1 and Table A.2. The cyclic response quantities include (i) the initial
stiffness (ki), (ii) the post-decompression stiffness (kd), (iii) the residual displacement (Rd), (iv) the
energy dissipation capacity (Ed) and (v) the load capacity of each connection (Fmax).
The significance of considered parameters on response variables was estimated by using
ANOVA analysis tools of Design-Expert software. ANOVA tests the null hypothesis (H0) of no
significant effect for a factor. Based on the analysis, p-values were calculated for each factor. Since
the significance level was considered as 5%, p-value less than 0.05 indicates the principal factor.
During the initial screening, the main factors and their interactions were selected based on their
percent contribution and p-value (<0.05).

129
Figure 4.32 Gap opening behavior of SMA based end plate connection
4.5.3.5 Initial Stiffness (Ki)
The sensitivity analysis results were investigated in terms of the initial stiffness and post-
decompression stiffness. The initial stiffness of the end plate based PT connection is mostly
governed by the pretension forces (A) in the bolt, the diameter of SMA tendons (D), interaction
between A and D and the interaction between the endplate length and bolt diameter (BD), with
percent contribution of 28%, 4%, 5% and 31%, respectively. All other factor interactions are less
than 4%. However, during the initial screening, unimportant factors based on the p-values were
removed. The initial stiffness response depending on the factor level is shown in Figure 4.33. From
the 3D plot of factor interaction as shown in Figure 4.33 (a), by decreasing the gage length (C)
from 100 to 30 mm, and increasing the pretension force up to 380 MPa, while two other factors
(i.e., end plate length and bolt diameter) were kept at its high-level (+1), the initial stiffness can be
as high as 7500kN/m. The initial stiffness is directly affected by the increasing value of the gage
length (C). This behavior is attributed to the damage in the end plate due to the increased moment
arm for the high value of the gage length.

130
4.5.3.6 Load Capacity (Fmax)
The lateral load capacity of the PT connection was investigated from the output of sensitivity
analysis with Design-Expert software (Figure 4.33 (b)). Based on the percent contribution of main
factors, end plate length (B) and bolt diameter (D) were found to be the most influencing factor.
The interaction between end plate length (B), gage length (C) and bolt diameter (D) was evident
with comparatively less percent contribution. Maximum load capacity can be achieved by
increasing the bolt diameter (D), while gage length (C) should be kept at its high-level value (i.e.,
100 mm). The interaction between factors also exists for load capacity response. Therefore, the
high-level value of end plate length is also desired to achieve maximum response. On the other
hand, the residual displacement may increase due to the long end plate.
4.5.3.7 Energy Dissipation (Ed)
The energy dissipation capacity of the end plate PT connection can be controlled by optimizing
the bolt diameter (D) and pretension on the bolts (A). The only energy dissipating element in this
end plate PT connection is the horizontal SMA tendon. Therefore, the dissipation capacity can be
increased by introducing the higher diameter value of the bolts (i.e., 25.4 mm). The higher amount
of the pretension force (A) is another important factor for dissipating energy. Due to flag shape
hysteresis behavior of SMA, the SMA tendon needs to be stressed up to its martensitic starting
stress (σMS) to increase the energy dissipation capacity which has already been suggested by
(Farmani and Ghassemieh, 2017). The similar behavior observed for the pre-tensioned SMA
tendon (Figure 4.33 (c)). However, the interaction between other factors such as AB, AC, AD, BC,
and ABC indicates that optimum value of other factors is also crucial to obtain the higher energy
dissipation capacity.

131
4.5.3.8 Residual Displacement (Rd)
Gage length (C) and Bolt diameter (D) are the most important affecting parameters for
controlling the response of the residual displacements. From Figure 4.33 (d), it is evident that even
with the high-level value of the bolt diameter (i.e., 25.4 mm), the residual displacement can be
lower, if the gage length value is at its low level (i.e., 30 mm). In addition, interaction CD, ACD,
and BCD appears to be the most important interaction with higher percent contribution. Therefore,
a careful observation should be made on the other parameters such as the pretension force (A), and
end plate length (B). For example, to get minimum residual displacement, a lower diameter of the
bolt and lower gage length can be the best choice, if pretension force is kept at its high value (i.e.,
380MPa) and end plate length at its low value (i.e., 275 mm). The higher value of the end plate
will increase the probability of the damage in the end plate which will lead to higher residual
displacement.
(a) (b)

132
(c) (d)
Figure 4.33 Factor interaction plot (a) initial stiffness, (b) load capacity, (c) energy dissipation,
and (d) residual displacement
A different range of cyclic responses were observed for each connection with the different
combination of parameters. For example, the load-displacement behavior of model 9, 10, 14 and
15 are presented in Figure 4.34. In summary, all the end plate connections with a higher diameter
of SMA tendon dissipate higher energy compared to the lower diameter. Moreover, their load
capacity is also higher. However, the shorter length of the end plate with higher bolt diameter
ensures the full SC capability of the connection. The connection performance is also affected by
the gage length. Lower gage length has a positive effect on the connection response. According to
the response quantities presented in Table 4.11, model 9, 10, 14 and 15 presents optimized
performance regarding the initial stiffness, post-decompression stiffness, residual displacement
and load capacity.
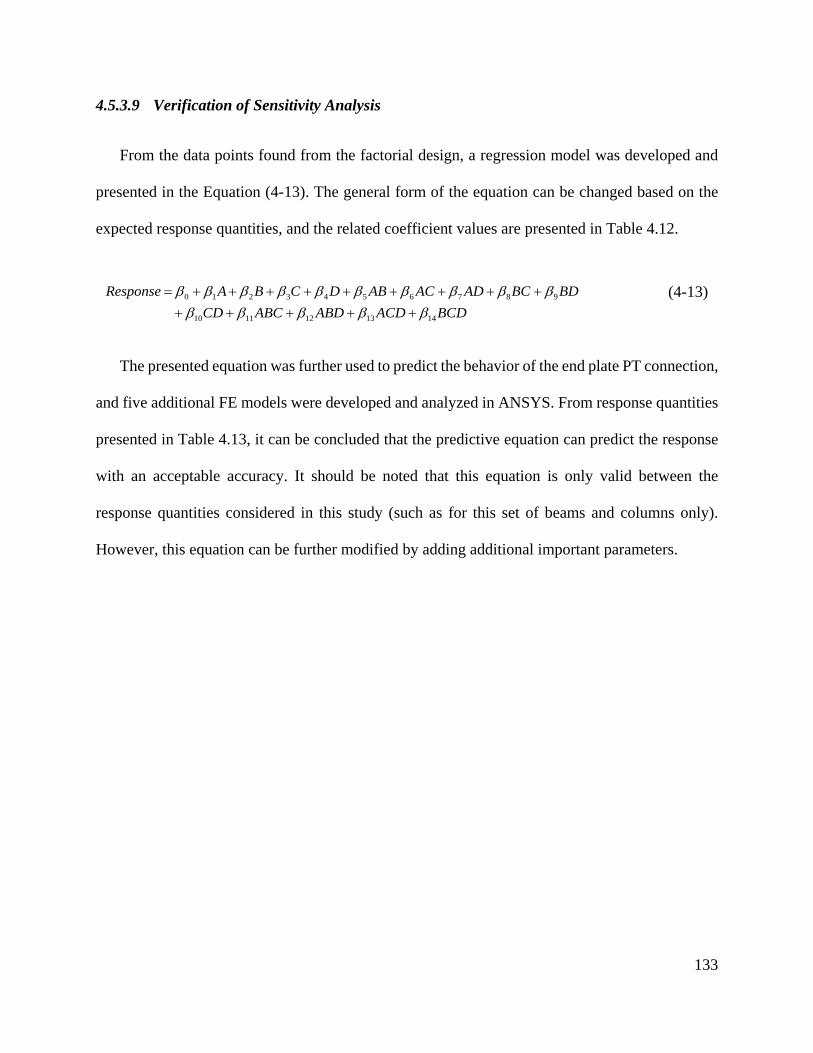
133
4.5.3.9 Verification of Sensitivity Analysis
From the data points found from the factorial design, a regression model was developed and
presented in the Equation (4-13). The general form of the equation can be changed based on the
expected response quantities, and the related coefficient values are presented in Table 4.12.
0 1 2 3 4 5 6 7 8 9
10 11 12 13 14 Response A B C D AB AC AD BC BD
CD ABC ABD ACD BCDβ β β β β β β β β β
β β β β β= + + + + + + + + +
+ + + + + (4-13)
The presented equation was further used to predict the behavior of the end plate PT connection,
and five additional FE models were developed and analyzed in ANSYS. From response quantities
presented in Table 4.13, it can be concluded that the predictive equation can predict the response
with an acceptable accuracy. It should be noted that this equation is only valid between the
response quantities considered in this study (such as for this set of beams and columns only).
However, this equation can be further modified by adding additional important parameters.
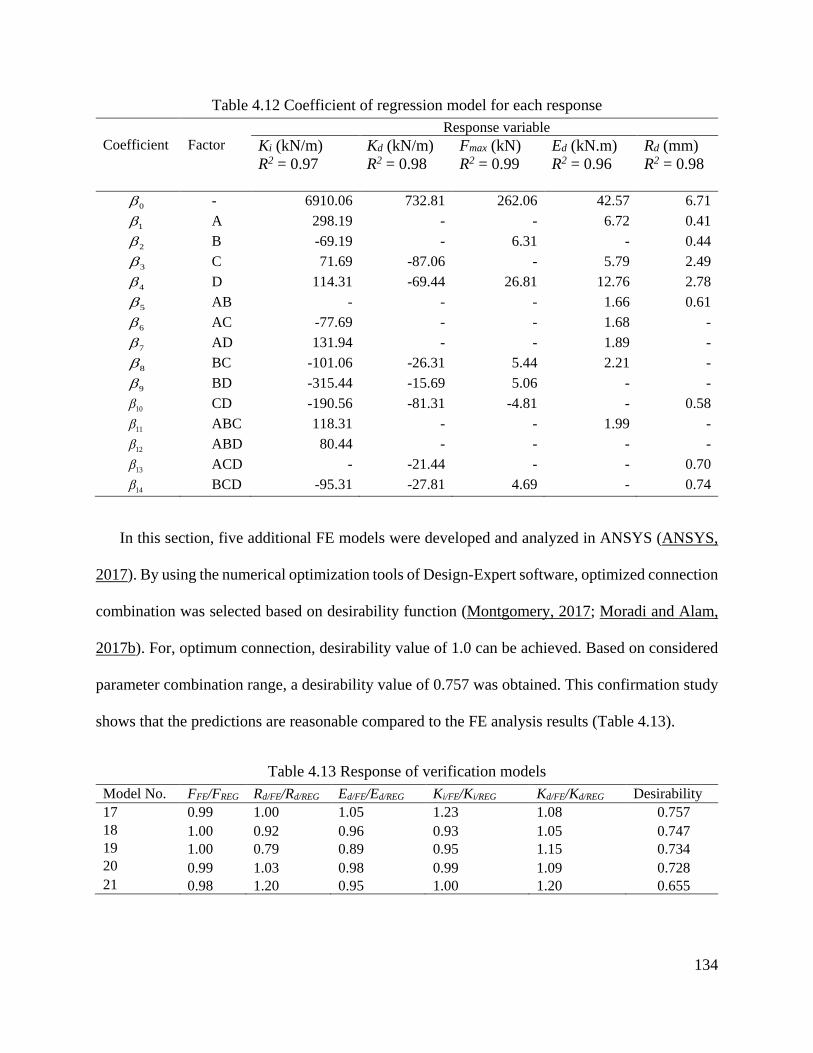
134
Table 4.12 Coefficient of regression model for each response Response variable
Coefficient Factor Ki (kN/m) R2 = 0.97
Kd (kN/m) R2 = 0.98
Fmax (kN) R2 = 0.99
Ed (kN.m) R2 = 0.96
Rd (mm) R2 = 0.98
0β - 6910.06 732.81 262.06 42.57 6.71 1β A 298.19 - - 6.72 0.41 2β B -69.19 - 6.31 - 0.44 3β C 71.69 -87.06 - 5.79 2.49 4β D 114.31 -69.44 26.81 12.76 2.78 5β AB - - - 1.66 0.61 6β AC -77.69 - - 1.68 - 7β AD 131.94 - - 1.89 - 8β BC -101.06 -26.31 5.44 2.21 - 9β BD -315.44 -15.69 5.06 - -
10β CD -190.56 -81.31 -4.81 - 0.58 11β ABC 118.31 - - 1.99 - 12β ABD 80.44 - - - - 13β ACD - -21.44 - - 0.70 14β BCD -95.31 -27.81 4.69 - 0.74
In this section, five additional FE models were developed and analyzed in ANSYS (ANSYS,
2017). By using the numerical optimization tools of Design-Expert software, optimized connection
combination was selected based on desirability function (Montgomery, 2017; Moradi and Alam,
2017b). For, optimum connection, desirability value of 1.0 can be achieved. Based on considered
parameter combination range, a desirability value of 0.757 was obtained. This confirmation study
shows that the predictions are reasonable compared to the FE analysis results (Table 4.13).
Table 4.13 Response of verification models Model No. FFE/FREG Rd/FE/Rd/REG Ed/FE/Ed/REG Ki/FE/Ki/REG Kd/FE/Kd/REG Desirability 17 0.99 1.00 1.05 1.23 1.08 0.757 18 1.00 0.92 0.96 0.93 1.05 0.747 19 1.00 0.79 0.89 0.95 1.15 0.734 20 0.99 1.03 0.98 0.99 1.09 0.728 21 0.98 1.20 0.95 1.00 1.20 0.655
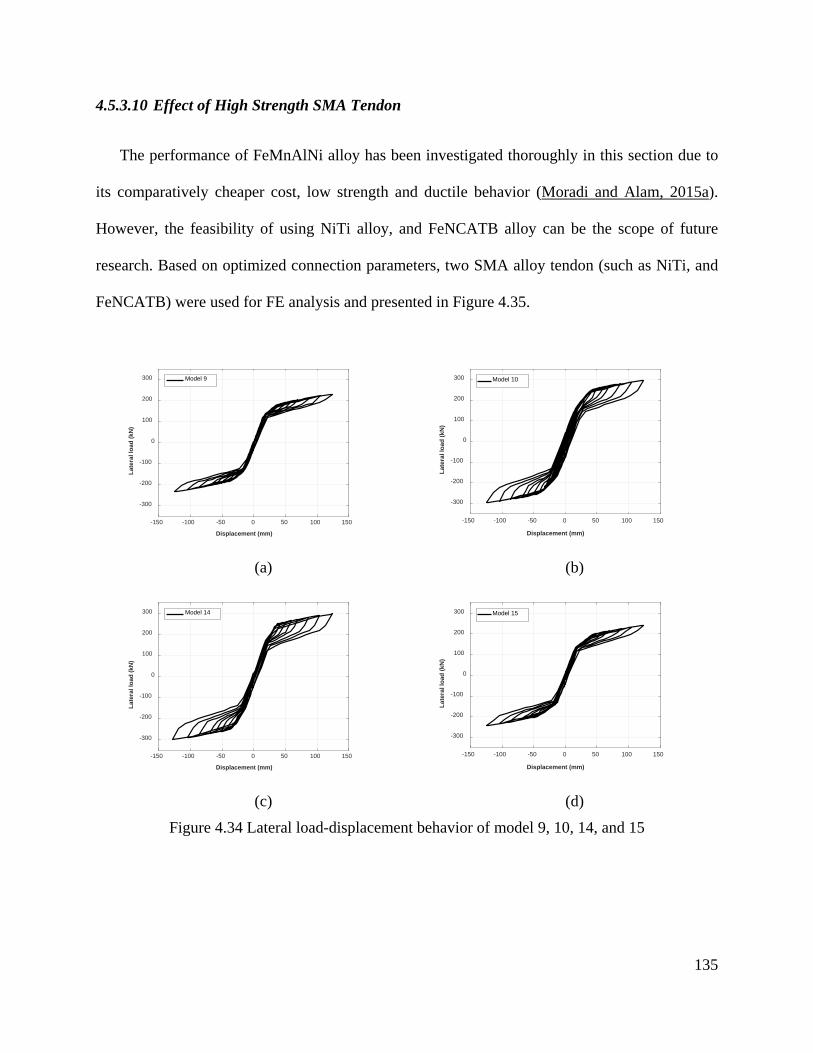
135
4.5.3.10 Effect of High Strength SMA Tendon
The performance of FeMnAlNi alloy has been investigated thoroughly in this section due to
its comparatively cheaper cost, low strength and ductile behavior (Moradi and Alam, 2015a).
However, the feasibility of using NiTi alloy, and FeNCATB alloy can be the scope of future
research. Based on optimized connection parameters, two SMA alloy tendon (such as NiTi, and
FeNCATB) were used for FE analysis and presented in Figure 4.35.
(a) (b)
(c) (d)
Figure 4.34 Lateral load-displacement behavior of model 9, 10, 14, and 15
-150 -100 -50 0 50 100 150
Displacement (mm)
-300
-200
-100
0
100
200
300
Late
ral l
oad
(kN
)
Model 9
-150 -100 -50 0 50 100 150
Displacement (mm)
-300
-200
-100
0
100
200
300
Late
ral l
oad
(kN
)
Model 10
-150 -100 -50 0 50 100 150
Displacement (mm)
-300
-200
-100
0
100
200
300
Late
ral l
oad
(kN
)
Model 14
-150 -100 -50 0 50 100 150
Displacement (mm)
-300
-200
-100
0
100
200
300
Late
ral l
oad
(kN
)
Model 15
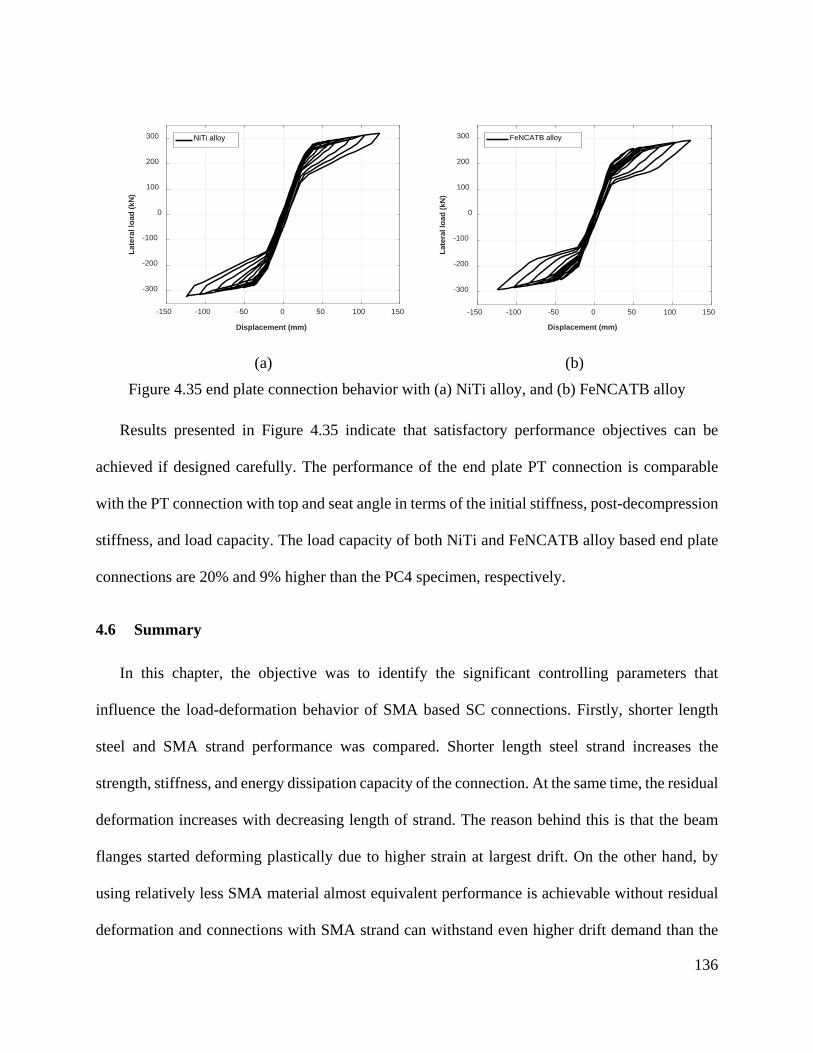
136
(a) (b)
Figure 4.35 end plate connection behavior with (a) NiTi alloy, and (b) FeNCATB alloy
Results presented in Figure 4.35 indicate that satisfactory performance objectives can be
achieved if designed carefully. The performance of the end plate PT connection is comparable
with the PT connection with top and seat angle in terms of the initial stiffness, post-decompression
stiffness, and load capacity. The load capacity of both NiTi and FeNCATB alloy based end plate
connections are 20% and 9% higher than the PC4 specimen, respectively.
4.6 Summary
In this chapter, the objective was to identify the significant controlling parameters that
influence the load-deformation behavior of SMA based SC connections. Firstly, shorter length
steel and SMA strand performance was compared. Shorter length steel strand increases the
strength, stiffness, and energy dissipation capacity of the connection. At the same time, the residual
deformation increases with decreasing length of strand. The reason behind this is that the beam
flanges started deforming plastically due to higher strain at largest drift. On the other hand, by
using relatively less SMA material almost equivalent performance is achievable without residual
deformation and connections with SMA strand can withstand even higher drift demand than the
-150 -100 -50 0 50 100 150
Displacement (mm)
-300
-200
-100
0
100
200
300La
tera
l loa
d (k
N)
NiTi alloy
-150 -100 -50 0 50 100 150
Displacement (mm)
-300
-200
-100
0
100
200
300
Late
ral l
oad
(kN
)
FeNCATB alloy
137
steel strand. Secondly, hybrid strands that is the combination of both steel and SMA strands were
proposed which can further reduce the amount of SMA in the connections. However, further
investigation is required to identify the efficient coupling mechanism. Thirdly, SMA angles instead
of steel angle was used in previously validated connections. The advantage of using SMA angle is
that there will be no residual deformation in any of the structural components after the earthquake.
The SC capability of superelastic SMA will help the connection to re-center which will eventually
decrease the energy dissipation capacity. Lastly, SMA bolt based end plate connections were
investigated for both interior and exterior connections. The proof-of-concept connections proposed
by previous studies were modified for practical application. Based on initial analysis, further
parametric studies were conducted considering four different design parameters.
138
Chapter 5 Summary, Conclusions, and Recommended Future Research
5.1 General
Earthquake engineering is going through an extremely challenging phase. Instead of ensuring
collapse prevention of structures during earthquake, modern society’s expectation is pushing more
to the resilience of structures. Resiliency can be achieved in different ways one of them is to reduce
the residual deformation by using SC structures. The research conducted in this thesis was aimed
at investigating the response of SC PT connection with different energy dissipating element and
techniques.
Chapter 3 described the development of the finite element model for SC PT connection. A
different meshing approach has been used in this study from that used by Moradi and Alam
(2015a). A mesh only element (i.e. MESH200) is used from the element library of ANSYS to have
better control over the mesh density. Eight-noded solid homogenous elements (SOLID 185) are
used for volumes. SOLID185 is generally used for three-dimensional modeling since it has
plasticity, hyperelasticity, stress stiffening, creep, large deflection, and large strain capabilities.
Each solid element is defined with eight nodes having three translational degrees of freedom. The
procedure and options used for developing and validating the models were described briefly.
Second part of this chapter evaluated the significance of adding stiffener on the cyclic response of
PT steel beam-column connections. The validated FE model was modified with stiffener to
conduct the parametric study. The response parameter showed positive response with the
increasing thickness of stiffener. Since, the beam flanges were not designed for additional forces
introduced by the stiffener, large plastic deformation was observed in the beam flanges which

139
prevented the full SC of the connection at large drift. Afterwards, focus was given on angle itself
to optimize the parameters with stiffener. Full factorial analysis was conducted by considering four
different parameters which was followed by an extensive validation study of experimental results.
Chapter 4 can be divided into four different subsections. Each section discussed specific
techniques to introduce SMA materials into the SC systems such as (i) shorter length SMA strand,
(ii) hybrid SMA tendon/strand, (iii) SMA angle, and (iv) SMA based end-plate connection. The
load-deformation response for each technique was presented and discussed briefly.
Chapter 5 presents the findings and conclusions of the research along with some
recommendations for future study.
5.2 Contribution of this Research
The results from this thesis will contribute to the existing knowledge on the SC-PT connections.
The major contribution from this research are summarized as follows:
• Three-dimensional FE model was developed with higher efficiency to capture the SC
behavior of steel beam-column connection.
• The concept of stiffened angle connection was introduced and investigated numerically by
considering different design factors.
• The concept of shorter length SMA strand with different alloys was introduced and
investigated.
• The concept of hybrid strands was introduced to further reduce the amount of SMA
material in SC connections.

140
• The existing SMA based end-plate connection layout was modified for practical
application. The most efficient and practical arrangement was suggested an optimum
combination of the most influencing parameters was determined which result in the most
desirable conditions.
5.3 Conclusions
In this research, the cyclic response of the stiffened angle PT connection has been investigated.
To minimize the damage in replaceable energy dissipating element, SMA angle-based connection
was proposed in the second section of this research. At the concluding section of this research, a
simple SMA based end plate PT connection was proposed and investigated through full factorial
analysis. Crucial factors affecting the response characteristics were determined and optimized. The
following conclusions can be summarized
5.3.1 Development of FE Models and Parametric Study
• By using a trilinear kinematic material model for the angles in the FE analysis, a more
accurate response was achieved compared to a previous study in which a bilinear model
was adopted. This trilinear model could accurately capture the load-deformation
hysteresis, residual deformation, and energy dissipation capacity.
• Stiffened angle will help to dissipate more energy compared to the PT connection with top
and seat angle; if connection component such as bolts, reinforcing plates and beam sections
are designed accordingly. However, the stiffened angles should be replaced immediately
after each major earthquake.

141
• Based on the parametric study, the thickness of the stiffener can directly affect the SC
behavior, initial stiffness, post-decompression stiffness, and energy dissipation capacity.
All the response parameter will increase with increasing thickness of the stiffener including
the residual displacement.
• By increasing the gage length, the higher thickness of stiffener can be used with minimum
or no residual displacement.
• The effect of the added thickness of the reinforcing plate was found to have a negative
effect on the response parameters such as the post-decompression stiffness, maximum load
capacity, and residual displacement. This is due to the higher length of bolt shank to
accommodate additional reinforcing plate thickness.
5.3.2 Application of SMA in SC Connection
• Based on parametric studies, a decrease in the PT strand length by 33% (from 3057 mm
to 1019 mm) resulted in 187% higher post-decompression stiffness, 11% higher energy
dissipation capacity, and 5% higher moment capacity. However, the PT connection with
reduced strand length showed a poor SC behavior under cyclic loading. Shorter length
induces higher stresses in the PT strand and beam flanges, which causes yielding of the
PT strand and plastic deformation of the beam flanges. Hence, length reduction of steel
strand is not a viable alternative.
• By using the design equations proposed herein, the SMA strand can be tuned to achieve a
SC behavior in these connections. However, initial stress or strain in the SMA strand
should be limited, depending on the beam strength, to avoid excessive plastic deformation

142
of the beam flanges. Instead of limiting the post-tensioning forces, beam section capacity
can also be increased according to the demand at the target drift.
• While using SMA strands in the steel beam-column connections, their moment capacity
with NiTi and FeMnAlNi alloys are 29.31% and 32.75% lower than that of the steel strand,
respectively. The percentage of residual strain is also high for these two alloys. Hence,
these alloys are not suitable for PT steel connections.
• Among four different SMAs, CuAlMn and FeNCATB alloys showed superior
performance in terms of initial stiffness, post-decompression stiffness, re-centering
capacity and most importantly, energy dissipation capacity.
• The connection with PT steel strands may lose its SC capability at higher drifts (i.e. 5% or
more). Whereas, the PT connection with shorter length SMA such as FeNCATB and
CuAlMn alloy can re-center at the same amount of drift, indicating a great potential to be
used in PT beam-column connections.
• Increasing the initial stress/strain in the SMA strand results in an increase in the
decompression moment of the connection. However, this causes pre-compressing the
beam flanges with more forces and leads to an increase in the yielded portion of the beam
flanges.
• By using the hybrid strands, the length of the SMA material can be reduced up to 300 mm,
530 mm, and 635 mm for FeNCATB, NiTi, and FeMnAlNi alloy based on the drift
demand, respectively.

143
• SMA angle can solve the issue related to the residual displacement or necessity of
replacement of energy dissipating element. Due to its inherent flag shaped SC behavior,
no residual strain is accumulated on it after load removal. However, the limit states of the
angle bolts such as plasticity index (PI) and rupture index (RI) were significantly higher
for the SMA angle connection compared to the steel top and seat angle connection bolts.
This indicates the higher probability of the plastic strain accumulation and rupture
probability of bolts after a severe earthquake. Therefore, eventually, the steel bolts should
be replaced.
• A simple SMA based end plate connection has been proposed in this study which consists
of the SMA tendon as an energy dissipating element and PT strand as a SC element. The
FE modeling is comparatively simple and computational time requirement is very low. In
case of the proposed connection, no residual deformation exists in any of the structural
components after the load removal.
• Iron-based alloy (FeMnAlNi) has been investigated through full factorial analysis to
capture a wide range of response, considering four important controlling parameters (such
as the gage length, end plate length, bolt diameter and pretension force on the bolts).
• The load capacity of the end plate connection was found to be sensitive to the SMA tendon
diameter and end plate length. However, the end plate thickness should be calculated based
on the SMA tendon diameter and strength. Therefore, the parameters should be carefully
selected for construction purpose.
144
• The initial and post-decompression stiffness of the endplate connections are mostly
influenced by the length of the end plate and pretension force on the SMA tendons. Higher
initial stiffness can be observed for the lower gage length, lower endplate length and higher
pretension force on the SMA tendon.
• The most crucial factors influencing the hysteretic energy dissipation capacity of the end
plate connections are bolt diameter and pretension force on SMA tendons. Energy
dissipation capacity of the connection increases with the increasing diameter of the SMA
tendons and increasing pretension force.
5.4 Recommendation for Future Research
Since SC connections are introduced in this study as an alternative to the welded or bolted
connections, cost issues are indeed of great interest. The connection cost for existing welded or
bolted connection has increased significantly after the Northridge earthquake due to stringent limit
on welding procedure, welding material quality, strict inspection requirement and quality control.
Although within this study, it was not feasible to conduct cost comparison between two systems,
it is possible to conclude intuitively that the total cost can be significantly reduced considering the
fact that existing structure will sustain large residual deformation, which can lead to the demolition
of the total structure after an earthquake.
The amount of energy will be stored in SC connection through energy dissipating element can
pose significant threat or potential hazard if any of those components fail during earthquake.
Previous study suggested that SC element such as PT bar or SMA bar should be stresses up to 80%
of their allowable stress limit before being used in the connection. Since, the specimens with initial
defect will fail immediately; it will increase the reliability of the system. Moreover, strands can be

145
re-tensioned at any stage of its lifetime to ensure sufficient PT force of the strand or cable. The PT
strands should be protected from weathering or developing rust on it over time as it will be exposed
to the environment. In any given circumstances, the structure should be designed to carry gravity
load without PT strand or cable. This will allow serviceability and safe replacement of damaged
element when required.
The most critical section of SC-PT connection is the interface between beams and columns
where the beams are compressed against the columns or shim plates. Based on the amount of post-
tensioning force, the strain on beam flanges can reaches its capacity and lead to excessive plastic
deformation or even beam local buckling. Therefore, further experimental, analytical and
numerical simulation study is required to limit the amount of strain in the beam flanges.
The mechanical properties of SMA wires, bars or tendons are satisfactory for seismic
applications. However, there are still some practical issues related to their implementation. The
previous experimental study, focusing on the performance of large diameter SMA bar or tendon
revealed that gripping or end fixing is one major issue. They concluded that the gripped part of the
wire could be more prone to fracture due to local stress concentration. Ma et al. 2017 proposed the
use of bundled SMA wire instead of individual wire to avoid this failure mode. Alternatively, SMA
bolts/ tendons could be used to offer large load resistance, but it was found that their threaded parts
could be susceptible to fracture. However, this failure mode can be avoided by increasing the local
cross-section of the threaded part (Fang et al., 2014). Fang et al. (2014) used net threaded-to-shank
diameter of 1.02 and 0.97 for the 10 mm and 16 mm diameter bolts. However, Yam et al. (2015)
concluded that a net threaded-to-shank diameter ratio around 1.4 confirms the high ductile
behavior of SMA bolts or tendons by avoiding sudden or brittle fracture.

146
References
AISC. (2005) Seismic provisions for structural steel buildings. Chicago, IL, USA: American Institute of Steel Constrution.
Alam M, Youssef M and Nehdi M. (2007) Utilizing shape memory alloys to enhance the performance and safety of civil infrastructure: a review. Canadian Journal of Civil Engineering 34: 1075-1086.
ANSYS. (2017) ANSYS Multiphysics v18.2. Canonsburg, PA, ANSYS Inc.
Apostolakis G, Dargush GF and Filiatrault A. (2012) Computational framework for automated seismic design of steel frames with self-centering connections. Journal of Computing in Civil Engineering 28: 170-181.
Auricchio F. (2001) A robust integration-algorithm for a finite-strain shape-memory-alloy superelastic model. International Journal of plasticity 17: 971-990.
Bruneau M, Uang C-M and Sabelli SR. (2011) Ductile design of steel structures: McGraw Hill Professional.
Brunesi E, Nascimbene R and Rassati G. (2014) Response of partially-restrained bolted beam-to-column connections under cyclic loads. Journal of Constructional Steel Research 97: 24-38.
Chancellor NB, Eatherton MR, Roke DA, et al. (2014) Self-centering seismic lateral force resisting systems: high performance structures for the city of tomorrow. Buildings 4: 520-548.
Chou CC, Tsai KC and Yang WC. (2009) Self‐centering steel connections with steel bars and a discontinuous composite slab. Earthquake Engineering & Structural Dynamics 38: 403-422.
Chowdhury MA, Rahmzadeh A, Moradi S, et al. (2017) Cyclic behavior of post tensioned steel beam column connections with reduced length strands. 6th International Conference on Engineering Mechanics and Materials. CSCE, Vancouver, BC.
Christopoulos C, Filiatrault A and Folz B. (2002a) Seismic response of self‐centring hysteretic SDOF systems. Earthquake Engineering & Structural Dynamics 31: 1131-1150.
Christopoulos C, Filiatrault A, Uang C-M, et al. (2002b) Posttensioned energy dissipating connections for moment-resisting steel frames. Journal of Structural Engineering 128: 1111-1120.
D’Antimo M, Demonceau J, Latour M, et al. (2017) Experimental investigation of the creep effect on prestressed bolts used in innovative friction connections. Proc. of the Eurosteel 2017 Conference, Sept. 13-15.

147
DesRoches R, McCormick J and Delemont M. (2004) Cyclic properties of superelastic shape memory alloy wires and bars. Journal of Structural Engineering 130: 38-46.
DesRoches R and Smith B. (2004) Shape memory alloys in seismic resistant design and retrofit: a critical review of their potential and limitations. Journal of Earthquake Engineering 8: 415-429.
DesRoches R, Taftali B and Ellingwood BR. (2010) Seismic performance assessment of steel frames with shape memory alloy connections. Part I—analysis and seismic demands. Journal of Earthquake Engineering 14: 471-486.
Dezfuli FH and Alam MS. (2013) Shape memory alloy wire-based smart natural rubber bearing. Smart Materials and Structures 22: 045013.
Dimopoulos AI, Karavasilis TL, Vasdravellis G, et al. (2013) Seismic design, modelling and assessment of self-centering steel frames using post-tensioned connections with web hourglass shape pins. Bulletin of Earthquake Engineering 11: 1797-1816.
DX9. (2015) version 9 [computer software]. Minneapolis: Stat-Ease Inc.
El-Tawil S, Mikesell T and Kunnath SK. (2000) Effect of local details and yield ratio on behavior of FR steel connections. Journal of Structural Engineering 126: 79-87.
Engelhardt MD and Sabol TA. (1998) Reinforcing of steel moment connections with cover plates: benefits and limitations. Engineering structures 20: 510-520.
Faggiano B, Esposto M and Mazzolani F. (2008) Behavioural investigation on a PTED beam-to-column connection based on numerical analyses. Proc., 14th World Conf. on Earthquake Engineering.
Fanaiea N and Monfared MN. (2016) Cyclic behavior of extended end-plate connections with shape memory alloy bolts. Structural Engineering and Mechanics 60: 507-527.
Fang C, Yam MC, Lam AC, et al. (2014) Cyclic performance of extended end-plate connections equipped with shape memory alloy bolts. Journal of Constructional Steel Research 94: 122-136.
Fang C, Yam MC, Lam AC, et al. (2015) Feasibility study of shape memory alloy ring spring systems for self-centring seismic resisting devices. Smart Materials and Structures 24: 075024.
Fang C, Zhou X, Osofero AI, et al. (2016) Superelastic SMA Belleville washers for seismic resisting applications: experimental study and modelling strategy. Smart Materials and Structures 25: 105013.
Farmani MA and Ghassemieh M. (2017) Steel beam-to-column connections equipped with SMA tendons and energy dissipating devices including shear tabs or web hourglass pins. Journal of Constructional Steel Research 135: 30-48.

148
Federal Emergency Management Agency (FEMA). (2000) Recommended seismic evaluation and upgrade criteria for existing welded steel moment-frame buildings: Federal Emergency Management Agency, Washington, D.C.
Garlock M, Li J and Blaisdell ML. (2006) Collector beam interaction with steel self-centering moment frames. Proceedings of the 4th international conference on earthquake engineering. Taipei, Taiwan.
Garlock ME and Li J. (2008) Steel self-centering moment frames with collector beam floor diaphragms. Journal of Constructional Steel Research 64: 526-538.
Garlock MM, Ricles JM and Sause R. (2003) Cyclic load tests and analysis of bolted top-and-seat angle connections. Journal of Structural Engineering 129: 1615-1625.
Garlock MM, Ricles JM and Sause R. (2005) Experimental studies of full-scale posttensioned steel connections. Journal of Structural Engineering 131: 438-448.
Ghassemieh M and Kari A. (2013) Application of Shape Memory Alloys in Seismic Control of Steel Structures. Advances in Materials Science 2: 66-72.
Ghassemieh M, Mostafazadeh M and Sadeh MS. (2012) Seismic control of concrete shear wall using shape memory alloys. Journal of Intelligent Material Systems and Structures 23: 535-543.
Guo T, Song L-L and Zhang G-D. (2015) Numerical simulation and seismic fragility analysis of a self-centering steel MRF with web friction devices. Journal of Earthquake Engineering 19: 731-751.
Guo T, Song L and Zhang G. (2011) Numerical simulation of the seismic behavior of self-centering steel beam-column connections with bottom flange friction devices. Earthquake Engineering and Engineering Vibration 10: 229-238.
Iyama J, Seo C, Ricles J, et al. (2009) Self-centering MRFs with bottom flange friction devices under earthquake loading. Journal of Constructional Steel Research 65: 314-325.
Janke L, Czaderski C, Motavalli M, et al. (2005) Applications of shape memory alloys in civil engineering structures—overview, limits and new ideas. Materials and Structures 38: 578-592.
Kim H-J and Christopoulos C. (2008) Friction damped posttensioned self-centering steel moment-resisting frames. Journal of Structural Engineering 134: 1768-1779.
Li S, Dezfuli FH, Wang J-q, et al. (2017) Longitudinal seismic response control of long-span cable-stayed bridges using shape memory alloy wire-based lead rubber bearings under near-fault records. Journal of Intelligent Material Systems and Structures: 1045389X17721030.
Ma H, Wilkinson T and Cho C. (2007) Feasibility study on a self-centering beam-to-column connection by using the superelastic behavior of SMAs. Smart Materials and Structures 16: 1555.

149
McCormick J, Aburano H, Ikenaga M, et al. (2008) Permissible residual deformation levels for building structures considering both safety and human elements. Proceedings of the 14th world conference on earthquake engineering. 12-17.
Montgomery DC. (2017) Design and analysis of experiments: John Wiley & Sons.
Moradi S and Alam MS. (2015a) Feasibility study of utilizing superelastic shape memory alloy plates in steel beam–column connections for improved seismic performance. Journal of Intelligent Material Systems and Structures 26: 463-475.
Moradi S and Alam MS. (2015b) Finite-element simulation of posttensioned steel connections with bolted angles under cyclic loading. Journal of Structural Engineering 142: 04015075.
Moradi S and Alam MS. (2017a) Lateral Load–Drift Response and Limit States of Posttensioned Steel Beam-Column Connections: Parametric Study. Journal of Structural Engineering 143: 04017044.
Moradi S and Alam MS. (2017b) Multi-criteria optimization of lateral load-drift response of posttensioned steel beam-column connections. Engineering structures 130: 180-197.
Ocel J, DesRoches R, Leon RT, et al. (2004) Steel beam-column connections using shape memory alloys. Journal of Structural Engineering 130: 732-740.
Omori T, Ando K, Okano M, et al. (2011) Superelastic effect in polycrystalline ferrous alloys. Science 333: 68-71.
Ozbulut O and Hurlebaus S. (2010) Neuro-fuzzy modeling of temperature-and strain-rate-dependent behavior of NiTi shape memory alloys for seismic applications. Journal of Intelligent Material Systems and Structures 21: 837-849.
Ozbulut OE, Daghash S and Sherif MM. (2015) Shape memory alloy cables for structural applications. Journal of Materials in Civil Engineering 28: 04015176.
Qiu C-x and Zhu S. (2014) Characterization of cyclic properties of superelastic monocrystalline Cu–Al–Be SMA wires for seismic applications. Construction and Building Materials 72: 219-230.
Rahmzadeh A and Alam MS. (2017) Cyclic Behavior of Post-tensioned Steel Connections with Shape Memory Alloy Angles. 6th International Conference on Engineering Mechanics and Materials. CSCE, Vancouver, BC.
Ricles J, Sause R, Peng S, et al. (2002) Experimental evaluation of earthquake resistant posttensioned steel connections. Journal of Structural Engineering 128: 850-859.
Ricles J, Sause R, Wolski M, et al. (2006) Post-tensioned moment connections with a bottom flange friction device for seismic resistant self-centering steel MRFs. 4th International conference on earthquake engineering.

150
Ricles JM, Sause R, Garlock MM, et al. (2001) Posttensioned seismic-resistant connections for steel frames. Journal of Structural Engineering 127: 113-121.
Rojas P, Ricles J and Sause R. (2005) Seismic performance of post-tensioned steel moment resisting frames with friction devices. Journal of Structural Engineering 131: 529-540.
SAC. (1997) Recommended postearthquake evaluation and repair criteria for welded steel moment-frame buildings. SAC Joint Venture.
Sampath V. (2005) Studies on the effect of grain refinement and thermal processing on shape memory characteristics of Cu–Al–Ni alloys. Smart Materials and Structures 14: S253.
Seo C-Y and Sause R. (2005) Ductility demands on self-centering systems under earthquake loading. ACI Structural Journal 102: 275.
Sgambitterra E, Maletta C and Furgiuele F. (2016) Modeling and simulation of the thermo-mechanical response of NiTi-based Belleville springs. Journal of Intelligent Material Systems and Structures 27: 81-91.
Shen J and Astaneh-Asl A. (2000) Hysteresis model of bolted-angle connections. Journal of Constructional Steel Research 54: 317-343.
Shiravand M and Deylami A. (2010) Application of full depth side plate to moment connection of I-beam to double-I column. Advances in Structural Engineering 13: 1047-1062.
Shiravand M and Mahboubi S. (2016) Behavior of post-tensioned connections with stiffened angles under cyclic loading. Journal of Constructional Steel Research 116: 183-192.
Shrestha KC, Araki Y, Nagae T, et al. (2013) Feasibility of Cu–Al–Mn superelastic alloy bars as reinforcement elements in concrete beams. Smart Materials and Structures 22: 025025.
Speicher MS, DesRoches R and Leon RT. (2011) Experimental results of a NiTi shape memory alloy (SMA)-based recentering beam-column connection. Engineering structures 33: 2448-2457.
Stanton J, Stone WC and Cheok GS. (1997) Hybrid reinforced precast frame for seismic regions. PCI journal 42.
Tanaka Y, Himuro Y, Kainuma R, et al. (2010) Ferrous polycrystalline shape-memory alloy showing huge superelasticity. Science 327: 1488-1490.
Tremblay R and Filiatrault A. (1997) Seismic performance of steel moment resisting frames retrofitted with a locally reduced beam section connection. Canadian Journal of Civil Engineering 24: 78-89.
Tzimas AS, Dimopoulos AI and Karavasilis TL. (2015) EC8-based seismic design and assessment of self-centering post-tensioned steel frames with viscous dampers. Journal of Constructional Steel Research 105: 60-73.

151
Uang C-M, Yu Q-SK, Noel S, et al. (2000) Cyclic testing of steel moment connections rehabilitated with RBS or welded haunch. Journal of Structural Engineering 126: 57-68.
Vasdravellis G, Karavasilis TL and Uy B. (2012) Large-scale experimental validation of steel posttensioned connections with web hourglass pins. Journal of Structural Engineering 139: 1033-1042.
Vasdravellis G, Karavasilis TL and Uy B. (2013) Finite element models and cyclic behavior of self-centering steel post-tensioned connections with web hourglass pins. Engineering structures 52: 1-16.
Vasdravellis G, Karavasilis TL and Uy B. (2014) Design rules, experimental evaluation, and fracture models for high-strength and stainless-steel hourglass shape energy dissipation devices. Journal of Structural Engineering 140: 04014087.
Wang D and Filiatrault A. (2008) Shake table testing of a self-centering post-tensioned steel frame. 14th world conference on earthquake engineering, Beijing.
Wang W, Chan T-M, Shao H, et al. (2015) Cyclic behavior of connections equipped with NiTi shape memory alloy and steel tendons between H-shaped beam to CHS column. Engineering structures 88: 37-50.
Wang W, Fang C and Liu J. (2016) Large size superelastic SMA bars: heat treatment strategy, mechanical property and seismic application. Smart Materials and Structures 25: 075001.
Wang W, Fang C, Yang X, et al. (2017) Innovative use of a shape memory alloy ring spring system for self-centering connections. Engineering structures 153: 503-515.
Wolski M, Ricles JM and Sause R. (2009) Experimental study of a self-centering beam–column connection with bottom flange friction device. Journal of Structural Engineering 135: 479-488.
Xu X, Zhang Y and Luo Y. (2016) Self-centering modularized link beams with post-tensioned shape memory alloy rods. Engineering structures 112: 47-59.
Xu X, Zheng Y and Luo Y. (2017) Self-centering links using post-tensioned composite tendons. Advances in Structural Engineering: 1369433217742523.
Yam MC, Fang C, Lam AC, et al. (2015) Numerical study and practical design of beam-to-column connections with shape memory alloys. Journal of Constructional Steel Research 104: 177-192.
Yoon SH and Yeo DJ. (2008) Experimental Investigation of Thermo-Mechanical Behaviors in Ni—Ti Shape Memory Alloy. Journal of Intelligent Material Systems and Structures 19: 283-289.
Youssef NF, Bonowitz D and Gross JL. (1995) A survey of steel moment-resisting frame buildings affected by the 1994 Northridge earthquake: US National Institute of Standards and Technology.

152
Zhu S and Qiu C-X. (2014) Incremental dynamic analysis of highway bridges with novel shape memory alloy isolators. Advances in Structural Engineering 17: 429-438.