cyclotron harmonic lines in the thermal magnetic ...cyclotron harmonic lines in the thermal magnetic...
TRANSCRIPT

Cyclotron harmonic lines in the thermal magnetic fluctuation spectrum of spiraling electrons in plasmas
R. L. Stenzel and G. Golubyatnikova) Department of Physics, University of California, Los Angeles, California 90024-1547
(Received 3 May 1993; accepted 24 June 1993)
Radio frequency (rf) magnetic fluctuations g have been measured with loop antennas in a large pulsed discharge plasma column (n,* < lo’* cme3, kT,S 3 eV, Be-20 G, Ar, 2~ 10m4 Torr, 1 m diamX2.5 m length). A l/f-like noise spectrum is observed in the whistler wave regime ( t3,1’2C0,j1’2 < w <w,) both in the Maxwellian afterglow plasma and in the active discharge which contains energetic (45 eV) electrons. Discrete emission lines at the electron cyclotron frequency and its harmonics are found only in the presence of spiraling energetic electrons. These are naturally present in the active discharge but have also been injected as a controlled oblique electron beam into the Maxwellian afterglo_w plasma. In the latter case up to 15 cyclotron harmonic lines with weak amplitude decay B,(w) are generated in the beam flux tube. From two-point correlation measurements it is shown that the line spectrum is due to ballistic beam modes rather than plasma eigenmodes driven unstable by the beam. The lines evolve from broadband thermal current fluctuations of the beam through a filtering effect. Those fluctuations which rotate synchronously with the ordered cyclotron motion (o = nw,) constructively interfere ( kll =0) and produce coherent solenoidal rf fields, while others interfere destructively. Axial and azimuthal phase velocity measurements for if-modulated beams clearly demonstrate the filtering effect. In the present parameter regime (w+w,.) the fluctuations are evanescent and localized near the electron flux tube ( rcw > c/w,). In low density plasmas the fluctuations may couple to propagating electromagnetic waves and be observable externally as in earlier observations by Landauer or Ikegami.
I. INTRODUCTION
Fluctuation and radiation processes are topics of fun- damental interest in plasma physics which have been treated in many textbooks.1-4 Several physical processes can give rise to emissions such as single-particle cyclotron/ synchrotron radiation, particle collisions resulting in bremsstrahlung, and many collective plasma processes leading to instabilities. The interpretation of observed emission spectra requires both the knowledge of the exci- tation mechanism and of the wave propagation through plasmas. Useful applications of emission measurements in- clude remote temperature diagnostics in hot fusion plasmas’ or distant solar plasmas.6
The present work deals with fluctuation processes near the electron cyclotron frequency and its harmonics in an overdense plasma ( wp$ w 2 w,) .’ Cyclotron harmonic emissions from non-Maxwellian plasmas are known since the 1960s when Landauer’ observed lines up to w =40 w, in a Penning-type discharge. The latter contains energetic electrons at high-pitch angles which, similar to spiraling electron beams,’ are thought to destabilize electrostatic cy- clotron harmonic waves.” Mode conversion in small non- uniform plasmas can explain the externally observed elec- tromagnetic radiation. Alternate explanations involving noncircular particle orbits” and excitation of localized res- onance layers’* have also been proposed but not tested due to lack of in situ diagnostics. In the present experiment all
‘IPermanent address: Institute of Applied Physics, Nizhny Novgorod, 603600 Russia.
fluctuation measurements are performed inside a large uni- form magnetoplasma.’ It is shown that spiraling electrons do produce copious cyclotron harmonic lines by a mecha- nism which is entirely different from the previously postu- lated ones. The electromagnetic signals are detected with a shielded loop antenna in the beam flux tube. No instability of a plasma eigenmode is involved and the signal is due to random broadband current fluctuations of the beam. A line spectrum evolves because of a spatial interference or filter- ing effect by the ordered cyclotron motion: Those fre- quency components in the broadband spectrum which are synchronous with the electron rotation (w = no,) produce a magnetic perturbation which is identical from orbit to orbit ( kll =O). The result is a constructive interference which produces a long solenoidal rf field as in a helical wire-wound coil. Off-resonant frequencies, however, gener- ate a phase shift (lead or lag) between adjacent orbits b=no,+k1, -q 1 which can result in opposing dipole moments, i.e., destructive interference. These processes are clearly demonstrated by modulating the beam current and performing three-dimensional (3-D) spatial interferome- try.
The present fluctuation studies show the importance of considering the source function (ballistic particle currents ) in addition to the plasma dielectric response (cyclotron harmonic eigenmodes) for determining a noise spectrum. Here the observed line spectrum is dominated by particles while electromagnetic waves are evanescent. The fluctuat- ing fields are only observable in situ but not remotely. Use- ful applications could include precise ( f 0.1% ) dc mag- netic field measurements in finite-beta plasmas
3789 Phys. Fluids B 5 (lo), October 1993 0899-8221/93/5(10)/3789/9/$6.00 @ 1993 American Institute of Physics 3789

; Pi ASMA COLUMN
1 ,,! . . . . . . . . . . . . . . . . . . . ..* . . ..-..___. _ ..-. ___ ___. _ -.-. _ ---... I __.-____
. - _ . , I
K$ - I ev D = 1.3~10~~ Twr Ar ; ’ ,
i 5,=tOG I -
SPIRAL LlNG ELECTRON BEAM I
1: \ >tm dmm MAGNETK
CATHODE ANTENNA
.; ,GR,*DED . .._ ._....._.. LANGMUIR pRo*E . . ..-.-_ ._f. . . ..^...
! ANODE
LOOP
. _.
5m
t I
AMPLIFIER
FIG. 1. Experimental arrangement for measur ing magnet ic f luctuations in a discharge and afterglow plasma with or without a spiraling electron beam.
[P=nkT/(B2/2,uo) = 1 p asma pressure/magnetic pressure]. O ther areas of relevance could include scintillations of high-frequency signals (~+,e) by magnetic fluctuations,‘4 antenna impedance measurements,15 and energy transport from beam to background electrons via cyclotron heating.
After describing in Sec. II the experimental setup and measurement techniques the observations of noise spectra and correlations in a discharge plasma and in an afterglow plasma with injected electron beam will be presented and discussed in Sec. III. The conclusion, Sec. IV, points out the relevance of the observation to various applications and its relation to earlier work.
II. EXPERIMENTAL ARRANGEMENT
The experiments are performed in a large plasma de- vice shown schematically in F ig. 1. W ith a 1 m diam oxide- coated cathodeI a uniformly magnet ized ( Be~20 G) lin- ear p lasma column ( 1 m diam, 2.5 m length) is produced in argon (p- 1.3 X low4 Torr) by a repetitively pulsed dc discharge (trep=l set, tP--5 msec, ti,s lOi cme3, kT,S3 eV, Vdis ,45 V, Idis’! 600 A). Magnetic noise measure- ments are performed under two conditions: (i) during the active discharge when the cyclotron harmonic lines are produced by a small populat ion of energetic primary elec- trons (n/n,- 14 0, $uPzc:eVdis-445 eV); (ii) during the afterglow ( to - - 1 msec) when all primary electrons have been lost (At-25 psec) and a controlled electron beam ( Vb< 100 V, I,< 100 mA, ndn,< l%, radius r-4 m m , pitch angle 0 < 6, < 90”, pulse length tPti 5 psec) is injected into the Maxwell ian background plasma [Y,~-’ 5 1 psec, n/(dn/dt) 2 1 msec, T$(dTJdt) <, 1 msec]. The beam Current can also be modu lated with broadband rf (0 to 400 MHz) or monochromatic rf signals.
F luctuations in the magnetic field (I&]} Bo,fi,J Be) are detected with an insulated, electrostatically shielded, balanced loop antenna (2.3 cm ma jor radius, 1.3 m m m i- nor radius, 1 m m azimuthal break in copper shield). The single turn loop antenna is symmetrically connected via two 25 s2 coaxial lines (0.5 m m diam) and a balanced 50
SINGLE TRACE FLUCTUATION f=2& =S&MHz
1 GATE PULSE 1
ENSEMBLE AVERAGE
1 f L f
TIME t (100nsec/div)
FIG. 2. Measurement technique of condit ional averaging of random fluc- tuations using a dual channel digital osci l loscope with “smart” triggering capability. The gate pulse (top trace) def ines a time window during which the magnet ic f luctuations B,(t) are to be anaIyzed. The osci l loscope trig- gers when (i) the gate pulse exceeds a given threshold and (ii) the fluc- tuation exceeds a chosen trigger level (dashed line). Note that the trigger point can fall anywhere within the gate pulse. By forming an ensemble average over N repeated discharge pulses the wave train (B,(t)) (bottom trace) is obtained which reflects the temporal coherence (At- 500 nsec) of the magnet ic fluctuation, here determined by the receiver bandwidth. By averaging in a second channel the fluctuations from a movable probe the spatial coherence propert ies are obtained as in two-point correlation measurements.
St broadband transformer ( 1 to 500 MHz) to a low noise broadband amp lifier (NF= 1.4 dB, f= 1 to 500 MHz, 30 dB gain) followed by a dual digital oscil loscope (LeCroy 7200, 1 Cs/sec, 400 MHz, 8 bit). The latter is used to obtain spectra [fast Fourier transform (FFT)], cross cor- relations between signals from two identical movable an- tennas, and ensemble averages over repeated discha_rge pulses. The frequency response of the antennas, V,,JB vs o, has both been calibrated with a Helmholtz coil, the result-of which agrees well with the circuit analysis V,,,/B=R/(R’+W~L’)‘/~~~~W where t=0.25 PH is the antenna inductance, R= 50 fi is the load resistance, and 1~12 E 16 cm* is the loop area.
On-l ine conditional averaging” is emp loyed making use of the “smart” triggering feature of digital oscillo- scopes. The latter allows one to impose two condit ions in order to trigger the oscil loscope, e.g., (i) a positive gate pulse used to define the time interval for possible data collection and (ii) the signal level to exceed a specified threshold. A typical example is shown in F ig. 2 where the 0.2 psec, gate pulse (top trace) is chosen in the m iddle of the 5 ,usec beam pulse and the signal (middle trace) is the magnetic field fluctuation B,(t) at w=2 w, selected with a tuned narrow-band ( Af e-2 M IIz) amp lifier. Whenever the signal exceeds the trigger level (dashed line) wit/& the
3790 Phys. Fluids 5, Vol. 5, No. IO, October 1993 Ft. L. Stenzel and G. Golubyatnikov 3790

Argon Discharge p = 2xld Torr
o t I’ kT,=3 ev /I
-L 1 0 50 100 150 200
FREQUENCY f (MHz)
FIG. 3. Magnetic fluctuation spectrum (z,(o)), obtained by fast Fourier transformation (FFT) and ensemble averaging, in an active discharge plasma which contains energetic electron tails (see Langmuir probe trace in insert). Discrete emission lines at the cyclotron frequency and its har- monics are superimposed on a thermal noise spectrum which is enhanced in the whistler wave range (f<f,) over that in the evanescent regime (f, < f<f,- 3ooO MHz). The cyclotron lines are produced by spiraling energetic electrons which decay rapidly in the afterglow.
gate pulse the oscilloscope stores the waveform defin- ing t=O at the moment of triggering. By repeating the experiment a simple ensemble average (B,(t) ) = ( l/N) 8z t Bzi( t) (bottom trace) can be formed. Using two oscilloscope channels and multiplying two antenna sig- nals the cross-spectral properties of the turbulence are ob- tained, e.g., ( BzlBrz) versus antenna separation Ar and delay time r. Such measurements yield the spatial and tem- poral coherence of the fluctuations, e.g., phase and group velocities for propagating perturbations. Furthermore, by triggering from one cyclotron line, e.g., B,(3w,), and av- eraging a second line, e.g., B,( 2w,), the coherence between different cyclotron harmonics has been found to be small, excluding nonlinear wave-wave interactions as a harmonic generating mechanism.
III. EXPERIMENTAL RESULTS
A. Fluctuations during discharge
The present investigation was motivated by explaining the observed cyclotron harmonic lines in the noise spec- trum of a magnetic loop antenna (Fig. 3) immersed in a discharge plasma. Since the lines rapidly disappear in the afterglow (At 5 25 psec) whereas the thermal noise in the whistler wave regime13 (C&W,) decays slowly proportional to the bulk electron temperature [TJ(dTJdt) 6 1 msec] the line emission is evidently produced by the energetic primary electrons. These electrons are emitted from the cathode, accelerated predominantly along B, in the cath- ode sheath ($ruieeVdis-45 eV), produce within Ax5 lOil,l =lOudfP~ 1.5 cm a strong beam-plasma instability” which scatters them in velocity space,19 and are observed in the plasma volume as energetic tails on Langmuir probe traces (see insert of Fig. 3). They must
RADIAL POSITION r (cm)
(wylz) &z+Ar) >
Ar DISCHARGE 2x IO-’ Torr
I 1 I 0 5 10 I
AXIAL POSITION AZ (cm)
FIG. 4. Spatial profiles for amplitudes and cross correlations of magnetic fluctuations at the cyclotron frequency. (a) Radial profiles showing nearly isotropic noise but short radial coherence length (Ar=4 cm). (b) Axial profiles showing both a large correlation length and a long gradient scale length for the fluctuation amplitudes.
have perpendicular velocity components in order to excite cyclotron emissions. However, the emission is not the clas- sical cyclotron radiation from nonrelativistic electrons* whose line intensities drop as /3*= (u/c)* < 10e4 with in- creasing harmonic number and whose derivation assumes a tenuous plasma (e+(o).
In order to investigate the possibility of wave excita- tion by the spiraling tail electrons both correlation and polarization measurements have been performed. Figure 4(_a) shows a comparison of the radial amplitude profile <&9> _ with the radial cross-correlation function ( ByI (0) B,,z(r)) for the fundamental cyclotron line. While the fluctuations have a broad amplitude profile similar to the plasma parameters they correlate only over short dis- tances Ar- 2c/w,,- 3 cm across B, without exhibiting any wavelengths. Along the magnetic field, Fig. 4(b) shows a much larger correlation length Az > 15 cm which, in con- trast to whistler magnetic fluctuations,i3 is nonoscillatory. The amplitudes and correlation properties are similar for dEerent components of the fluctuating magnetic field ( B,,l B,, B,ll B,) obtained by varying the loop angle as indicated in the spectra of Fig. 5.
The only relevant eigenmodes are ordinary (El1 B,) and extraordinary (El1 B,) electromagnetic cyclotron har- monic waves*’ since conversion of electrostatic waves can be excluded in a uniform plasma. However, in a low-beta plasma p=nkT/( B2/2po) 60.1 for n = 10” cmm3, kTp-2 eV, BZ 10 G] these modes exist for k, p&l and kll =0 only in narrow bands below the cyclotron harmon-
3791 Phys. Fluids B, Vol. 5, No. 10, October 1993 R. L. Stenzel and G. Golubyatnikov 3791

Ar DISCHARGE PLASMA 2x IO4 Torr
1 50 v
FREQUENCY f (MHz)
FIG. 5. Polarization properties of the magnetic fluctuations g(a)). The fluctuation amplitudes in the parallel (&I[ Bs) and perpendicular (B,J Br,) components are comparable.
its (o <, nw,) hence cannot account for the wide, symmet- ric lines observed. Likewise, the nonoscillatory radial cross-spectral function is inconsistent with propagating cy- clotron harmonic waves.
Since the fluctuations do not exhibit the characteristics of collective eigenmodes they must arise directly from the noise source, i.e., the randomly moving electrons. In the discharge plasma the energetic electrons have a significant spread in energy and pitch angle which cannot be easily varied without affecting the bulk plasma parameters. Thus, the emission process is studied in a controlled experiment where electrons of known density, energy, and pitch angle are injected as a thin spiraling beam into a Maxwellian afterglow plasma.
B. Fluctuations from spiraling test particles
Figure 6-shows the spectrum of axial magnetic field fluctuations B,(o) when the loop antenna is located in the flux tube of a spiraling electron beam of indicated param- eters. Up to 15 cyclotron harmonic lines are observed in addition to enhanced broadband noise in the whistler wave regime. The first ten lines are of comparable amplitudes while the higher harmonics which approach the system bandwidth (400 MHz) decrease by - 50% ( -6 dB). There is also little increase in linewidth with increasing harmonic number ( Af = 3. + -5 MHz full width at - 3 dB) such that the Q values of the lines increase with n (e.g., Q= f/Af z 100 at n= f/f,= 10). This feature excludes magnetic field gradients as a line-broadening mechanism ( Af #nAfc). All lines are fully resolved by the narrow effective bandwidth of the digital oscilloscope (A f ret u 0.35 MHz).
By plotting in Fig. 7 the observed line frequencies f versus harmonic number n one finds a highly linear rela- tionship (f=nf ,). Calculating the slope from a least-
I f/f, = 1 , i -1.4x IO-?6
fc = 30MHz fp = 2800 MHz Vb = 100 v
dz= 15cm
I I I 1 100 200 300 100 5
FREQUENCY f (MHz) 1
FIG. 6. Magnetic fluctuation spectrum i,(o) in the flux tube of a spi- raling electron beam injected into a Maxwellian afterglow plasma (t,=2.5 msec). Up to 15 cyclotron harmonic lines are observable in addition to broadband whistler noise (0 S f < f,) .
square fit one finds the cyclotron frequency with high ac- curacy (uncertainty < 0.1%) as demonstrated for different magnetic fields. Thus, the emission measurements offer a useful diagnostic tool for obtaining in situ magnetic tieIds with high time resolution (t 5 1 psec).
f
(MHz) LEAST -SQUARE N
300
0 0 2 4 6 8 10 12
CYCLOTRON HARMONIC NUMBER
FIG. 7. Center frequency of emission lines vs cyclotron harmonic number for different magnetic fields showing a high linearity, f=nfe. From a least-square fit the dc magnetic field (Be = slope) is obtained to within < 0.1% error.
3792 Phys. Fluids B, Vol. 5, No. 10, October 1993 I?. L. Stenzel and G. Golubyatnikov 3792

0 50 100 150 200 FREQUENCY f (MHz)
FIG. 8. Fluctuation spectra i,(o) for different beam pitch angles 0,. No cyclotron lines are generated by field-aligned beams (&=O), many nar- row lines are observed at high-pitch angles (19~~90’), and vanishing lines but strong whistler noise are found in the flux tube opposite to the beam propagation ( eb > 90’).
Figure 8 shows the dependence of the fluctuation spec- tra B,(w) on pitch angle of the injected electron beam. Broadband, l/f-like noise is observed for field-aligned beams ( eb=O) while at high-pitch angles ( 6b=900) many narrow cyclotron harmonic lines are generated. Whistler wave noise propagates both along and opposite to the par- allel beam velocity but the cyclotron lines are negligibly small on the back side of the beam cathode. The latter aspect indicates again that the lines are created directly by the beam electrons rather than transported by plasma eigenmodes as in the case of whistler band noise.
While Fig. 8 shoTed-fluctuation spectra at a fixed an- tenna polarizatio_n (B= B,) for various beam pitch angles, Fig. 9 displays B(,) at a fixed pitch angle ( ebE800) for different antenna polarization a_ngles 6,,. Cyc@ron har- monic lines are seen both in B, ( 11 Ba)-and B,, (1 Ba) implying that the perturbed field lines B spiral and are simply produced by the spiraling electron current. For the lower harmonics (n = 1,2,3) the high-pitch-angle beam Eoduc_es predominantly a solenoidal B, component while BI > B,, for high harmonics (n ~-6. * * 10). By filtering a particular line with a tuned-amplifier one can also check the phase of the fluctuation B(,) at different antenna angles. Figure 9 (insert) confirms that the second harmonic field is highly field aligned and properly reverses sign for a 180“ rotation of the antenna which has a negligible electric di- pole moment.
I I n 1 I I
0 100 200 300 400 500 FREQUENCY f (MHz)
FIG. 9. Polarization of the magnetic flktuations G(o) at a fixed beam pitch angle (t& 80”). While the fundamental and second harmonic fields are polarized along B, the higher harmonics exhibit EL 2 Bl, . The insert shows that the phase of the fluctuation at 0=2w, reverses with antenna rotation by &,,,,= 180”, as expected for a magnetic antenna with a negli- gible electric dipole moment.
In addition to the pitch angle, the beam energy and density can be varied without significantly affecting the background plasma parameters. Qualitatively similar line spectra are observed for an order of magnitude variation in beam voltage (3< Vb< 100 V) and current (10<1,< 100 mA) . The fluctuation amplitude depends linearly on beam current, as demonstrated in Fig. 10. This result excludes the possibility that the lines are produced by an absolute instability which usually exhibits threshold and saturation effects.”
In order to check the possibility of a convective insta- bility the fluctuation spectrum is measured at different ax-
5X 5X I I 1 1
167 167 B, = IOG B, = IOG
0 25 50 75 100 B E A M CURRENT Ib ImA)
FIG. 10. Fluctuation amplitude (&) for the first three cyclotron har- monics vs dc beam current, Zb. The linear relationship indicates the ab- sence of an instability leading to the line emissions.
3793 Phys. Fluids B, Vol. 5, No. 10, October 1993 R. L. Stenzel and G. Golubyatnikov 3793

-95 I 5=13G
-90 Lp9ov -
<s;>
.l (a) PHASE FRY
Y I- vb==“” \? /
km
FREQUENCY f (MHz)
FIG. 11. Magnetic fluctuation spectra (g,(w)) at the beam source (z=O, top trace) and at an axial distance of z= 15 cm from the source (bottom trace). The line spectrum evolves from a broadband spectrum via a fil- tering process rather than a convective instability.
ial distances from the beam injection point. Figure 11 shows that near the injection point the fluctuations B,(w) exhibit a broadband spectrum which, within Az= 15 cm from the source, evolves into a line spectrum. The peak amplitudes at nw, exhibit no growth while the fluctuation level between cyclotron harmonics is greatly suppressed, implying a filtering process rather than an instability mech- anism.
By varying the ante_nna position across B, the radial amplitude profiles for B,(r), shown in Fig. 12, are ob- tained. At the fundamental (w=o,) the fluctuation ampli- tude maximizes in the beam flux tube similar to the sole- noidal field of a coil formed by the spiraling beam ( -3.5 cm diam). At the second harmonic (w=2w,) an ampli- tude minimum is-observed on axis where two opposing solenoidal fields B, cancel.
Using two identical antennas cross-spectral measure- ments have been performed which yield phase information. Figure 13(a) shows contours of constant phase #(X,YI for the magnetic fluctuations B, at the second harmonic. The
I ’ 1 1 I 1 I 1
W=Wc B, = flG I
_yHX , 019 El-:;--33 -12 -8 -4 0 4 8 12
RADiAL POSITKIN x (cm)
FIG. 12. Radial amplitude protile (&x,y=O)) for fluctuations at the fundamental and second cyclotron harmonic line. At w=w, the field is confined to the flux tube of the beam (see sketch of orbit) while at 0=2w, the field has two off-axial maxima. Note that the profiles are broadened due to the convolution with the antenna response (4.5 cm diam).
-6r j.450’ 360° 2?0°
* %S
TIME t /lOOns/divl
FIG. 13. Phase and group velocity measurements for the magnetic fluc- tuations (B,} of the second cyclotron harmonic line. (a) Two- dimensional phase fronts $(x,y) forming radial lines which rigidly coro- tate with the spiraling electrons (see sketch of beam orbit I Bc). The azimuthal mode numberLs h&‘2n=w/w,=2. (b) Conditionally averaged magnetic fluctuations (B,(r)) at different axial antenna separations hz within the beam flux tube (x=y=O). The envelope of the wave packet propagates with a group velocity corresponding to the parallel beam ve- locity (u,=lq ) while the phases exhibit no axial delay ( vphil = w/k,, = 00, k,, =O). Note weak axial decay of amplitude or co- herence [compare to Fig. 4(b)].
phase fronts are observed to be radial, the phase increases azimuthally in the same direction as the spiraling electrons, and the angular velocity o = d#/dt = &r/2 T, = w, is that of the electrons. Thus, the magnetic perturbation is a ballistic signal, i.e., a perturbation in the beam current. Figure 13(b) shows axial phase measurements, i.e., (B,(t)) at different distances Az from a fixed reference antenna used to trigger the oscilloscope. The temporal coherence of the “wave packet” is determined by the bandwidth of the tuned amplifier used to select the second harmonic fluctu- ations for the trigger signal. One observes a slow propaga- tion of the envelope at a group velocity usi1 = 1.4X 1Q8 cm/ set corresponding to the parallel beam velocity (ublr =v,cos@,=3.3x10⁸xcos65”=1.4x10⁸ cmhec, l&,1 = 5 eV). The phase of the oscillations does not change with axial position, i.e., uphi = 00 or kll =O. Like- wise, the fluctuation amplitudes are nearly constant along the beam flux tube. Similar results are also obtained at the fundamental cyclotron frequency. A possible mode exhib- iting a finite parallel group velocity but infinite phase ve- locity is the ballistic beam mode, ti---nw,= kit ~11
3794 Phys. Fluids 8, Vol. 5, No. 10, October 1993 R. L. Stenzel and G. Golubyatnikov 3794
+&P (lOdB/
divl
0 100 200 300 LOO 500 FREQUENCY f (MHz)
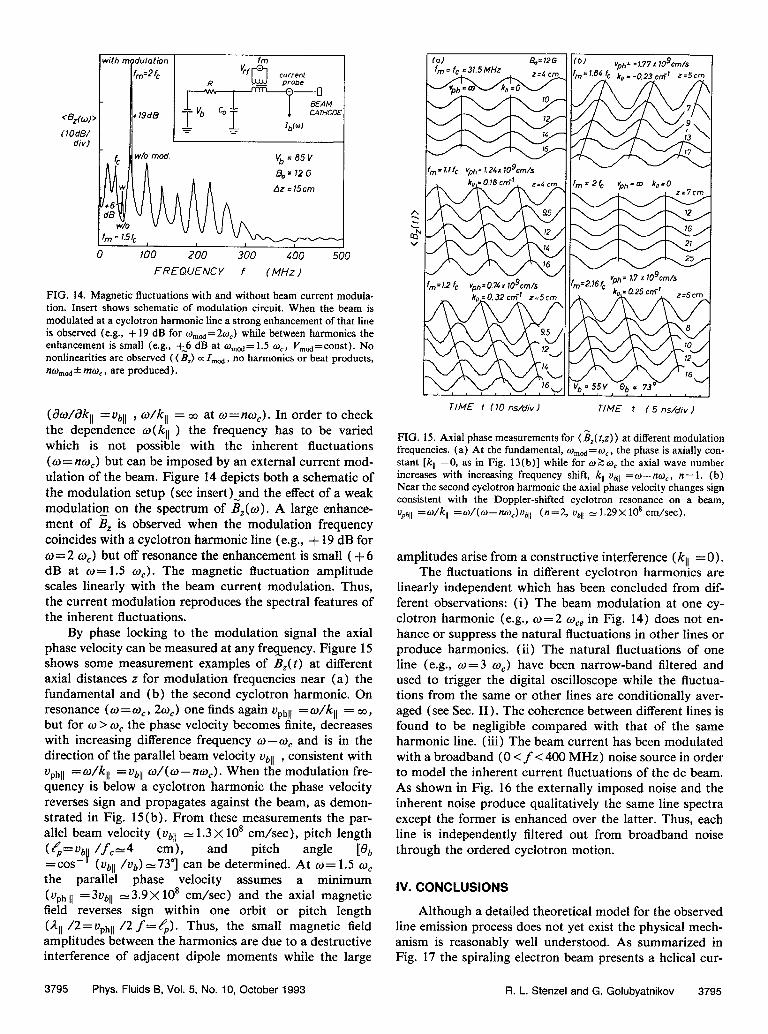
FIG. 14. Magnetic fluctuations with and without beam current modula- tion. Insert shows schematic of modulation circuit. When the beam is modulated at a cyclotron harmonic line a strong enhancement of that line is observed (e.g., + 19 dB for w,~= 2w,) while between harmonics the enhancement is small (e.g., +-6 dB at o,~= 1.5 tic, Y,,,d=const). No nonlinearities are observed ( ( B,) CC Imod, no harmonics or beat products, no,od f mo, , are produced).
( do/dkll = Q,I , w/kll = CO at w = nw,) . In order to check the dependence co(kll ) the frequency has to be varied which is not possible with the inherent fluctuations (o = no,) but can be imposed by an external current mod- ulation of the beam. Figure 14 depicts both a schematic of the modulation setup (see insert)-and the effect of a weak modulatio_n on the spectrum of B,(w). A large enhance- ment of B, is observed when the modulation frequency coincides with a cyclotron harmonic line (e.g., + 19 dB for w = 2 w,) but off resonance the enhancement is small ( + 6 dB at w= 1.5 w,). The magnetic fluctuation amplitude scales linearly with the beam current modulation. Thus, the current modulation reproduces the spectral features of the inherent fluctuations.
By phase locking to the modulation signal the axial phase velocity can be measured at any frequency. Figure 15 shows some measurement examples of B,(t) at different axial distances z for modulation frequencies near (a) the fundamental and (b) the second cyclotron harmonic. On resonance (w =wC, 2~0,) one finds again uphI =6/k,, = 00, but for w > w, the phase velocity becomes finite, decreases with increasing difference frequency w--w, and is in the direction of the parallel beam velocity ubll , consistent with uphll =o/k,, =ubll w/(w-nw,). When the modulation fre- quency is below a cyclotron harmonic the phase velocity reverses sign and propagates against the beam, as demon- strated in Fig. 15(b). From these measurements the par- allel beam velocity ( LQ,, N 1.3 X 10’ cm/set), pitch length (l?p=vq /f,-4 cm), and pitch angle [0, =cos- ( ubll /Q) N 737 can be determined. At w= 1.5 o, the parallel phase velocity assumes a minimum ( UPh 11 =3ubll ~3.9 X 10’ cm/set) and the axial magnetic field reverses sign within one orbit or pitch length (/211 /2 = Uph[l /2 f = 4). Thus, the small magnetic field amplitudes between the harmonics are due to a destructive interference of adjacent dipole moments while the large
Ibl -1.77 X logC,-“/S
9 vg,=O%r 10 Cm/s - II f
m ;2,,6f vph= 1.7 X logC”,/S
’ k,,= 0.25 cm“ I
TIME t 110 ns/dvI TIME t (5 n&iv)
FIG. 15. Axial phase measurements for (a( t,z)) at different modulation frequencies. (a) At the fundamental, o mod= w, , the phase is axially con- stant [kt, =0, as in Fig. 13(b)] while for 02 w, the axial wave number increases with increasing frequency shift, k,, ubll =o--nw,, tz= 1. (b) Near the second cyclotron harmonic the axial phase velocity changes sign consistent with the Doppler-shifted cyclotron resonance on a beam, uphll =o/k,, =ti/(m-nno,)ubll (n=2, ubll -1.29X 10s cm/set).
amplitudes arise from a constructive interference (k,, = 0). The fluctuations in different cyclotron harmonics are
linearly independent which has been concluded from dif- ferent observations: (i) The beam modulation at one cy- clotron harmonic (e.g., w= 2 w,, in Fig. 14) does not en- hance or suppress the natural fluctuations in other lines or produce harmonics. (ii) The natural fluctuations of one line (e.g., o= 3 w,) have been narrow-band filtered and used to trigger the digital oscilloscope while the fluctua- tions from the same or other lines are conditionally aver- aged (see Sec. II). The coherence between different lines is found to be negligible compared with that of the same harmonic line. (iii) The beam current has been modulated with a broadband (0 < f < 400 MHz) noise source in order to model the inherent current fluctuations of the dc beam. As shown in Fig. 16 the externally imposed noise and the inherent noise produce qualitatively the same line spectra except the former is enhanced over the latter. Thus, each line is independently filtered out from broadband noise through the ordered cyclotron motion.
IV. CONCLUSIONS
Although a detailed theoretical model for the observed line emission process does not yet exist the physical mech- anism is reasonably well understood. As summarized in Fig. 17 the spiraling electron beam presents a helical cur-
3795 Phys. Fluids 6, Vol. 5, No. 10, October 1993 Ft. L. Stenzel and G. Golubyatnikov 3795

Wl TH MODULATION
I II
Q=IfG
Vb - 3ov
VI- \ h Ib =6OmA
f I I 1 I
0 50 100 150 200 FREQUENCY f I MHz I
FIG. 16. Magnet ic fluctuation spectrum (&(o)) of an unmodulated dc beam (smaller ampli tudes) and a beam modulated with a broadband noise source (0 < f < 300 MHz). Note that the external current modula- tion produces qualitatively the same line spectrum as the dc beam which therefore carries residual current f luctuations at the thermal level.
rent source with broadband ac fluctuations super imposed on the dc current. Those frequency components which are synchronous with the cyclotron rotation (o= nw,) pro- duce magnetic field perturbations B, which are in phase from orbit to orbit ( kll =0) hence produce a long fteld- al igned solenoidal rf magnetic field which induces a strong signal in the l inked loop antenna. For frequencies between the harmonics [w= (n+f)oJ, the magnetic fields of Edja- cent cyclotron orbits oppose so that the net field B, is negligibly small at high pitch angles.
The observed fluctuations are thought to be dominated by the source term (ballistic particle currents) rather than collective plasma modes (electromagnetic cyclotron har-
RF FIELD FOR
w-nw, = k,,vb,, =#
FIG. 17. Schematic d iagram summarizing the physical mechanism for the observed line spectra. The spiraling electron beam carries both2 dc current Zdc and broadband thermal current f luctuations Z(w) (0 < f< fpbe 500 MHz, Q=: 3 x lo9 cme3). The latter give rise to a bal- listic mode. Those f requency components whose perturbations rotate syn- chronou_sly with the cyclotron orbit produce identical magnet ic perturba- t ions B, for each orbit (k,, =O, o-no,=k,, ubII =O), which constructively interfere to a long solenoidal rf field and produce a strong signal in the l inked loop antenna. Between cyclotron harmonics the dipole moments of adjacent cyclotron orbits oppose and destructively interfere to small amplitudes. Hence, the spiraling particle orbit produces out of a b roadband thermal noise spectrum a line spectrum by a filtering effect. No collective p lasma mode or instability or nonlinearity is required to explain the cyclotron harmonic lines.
man ic waves). This conclusion is based upon observations of linewidths, propagat ion characteristics, insensitivity to p lasma parameters (lines are observed for 0 < ta < 20 msec, ie 107<n <10’2cm-3 * .f 0.25 < kT,< 3 eV), temporal de- cay of l ineseupon beam switch off (At, ubll AZ- 150 nsec), and absence of absorpt ion lines at w=tzwC in the antenna impedance.
Linewidths and harmonic amp litudes of the fiuctua- tions deserve further investigation and understanding. Many narrow lines are obtained for electrons with high- pitch angles (see F ig. 6)) fewer and broader lines occur with significant spread in velocity space (Fig. 3, discharge plasma) or close to the electron source (Fig. 11). Over- lapping orbits of spiraling electrons, as in the case of pri- mary electrons in a uniform discharge, still produce cyclo- tron harmonic lines at large distances from the source (AZ e-200 cm). The magnetic field in each flux tube fluctuates independently indicating again that no perpendicularly propagat ing e igenmodes are excited. Axial magnetic field gradients have been observed to determine the line amp li- tudes: with increasing distance from the source the lines grow, reach a maximum, and decay when the line shift due to VB exceeds the linewidth, i.e., when the coherence is lost axially. O f course, the latter can also arise from colh- sions but for the present parameters the mean-free path of the energetic electrons exceeds the length of the device (&,d&z 3 m at 100 eV) . There appears to be little ab- sorption of the beam-generated r-f fields by the cold back- ground electrons since no self-absorption lines (line split- ting) are observed as in earlier experiments.22’23
In summary, the present observation of cyclotron har- mon ic lines in the electromagnetic fluctuation spectrum of non-Maxwell ian plasmas has lead to a different physical explanation than given previously.2*‘0-‘2 It is conceivable that some of the earlier experiments which lacked in situ diagnostics did not produce cyclotron harmonic lines by instabilities but by the same mechanism as described here. It is also likely that spiraling ion beams produce magnetic fluctuations at ?ZCI),i. Such line spectra are useful for accu- rate local magnetic field measurements in finite-@ plasmas. Magnetic fluctuations in both Maxwell ian and non- Maxwell ian plasmas can produce phase modu lations of e igenmodes whose propagat ion depends on B.
ACKNOWLEDGMENTS
The authors acknowledge helpful discussions with Drs. G . Morales and J. M . Urrutia.
This work was supported by the National Science Foundat ion Grant No. PHY 91-02132 and the National Aeronautics and Space Administration Grant No. NAGW 1570.
‘A. G. Sitenko, Fluctuations and Nonlinear Interactions in Plasmas (Per- gamon, Oxford, 1982).
‘G. Bekefi, Radiation Processes in Plasmas (Wiley, New York, 1966). ‘V. N. Tsytovich, Theory of Turbulent Plasma (Consultants Bureau, New York, 1977).
4N. A. Krall and A. W. Trivelpiece, Principles of Plasma Physics (McGraw-Hill, New York, 1973).
‘G. D. Tait, F. J. StautTer, and D. A. Boyd, Phys. Fluids 24,719 (1981).
3796 Phys. Fluids 6, Vol. 5, No. IO, October 1993 FL L. Stenzel and G. Golubyatnikov 3796

6D. F. Martyn, Proc. R. Sot. London Ser. A 193, 44 (1948). 7G. Golubyatnikov and R. L. Stenzel, Phys. Rev. Lett. 70, 940 ( 1993). ‘G. Landauer, Plasma Phys. (J. Nucl. Energy C) 4, 395 (1962). 9H. Ikegami and F. W. Crawford, Proceedings of the 7th International
Conference on Ionization Phenomena in Gases, Belgrade (North- Holland, Amsterdam, 1965), Vol. II, p. 503.
“E. Canobbio and R. Croci, Proceedings of the 7th International Confer- ence on Ionization Phenomena in Gases, Paris (North-Holland, Amster- dam, 1964), Vol. III, p. 269.
“A. Simon and M. N. Rosenbluth, Phys. Fluids 6, 1566 (1963). “A. F. Kuckes and J. M. Dawson, Phys. Fluids 8, 1007 (1965). “G. Golubyatnikov and R. L. Stenzel, Phys. Fluids B 5, 3122 (1993). “J. R. Jokipii, Annu. Rev. Astron. Astrophys. 11, 1 (1973).
3797 Phys. Fluids B, Vol. 5, No. 10, October 1993
“K. G. Balmain. Ann. Telecommun. 34, 273 (1979). 16R. L. Stenzel and W. F. Daley, U.S. Patent No. 4,216,405 (August
1980). “R. L. Stenzel, Phys. Fluids B 3, 2568 (1991). “R. L. Stenzel, J. Geophys. Res. 82, 4805 (1977). 19D. A. Whelan and R. L. Stenzel, Phys. Fluids 28, 958 (1985). “D. G. Lominadze, Cyclotron Waves in Plasma (Pergamon, Oxford,
1981), Chap. 1. 2’R. L. Stenzel and B. H. Ripin, Phys. Rev. Lett. 31, 1545 (1973). z2G. Landauer, in Plasma Waves in Space and the Laboratory, edited by
J. 0. Thomas and B. J. Landmark (Edinburgh University Press, Edin- burgh, Scotland, 1969), Vol. 1, p. 235.
“E. B. Meservey and S. P. Schlesinger, Phys. Fluids 8, 500 (1965).
R. L. Stenzel and G. Golubyatnikov 3797