d dd iiisss tttrrriiccctt aaannnnnnuuuaaalll
TRANSCRIPT

0 | P a g e
GGGaaallllllaaatttiiinnn SSSooollliiiddd WWWaaasssttteee
MMMaaannnaaagggeeemmmeeennnttt
DDDiiissstttrrriiicccttt
AAAnnnnnnuuuaaalll RRReeepppooorrrttt
JJJuuulllyyy 111,,, 222000111666 --- JJJuuunnneee 333000,,, 222000111777
The Gallatin Solid Waste Management District Manages the Logan Landfill
and the Bozeman Convenience Site. The Logan Landfill is a sanitary modern
environmentally friendly regulated state-of-the–art Class 2 landfill. Internal
Programs include *Special Wastes*Environmental
Monitoring*Recycling*Education*Outreach

1 | P a g e
TTTaaabbbllleee ooofff CCCooonnnttteeennntttsss
Letter from the District Manager -3
Gallatin Solid Waste Management District -4
District Mission Statement -4
Gallatin Solid Waste Management District Board of Directors -4
District Board Officers -5
Table 1: District 3-Year Comparison to Actual Budget Expended Fiscal
Years 2015, 2016, 2017 -6
Administration -7
District Operations Logan Landfill (LLF) -8
District Organizational Chart -9
Operations at the Logan Landfill District Tonnages -10
Table 2: Tonnages & Components July 1, 2016 to June 30, 2017 -11
Graph 1: 3-Year Incoming Tonnage by Month Comparison Fiscal Years
2015, 2016, 2017 -12
District Revenues -12
Table 3: Revenue & Components July 1, 2016 to June 30, 2017 -13
Graph 2: 3-Year Revenue by Month Comparison Fiscal Years 2015,
2016, 2017 -14
Performance at the Logan Landfill -14
Table 4: Logan Landfill Municipal Solid Waste Phase 2 Cell Performance
Analysis Summary -16
Table 5: Logan Landfill Municipal Solid Waste Phase 3 Cell Performance
Analysis Summary -17
Table 6: Logan Landfill Municipal Solid Waste Phase 2&3 Cells
Performance Analysis Summary -18
Class IV Area Performance Evaluation -19
Table 7: Landfill Class IV Area Performance Analysis -19
Life Estimates -20
Table 8: Logan Landfill (Gallatin County) Life Projection Estimates April
2017 -21
Closure Work at the Logan Landfill -22
Table 9: Logan Landfill Estimated Closure Costs Per Acre Alternative
Final Cover System Updated January 2017 -25
Table 10: Logan Landfill Estimated Closure Costs Per Acre Compost Area
Updated January 2017
-26
Financial Assurance Approaches/Post Closure Care Costs at the Logan Landfill -27
Table 11: Logan Landfill Estimated Closure Costs – Closure of Entire
Remainder of Site Updated January 2017 -28
Table 12: Logan Landfill Estimated Closure Costs – Closure of Largest
Open Area Updated March 2016 -28
Table 13: Logan Landfill Post Closure Care Cost Estimate January 2017 -30
Financial Assurance (FA) Update Based on Overall Site Life Approach -30
Table 14: Logan Landfill FA Calculation January 2017 -31
Environmental Compliance -32
Figure 1 Emergency Contingency Plan Flow Diagram -37
Inspections -38
Logan Landfill Projects & Improvements -39

2 | P a g e
History of the Proposed Land Exchange -41
Logan Landfill Profit & Loss July 1, 2016 – June 30, 2017 -43
Logan Landfill Balance Sheet July 1, 2016 – June 30, 2017 -46
Bozeman Convenience Site Projects & Improvements -49
Bozeman Convenience Site Profit & Loss July 1, 2016 – June 30, 2017 -50
Bozeman Convenience Site Balance Sheet July 1, 2016 – June 30, 2017 -52
Recycling & Waste Diversion -54
Table 14: Recycling Budget & Actual Expenses for Fiscal Year 2016 &
Fiscal Year 2017 -54
Table 15: District Recycle Revenue and Tonnages Comparison Fiscal
Years 2013-2017 -56
Graph 3: Five -Year Commodity Revenue Comparison -56
Graph 4: Five -Year Commodity Tonnages Comparison -57
Gallatin County Free Recycling Sites Location Map -58
Recycling Educational Outreach -58
Recycling Outreach Events -59
E-Waste Collection & Processing -62
Table 16: Acceptable E-Waste Items for Disposal -62
E-Waste Processor Information -62
Waste Diversion Program Profit & Loss July 1, 2016 – June 30, 2017 -63
Waste Diversion Program Balance Sheet July 1, 2016 – June 30, 2017 -66
Household Hazardous Waste (HHW) Collection -67
Financial Summary: -68
Graph 5: Interest Earnings Comparison -69
Table 17: Actual Tonnages Received Decreased & Increased
Tonnages From Previous Fiscal Years 2013-2017 -70
Gallatin Solid Waste Management District Long Range Strategic Plan -71
Gallatin Solid Waste Management District Profit & Loss July 1, 2016-
June 30, 2017 -72
Gallatin Solid Waste Management District Balance Sheet July 1,
2016 – June 30, 2017 -76

3 | P a g e
I am pleased to present the fiscal year 2017 Annual Report for the Gallatin Solid Waste Management District prepared by Dawn Chretien and the Gallatin Solid Waste Management District staff. This year’s annual report provides a summary of the past fiscal year and provides an analysis of the programs offered by the Gallatin Solid Waste Management District. This report covers the time period from July 1, 2016 to June 30, 2017.
During Fiscal Year 2017, the District continued to experience an increase in the waste disposed of at both the Logan Landfill and the Bozeman Convenience Site. The Logan Landfill received and processed 140,152 tons of waste in fiscal year 2017. The District’s HHW, e-waste, fluorescent bulb, clean wood, and composting programs continue to provide waste diversion options at the Logan Landfill and Bozeman Convenience Site. Four Corners Recycling continues to provide hauling, site maintenance, and processing services for the District’s recycling sites in Gallatin County. The District and the Big Sky community identified and developed a new recycling site for the residents of Big Sky located on property provided by Haas Builders. In FY 2017, the District partnered with Helena Industries to provide e-waste recycling services for the District’s e-waste recycling program. The District continued to develop and expand outreach and education opportunities for the residents of Gallatin County through landfill tours, clinics, presentations, and networking with community organizations and businesses.
The Phase IV Expansion was the primary capital project for fiscal year 2017. Landfill operations excavated and hauled 51,820 yards of soil and started the initial construction of the Phase IV Expansion project. The Phase IV project was incorporated into daily landfill operations, which assisted with reducing project costs and improving overall landfill efficiency. The District implemented phase III of the Soil Vapor Extraction pilot program with MTDEQ and Great West Engineering. The District purchased a new CAT 963 track loader and used Kenworth water truck for landfill operations. The District continued the improvement and reclamation of the Logan Springs Ranch. The improvement of the Logan Springs Ranch is a key component for the proposed land exchange with the DNRC. An agreement to initiate and complete the land swap is currently under review by the DNRC and Gallatin County.
In the next year, landfill staff will complete the excavation of soil from the phase four cell in preparation for the construction and installation of the Phase Four liner and leachate system. The bidding and construction of the Phase IV Expansion will begin in February 2018 with completion of the project in September 2018. The District plans to complete Phase III and implement Phase IV of the Soil Vapor Extraction pilot program with MTDEQ and Great West Engineering. The District budgeted for the purchase of a roll-off truck, flatbed truck, mower attachment, snow plow, salt and spreader, and landfill GPS for landfill operations at the Logan Landfill. The District will continue implementing the Logan Springs Ranch improvement project to facilitate final approval of the proposed land swap with the DNRC. The final approval of the land swap is critical for determining the future development and major facility expansion of the Logan Landfill and the Gallatin Solid Waste Management District.
The Gallatin Solid Waste Management District will continue to provide essential waste disposal services and offer alternate waste disposal options under our umbrella of solid waste management. The District’s hardworking, dedicated, and versatile staff, with the input and oversight of the Solid Waste Board, continues to achieve lasting improvements while providing a variety of solid waste solutions for the residents of Gallatin County. With the current and projected growth of Gallatin County, the District will be instrumental in providing essential solid waste services and remain a valuable asset for Gallatin County.
Sincerely,
Jim Simon, District Manager Gallatin Solid Waste Management District
A Letter from the Gallatin Solid Waste Management
District Manager
Jim Simon

4 | P a g e
GGGaaallllllaaatttiiinnn SSSooollliiiddd WWWaaasssttteee
MMMaaannnaaagggeeemmmeeennnttt
DDDiiissstttrrriiicccttt
The Gallatin Solid Waste Management District was created by the
Gallatin County Commissioners on May 20, 2003, by Resolution
#2003-054.
GGGaaallllllaaatttiiinnn SSSooollliiiddd WWWaaasssttteee MMMaaannnaaagggeeemmmeeennnttt DDDiiissstttrrriiicccttt BBBoooaaarrrddd
The Gallatin Solid Waste Management District Board consists of representatives from the Cities of Belgrade, Bozeman, Three Forks, and Manhattan. Two additional seats are occupied by Members-at-Large, and the remaining seat is occupied by a County Commissioner. The District operates as an enterprise fund. The values and operating principles are Customer focus that is responsive, prompt, compassionate and provides quality service; Accountability for being responsible and cost effective in the use of public resources; Teamwork that promotes creative cooperation; Communication that is open and honest with sharing of information and ideas and; Professionalism in everything we do by being innovative, qualified, honest, full of integrity, and personal excellence.
GGGaaallllllaaatttiiinnn SSSooollliiiddd WWWaaasssttteee MMMaaannnaaagggeeemmmeeennnttt BBBoooaaarrrddd ooofff DDDiiirrreeeccctttooorrrsss
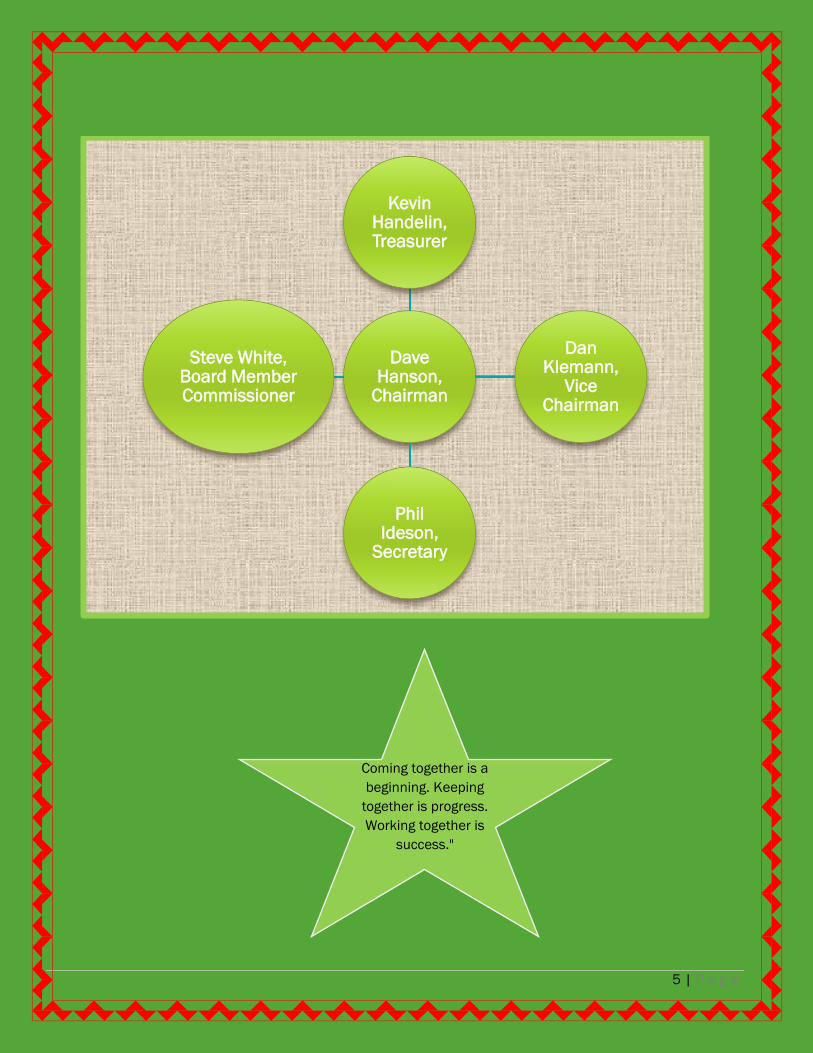
The Board of Directors for Fiscal Year 2016 - 2017 are: Open Seat, City of Manhattan; R. Stephen White, Gallatin County Commissioner, Commission District #3; Dave Hanson, City of Three Forks; Dan Klemann, Member at Large; Phil Ideson Member at Large; Kevin Handelin, City of Bozeman. There is one open seat the Belgrade Representative from 4/1/2014 through 6/30/2017.
The purpose of the
Gallatin Solid Waste
Management District
(GSWMD) is: to
provide constituents
with cost efficient
solid waste services;
to provide for the
balanced
consideration and
representation of the
diverse views and
issues regarding solid
waste management; to
advocate for the
health, safety and
welfare of the
residents; to manage
the processing,
reclaiming, storing,
transporting, or
disposing of waste in
ways that protect the
ecology of lands in the
District; to identify
goals, policies and
procedures that will
aid local jurisdictions
in meeting solid waste
reduction and
recycling goals.
GSWMD Mission Statement
5 | P a g e
Dave Hanson,
Chairman
KevinHandelin, Treasurer
Dan Klemann,
Vice Chairman
Phil Ideson,
Secretary
Steve White, Board Member Commissioner
Coming together is a
beginning. Keeping
together is progress.
Working together is
success."
— Henry Ford,
Founder Ford Motor
Company

6 | P a g e
Object of Expenditures
Final Budget Approved FY 2015
Actual Budget Expended
FY 2015
Final Budget Approved FY 2016
Actual Budget
Expended FY 2016
Final Budget Approved FY 2017
Actual Budget
Expended FY 2017
Personnel $ 976,425 $ 869,072 $ 1,015,858 $ 991,022 $ 1,058,468 $ 1,071,300
Operations 1,985,076 1,536,330 2,228,547 1,583,904 2,228,547 1,733,208
Debt Service 132,810 129,788 133,200 130,004 133,200 134,048
Capital Outlay 6,798,761 733,950 7,286,054 159,769 7,650,911 2,402,431
Transfers Out ------------ ---------- --------- ----------
Reserves ---------- ---------- ---------- ----------
Total $9,893,072 $3,269,140 $10,663,659 $2,864,699 $11,071,126 $5,340,987
Budget by Fund Group
General Fund $ - $ - $ - $ - $ - $ -
Special Revenue Funds
$ - $ - $ - $ - $ - $ -
Debt Service Funds $ - $ - $ - $ - $ - $ -
Capital Project Funds
$ - $ - $ - $ - $ - $ -
Enterprise Funds $9,893.072 $3,269,140 $10,663,659 $2,864,699 $11,071,126 $5,340,987
Internal Service Funds
$ - $ - $ - $ - $ - $ -
Trust & Agency Funds
$ - $ - $ - $ - $ - $ -
Total $9,893.072 $3,269,140 $10,663,659 $2,864,699 $11,071,126 $5,340,987
Funding Sources
Tax Revenues $ - $ - $ - $ - $ - $ -
Non-Tax Revenues $3,864,367 $3,818,562 $3,859,831 $3,898,429 $3,867,070 $4.799,618
Cash Reappropriated
$6,028,705 ($549,422) 6.803,828 (1,033,730) $7,204,056 $541,369
Total $9,893,072 $3,269,140 $10,663,659 $2,864,699 $11,071,126 $5,340,987
Table 1 3-Year Comparison of the Gallatin Solid Waste Management District Budget Final Approval to Actual Budget Expended for Fiscal Years 2015, 2016, 2017
It’s clearly a budget. It’s
got a lot of numbers in it.
George W. Bush

7 | P a g e
Daily operations of the Gallatin Solid Waste Management District are administered by
professional staff headquartered at the
Logan Landfill
Gallatin Solid Waste Management District
10585 Two Dog Road
P.O. Box 461
Three Forks, Montana 59752
406-582-2492
Fax: 406.582.2491
Website
www.gallatinsolidwaste.com
https://gallatinsolidwaste.org

8 | P a g e
The District ended Fiscal Year 2016-2017 with a staff of 16 Full-time regular employees. The
District Manager; Office Manager; Accountant; Recycle Outreach Educator; Site
Foreman/Lead Equipment Operator; 4 Equipment Operators (1 is a Household Hazardous
Waste Specialist/Equipment Operator); 2 Mechanics; 3 Scalehouse Attendants (1 is a
Scalehouse Attendant/Operations Support at the Logan Landfill);1 Scalehouse Attendant at
the Bozeman Convenience Site; 1 Site Maintenance/Compost Equipment Operator.

9 | P a g e
District Manager
Office Manager/LLF and BCS Scalehouse Supervisor/GSWMD Board
Liason/Recycle Administration
District Accountant
2 Scalehouse Operators
1 Scalehouse Operator/Operations Support
Logan Landfill/Admin
1 Recycle Outreach Educator/ Scalehouse/Admin Support
Recording Secretary GSWMD Board
1 Scalehouse Operator Bozeman Convenience Site
Site Foreman/Lead Equipment Operator/Safety Coordinator
Equipment Operator/HHW
Specialist
3 Equipment Operators
1 Compost Equipment
Operator/Site Maintenance
Lead Mechanic
Mechanic
County
Administrator
County
Commission
10 | P a g e
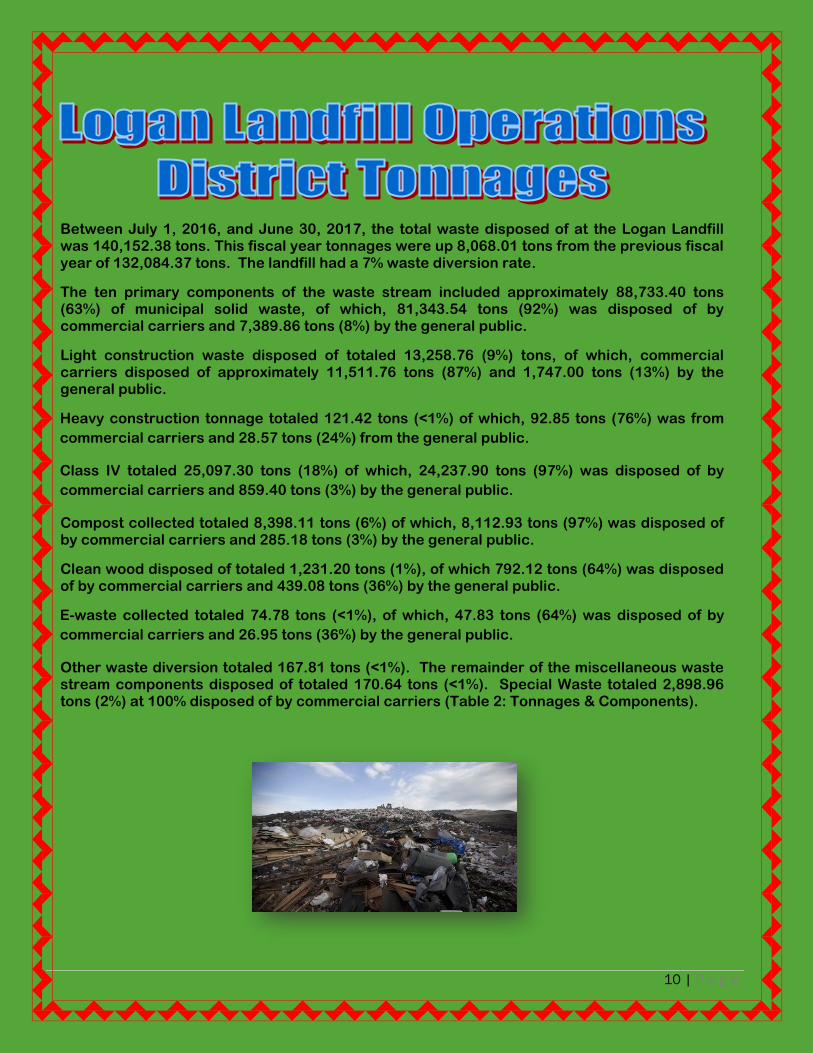
Between July 1, 2016, and June 30, 2017, the total waste disposed of at the Logan Landfill was 140,152.38 tons. This fiscal year tonnages were up 8,068.01 tons from the previous fiscal year of 132,084.37 tons. The landfill had a 7% waste diversion rate.
The ten primary components of the waste stream included approximately 88,733.40 tons (63%) of municipal solid waste, of which, 81,343.54 tons (92%) was disposed of by commercial carriers and 7,389.86 tons (8%) by the general public.
Light construction waste disposed of totaled 13,258.76 (9%) tons, of which, commercial carriers disposed of approximately 11,511.76 tons (87%) and 1,747.00 tons (13%) by the general public.
Heavy construction tonnage totaled 121.42 tons (<1%) of which, 92.85 tons (76%) was from
commercial carriers and 28.57 tons (24%) from the general public.
Class IV totaled 25,097.30 tons (18%) of which, 24,237.90 tons (97%) was disposed of by
commercial carriers and 859.40 tons (3%) by the general public.
Compost collected totaled 8,398.11 tons (6%) of which, 8,112.93 tons (97%) was disposed of by commercial carriers and 285.18 tons (3%) by the general public.
Clean wood disposed of totaled 1,231.20 tons (1%), of which 792.12 tons (64%) was disposed of by commercial carriers and 439.08 tons (36%) by the general public.
E-waste collected totaled 74.78 tons (<1%), of which, 47.83 tons (64%) was disposed of by
commercial carriers and 26.95 tons (36%) by the general public.
Other waste diversion totaled 167.81 tons (<1%). The remainder of the miscellaneous waste stream components disposed of totaled 170.64 tons (<1%). Special Waste totaled 2,898.96 tons (2%) at 100% disposed of by commercial carriers (Table 2: Tonnages & Components).

11 | P a g e
Primary Components
Total Tons
% Tons
Tons Commercial
% Tons
Tons Public
% Tons
Total % of Commercial
& Public Tonnages
Municipal Solid Waste
(MSW)
88,733.40 63% 81,343.54 92% 7,389.86 8%
100%
Light Construction
13,258.76 9% 11,511.76 87% 1,747.00 13% 100%
Heavy Construction
121.42 <1% 92.85 76% 28.57 24% 100%
Class IV 25,097.30 18% 24,237.90 97% 859.40 3% 100%
Compost 8,398.11 6% 8,112.93 97% 285.18 3% 100%
Clean Wood 1,231.20 1% 792.12 64% 439.08 36% 100%
E-Waste 74.78 <1% 47.83 64% 26.95 36% 100%
Waste Diversion
167.81 <1% 93.86 56% 73.95 44% 100%
Miscellaneous 170.64 <1% 67.01 39% 103.63 61% 100%
Special Wastes
2,898.96 2% 2,898.96 100% 100%
Total 140,152.38 100% 129,198.76 10,953.62
100%
Table 2
July 1, 2016 – June 30, 2017

12 | P a g e
The Revenue from the tipping fees at the Logan Landfill between July 1,
2016, and June 30, 2017, was $4,410,073.20. The ten primary components of the revenue
collected included municipal solid waste totaling $2,394,159.00 (54%) of which, $2,191,818.00
(92%) came from commercial carriers and $202,341.00 (8%) came from the general public.
Light construction totaled $640,831.00 (15%) of the revenue collected, of which, $556,239.00
(87%) came from commercial carriers and $81,592.00(13%) came from the general public.
Heavy construction totaled $7,047.00 (<1%) of the revenue collected, of which, $5,386.00
(76%) came from commercial carriers and $1,661.00 (24%) came from the general public.
0
2000
4000
6000
8000
10000
12000
14000
16000
FY 2015
FY 2016
FY 2017
Graph 1
Incoming Tonnage by Month Comparison Logan Landfill
Logan Landfill
District Revenues

13 | P a g e
Class IV totaled $1,212,527.00 (27%) of the revenue collected, of which, $1,169,837.00 (96%)
came from commercial carriers and $42,690.00 (4%) came from the general public. Compost
earned $52,905.00 (1%) of the revenue collected, of which, $46,096.25 (87%) came from
commercial carriers and $6,808.75 (13%) came from the general public. Clean wood totaled
$35,339.00 (1%) of the revenue collected, of which $22,140.08 (63%) came from commercial
carriers and $13,198.92 (37%) came from the general public. E-waste diverted totaled
3,435.00 (<1%) of the revenue collected, of which $957.00 (28%) came from commercial
carriers and $2,478.00 (72%) came from the general public. Waste Diversion totaled
$27,077.00 (1%) of the revenue collected, of which $15,824.00 (58%) came from commercial
carriers and $11,253.00 (42%) came from the general public. Special Wastes revenue
collected was $27,213.00 (<1%) of which 100% came from commercial carriers. The
remainder of the revenue collected from miscellaneous fees totaled approximately $9,540.20
(<1%) of the revenue collected, of which, $3,716.88.00 (39%) came from the commercial
carriers and $5,823.32 (61%) came from the general public (Table 3: Revenue & Components).
The revenue increased $220,109.29 from the last fiscal year’s revenue of $4,189,963.91 to this
fiscal year’s revenue of $4,410,073.20.
Primary Components
Total Revenue
% Revenue
Commercial Customers
% Revenue General Public
% Total
Revenue %
Municipal Solid Waste (MSW) $2,394,159.00 54% $2,191,818.00 92%
$202,341.00 8% 100%
Light Construction $640,831. 00 15% $556,239.00 87% $84,592.00 13% 100%
Heavy Construction $7,047. 00 <1% $5,386.00 76% $1,661.00 24% 100%
Class IV $1,212,527.00 27% $1,169,837.00 96% $42,690.00 4% 100%
Compost $52,905.00 1% $46,096.25 87% $6,808.75 13% 100%
Clean Wood $35,339.00 1% $22,140.08 63% $13,198.92 37% 100%
Special Wastes $27,213.00 <1% $27,213.00 100% $0 0% 100%
E-Waste $3,435.00 <1% $957.00 28% $2,478.00 72% 100%
Waste Diversion $27,077.00 1% $15,824.00 58% $11,253.00 42% 100%
Miscellaneous $9,540.20 <1% $3,716.88 39% $5,823.32 61% 100%
Total $4,410,073.20 100% $4,039,227.21
$370,845.99
Table 3 Revenue & Components July 1, 2016 to June 30, 2017
14 | P a g e
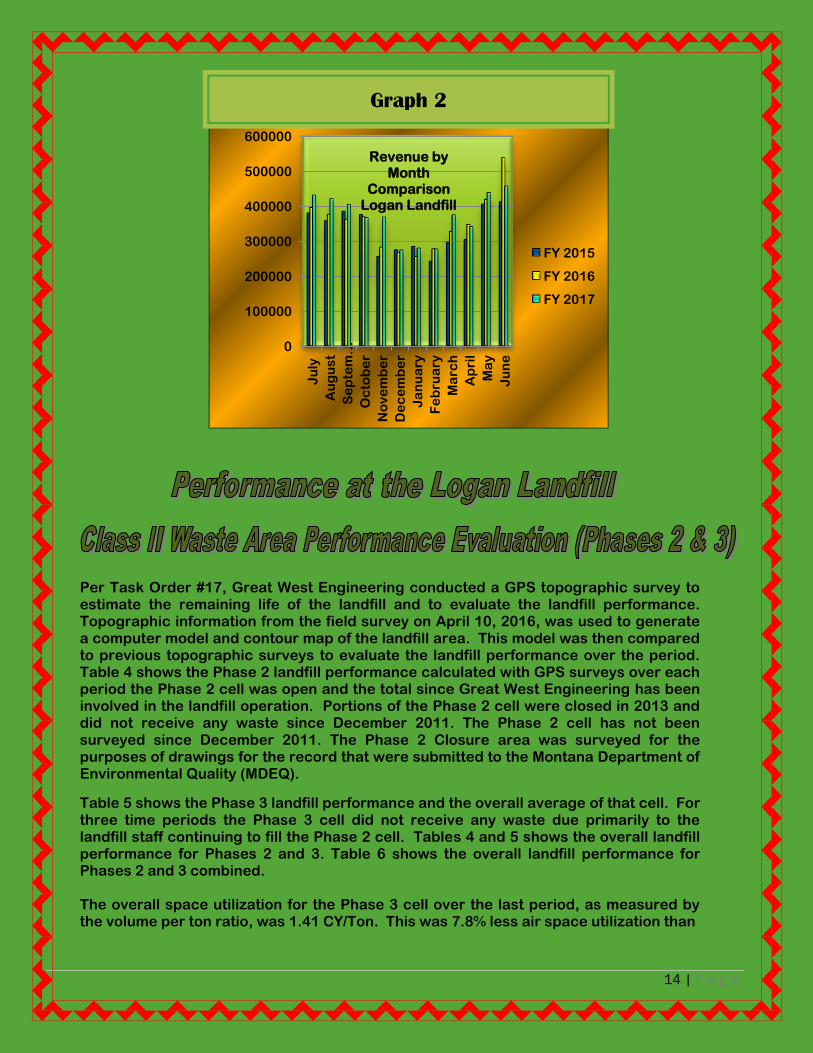
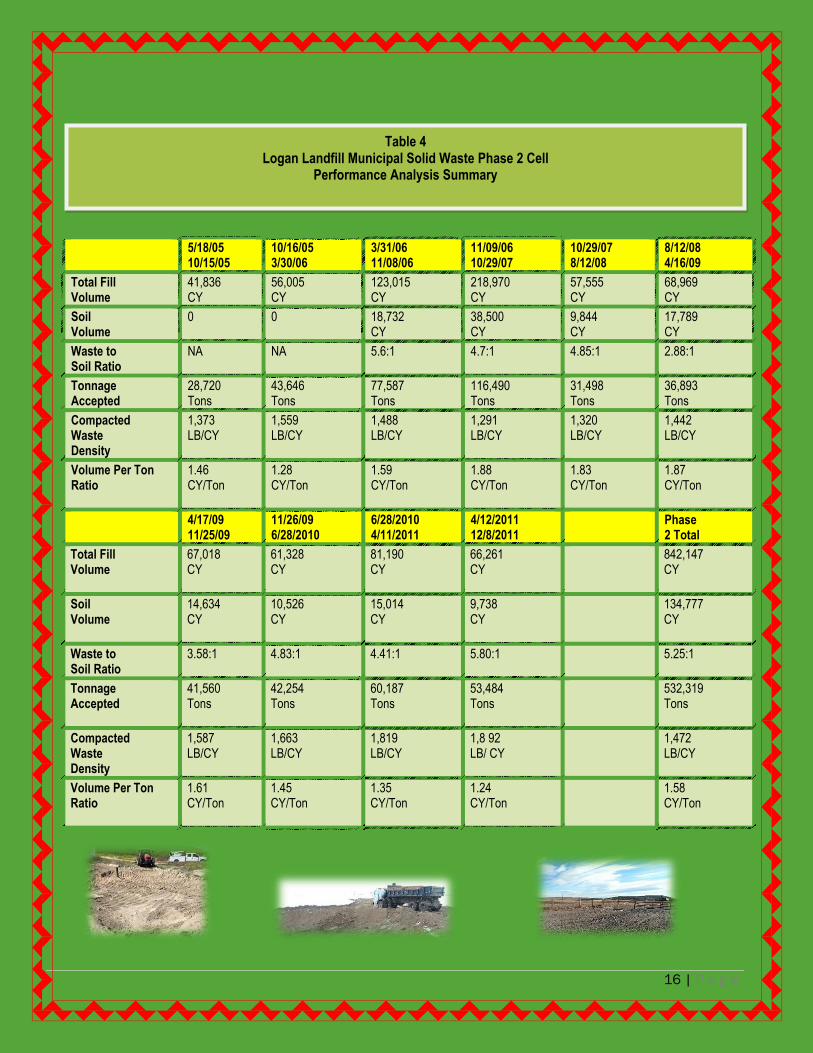
Per Task Order #17, Great West Engineering conducted a GPS topographic survey to estimate the remaining life of the landfill and to evaluate the landfill performance. Topographic information from the field survey on April 10, 2016, was used to generate a computer model and contour map of the landfill area. This model was then compared to previous topographic surveys to evaluate the landfill performance over the period. Table 4 shows the Phase 2 landfill performance calculated with GPS surveys over each period the Phase 2 cell was open and the total since Great West Engineering has been involved in the landfill operation. Portions of the Phase 2 cell were closed in 2013 and did not receive any waste since December 2011. The Phase 2 cell has not been surveyed since December 2011. The Phase 2 Closure area was surveyed for the purposes of drawings for the record that were submitted to the Montana Department of Environmental Quality (MDEQ).
Table 5 shows the Phase 3 landfill performance and the overall average of that cell. For three time periods the Phase 3 cell did not receive any waste due primarily to the landfill staff continuing to fill the Phase 2 cell. Tables 4 and 5 shows the overall landfill performance for Phases 2 and 3. Table 6 shows the overall landfill performance for Phases 2 and 3 combined. The overall space utilization for the Phase 3 cell over the last period, as measured by the volume per ton ratio, was 1.41 CY/Ton. This was 7.8% less air space utilization than
0
100000
200000
300000
400000
500000
600000
Ju
ly
Au
gu
st
Se
pte
m…
Oc
tob
er
No
ve
mb
er
De
ce
mb
er
Ja
nu
ary
Fe
bru
ary
Ma
rch
Ap
ril
Ma
y
Ju
ne
FY 2015
FY 2016
FY 2017
Revenue by Month
Comparison Logan Landfill
Graph 2

15 | P a g e
the last time period. The overall performance of the landfill is measured by the volume per ton ratio. The two components which directly impact the overall landfill performance are the compacted waste density and the waste-to-soil ratio.
The site achieved a compacted waste density of 1,842 pounds per cubic yard over the last period. The landfill staff are commended for their continued excellent compaction rate. The industry standard for compacted waste density at landfills which operate 826-equivalent compactors is 1,200 pounds per cubic yard. The District staff is far exceeding that metric with the operation. This high compaction is due to dedicated and consistent application of compaction techniques in conjunction with quality equipment and operators. The District will continue with the compaction techniques it currently uses on the site.
The overall waste-to-soil ratio for the time period was 3.32:1. This is a 10% increase in soil usage over the previous period. However, this is lower than previous periods. The District will continue to utilize the approved daily cover as often as possible in lieu of soil.
In summary, the industry standard for landfills this size is a compacted waste density of 1,200 pound per cubic yard and a 3:1 waste to soil ratio which results in an overall volume per ton performance of 2.22 cubic yards per ton. The overall performance measured by GPS over this last period was 36% better than standard landfill performance metrics (6% better than last year). The landfill staff are commended for obtaining this outstanding waste density and overall landfill performance which ensures the landfill life is maintained, and in this case, actually extended via excellent performance criteria.
16 | P a g e
5/18/05 10/15/05
10/16/05 3/30/06
3/31/06 11/08/06
11/09/06 10/29/07
10/29/07 8/12/08
8/12/08 4/16/09
Total Fill Volume
41,836 CY
56,005 CY
123,015 CY
218,970 CY
57,555 CY
68,969 CY
Soil Volume
0 0 18,732 CY
38,500 CY
9,844 CY
17,789 CY
Waste to Soil Ratio
NA NA 5.6:1 4.7:1 4.85:1 2.88:1
Tonnage Accepted
28,720 Tons
43,646 Tons
77,587 Tons
116,490 Tons
31,498 Tons
36,893 Tons
Compacted Waste Density
1,373 LB/CY
1,559 LB/CY
1,488 LB/CY
1,291 LB/CY
1,320 LB/CY
1,442 LB/CY
Volume Per Ton Ratio
1.46 CY/Ton
1.28 CY/Ton
1.59 CY/Ton
1.88 CY/Ton
1.83 CY/Ton
1.87 CY/Ton
4/17/09 11/25/09
11/26/09 6/28/2010
6/28/2010 4/11/2011
4/12/2011 12/8/2011
Phase 2 Total
Total Fill Volume
67,018 CY
61,328 CY
81,190 CY
66,261 CY
842,147 CY
Soil Volume
14,634 CY
10,526 CY
15,014 CY
9,738 CY
134,777 CY
Waste to Soil Ratio
3.58:1 4.83:1 4.41:1 5.80:1 5.25:1
Tonnage Accepted
41,560 Tons
42,254 Tons
60,187 Tons
53,484 Tons
532,319 Tons
Compacted Waste Density
1,587 LB/CY
1,663 LB/CY
1,819 LB/CY
1,8 92 LB/ CY
1,472 LB/CY
Volume Per Ton Ratio
1.61 CY/Ton
1.45 CY/Ton
1.35 CY/Ton
1.24 CY/Ton
1.58 CY/Ton
Table 4 Logan Landfill Municipal Solid Waste Phase 2 Cell
Performance Analysis Summary

17 | P a g e
10/29/07 8/12/08
8/12/08 4/16/09
4/17/09 11/25/09
11/26/09 6/28/2010
6/28/10 4/11/11
4/12/11 12/8/11
Total Fill Volume
100,065 CY
43,687 CY
24,465 CY
0 0 0
Soil Volume
27,002 CY
14,484 CY
3,708 CY
0
0
0
Waste to Soil Ratio
2.71:1 2.02:1 5.6:1 NA NA NA
Tonnage Accepted
52,897 Tons
25,876 Tons
13,458 Tons
0 Tons 0 Tons 0 Tons
Compacted Waste
Density
1,448 LB/CY
1,772 LB/CY
1,297 LB/CY
NA NA NA
Volume Per Ton Ratio
1.89 CY/Ton
1.69 CY/Ton
1.82 CY/Ton
NA NA NA
12/9/11 10/10/12
10/11/12 3/20/14
3/21/14 3/5/15
3/5/15 4/10/16
4/11/16 3/24/17
Phase 3 Total
Total Fill Volume
118,087 CY
181,494 CY
131,209 CY
158,173 CY
138,082CY
895,262CY
Soil Volume
23,759 CY
27,506 CY
21,786 CY
33,760 CY
31,940 CY
183,945 CY
Waste to Soil Ratio
3.97:1 5.60:1 5.02:1 3.69:1 3.32:1 3.87:1
Tonnage Accepted
65,028 Tons
115,075 Tons
91,371 Tons
103,490 Tons
97,766 Tons
564,961Tons
Compacted Waste
Density
1,379 LB/CY
1,495 LB/CY
1,670 LB/CY
1,664 LB/CY
1,842 LB/ CY
1,588 LB/ CY
Volume Per Ton Ratio
1.82 CY/Ton
1.58 CY/Ton
1.44 CY/Ton
1.53 LB/CY
1.41 CY/Ton
1.58 CY/Ton
Table 5 Logan Landfill Municipal Solid Waste Phase 3 Cell
Performance Analysis Summary

18 | P a g e
Phase 2 Total Phase 3 Total to Date Phases 2 and 3 Total to Date
Total Fill Volume 842,147 CY 895,262 CY 1,737,409 CY
Soil Volume 134,777 CY 183,945 CY 318,722 CY
Waste to Soil Ratio 5.25:1 3.87:1 4.45:1
Tonnage Accepted 532,319 Tons 564,961 Tons 1,097,280 Tons
Compacted Waste
Density 1,472 LB/CY 1,842 LB/CY 1,546 LB/CY
Volume Per Ton Ratio 1.58 CY/Ton 1.41 CY/Ton 1.58 CY/Ton
Table 6 Logan Landfill
Municipal Solid Waste Phase 2 and 3 Cells Performance Analysis Summary

19 | P a g e
Great West Engineering, Inc. has also measured Class IV performance since the Class IV
area opened. Class IV materials are much more difficult to obtain high compaction levels
because of the nature of the waste. Industry standard metrics for Class IV landfills are
750 pounds per cubic yard compacted waste density and a waste-to-soil ratio of 6:1.
This results in an overall volume per ton ratio of 3.1 cubic yards per ton. Table 7 shows
that the landfill has exceeded industry metrics the last nine time periods for Class IV
operations.
Dates 4/17/2009
11/25/2009
11/26/2009
7/7/2010
7/7/2010
4/14/2011
4/14/2011
12/8/2011
12/8/2011
10/10/2012
Total Fill Volume 33,767 CY 20,768 CY 46,752 CY 51,699 CY 28,538 CY
Soil Volume 3,780 CY 2,285 CY 6,432 CY 6,977 CY 6,225 CY
Waste to Soil Ratio 7.93:1 8.09:1 6.27:1 6.40:1 3.58:1
Tonnage Accepted 14,557 Tons 9,175 Tons 29,381 Tons 27,577 Tons 14,622 Tons
Compacted Waste
Density 970 LB/CY 993 LB/CY 1,457 LB/CY 1,233 LB/CY 1,310 LB/CY
Volume Per Ton Ratio 2.32 CY/T 2.26 CY/T 1.59 CY/T 1.87 CY/T 1.95 CY/T
Dates 10/10/2012
3/20/2014
3/21/2014
5/3/2015
3/5/2015-
4/10/2016
4/11/16
3/24/17
Total
Total Fill Volume 69,737 CY 58,665 CY 65,472 CY 61,868 CY 437,266 CY
Soil Volume 13,739 CY 8,465 CY 13,940 CY 13,960 CY 75,803 CY
Waste to Soil Ratio 4:08:1 5.93:1 3.70:1 3.43:1 4.77:1
Tonnage Accepted 25,957 Tons 21,787 Tons 27,197 Tons 26,721 Tons 196,974 Tons
Compacted Waste
Density
927 LB/CY 868 LB/CY 1,056 LB/CY 1,116 LB/CY 1,090 LB/CY
Volume Per Ton Ratio
2.69
CY/Ton
2.69
CY/Ton
2.41
CY/Ton
2.32
CY/Ton
2.22
CY/Ton
Table 7 Logan Landfill Class IV Performance Analysis

20 | P a g e
The performance data, tonnage and the Landfill Master Plan were used to estimate the remaining life of Phase 3 and the overall landfill. To estimate the remaining life of Phase 3, the first step the engineer did was to calculate the remaining air space in the phase. The computer generated a land surface model from the March 24, 2017 survey. This survey was compared to the interim fill plan for Phase 3 to determine the remaining air space. The Master Plan showed the interim fill slopes for Phase 3 to be a 5:1 grade. The slopes, thus far, have been built at a 4:1 grade. To accommodate the change, Great West Engineering, Inc., in consultation with the District, changed the interim fill slope to a 4:1 grade. This did not impact the overall life of the facility, but did change the life expectancy of the Phase 3 cell. This met the requirements of the seismic design demonstration.
In order to estimate the remaining life of Phase 3, the engineer needed to project the waste generation throughout the remaining life of this cell. Currently 130,000 Tons per year is the best estimate of the annual tonnage for projections on remaining site life.
The total air space includes the final cover for the portion of Phase 3 fill when it reaches the final proposed elevations. It was subtracted out of the air space available for waste and daily intermediate soil cover. The overall performance of Phases 2 and 3 is the best estimate of how much daily and intermediate cover will be utilized at the site. However, it is critical the District continue to use alternative daily cover (ADC) to the extent possible in order to minimize the air space usage of the landfill. The engineer estimated that the landfill will be able to utilize soil long term at a 4:1 waste to soil ratio. The landfill is slightly below this ratio and needs to try to reduce the soil coverage usage to achieve a 4:1 waste to soil ratio. The estimated daily and intermediate soil cover usage is then subtracted from the available air space to determine the volume available for waste.
The last variable to determine is the compacted waste density. The landfill averaged 1,842 LB/CY over the last period. The industry standard for compacted waste density for a landfill of this size with an 826 equivalent compactor is 1,200 LB/CY. However, it appears from the last 15 periods that the District should be able to consistently achieve waste densities of 1,300 LB/CY and above. The landfill staff does an excellent job of placing the waste in thin lifts and compacting the waste with multiple equipment passes in both directions. For the basis of these life estimates, the engineer used a 1,350 LB/CY waste density. The landfill staff has proven that they can achieve this density consistently.
The life estimate analysis is summarized in Table 8. The estimates assume there will be no large “one-time” disposal projects. An example would be a large hail storm or earthquake generating a great deal of construction and demolition wastes. The capacity estimate also assumes that the District will not expand its service area during the remaining landfill life. If the District does expand its service area in the future, the life estimate would need to be updated. The ultimate life of the site will be highly dependent on the waste tonnage received at the site and the landfill performance. If the tonnage increases over this estimate or the landfill performance drops, the District will have less life than predicted.
In September 2010, an Addendum to the Landfill Master Plan was designed to include the Class IV Expansion. During this Master Plan update, a new life estimate was developed. Table 8 uses the updated Master Plan numbers to determine life projection estimates. The volumes used to develop Table 8 were calculated using CAD applications.

21 | P a g e
Based on the waste streams received this last time period, it was estimated that 79% of the waste stream went into the Phase 3 cell, and the other 21% of the waste was diverted into the Class IV area. On average, the Class IV area receives approximately 20% of the waste and the Class II areas (Phase 3) receive approximately 80% of the waste entering the landfill. Therefore, the Phase 3 life was estimated using 80% of 130,000 Tons per year and 20% of 130,000 Tons per year for the Class IV life estimates. The life of each area was calculated and is shown in Table 8. The life estimates for the waste accepted in Phase 3 shown in Table 8 are based on 104,000 Tons per year waste, with a 1,350 LB/CY compacted waste density, 4:1 soil-to-waste ratio and an overall volume per ton ratio of 1.85 CY/Ton. The life estimates for the waste accepted in the Class IV area shown in Table 8 are based on 26,000 Tons per year of waste, with a 1,000 LB/CY compacted waste density and 5.5:1 waste-to-soil ratio.
The life of Class IV cell is based on a rate of 26,000 tons/year for 2.4 years until it reaches capacity while the Phase 3 cell is accepting waste at 104,000 tons/year. Once the Class IV cell has reached full capacity, the Phase 3 cell will accept the full 130,000 tons/year for another 1.3 years.
Once the Phase 3 cell reaches full capacity after a total of 3.7 years, the Phase 4 cell will accept both waste streams at 130,000 tons/year. The Phase 4 cell will have a total life of 4.1 years. The total life of the landfill is 7.8 years (Phase 3 – 3.7 years + Phase 4 – 4.1 years).
As of March 24, 2017, Phase 3 has 848,069 CY of airspace remaining. The District has placed a total of 895,262 CY of fill in Phase 3 to date for a total capacity of 1,876,994 CY. To properly close Phase 3, 75,375 CY of cover will be needed, which results in an available airspace of 772,694 CY remaining for refuse and daily cover in the Phase 3 cell.
Class IV Area (Based on 26,000 Tons per Year) 2.4 years
Phase 3 Life (Based on 104,000 Tons per Year) 3.7 years
Phase 4 Life (Base on 130,000 Tons per Year) 4.1 years
Total Life (Based on 130,000 Tons per Year) 7.8 years
Table 8 Logan Landfill (Gallatin County)
Life Projection Estimates (April 2016)

22 | P a g e
January 31, 2017, Great West Engineering prepared updated information concerning the estimated closure and post-closure costs for the landfill. These costs were developed to determine what the District’s financial assurance requirements with the Montana Department of Environmental Quality (MDEQ) will be for the upcoming year. Three areas covered:
Life of Site
Closure Work
Landfill Post-Closure Costs
Life of Site
Landfill Closure Costs
23 | P a g e
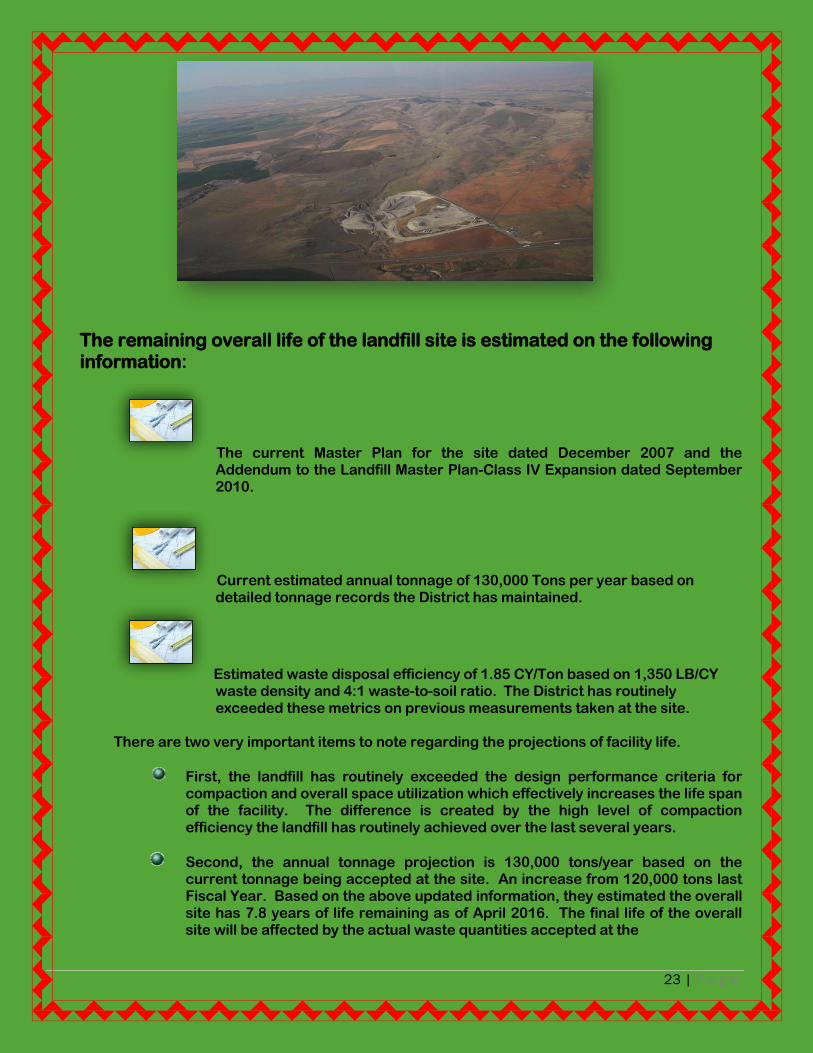
The remaining overall life of the landfill site is estimated on the following information:
The current Master Plan for the site dated December 2007 and the Addendum to the Landfill Master Plan-Class IV Expansion dated September 2010.
Current estimated annual tonnage of 130,000 Tons per year based on detailed tonnage records the District has maintained.
Estimated waste disposal efficiency of 1.85 CY/Ton based on 1,350 LB/CY waste density and 4:1 waste-to-soil ratio. The District has routinely exceeded these metrics on previous measurements taken at the site.
There are two very important items to note regarding the projections of facility life.
First, the landfill has routinely exceeded the design performance criteria for compaction and overall space utilization which effectively increases the life span of the facility. The difference is created by the high level of compaction efficiency the landfill has routinely achieved over the last several years.
Second, the annual tonnage projection is 130,000 tons/year based on the current tonnage being accepted at the site. An increase from 120,000 tons last Fiscal Year. Based on the above updated information, they estimated the overall site has 7.8 years of life remaining as of April 2016. The final life of the overall site will be affected by the actual waste quantities accepted at the

24 | P a g e
landfill, the amount of waste diverted out of the landfill, and the waste disposal efficiency that is achieved.
The total Class II and Class IV landfill area was increased from 53 to 55 acres in the 2010 addendum to the Master Plan. The County closed approximately three acres of the landfill in 1996 and another seven acres in 2013. The remaining 45 acres of waste area will require closure over the remaining life of the site. The MDEQ has approved an alternative final cover design which relies on native soil materials for the cover system rather than synthetic materials. This alternative cover system will be used for the remainder of the closure projects at the landfill.
The final cover design is a four-foot thick soil cover system that includes the following
sections from bottom to top.
Final contouring the site making sure that all areas are properly sloped, graded and intermediate covered per the final contour plan.
Installation of twelve inches of native sand/soil material.
Twenty-four inches of select fine-grained native silt soil material placed as the evapotranspiration layer for the cover. This material will be selectively excavated and pushed into place with low ground pressure equipment, likely D-7 dozers or smaller.
Closure
Work

25 | P a g e
Twelve inches of native sand/soil material of which the top six inches will be topsoil material amended with compost or other fertilizer.
Vegetating the site with a seed/fertilizer mixture as outlined in the closure
plan. It is assumed that the seed mixture will be tilled in using a tractor and
an end wheel press drill or another acceptable seeder. In areas which are
too steep for drill seeding, hydroseeding techniques will be used.
The total estimated cost per acre for installing the final cover system is shown in Table 9.
Activity Quantity Unit Cost/Unit Cost
Mobilization/Bonding/Insurance 1 LS $3,000.00 $3,000.00
Subgrade Preparation 800 CY $4.00 $3,200.00
12” Capillary Sand Layer 1,600 CY $3.00 $4,800.00
24” ET Silt Layer 3,200 CY $4.00 $12,800.00
12” Sand Erosion & Topsoil Layer 1,600 CY $3.00 $4,800.00
Drainage Controls 1 LS $3,000.00 $3,000.00
Seed, Fertilizer, Mulch 1 AC $2,000.00 $2,000.00
Gas Venting System 1 AC $5,000.00 $5,000.00
Survey/Certification 1 AC $2,000.00 $2,000.00
Engineering/QA/Inspection 1 LS $8,000.00 $8,000.00
Closure Cost Per Acre $48,600.00
Table 9 Logan Landfill
Estimated Closure Costs Per Acre Alternative Final Cover System
Updated January 2017

26 | P a g e
The District completed construction of a 9 acre compost facility in July of 2016. This facility generally accepts approximately 1,500 cubic yards of compost per year. Closure of the compost area will consist of moving any remaining compost from the compost area to the working face of the landfill, placing six inches of topsoil amended with compost or other fertilizer, and vegetating the site with a seed/fertilizer mixture as outlined in the closure plan. It is assumed that the seed mixture will be tilled in using a tractor and an end well press drill or another acceptable seeder. The total estimated cost per acre for closing the compost area is shown in Table 10.
Activity Quantity Unit Cost/Unit Cost Move Remaining Compost 1,500 CY $2.00 $3,000.00
6” Topsoil Layer 800 CY $3.00 $2,400.00
Seed Fertilizer Mulch 1 AC $2,000.00 $2,000.00
Closure Cost Per Acre $7,400.00
Table 10 Logan Landfill
Gallatin County Landfill Estimated Closure Costs Per Acre
Compost Area Updated January 2017
District Employees Constructing the New Compost Site
July 2016

27 | P a g e
FINANCIAL ASSURANCE APPROACHES
The Montana financial assurance regulations require that the landfill financially assure for the largest planned open area during the life of the landfill. Currently, the landfill has 21.5 acres of open Class II and Class IV landfill area, and 9 acres of open compost area. Under the current master plan this is also the largest open area during the life of the landfill. The MDEQ allows two basic approaches for financial assurance. One approach is to financially assure for the largest open area during the landfill life. Under this approach, the financial assurance timeline is based on when those funds would be needed for an emergency closure. The other acceptable approach is to financially assure for the entire landfill area. Under this approach, the financial assurance timeline is the overall life of the site. This report provides cost estimates for both approaches so the County can elect the mechanism which best fits the District’s landfill.
CLOSURE COSTS & FINANCIAL ASSURANCE BASED ON OVERALL SITE
Under this approach, the financial assurance can be built over the life of the site. With each closure project the amount of the financial assurance requirement decreases. The annual financial assurance updates reflect these changes and the County can adjust the financial assurance amount over time. The total remaining Class II and Class IV landfill area to be closed with the alternative cover system consists of approximately 45 acres. The total compost area to be closed with the compost closure section is approximately 9 acres. The MDEQ requires that the financial assurance cost estimates be based on all of the work being conducted by a private contractor rather than the County or District. Therefore, it is assumed that plans, specifications and bid documents will be prepared and the project will be bid out. It is also assumed that the engineer will provide staking, compaction testing, quality assurance testing, interim and final inspections, and certifications and as-built drawings. A boundary survey needs to be completed and the deed needs to be filed at the courthouse. The estimated closure costs of the overall landfill site are depicted in Table 11. The total estimated closure cost is $2,478,960.

28 | P a g e
Activity
Quantity Unit Cost/Unit Cost
Alternative Final Cover System 45 AC $48,600 $2,187,000
Compost Area Closure 9 AC $7,400 $66,600
10% Contingency $225,360
Closure for the Entire Site 54 AC 2,478,960
CLOSURE COSTS & FINANCIAL ASSURANCE BASED ON LARGEST OPEN AREA
In this approach, financial assurance is based on the largest area open during the life of the site. Under the updated Master Plan, the current open Class II and Class IV areas of 21.5 acres and 9 acres of compost area is the largest area planned to be open during the life of the site. The estimated closure costs of this portion of the site are depicted in Table 12. The estimated closure cost is $1,222,650.
Activity
Quantity Unit Cost/Unit Cost
Alternative Final Cover System 21.5 AC $48,600 $1,044,900
Compost Area Closure 9 AC $7,400 $66,600
10% Contingency $111,150
Cost to Close Maximum Area 21.5 AC 1,222,650
Table 11 Logan Landfill Estimated Closure Costs - Closure of Entire Remainder of Site
Updated January 2017
Table 12 Logan Landfill Estimated Closure Costs – Closure of Largest Open Area
Updated March 2016

29 | P a g e
For the purposes of the financial assurance under this scenario, the County needs to examine what has already been placed in the financial assurance account versus what is needed to meet the State’s requirements.
POST-CLOSURE COSTS
In regard to the post-closure costs, the regulations require each landfill owner to monitor for methane, monitor the groundwater, have an independent Professional Engineer conduct an annual inspection, update the closure and post-closure costs annually, and maintain the cap and drainage structures for settlement, erosion, cracking or any other situation that may jeopardize the integrity of the cap or drainage controls.
The estimated costs for these items for the 30-year post-closure period are summarized in Table 13. To calculate these costs, the following assumptions were used:
The annual costs for groundwater and methane monitoring are based on the current annual monitoring costs. Groundwater monitoring costs have increased significantly with the addition of new monitoring points associated with the corrective measures assessment. Also, the proposed expansion of the license boundary to accommodate the composting area will add monitoring and testing costs. It is estimated that monitoring will cost approximately $22,000 per year during the post-closure period.
The leachate collection will require periodic inspections, periodic pumping and minor maintenance. This is estimated to cost approximately $1,500 per year.
Once annually, an independent third party Professional Engineer will inspect the site for any non-compliance or maintenance issues including the integrity of the cap, drainage, fencing, etc. The Engineer will correspondingly write a report summarizing his/her findings and recommendations. The Engineer will also prepare an updated cost estimate indicating the cost to close the site along
with the cost for the 30-year post-closure monitoring, etc. These costs will correspondingly be sent to the appropriate officials. The estimate assumes 20 hours of labor at $115 per hour and miscellaneous word processing and expenses.

30 | P a g e
It is necessary for the Owner of the facility to maintain the integrity of the cap and drainage controls. It is difficult to estimate what the annual cost to conduct this work might be several years from now. For this estimate it was assumed that once per year a contractor will provide 16 hours of equipment time to haul in and blade soil in the settled areas at $500 per hour and revegetate areas for $500 per hour.
The EPA has passed new regulations requiring annual reporting of greenhouse gas emissions. This process is currently costing the District approximately $1,500 per year for the professional services to report the annual emissions.
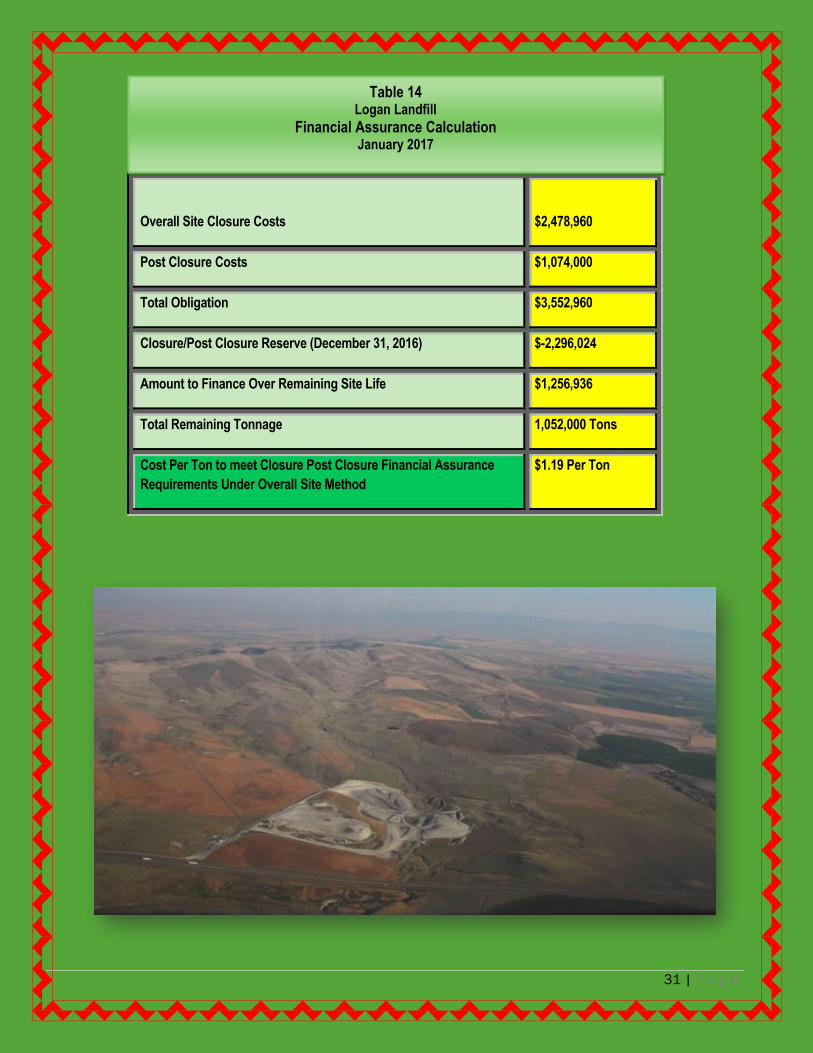
FINANCIAL ASSURANCE UPDATE BASED ON OVERALL SITE LIFE APPROACH
In October 2006, the District elected to utilize the overall site life approach to determine the financial assurance obligation. Tim Stepp, Environmental Engineer with the MDEQ agrees with the approach in correspondence. We understand that the balance in the closure/post-closure reserve is current as of December 2016. Table 14 calculates the cost per ton to meet financial assurance requirements under the overall site method.
Item Annual Cost Total
30 Year Cost
Groundwater & Methane Monitoring $22,000 $660,000
Leachate Collection System Operation & Maintenance $1,500 $45,000
Annual Engineering Inspection $2,300 $69,000
Periodic Cap and Stormwater Maintenance $8,500 $255,000
Annual Greenhouse Gas Reporting $1,500 $45,000
Total $35,800 $1,074,000
Table 13 Logan Landfill
Post-Closure Care Cost Estimate January 2017
31 | P a g e
Overall Site Closure Costs
$2,478,960
Post Closure Costs $1,074,000
Total Obligation $3,552,960
Closure/Post Closure Reserve (December 31, 2016) $-2,296,024
Amount to Finance Over Remaining Site Life $1,256,936
Total Remaining Tonnage 1,052,000 Tons
Cost Per Ton to meet Closure Post Closure Financial Assurance
Requirements Under Overall Site Method
$1.19 Per Ton
Table 14 Logan Landfill
Financial Assurance Calculation January 2017

32 | P a g e
Groundwater monitoring is conducted semiannually in July and October and results are reported according to the rules established since 1990 at the Logan Landfill. There are currently 15 monitoring wells, including two shop wells, a scale/administration building well, which is utilized for the site water supply, and three new wells were installed for the Soil Vapor Extraction Pilot Study. Additionally, samples are collected from a spring located north of Interstate 90 once a year, three residents wells, and water levels from an unused monitoring well located on the east side of the landfill are measured during every sampling event.
All downgradient wells, LMW-2, LMW-3, LMW-4, LMW-5 and the Old Shop Well have shown various levels of VOC’s over time. In 2006, due to a statistical exceedance of the MCL for tetrachloroethene in LMW-4 the landfill has been in a five-year Corrective Measures Plan (CMP) with MDEQ. The pilot program tested the effectiveness of a remediation product to address groundwater contamination at the site. The product was injected directly into the groundwater approximately six years ago and the District has been monitoring wells downgradient of the injection site since that time. The CMP approved by MDEQ requires the County reevaluate the effectiveness of the remediation product at the end of the five-year period and develop a full scale plan for remediation of the site. In 2012, in the evaluation, the product used was successful in reducing the Perchloroethylene (PCE) concentration, but there was concern in the inconsistency in groundwater data collected during the five-year program that questioned the source of the PCE. A soil gas field investigation and assessment was approved by MDEQ and conducted. It was suspected the PCE and other VOC’s occur in soil gas in the vicinity of the apparent source area of the groundwater plume. On February 10, 2014, on behalf of the District, Bruce Siegmund, Senior Hydrologist, Great West Engineering, Inc. submitted a Work Plan to MDEQ for a two-stage pilot program using a soil vapor extraction (SVE) system. On March 12, 2014, the District received a letter from John Collins, Environmental Science Specialist, Solid Waste Program, MDEQ, approving the first phase of the SVE Work Plan as proposed.
On September 15, 2014, Red Tiger Drilling and Great West Engineering, Inc. started the SVE drilling project. In October, Red Tiger Drilling completed the installation of the three wells for the SVE Pilot Study. Great West Engineering, Inc. and Olympus conducted tests on the wells on October 10, 2014.
In April 2015, the Pilot Study Report for the second phase of the Soil Vapor Extraction (SVE) System was sent to MDEQ. It was done to determine the viability of the use of SVE as a corrective measure for the Logan Class II Landfill. On June 4, 2015, John Collins,

33 | P a g e
MDEQ Environmental Science Specialist, indicated that the pilot study was successful in the second phase using a larger blower. The larger blower appeared to have had the desired effect on the three vapor extraction wells. On June 18, 2015, Great West Engineering, Inc. submitted a Work Plan for the next phase of pilot testing. On October 26, 2015, Bruce Siegmund, Senior Hydrologist, Great West Engineering, submitted a Work Plan for additional testing for Phase II. In June 2016, Great West Engineering, Inc. conducted a second phase of testing (Phase 2) over a period of about three weeks in order to develop a more-detailed understanding of several aspects of the proposed remedial application prior to deploying a larger system. Investigators tested two of the three SVE wells for radius of influence of extraction, potential rates and volumes of extraction, and chemical constituents of the soil gas over short-and long-term periods. Great West Engineering, Inc. conducted two tests on the preliminary SVE system. The first test entailed configuring the system to extract soil gas from one well for a relatively short period of time to determine the radius of influence, potential rate of contaminant removal, and discharge flow limitations. The second test, was intended to evaluate the recovery time, if any, required for VOCs to recharge to the area near the wells, to evaluate soil gas chemistry changes over a somewhat longer period of time, and observe the effects of two wells being discharged simultaneously. The MDEQ received the results from the testing. In a letter dated November 23, 2016, MDEQ reviewed the results. In summary, it measured methane concentration between the upper and lower explosive limit. This will be a major consideration in the design and permitting of a long term SVE system treatment. MDEQ looked forward to the submittal of a work plan for the expansion of the SVE system and a possible proposal to inject Dehalococcoides in the area of LMW-4. On November 18, 2016, Great West Engineering, Inc. submitted a work plan for the expansion of the SVE system Phase 3. It is based upon information developed from the Phase 2 pilot program. The investigation demonstrated the feasibility of the project and revealed elements that will need to be managed with further expansion. The Phase 3 plan includes the completion of three soil vapor extraction wells, sampling and analysis of the soil vapor, installation of transmission lines from the wells to the blower building, testing of the physical characteristics of the SVE piping, and the purchase and installation of an appropriately-sized blower and water-separator tank. The MDEQ approved the SVE system expansion as submitted. The District will submit the project schedule and submit a final construction quality assurance report within 60 days of completion of the construction.
The District solicited bids for the wells. O’Keefe Drilling was awarded the contract. The wells were completed April of 2017.
SVE Building

34 | P a g e
The Logan Landfill’s current Methane Monitoring plan follows the requirements for methane monitoring at municipal solid waste facilities in the State of Montana under ARM 17.50.511 1 (f) and (g). The methane monitoring is conducted quarterly. The points of monitoring include seven methane monitoring wells, eight passive vents, and five structures. The monitoring testing results are reported to MDEQ. In this reporting period, all monitoring results were within regulatory limits and are consistent with previous reports submitted. The District updated the Landfill’s Methane Monitoring Sample and Analysis Plan. It was submitted to Montana DEQ in October 2016.
The semi-annual Groundwater Monitoring reports were submitted to MDEQ July 2016 and October 2016. They met the requirements of the Administrative Rules of Montana Title 17, Chapter 50, Subchapter 13.
On December 2, 2016, we received approval of the District’s Sampling and Analysis Plan.
In March of 2017, Bruce Siegmund, Senior Hydrologist for Great West Engineering, Inc., the District’s agent of record, submitted the Annual Greenhouse Gas (GHG) report required by the Environmental Protection Agency (EPA) for reporting year 2017. The report was electronically sent, received, and certified.
In September of 2017, the final greenhouse gas updates regarding performance standards for new, modified and reconstructed landfills and updates to emission guidelines for exiting landfills was received by the District.
In November of 2017, MDEQ Air Quality division sent a letter regarding the new rules. The information they requested about the Logan Landfill was sent to them for review.

35 | P a g e
On March 13, 2017, the District submitted to MDEQ the application for our annual license renewal for FY 2016-2017 for Logan Landfill’s permit #158. It was renewed. It covered the period of July 1, 2016 to June 30, 2017.
In March 2017, Carrie Gardner, PE, Great West Engineering, Inc. completed the District’s Biosolids Annual Report for permit #MTG650008 for the EPA for reporting year 2016. The regulations and rules changed. The documentation is kept in Logan Landfill’s permanent records for inspections.
In March 2017, the District renewed the Federal Communication Commission (FCC) license for Logan Landfill’s site radio system.

36 | P a g e
The District submitted Logan Landfill’s 2016 Annual Compliance Evaluation Report for the storm water discharges associated with industrial activity Permit MTR00358 to MDEQ.
On April 25, 2017, the District submitted a Notice of Intent for the Multi-Sector General Permit for Storm Water Discharges Associated with Industrial Activity for our Storm Water Discharge Permit for the addition of the three wells added to the monitoring system for Phase 3 of the Soil Evaporation Extraction Project.
The District submitted Discharge Monitoring Reports for monitoring periods 6/1/2016-9/30/2016;10/1/16-12/31/16;1/1/17-3/30/17;4/1/17-6/30/17. MDEQ had an alternative method to submit the reports called NETDMR. In July, we began using the new NETDMR system to electronically submit the reports to MDEQ.
January 31, 2017, we received Amendment #3 of the District’s Stormwater Pollution Plan submitted to MDEQ.
The Gallatin Solid Waste Management District is required to operate under an Operations Manual (O&M) approved by MDEQ. Under this O&M plan are set policies, procedures, and contingency plans for emergency response in case of an incident that may occur during operations of the District’s programs. The District Manager or any other personnel present will contact the appropriate emergency response personnel in the case of injury, fire, accident, or disaster. General contingency plans are initiated by the District Manager once an employee has informed the District Manager of the situation. When emergency situations occur, a prompt, appropriate response can often limit the extent of property damage and counteract the effects of injury to personnel. Knowledge and awareness of potential hazards will be most useful in identifying causes and conditions of an emergency. The basics of the contingency plan provide for an effective emergency response: Trained personnel capable of responding to fire, poisoning, accidental injury and damage, and life threatening occurrences; safety equipment maintained in proper working order and in designated locations and; plan initial responses, assign responsibilities for
Operational & Maintenance
Plan
Safety Training
Em
erg
en
cy
Pla
ns

37 | P a g e
actions, and routinely review these plans and assignments. The District budgets for specialized training each year to keep staff educated and trained to respond.
The Figure 1, the diagram below, shows the general flow as to how the contingency plan proceeds if such an incident occurs.
Other Training in this Fiscal Year: Respirators-Appendix D 2016; Health Fair; Clean Wood/Class IV; 29 CFR 1910-134 Appendix D; Safety and Operations; Waste Acceptance, Asbestos Awareness; Emergency Response; Accident and Injury Reporting; Storm Water Pollution Plan (SWPPP); Spill Response Clean Up; Waste Facilities Economics: Challenges and Opportunities; Process Improvement for Waste Facilities; Mastering the Science of Operations; Rapid Threat Assessment HAZMAT Refresher; Battery Take Back; Detecting Workers Fraud; Slips, Trips, and Falls; MDEQ HAZWOPER; Understanding Safety Data Sheets Globally Harmonized System
Figure 1

38 | P a g e
On August 16, 2017, the Montana Department of Labor performed a random safety compliance inspection. The inspectors identified four violations that required documentation abatement. The violations were corrected. As recommended, the District is working on implementing an equipment task training program for new and current employees on safety and operation for each type of equipment.
Each year, the Montana Department of Labor and Industry, State Weights and Measures Division inspects and certifies the Logan Landfill and the Bozeman Convenience Site scales.
The Logan Landfill is subject to site inspections by the MDEQ. On March 30, 2017, the landfill was inspected by the MDEQ for compliance. One minor violation for litter was noted. The MDEQ received the landfill’s response on May 5, 2017, with photo documentation the litter had been cleaned up. On May 24, 2017, we received a letter from the MDEQ noting the violation was corrected.
The Logan Landfill and the Bozeman Convenience Site are subject to annual inspections and service of its fire extinguishing systems.
In August 2017, Kevin Babcock, First West Insurance, Loss Control Consultant, started sampling dust in the equipment and in the scalehouse. The District is monitoring for employee and customer safety. He conducted dust sampling on August 23-25th, 2016, and September 1, 2017. We are working on implementing a Hearing Conservation Program for District staff.

39 | P a g e
During Fiscal Year 2017, the operators continued to excavate soil from the Phase 4 Expansion project, for cover soil and future closure projects. Landfill operations excavated and hauled a total of 51,820 yards of soil from Phase 4. Approximately 45,000 cubic yards or more of soil will need to be excavated to prepare for the construction of Phase 4 in FY 2018. On July 8, 2016, W.E. Dust Control applied Mag Chloride on site for dust control. Montana Department of Transportation completed the chip seal project on the State’s 1.5 mile section of Two Dog Road on July 14,, 2016. Employees assisted with traffic control during the week that it took to complete the project.
On August 5, 2016, we received a letter from MDEQ regarding the Phase 4 Seismic Stability Demonstration calculations with the construction package. Great West Engineering, Inc. will complete the testing.
In August, 2016, we received $56,023.05 for the 13,384 bushels (803,060 lbs.) of Hard Red Winter Wheat harvested. The total cost to seed, spray, fertilize and harvest the crop was $59,775.41.
40 | P a g e
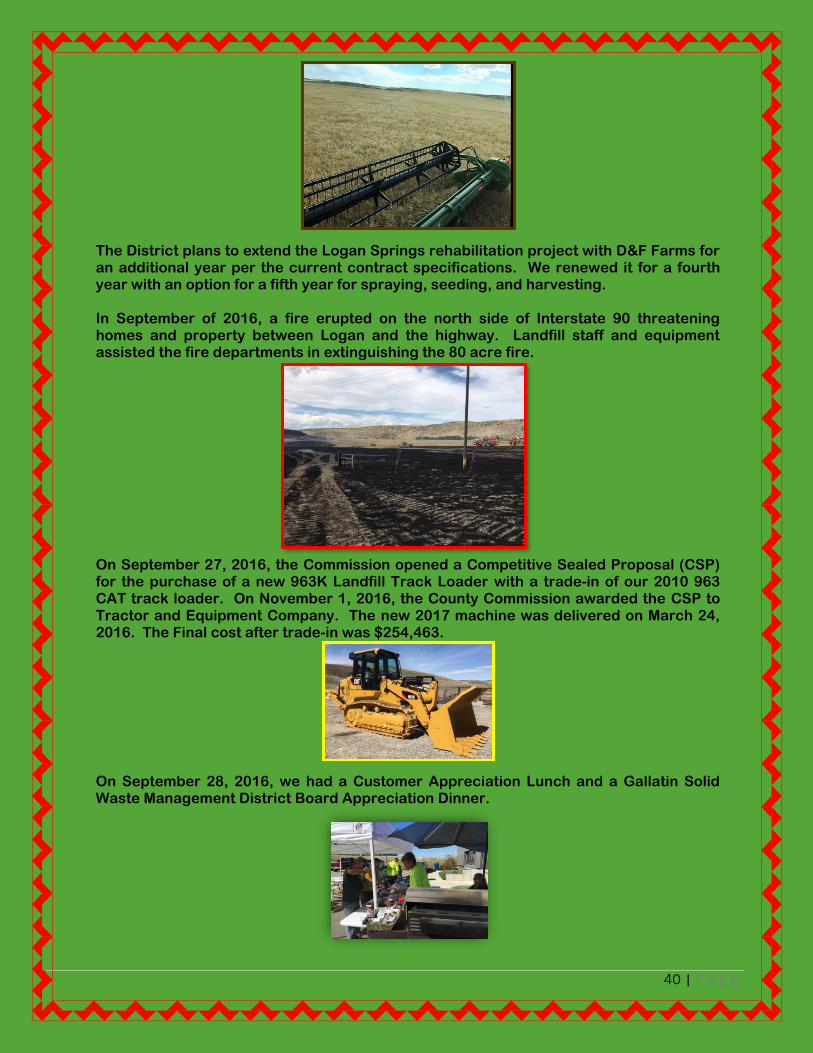
The District plans to extend the Logan Springs rehabilitation project with D&F Farms for an additional year per the current contract specifications. We renewed it for a fourth year with an option for a fifth year for spraying, seeding, and harvesting. In September of 2016, a fire erupted on the north side of Interstate 90 threatening homes and property between Logan and the highway. Landfill staff and equipment assisted the fire departments in extinguishing the 80 acre fire.
On September 27, 2016, the Commission opened a Competitive Sealed Proposal (CSP) for the purchase of a new 963K Landfill Track Loader with a trade-in of our 2010 963 CAT track loader. On November 1, 2016, the County Commission awarded the CSP to Tractor and Equipment Company. The new 2017 machine was delivered on March 24, 2016. The Final cost after trade-in was $254,463.
On September 28, 2016, we had a Customer Appreciation Lunch and a Gallatin Solid Waste Management District Board Appreciation Dinner.

41 | P a g e
On October 21, 2016, Maverick Equipment delivered a used Kenworth 4,000 gallon water truck to replace and upgrade the existing water truck. The water truck was purchased for $70,000 per the approved 2017 Fiscal Year budget. The 1992 International water truck was transferred to the Fairgrounds for their use.
In November 2016, we received a copy of the Phase 4 Seismic Demonstration completed by Great West Engineering and Tetratech. It was sent to Montana DEQ October 10, 2016, for review.
On December 13, 2016, the District received its landfill capacity update with recommendations for Phase 4 construction and for the landfill license expansion schedule.
June 1, 2017, the District received the Annual Landfill Performance Evaluation from Great West Engineering, Inc.
The County and District has worked towards a proposed land exchange with the Department of Natural Resources and Conservation (DNRC) for many years. This fiscal year many meetings were attended by Jim Simon, GSWM District Manager, Steve White, Gallatin County Commissioner, and Chris Gray, Gallatin County Attorney. They met with Craig Campbell with the DNRC who assisted in helping the District prepare a pre-application to the State Land Board. On October 21, 2013, the County Commission was presented the preliminary application for review. They agreed to send in the application with the $100 processing fee. On May 6, 2014, the application was sent to the DNRC. In June 2014, the preliminary application submitted to the DNRC and was reviewed by the State. In August 2014, the Bozeman DNRC and the District worked on developing an assessment of the properties to work on preparing information for public comment and review. On December 15, 2014, at their regular meeting of the Board of Land Commissioners, the Land Exchange Preliminary application was presented. After receiving no public comment during a 30-day period, the Montana Land Board voted unanimously to give preliminary approval of the County-State land swap for the Logan Landfill to the benefit of both governments.
History of the Gallatin County and the Solid Waste Management
District Land Exchange with the Department of Natural
Resources and Conservation

42 | P a g e
In February 2016, a draft document was presented to Gallatin County by the DNRC to initiate the land exchange between Gallatin County and State Lands (DNRC). September 6, 2016, Chris Gray, Gallatin County Attorney, submitted Gallatin County’s outline of the proposed land swap agreement with the DNRC.
The County and District will continue working with the land board to move forward in the process of the exchange in the next fiscal year.
We continue to lease out the Logan Springs property for grazing on an annual basis due to
the pending land exchange.
On February 9, 2017, we got hit hard with a snow storm that caused the Logan Landfill’s
scalehouse scales to flood. Staff worked half the night cleaning up the water. The inbound
scale had to be repaired.
On March 1, 2017, the District paid $19,168 to the DNRC to renew Land Lease #8542. It was an amendment to reissue #3 for one year. It will expire February 28, 2018. We renew annually due to the pending land exchange.

43 | P a g e
LOGAN LANDFILL
Jul '16 - Jun 17
Ordinary Income/Expense
Income
Gain (Loss) on Equip Trade In -59,580.89
Miscellaneous Revenue 56,023.05
Charges for Services-Logan
3430-42 · Disposal Charge 4,291,902.84
Total Charges for Services-Logan 4,291,902.84
Grazing Lease 2,400.00
3710-10 · Interest Earnings 123,992.30
Total Income 4,414,737.30
Gross Profit 4,414,737.30
Expense
Tax Assessments
540 · Tax Assessments 13.20
Total Tax Assessments 13.20
Personnel
110 · Salaries & Wages- Permanent 622,652.11
120 · Overtime- Permanent 33,322.04
140 · Employer Contributions 245,622.99
141 · W.C. Employer Contributions 24,416.21
Total Personnel 926,013.35
Supplies
215 · Tools and Equipment 1,163.77
210 · Office Supplies 6,209.78
220 · Operating Supplies 64,146.63
221 · Software 562.56
224 · Food 836.49

44 | P a g e
226 · Clothing & Uniforms 2,476.44
Total Supplies 75,395.67
Fuel
231 · Gas, Oil, Fuel, Grease 103,780.96
Total Fuel 103,780.96
Maintenance
230 · Repairs & Maintenance Supplies 88,603.76
232 · Tires 6,807.60
360 · General Repair & Maintenance by others 4,535.00
361 · Equipment Repairs & Maintenance 19,918.46
362 · Office Equipment Repair & Maintenance 5,404.36
Total Maintenance 125,269.18
Small Tools
235 · Small Tools 11,295.07
236 · Computer and ITS Hardware 286.69
240 · Consummable Tools 1,500.45
Total Small Tools 13,082.21
Postage
312 · Postage 1,565.43
Total Postage 1,565.43
Internet Services.
315 · Internet Services 36.00
Total Internet Services. 36.00
Printing & Duplicating
320 · Printing & Duplicating 1,228.39
Total Printing & Duplicating 1,228.39
Advertising
331 · Publications Legal Notices 247.00
337 · Advertising 2,298.80
Total Advertising 2,545.80
Dues & Subscriptions
335 · Membership Dues 1,034.00
Total Dues & Subscriptions 1,034.00
Utilities
341 · Electric Utilities 10,035.85
344 · Propane 5,011.19
345 · Telephone 20,287.66
346 · Cell phones 2,149.73
Total Utilities 37,484.43
Outside Services
350 · Professional Services 70,695.15
351 · Medical Services, Vet Services 391.00
Total Outside Services 71,086.15
Travel

45 | P a g e
370 · Travel 5,960.50
Total Travel 5,960.50
Training
380 · Training 5,410.97
Total Training 5,410.97
Insurance
510 · Property Insurance 16,382.66
513 · Liability Insurance Allocated 33,246.42
Total Insurance 49,629.08
Licenses
570 · License Fees 59,283.42
Total Licenses 59,283.42
Rent
530 · Rent 31,987.39
Total Rent 31,987.39
Administrative Fixed Costs
590 · Administrative Costs 48,921.98
Total Administrative Fixed Costs 48,921.98
Closure/Post Closure
580 · Closure/Post Closure Costs 173,220.46
Total Closure/Post Closure 173,220.46
Loan Interest Payments
620 · Loan Interest 8,231.72
Total Loan Interest Payments 8,231.72
Depreciation
830 · Depreciation 232,256.96
Total Depreciation 232,256.96
Total Expense 1,973,437.25
Net Ordinary Income 2,441,300.05
Other Income/Expense
Other Expense
Loss on Sale of Equipment 52.15
Loan payments
610 · Principal 125,000.00
615 · Principal Contra -125,000.00
Total Loan Payments 0.00
Reserve Funds
905 · Equipment/Next Cell Reserves 1,620,000.00
955 · EQUIP/NEXT CELL RESERVE CONTRA -1,620,000.00
Total Reserve Funds 0.00
Capital Improvements
930 · Improvement other than Buildings 130,362.26
935 · Improvements Contra -130,362.26
940 · Capital Expense- Machinery & Equipment 414,203.36

46 | P a g e
945 · Machinery & Equipment Contra -414,203.36
Total Capital Improvements 0.00
Total Other Expense 52.15
Net Other Income -52.15
Net Income
2,441,247.90
LOGAN LANDFILL
Jun 30, 17
ASSETS
Current Assets
Checking/Savings
Cash Operational Combined
10-1000 · Cash Operational 6,143,891.53
Total Cash Operational Combined 6,143,891.53
10-2000 · Restricted Cash - Closure Costs 2,377,598.90
10-2110 · Cash - Fixed Asset Purchases 2,259,576.60
10-2130 · Cash Reserved for Security Deposits 91,000.00
10-2210 · Loan Payment Reserve 62,500.00
10-2220 · Loan Reserve (Future Year Payment) 125,000.00
10-2230 · Reserve for Future Expansion 4,450,000.00
Total Checking/Savings 15,509,567.03
Accounts Receivable
Accounts Receivable
12-2000 · Logan Landfill 573,861.17
Total Accounts Receivable 573,861.17

47 | P a g e
Total Accounts Receivable 573,861.17
Total Current Assets 16,083,428.20
Fixed Assets
13-3000 · Loan Receivable - Law & Justice 800,000.00
Fixed Assets
18-6050 · Continuing Property Under $5000 115,997.68
18-1000 · Land 1,650,785.00
18-2000 · Buildings 1,776,013.52
18-2100 · Allow for depreciation- buildings -359,961.60
18-3000 · Intangibles 6,965.00
18-3100 · Amortization -6,965.00
18-4000 · Improvement other than buildings 2,981,109.37
18-4100 · Allow for Depreciation- Improvement other than -2,653,086.25
18-6000 · Machinery & Equipment 3,644,091.15
18-6100 · Allow for Depreciation - Machine & Equipment -1,420,860.56
18-8010 · CIP - Cell 4 Expansion 104,136.13
18-8015 · CIP - Compost Expansion 116,324.28
18-8020 · CIP - Logan Springs 127,620.82
18-8025 · CIP - Soil Vapor Extraction 108,542.20
18-8030 · CIP - Spring Rehabilitation 13,271.78
18-3035 · CIP - License Expansion 6,991.50
18-8500 · Class 4 Waste Area 35,433.23
Total Fixed Assets 6,246,408.25
Total Fixed Assets 7,046,408.25
TOTAL ASSETS 23,129,836.45
LIABILITIES & EQUITY
Liabilities
Current Liabilities
Other Current Liabilities
20-6120 · Wages Payable 18,434.27
20-6130 · Payroll Liabilities 19,467.52
20-6135 · W.C. Payroll Liability Payable 2,686.03
20-9100 · Compensated Absences Payable 7,776.90
21-4000 · Security Deposits Payable 91,000.00
Current Portion-Long Term Debt 125,000.00
Total Other Current Liabilities 264,364.72
Total Current Liabilities 264,364.72
Long Term Liabilities
23-5406 · Land Loan - Board of Investments 437,500.00
Current Portion -125,000.00
23-6000 · Closure Cost Liability 2,294,917.85
23-9000 · Compensated Absences - Non-Current 70,105.75
23-9500 · GASB 45 OPEB Net Obligation 71,497.56
Total Long Term Liabilities 2,749,021.16
48 | P a g e
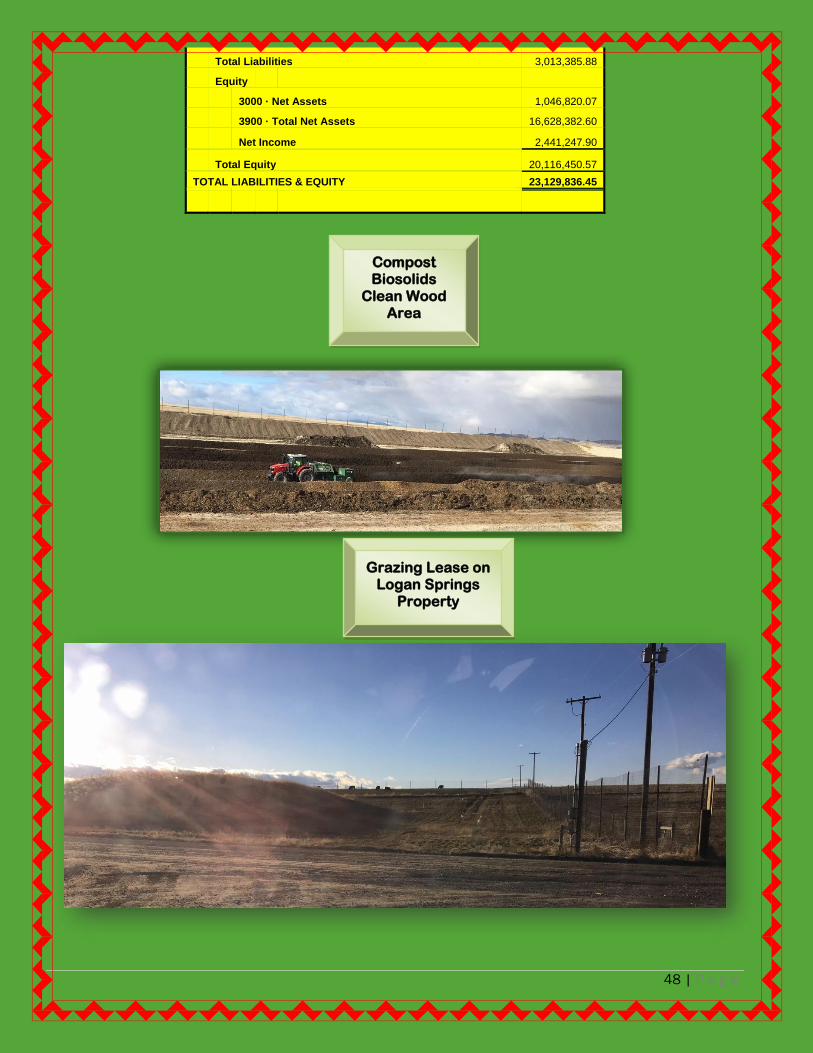
Total Liabilities 3,013,385.88
Equity
3000 · Net Assets 1,046,820.07
3900 · Total Net Assets 16,628,382.60
Net Income 2,441,247.90
Total Equity 20,116,450.57
TOTAL LIABILITIES & EQUITY 23,129,836.45
Compost Biosolids
Clean Wood Area
Grazing Lease on Logan Springs
Property

49 | P a g e
In July 2016, the site continued to experience phone and internet
connection issues. Century Link was to upgrade the bandwidth in 80-90 days.
It is still not upgraded. The site continues to have issues.
In July 2016, Brian Ritts, Gallatin Scales, was called in to look at the
scales that would not zero out. After his investigation, he found the scale
settled and is sinking because it was sited on garbage at the old City landfill.
He fixed the scale on November 22, 2016.
On October 11th through the 14th, 2016, Marks Lumber chipped the clean
wood waste at the site. 859.71 tons was hauled to the Logan Landfill for reuse.
In November 2016, the District advertised for a Request for Proposal
(RFP) for Hauling from the Bozeman Convenience Site to the Logan Landfill, due
to expire January 31, 2017. The County Commission awarded the RFP, to L&L
Site Services, January 3, 2017.
50 | P a g e
In March 2017, the District went out for quotes for the painting of the
Bozeman Convenience Site scalehouse and shed. The bid was awarded to
Storm Castle. Painting was completed in May.
May 16th and May 17th, 2017, Marks Lumber chipped the clean wood pile.
624.31 tons was hauled to the Logan Landfill for reuse.
In June 2017, the State of Montana Weights and Measures Division
inspected and certified the BCS Scale.
BOZEMAN CONVENIENCE SITE
Jul '16 - Jun 17
Ordinary Income/Expense
Income
Charges for Services-Bozeman
Disposal Charge 196,479.00
Total Charges for Services-Bozeman 196,479.00
Total Income 196,479.00
Cost of Goods Sold
80% Compost Due to City 21,943.20
Transport from Bozeman Convenience Site
Roll-off Containers 127,875.00
Stationary Compactor Containers 6,939.00
Total Transport from Bozeman Convenience Site 134,814.00
Total COGS 156,757.20
Gross Profit 39,721.80
Expense

51 | P a g e
Personnel
110 · Salaries & Wages- Permanent 22,551.62
120 · Overtime- Permanent 1,149.72
140 · Employer Contributions 11,044.56
141 · W.C. Employer Contributions 339.59
Total Personnel 35,085.49
Supplies
215 · Tools and Equipment 1,085.00
220 · Operating Supplies 962.23
226 · Clothing & Uniforms 34.50
Total Supplies 2,081.73
Maintenance
230 · Repairs & Maintenance Supplies 250.00
360 · General Repair & Maintenance by Others 2,150.00
362 · Office Equipment Repair & Maintenance 1,365.55
Total Maintenance 3,765.55
Small Tools
235 · Small Tools 1,112.01
Total Small Tools 1,112.01
Printing & Duplicating
320 · Printing & Duplicating 445.00
Total Printing & Duplicating 445.00
Utilities
341 · Electric Utilities 2,073.84
345 · Telephone 2,940.00
Total Utilities 5,013.84
Outside Services
350 · Professional Services 6,907.02
Total Outside Services 6,907.02
Insurance
513 · Liability Insurance Allocated 1,679.60
Total Insurance 1,679.60
Licenses
570 · License Fees 280.00
Total Licenses 280.00
Administrative Fixed Costs
590 · Administrative Costs 7,810.42
Total Administrative Fixed Costs 7,810.42
Depreciation
830 · Depreciation 6,992.75
Total Depreciation 6,992.75
Total Expense 71,173.41
Net Ordinary Income -31,451.61
Net Income
-31,451.61
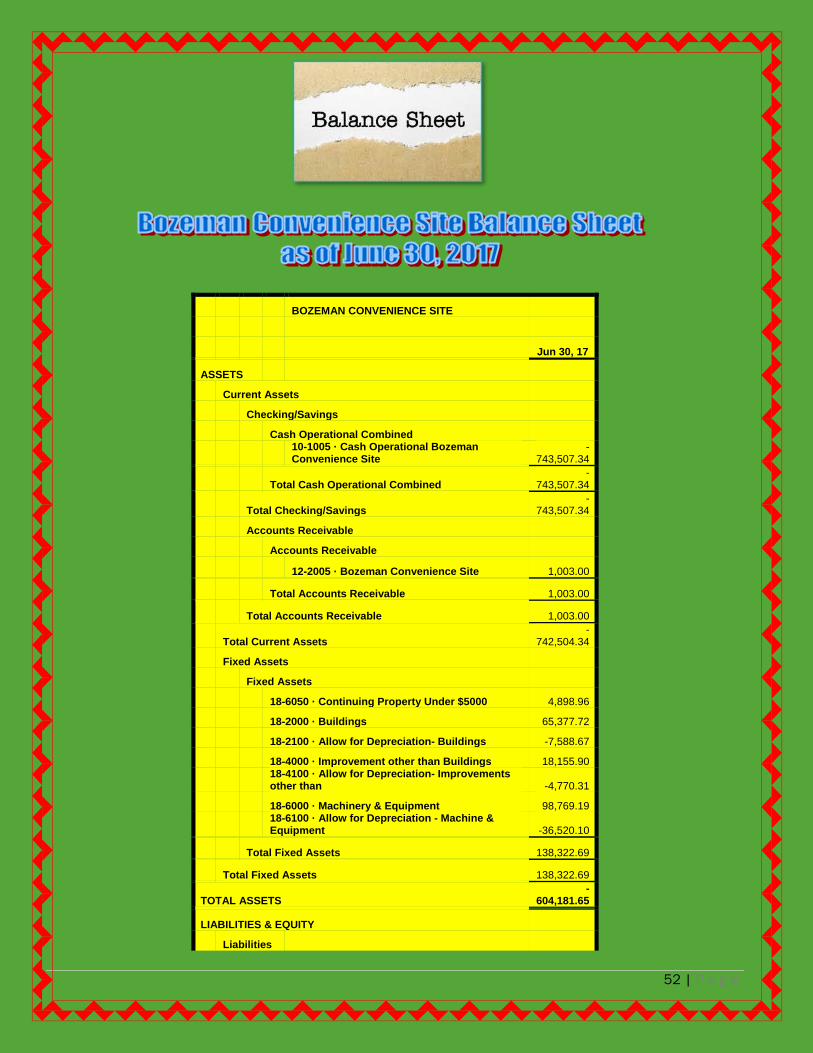
52 | P a g e
BOZEMAN CONVENIENCE SITE
Jun 30, 17
ASSETS
Current Assets
Checking/Savings
Cash Operational Combined
10-1005 · Cash Operational Bozeman Convenience Site
-743,507.34
Total Cash Operational Combined
-743,507.34
Total Checking/Savings
-743,507.34
Accounts Receivable
Accounts Receivable
12-2005 · Bozeman Convenience Site 1,003.00
Total Accounts Receivable 1,003.00
Total Accounts Receivable 1,003.00
Total Current Assets
-742,504.34
Fixed Assets
Fixed Assets
18-6050 · Continuing Property Under $5000 4,898.96
18-2000 · Buildings 65,377.72
18-2100 · Allow for Depreciation- Buildings -7,588.67
18-4000 · Improvement other than Buildings 18,155.90
18-4100 · Allow for Depreciation- Improvements other than -4,770.31
18-6000 · Machinery & Equipment 98,769.19
18-6100 · Allow for Depreciation - Machine & Equipment -36,520.10
Total Fixed Assets 138,322.69
Total Fixed Assets 138,322.69
TOTAL ASSETS -
604,181.65
LIABILITIES & EQUITY
Liabilities

53 | P a g e
Current Liabilities
Other Current Liabilities
L&LSite Services 4,875.00
City of Bozeman 7,940.00
20-6120 · Wages Payable 521.98
20-6135 · W.C. Payroll Liability Payable 34.21
20-9100 · Compensated Absences Payable 324.38
Total Other Current Liabilities 13,695.57
Total Current Liabilities 13,695.57
Long Term Liabilities
23-9000 · Compensated Absences - Non-Current 3,269.52
Total Long Term Liabilities 3,269.52
Total Liabilities 16,965.09
Equity
3900 · Total Net Assets
-589,695.13
Net Income -31,451.61
Total Equity
-621,146.74
TOTAL LIABILITIES & EQUITY -
604,181.65

54 | P a g e
The District’s recycling program began April 1, 2008. This fiscal year, the approved budget was $628,422.00. At the end of this fiscal year, we spent $567,757.22. We were under budget $60,664.78. We spent $515,213.70 the previous fiscal year.
Expenses
Budget 2016
Actual 2016
Budget 2017
Actual 2017
Hauling/Processing $280,000.00 $255,542.90 $322,000.00 $272,266.77
Wages $102,759.00 $89,332.04 $100,834.00 $66,176.68
Waste Oil Containers $15,000.00 $13,063.24 $0.00 $0.00
All Other 102,967.00 $112,852.00 $109,408.00 $94,290.95
Outside Services $115,750.00 $44,423.52 $96,408.00 $135,022.82
Total $616,476.00 $515,213.70 $628,442.00 $567,757.22
Table 14 Recycling Budget to Actual & Expenses for FY 2016 & FY 2017
TTThhheee SSSooolll iiiddd WWWaaasssttteee MMMaaannnaaagggeeemmmeeennnttt DDDiiissstttrrr iiicccttt ’’’sss ooovvveeerrraaalll lll pppuuurrrpppooossseee iiisss tttooo dddeeevvveeellloooppp aaa rrreeecccyyyccclll iiinnnggg ppprrrooogggrrraaammm aaannnddd cccooonnnttt iiinnnuuueee tttooo
mmmaaakkkeee iii ttt sssuuucccccceeessssssfffuuulll ... TTTooo rrreeeuuussseee,,, rrreeeddduuuccceee,,, rrreeecccyyycccllleee,,, aaannnddd iiinnnttteeelll lll iiigggeeennnttt lllyyy dddiiissspppooossseee ooofff wwwaaasssttteee mmmaaattteeerrr iiiaaalllsss... III tttsss MMMiiissssssiiiooonnn::: tttooo
cccooonnnssseeerrrvvveee,,, ppprrrooottteeecccttt aaannnddd ppprrreeessseeerrrvvveee ttthhheee eeennnvvviii rrrooonnnmmmeeennntttaaalll rrreeesssooouuurrrccceeesss ooofff ooouuurrr cccooommmmmmuuunnniii tttyyy ttthhhrrrooouuuggghhh aaadddvvvooocccaaacccyyy,,, eeeddduuucccaaattt iiiooonnn
aaannnddd ooouuutttrrreeeaaaccchhh ppprrrooogggrrraaammmsss iiinnn GGGaaalll lllaaattt iiinnn CCCooouuunnntttyyy...

55 | P a g e
The District budgeted $60,490 (batteries, recycling from Four Corners Recycling, metal
salvage, and e-waste) in anticipated revenue from the sale of recycled commodities. The revenue from recyclable commodities in the waste stream with existing markets was $127,280.16 which was 210% of the budgeted amount. The previous Fiscal Year’s anticipated revenue was $94,351.00, and deposited $70,370.00 in revenue or 75% of the budgeted amount. Recyclable commodity revenue prices are volatile and dependent on many outside factors such as foreign markets. Revenue prices were low in Fiscal Year 2016 and rebounded well in Fiscal Year 2017. Fiscal Year 2017 is the first year we had to pay for plastic processing at $140 per ton.
Commodities accepted at each recycling site were plastics #1 and #2. Also accepted are steel cans, aluminum cans, paper, news print, magazines, and cardboard.
Other waste diversion efforts by the District include the sale of baled metal, which is mostly from discarded appliances and other scrap metal ($82.75 per ton x 236.5 Tons = $19,572.00); battery cores mostly at $7.00 per battery. We received $795.00 from the batteries disposed of at the Logan Landfill and $42 from the batteries disposed of at the Bozeman Convenience Site. We collected 8,390 gallons of oil from both sites, of that, 2,791 gallons came from the Bozeman Convenience Site and 5,599 from the Logan Landfill. There is no revenue received. We paid Custom Recyclers $2,517.00 (.30/gal) for pickup and disposal of the oil. We disposed of 1,418 gallons of antifreeze, of that, 275 gallons came from the Bozeman Convenience Site. There is no revenue received. We paid 1,418.00 ($1/gal) to Custom Recyclers for pickup and disposal of the antifreeze.
Other recycled commodities: propane tanks (processed with the scrap metal); Freon; pesticide containers (1,205 pounds) in collaboration with the Montana Department of Agriculture (no revenue) and; bear spray canisters in collaboration with the Gallatin National Forest (no revenue).
We have a clean wood and compost program at both sites. The clean wood is chipped and used in the compost area. The Bozeman Convenience Site chipped wood is hauled to the Logan Landfill for reuse. The compost is used for cover on the landfill cells.
Processing costs for the District’s recyclables from last year’s $80 per ton changed to $81 per ton (July 1, 2016 – January 31, 2017) and $82 per ton (February 1, 2017 – June 30, 2017). The contract with Four Corners Recycling calls for a $1.00 increase per ton each year in February for each year of the three year contract. Aluminum and steel are reduced 6% for estimated loss (waste) when revenues are calculated. All commodity revenues were up this fiscal year. Tonnages were down, 258.15 tons. Plastic is reduced 8.5% for estimated loss. In Table 15,
the District’s Recycle Revenue and Tonnage compares this Fiscal Year with the previous four Fiscal Years.

56 | P a g e
Roll-off
Program
FY’ 13
Revenue
Fy’14
Revenue
FY’15
Revenue
FY’16
Revenue
FY’17
Revenue
Paper $28,832.44 $18,701.92 $20,342.52 $15,973.04 $32,987.88
Plastic $31,078.44 $17,114.93 $9,466.48 $105.24 $18,853.39
Aluminum/Steel $37,352.56 $23,871.96 $32,639.85 $22,468.63 $20,591.34
Cardboard $16,377.88 $19,436.73 $4,743.75 $3,572.79 $29,132.44
TOTALS $113,641.32 $79,125.54 $67,192.60 $42,199.70 $101,565.05
Roll-off
Program
FY’ 13
Tons
Fy’14
Tons
Fy’15
Tons
FY’16
Tons
FY’17
Tons
Paper 1,386.79 1,351.59 1,245.97 1,149.26 997.50
Plastic 286.47 301.97 305.39 280.04 235.18
Aluminum/Steel 139.31 142.94 141.16 130.32 120.01
Cardboard 1,236.37 1,482.61 1,514.46 1,588.79 1,537.57
TOTALS 3,048.94 3,279.14
3,206.98
3,148.41 2,890.26
$0.00
$5,000.00
$10,000.00
$15,000.00
$20,000.00
$25,000.00
$30,000.00
$35,000.00
$40,000.00
FY
2013
FY
2014
FY
2015
FY
2016
FY
2017
Paper
Plastic
Aluminum/Steel
Cardboard
TTaabbllee 1155
DDiissttrriicctt RReeccyyccllee RReevveennuuee aanndd TToonnnnaaggee CCoommppaarriissoonn
FFiissccaall YYeeaarrss 22001133 TThhrroouugghh 22001177
Graph 3: Five-Year Commodity Revenue Comparison FY 2013 – FY 2017
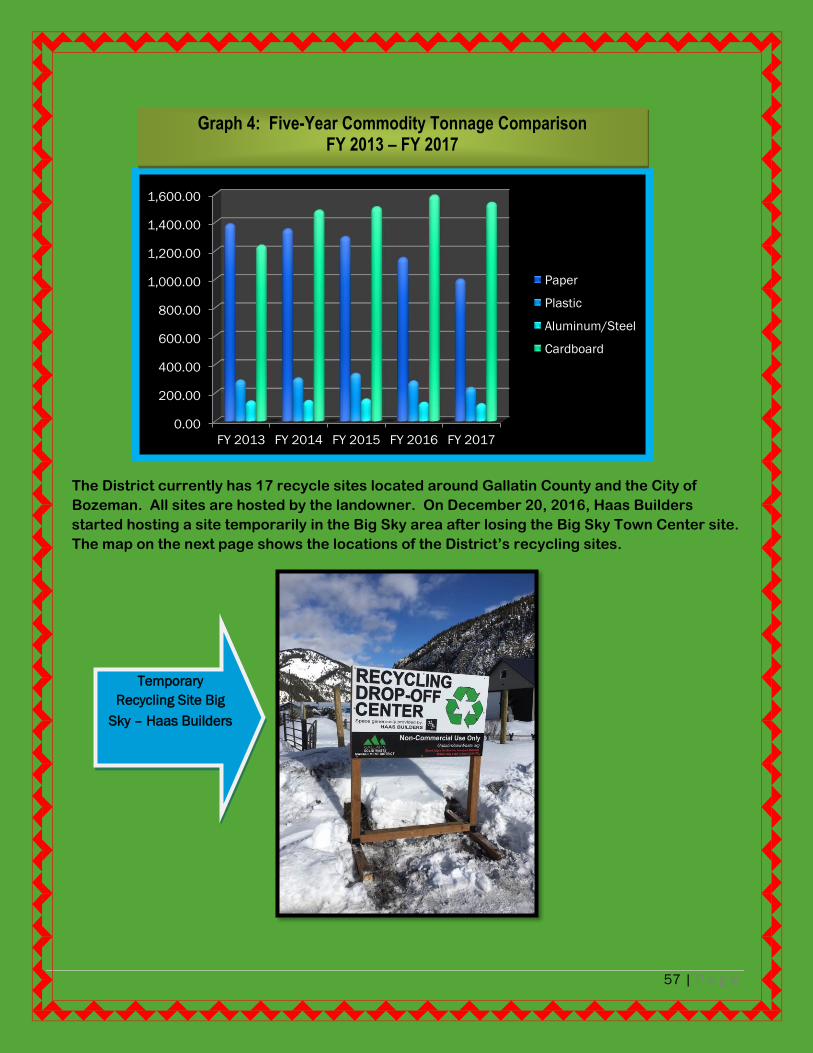
57 | P a g e
The District currently has 17 recycle sites located around Gallatin County and the City of
Bozeman. All sites are hosted by the landowner. On December 20, 2016, Haas Builders
started hosting a site temporarily in the Big Sky area after losing the Big Sky Town Center site.
The map on the next page shows the locations of the District’s recycling sites.
0.00
200.00
400.00
600.00
800.00
1,000.00
1,200.00
1,400.00
1,600.00
FY 2013 FY 2014 FY 2015 FY 2016 FY 2017
Paper
Plastic
Aluminum/Steel
Cardboard
Graph 4: Five-Year Commodity Tonnage Comparison FY 2013 – FY 2017
Temporary
Recycling Site Big
Sky – Haas Builders

58 | P a g e
Recycling Outreach Education

59 | P a g e
RRReeecccyyycccllliiinnnggg OOOuuutttrrreeeaaaccchhh EEEvvveeennntttsss
July 19-24, 2016 Gallatin County Fair
August 3, 2016 Manhattan Farmer’s Market
August 8, 2016 Three Forks Farmer’s Market
August 20, 2016 Manhattan Potato Festival
August 25-26, 2016 Catapalooza at MSU
September 7, 2016 Manhattan Farmer’s Market
September 8, 2016 Three Forks Farmer’s Market
September 10, 2016 Belgrade Fall Festival
September 20, 2016 Bogert Farmer’s Market
September 27, 2016 Bogert Farmer’s Market
October 4, 2016 Presentation to the New Energy Corps Americorps Members in Butte, Montana
October 18, 2016 Tour of the Logan Landfill for MSU Photography Students
November 15, 2016 America Recycles Day Proclamation County Commission Public Hearing
December 2, 2016 Three Forks Christmas Stroll
TThhee pprrooggrraammss eedduuccaattiioonnaall ccoommppoonneennttss aarree iinnssttrruummeennttaall ttoo rraaiissee
aawwaarreenneessss bbyy eedduuccaattiinngg aanndd iinnffoorrmmiinngg tthhee ppuubblliicc aabboouutt tthhee
iimmppoorrttaannccee ooff rreeccyycclliinngg,, wwhhaatt ccaann bbee rreeccyycclleedd,, hhooww ttoo rreedduuccee
wwaassttee,, aanndd aassssoocciiaatteedd bbeenneeffiittss.. TThhee DDiissttrriicctt iiss tteeaacchhiinngg ootthheerrss ttoo bbee
eennvviirroonnmmeennttaallllyy rreessppoonnssiibbllee iinn oorrddeerr ttoo pprrootteecctt rreessoouurrcceess iinn GGaallllaattiinn
CCoouunnttyy aanndd oouurr bbeeaauuttiiffuull SSttaattee ooff MMoonnttaannaa..
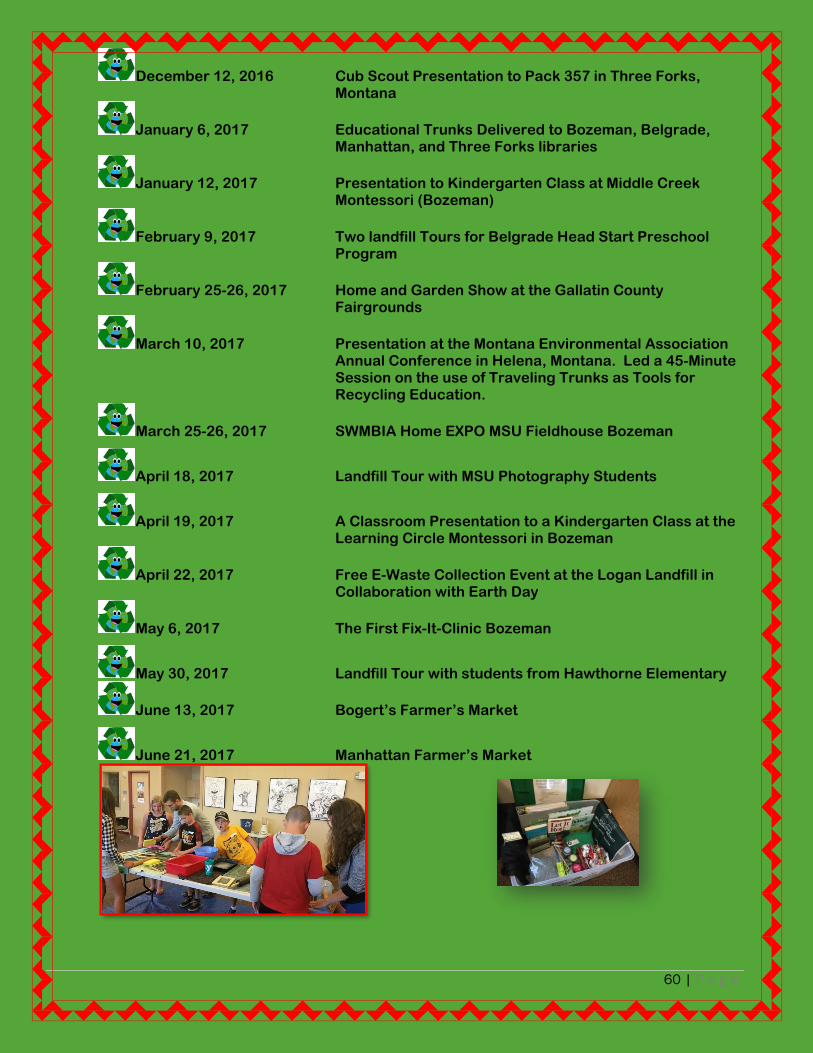
60 | P a g e
December 12, 2016 Cub Scout Presentation to Pack 357 in Three Forks, Montana
January 6, 2017 Educational Trunks Delivered to Bozeman, Belgrade, Manhattan, and Three Forks libraries
January 12, 2017 Presentation to Kindergarten Class at Middle Creek Montessori (Bozeman)
February 9, 2017 Two landfill Tours for Belgrade Head Start Preschool Program
February 25-26, 2017 Home and Garden Show at the Gallatin County Fairgrounds
March 10, 2017 Presentation at the Montana Environmental Association Annual Conference in Helena, Montana. Led a 45-Minute Session on the use of Traveling Trunks as Tools for Recycling Education.
March 25-26, 2017 SWMBIA Home EXPO MSU Fieldhouse Bozeman
April 18, 2017 Landfill Tour with MSU Photography Students
April 19, 2017 A Classroom Presentation to a Kindergarten Class at the Learning Circle Montessori in Bozeman
April 22, 2017 Free E-Waste Collection Event at the Logan Landfill in Collaboration with Earth Day
May 6, 2017 The First Fix-It-Clinic Bozeman
May 30, 2017 Landfill Tour with students from Hawthorne Elementary
June 13, 2017 Bogert’s Farmer’s Market
June 21, 2017 Manhattan Farmer’s Market

61 | P a g e
Rob Pudner, Recycling Outreach
Educator
Mini
Can Baler

62 | P a g e
The District started accepting e-waste year-round at the Logan Landfill. The fee is $27 per ton, or under 400 pounds there is a $5.00 minimum fee. The items accepted are listed in Table 16.
Table 16 Acceptable E-Waste Items Televisions Computer Monitors Power Supplies Modems
Laptops Printers Switches Printed Circuit Boards
Hard Drives Fax Machines Video Conference Stereo Components
Gaming Consoles VCRs Cable and Cords Networking Equipment
Cell Phones Radios Routers Servers
Lab Equipment Test Equipment Keyboards Mice
Flat Panel displays Computers (CPUs) DVD Players Telephones
Tape Drives Microwave Oven Digital Cameras Zip Drives
On April 22, 2017, the District held a free e-waste collection event for household residents at the Logan Landfill. It was held in conjunction with Earth Day Festivities. The District had 164 customers participate in the event from around Gallatin Valley.
Our E-waste processor from July 1, 2016 to
January 31, 2017 was ECS
Refining. January 31,
2017 to the end of the Fiscal
Year was Helena
Industries.

63 | P a g e
WASTE DIVERSION PROGRAM
Jul '16 - Jun 17
Ordinary Income/Expense
Income
Charges for Services-Logan
3430-45 · Sale of Junk or Salvage 836.16
Total Charges for Services-Logan 836.16
Charges for Services-Bozeman
Sale of Junk or Salvage 2,710.36
Total Charges for Services-Bozeman 2,710.36
Waste Diversion Revenue
Bulbs & Ballasts Tipping Fees 4,862.00
White Goods Tipping Fees 21,986.00
Compost Program Tipping Fees 56,172.00
Clean Wood Tipping Fees 35,339.00
Metal Salvage 19,572.45

64 | P a g e
E-Waste Tipping Fees 3,435.00
E-Waste Hauled Out 2,596.14
HHW 2,286.00
Total Waste Diversion Revenue 146,248.59
Recycling Revenue
Sale of Paper 32,987.88
Sale of Plastic 18,853.39
Sale of Aluminum 18,166.21
Sale of Steel 2,425.13
Sale of Cardboard 29,132.44
Total Recycling Revenue 101,565.05
Total Income 251,360.16
Cost of Goods Sold
Recycle Hauling Costs 237,414.07
359 · Recycle Plastic Processing 34,852.70
Total COGS 272,266.77
Gross Profit -20,906.61
Expense
Personnel
110 · Salaries & Wages- Permanent 44,055.82
120 · Overtime- Permanent 1,695.89
140 · Employer Contributions 19,866.88
141 · W.C. Employer Contributions 1,123.34
Total Personnel 66,741.93
Supplies
220 · Operating Supplies 15,251.72
224 · Food 85.02
Total Supplies 15,336.74
Maintenance
230 · Repairs & Maintenance Supplies 87.07
360 · General Repair & Maintenance by Others
2,172.50
Total Maintenance 2,259.57
Small Tools
235 · Small Tools 1,681.77
Total Small Tools 1,681.77
Printing & Duplicating
320 · Printing & Duplicating 3,165.50
Total Printing & Duplicating 3,165.50
Advertising
337 · Advertising 1,835.96

65 | P a g e
Total Advertising 1,835.96
Dues & Subscriptions
335 · Membership Dues
238.00
Total Dues & Subscriptions 238.00
Utilities
341 · Electric Utilities 4,240.00
346 · Cell Phones 1,176.62
Total Utilities 5,416.62
Outside Services
350 · Professional Services 135,022.82
Total Outside Services 135,022.82
Travel
370 · Travel 181.25
Total Travel 181.25
Training
380 · Training 3,500.00
Total Training 3,500.00
Insurance
513 · Liability Insurance Allocated 3,474.34
Total Insurance 3,474.34
Administrative Fixed Costs
590 · Administrative Costs 3,785.31
Total Administrative Fixed Costs 3,785.31
Depreciation
830 · Depreciation 53,415.89
Total Depreciation 53,415.89
Total Expense 296,055.70
Net Ordinary Income -316,962.31
Net Income -316,962.31

66 | P a g e
Waste Diversion Program
Fiscal Year 2017
Jun 30, 17
ASSETS
Current Assets
Checking/Savings
Cash Operational Combined
10-1010 · Cash Operational - Waste Diversion
-2,031,319.93
Total Cash operational Combined
-2,031,319.93
Total Checking/Savings
-2,031,319.93
Total Current Assets
-2,031,319.93
Fixed Assets
Fixed Assets
18-6050 · Continuing Property Under $5000 80,546.22
18-6000 · Machinery & Equipment 172,653.70
18-6100 · Allow for Depreciation - Machine & Equipment -144,181.07
Total Fixed Assets 109,018.85
Total Fixed Assets 109,018.85
TOTAL ASSETS -
1,922,301.08
LIABILITIES & EQUITY
Liabilities
Current Liabilities
Other Current Liabilities
Big Sky E-Recycling 5,582.01
Four Corners Recycling. 26,570.96
20-6120 · Wages Payable 2,018.35
20-6135 · W.C. Payroll Liability Payable 37.90
20-9100 · Compensated Absences Payable 74.73
Total Other Current Liabilities 34,283.95
Total Current Liabilities 34,283.95
Long Term Liabilities

67 | P a g e
23-9000 · Compensated Absences - Non-Current 522.19
Total Long Term Liabilities 522.19
Total Liabilities 34,806.14
Equity
3900 · Total Net Assets
-1,640,144.91
Net Income -316,962.31
Total Equity
-1,957,107.22
TOTAL LIABILITIES & EQUITY -
1,922,301.08
The Gallatin Solid Waste Management District holds a free Household Hazardous Waste (HHW)
Event open to the general public on the second Saturday of each month at the Bozeman
Convenience Site. This year we held 12 events. Businesses are charged by the types of
materials they bring for disposal. If the business has large quantities, they are referred to our
HHW contractors, Beartooth Environmental or Veolia Environmental. We had a total of 385
customers attend the events, of that, 65 were household customers and 19 commercial
businesses. We collected $2,286.00 from the businesses for the service. The District had 58
more customers than last Fiscal Year. The grand total of 4,953 HHW items were shipped and
disposed of this Fiscal Year.
For more information on the District’s HHW program, the types of HHW materials and quantities we accept, visit our website at
www.gallatinsolidwaste.org
(Click on Bozeman Convenience Site click on Household Hazardous Waste link)
We paid Beartooth Environmental $23,150.61 to properly dispose of the HHW collected at the
events compared to $11,305.07 the previous year. We paid $5,795.93 in supplies for the
program. The program does not include the District’s labor, gas, and miscellaneous
expenses for holding the events or for labor after the events to bulk and prepare the HHW
items for shipment for the HHW contractors.

68 | P a g e
The District collects and recycles fluorescent bulbs and ballasts from the HHW program, as well as collecting them at the Logan Landfill. The Environmental Protection Agency (EPA) regulates fluorescent lamps and stipulates strict guidelines for their disposal. Because they contain Mercury, spent fluorescent lamps can not be thrown in dumpsters as a solid waste. Mercury is linked to severe health issues. A single four-foot fluorescent tube contains from 5 to 50 milligrams of mercury. When conventional disposal methods are used, mercury vapors can travel over 200 miles.
The District purchased a bulb crusher in Fiscal Year 2013 to off set costs associated with the program. We receive the bulbs, crush them, and send them out in bulk to be recycled. To dispose of the bulbs, the District pays by the pound, not by the bulb or by the foot for the fluorescents, which is more cost efficient. We pay by fifty-five gallon drums. We pay $295.00 per drum, plus $75 for a pallet charge, plus transportation and fuel surcharge of .17 cents per mile. We collected 10,340 pounds of crushed bulbs for disposal. We collected eight-foot or longer bulbs at $1.00 a piece totaling $743.00 and under eight-foot bulbs at $.50 cents totaling $3,944.00. We collected through tipping fees and HHW events a total of $4,687.00 this Fiscal Year. We collected 256 ballasts. We received $351.00. We paid Aircycle Corporation $3,135.26 to transport the drums to their recycling center to properly dispose of the bulbs and ballasts. It cost us $1,551.74 after tipping fee revenue to dispose of the materials. This does not include the District’s labor for collection and crushing of the bulbs on-site across the scale in tipping fees.
The Gallatin Solid Waste District operates as an enterprise fund. Under GASB 34, an enterprise fund must be used to report activities described as business-type activities; the activity is financed with debt that is to be repaid solely with the net revenues and charges of the activity, or; laws and regulations require that costs be recovered by revenues of the activity, or; the pricing policies of the activity are designed to fully recover all costs. No tax revenues are used for District operations or capital improvements. Revenues are generated by tipping fees, the sale of recycled commodities, and interest earnings. The District’s total income for the year was $4,862,576.46. Tipping fees from Logan ($4,413,248.84) and the Bozeman Convenience Site ($196,927.00) accounted for $4,610,175.84 or over 93% of the income. Waste diversion revenue was $129,566.16. The sale of metal and batteries from the Logan landfill totaled $20,408.61. The sale of metal and batteries from the Bozeman Convenience Site totaled $2,710.36 for a total of $23,118.97, an increase of $569.17 from Fiscal Year 2016. The Recycling program commodities collected generated $101,565.05 in revenue. The grazing lease earned $2,400. Interest earnings for the year totaled $123,992.30. Interest earnings were up $29,138.63 from the previous year partially due to interest earned on a loan to the Law and Justice Center project ($23,275.00). Interest earnings are increasing as cash in the bank increases. FY 2011 ($122,930); FY 2012 ($59,555.41); FY 2013 ($60,246.89); FY
Financial Summary

69 | P a g e
2014 ($53,642.12); FY 2015 ($58,814.64); FY 2016 ($81,231.60); FY 2017 ($123,992.30). The District continues to strive to maintain its annual Fiscal Year budget.
The Equipment Reserve fund is used to pay cash for future equipment replacement. The fund balance at the end of the year was $2,259,576.60. Operational cash at the end of the year for the Logan Landfill was $6,148,220.45, and a negative <$738,889.47> for the Bozeman Convenience Site (since assuming operations on July 1, 2008), and the Waste Diversion program a negative <$2,028,222.47> (since startup on April 1, 2008). Total cash operational combined totaled $3,381,108.51. Fixed assets are $7,270,033.35. The balance at the end of the year for the District’s total assets was $20,593,689.53, an increase of $2,197,202.42 from the previous fiscal year. The required financial assurance funding for landfill closure and post closure costs had a balance of $2,377,598.90 at the end of the Fiscal Year. Total long-term liabilities at the end of the year totaled $2,725,872.66, total liabilities were $3,038,995.15. The District did not take on any new debt this Fiscal Year. Currently, the District makes a principal payment of $62,500 twice a year to the State Board of Investments for the Logan Springs Ranch property purchased in 2010. Each semi-annual payment pays $62,500 towards the principal. The interest rate is 1.55%. At the end of the Fiscal Year, we owed $437,500. The District/County is working to improve the property in anticipation of a land swap of the property in exchange for State land that we currently lease. This action is part of our plan for future expansion of the landfill.
Each year we pay rent to the Department of Natural Resource and Conservation (DNRC) for land leases used in the landfill operations: Rent for the 8-acre parcel (scalehouse and administration building) = $7,080.36. Each year the rent goes up 3%. The 40 acre parcel the landfill uses to stockpile excavated dirt costs $19,168.00. We reserved $1,200,000.00 this Fiscal Year
$0.00
$50,000.00
$100,000.00
$150,000.00
FY
2011
FY
2012
FY
2013
FY
2014
FY
2015
FY
2016
FY
2017
Interest Earnings Comparison
Graph 5

70 | P a g e
for future expansion, including Phase 4 of the Master Plan, and $420,000.00 for future equipment purchases. The landfill incurs considerable insurance that is required for permitting to keep in compliance with new rules and changes in laws. We paid $55,421.42 to MDEQ for our annual landfill permit. That was $13,702.76 higher than the last Fiscal Year due to the increase in tonnage brought in for disposal. We paid $15,944.19 (down $2,102.85 from last Fiscal Year) for our pollution insurance. That is combined with Gallatin County’s allocated liability insurance cost to us of $38,400.36, which was up $14,964.29 from last Fiscal Year. The Profit and Loss and Balance Sheets for July 1, 2016, through June 30, 2017, show the year’s revenues, operating expenditures, assets, and liabilities. We continue to bring the services our customers want, at affordable prices. This year we saw waste volumes go up 8,068.01 tons (140,152.38 total tons). Evaluating the twelve months, the increase seems attributable to the economy steadily improving with the continuing increase of construction in Gallatin Valley. Table 17 shows a five year period. Fiscal Year 2012-2013 had a decrease in tonnage. Fiscal Years 2013-2014, 2014-2015, 2015-2016, 2016-2017 had increases in tonnage.
Actual Tonnages Received Decreased Tonnage From Previous Year
Increased Tonnage From Previous Year
Fiscal Year 2012-2013 103,473.52 2,191.82
Fiscal Year 2013-2014 108,212.55 4,739.03
Fiscal Year 2014-2015 128,179.00 19,966.45
Fiscal Year 2015-2016 132,084.37 3,905.37
Fiscal Year 2016-2017 140,152.38 8,068.01
The District leases the Bozeman Convenience Site from the City of Bozeman under an Interlocal Agreement that commenced on July 1, 2008. In June of 2013, the District renewed the agreement for another five years beginning July 1, 2013. It will expire June 30, 2018. Under the agreement, the District pays the City of Bozeman for 80% of the compost being disposed of on-site to help maintain it with their equipment. The District receives 20% of the revenue. Out of the $196,479.00 tipping fees received, the District paid the City of Bozeman $21,943.20 this Fiscal Year for the compost disposed of at the Bozeman Convenience Site scale.
During the Budget process, the District has maintained a Long Range Strategic Plan for potential future capital projects based on anticipated growth rates and/or additional demands on County services. We review it each fiscal year. On the next page is this Fiscal Year’s Plan 2018-2025.
Table 17

71 | P a g e

72 | P a g e
GSWMD
Jul '16 - Jun 17
Ordinary Income/Expense
Income
Gain (Loss) on Equipment Trade In -59,580.89
Miscellaneous Revenue 56,023.05
Charges for Services-Logan
3430-42 · Disposal Charge 4,291,902.84
3430-45 · Sale of Junk or Salvage 836.16
Total Charges for Services-Logan 4,292,739.00
Grazing Lease 2,400.00
Charges for Services-Bozeman
Disposal Charge 196,479.00
Sale of Junk or Salvage 2,710.36
Total Charges for Services-Bozeman 199,189.36
Waste Diversion Revenue
Bulbs & Ballasts Tipping Fees 4,862.00
White Goods Tipping Fees 21,986.00
Compost Program Tipping Fees 56,172.00
Clean Wood Tipping Fees 35,339.00
Metal Salvage 19,572.45
E-Waste Tipping Fees 3,435.00
E-Waste Hauled Out 2,596.14
HHW 2,286.00
Total Waste Diversion Revenue 146,248.59
Recycling Revenue
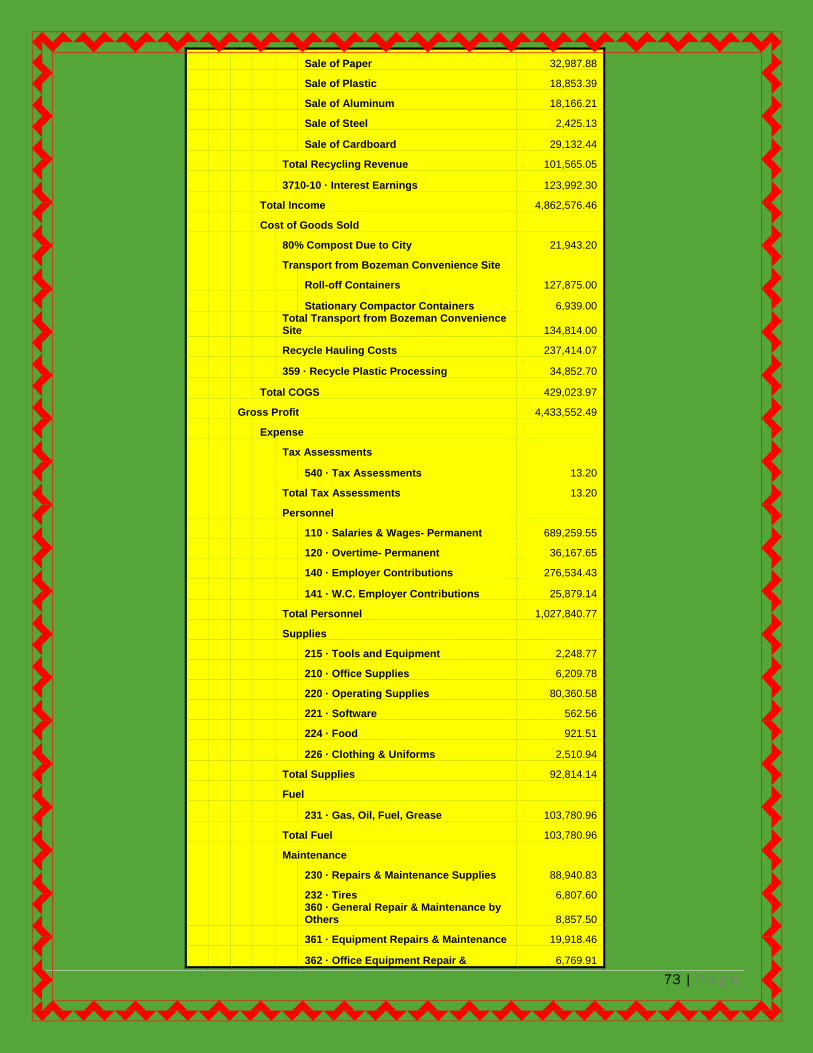
73 | P a g e
Sale of Paper 32,987.88
Sale of Plastic 18,853.39
Sale of Aluminum 18,166.21
Sale of Steel 2,425.13
Sale of Cardboard 29,132.44
Total Recycling Revenue 101,565.05
3710-10 · Interest Earnings 123,992.30
Total Income 4,862,576.46
Cost of Goods Sold
80% Compost Due to City 21,943.20
Transport from Bozeman Convenience Site
Roll-off Containers 127,875.00
Stationary Compactor Containers 6,939.00
Total Transport from Bozeman Convenience Site 134,814.00
Recycle Hauling Costs 237,414.07
359 · Recycle Plastic Processing 34,852.70
Total COGS 429,023.97
Gross Profit 4,433,552.49
Expense
Tax Assessments
540 · Tax Assessments 13.20
Total Tax Assessments 13.20
Personnel
110 · Salaries & Wages- Permanent 689,259.55
120 · Overtime- Permanent 36,167.65
140 · Employer Contributions 276,534.43
141 · W.C. Employer Contributions 25,879.14
Total Personnel 1,027,840.77
Supplies
215 · Tools and Equipment 2,248.77
210 · Office Supplies 6,209.78
220 · Operating Supplies 80,360.58
221 · Software 562.56
224 · Food 921.51
226 · Clothing & Uniforms 2,510.94
Total Supplies 92,814.14
Fuel
231 · Gas, Oil, Fuel, Grease 103,780.96
Total Fuel 103,780.96
Maintenance
230 · Repairs & Maintenance Supplies 88,940.83
232 · Tires 6,807.60
360 · General Repair & Maintenance by Others 8,857.50
361 · Equipment Repairs & Maintenance 19,918.46
362 · Office Equipment Repair & 6,769.91

74 | P a g e
Maintenance
Total Maintenance 131,294.30
Small Tools
235 · Small Tools 14,088.85
236 · Computer and ITS Hardware 286.69
240 · Consummable Tools 1,500.45
Total Small Tools 15,875.99
Postage
312 · Postage 1,565.43
Total Postage 1,565.43
Internet Services.
315 · Internet Services 36.00
Total Internet Services. 36.00
Printing & Duplicating
320 · Printing & Duplicating 4,838.89
Total Printing & Duplicating 4,838.89
Advertising
331 · Publications Legal Notices 247.00
337 · Advertising 4,134.76
Total Advertising 4,381.76
Dues & Subscriptions
335 · Membership Dues 1,272.00
Total Dues & Subscriptions 1,272.00
Utilities
341 · Electric Utilities 16,349.69
344 · Propane 5,011.19
345 · Telephone 23,227.66
346 · Cell phones 3,326.35
Total Utilities 47,914.89
Outside Services
350 · Professional Services 212,624.99
351 · Medical Services, Vet Services 391.00
Total Outside Services 213,015.99
Travel
370 · Travel 6,141.75
Total Travel 6,141.75
Training
380 · Training 8,910.97
Total Training 8,910.97
Insurance
510 · Property Insurance 16,382.66
513 · Liability Insurance Allocated 38,400.36
Total Insurance 54,783.02
Licenses
570 · License Fees 59,563.42

75 | P a g e
Total Licenses 59,563.42
Rent
530 · Rent 31,987.39
Total Rent 31,987.39
Administrative Fixed Costs
590 · Administrative Costs 60,517.71
Total Administrative Fixed Costs 60,517.71
Closure/Post Closure
580 · Closure/Post Closure Costs 173,220.46
Total Closure/Post Closure 173,220.46
Loan Interest Payments
620 · Loan Interest 8,231.72
Total Loan Interest Payments 8,231.72
Depreciation
830 · Depreciation 292,665.60
Total Depreciation 292,665.60
Total Expense 2,340,666.36
Net Ordinary Income 2,092,886.13
Other Income/Expense
Other Expense
Loss on Sale of Equipment 52.15
Loan Payments
610 · Principal 125,000.00
615 · Principal Contra -125,000.00
Total Loan payments 0.00
Reserve Funds
905 · Equipment/Next Cell Reserves 1,620,000.00
955 · EQUIP/NEXT CELL RESERVE CONTRA -1,620,000.00
Total Reserve Funds 0.00
Capital Improvements
930 · Improvement other than Buildings 130,362.26
935 · Improvements Contra -130,362.26
940 · Capital Expenditure - Machinery & Equipment 414,203.36
945 · Machinery & Equipment Contra -414,203.36
Total Capital Improvements 0.00
Total Other Expense 52.15
Net Other Income -52.15
Net Income
2,092,833.98

76 | P a g e
GSWMD Jun 30, 17
ASSETS
Current Assets
Checking/Savings
Cash Operational Combined
10-1000 · Cash Operational 6,143,891.53
10-1005 · Cash Operational-Bozeman Convenience Site -743,507.34
10-1010 · Cash Operational - Waste Diversion -2,031,319.93
Total Cash operational Combined 3,369,064.26
10-2000 · Restricted Cash - Closure Costs 2,377,598.90
10-2110 · Cash - Fixed Asset Purchases 2,259,576.60
10-2130 · Cash Reserved for Security Deposits 91,000.00
10-2210 · Loan Payment Reserve 62,500.00
10-2220 · Loan Reserve (Future Year Payment) 125,000.00
10-2230 · Reserve For Future Expansion 4,450,000.00
Total Checking/Savings 12,734,739.76
Accounts Receivable
Accounts Receivable
12-2000 · Logan Landfill 573,861.17
12-2005 · Bozeman Convenience Site 1,003.00
Total Accounts Receivable 574,864.17
Total Accounts Receivable 574,864.17
Total Current Assets 13,309,603.93
Fixed Assets
13-3000 · Loan Receivable - Law & Justice 800,000.00
Fixed Assets
18-6050 · Continuing Property Under $5,000 201,442.86
18-1000 · Land 1,650,785.00
18-2000 · Buildings 1,841,391.24
18-2100 · Allow for Depreciation- Buildings -367,550.27
18-3000 · Intangibles 6,965.00

77 | P a g e
18-3100 · Amortization -6,965.00
18-4000 · Improvement other than Buildings 2,999,265.27
18-4100 · Allow for Depreciation- Improvement Other Than -2,657,856.56
18-6000 · Machinery & Equipment 3,915,514.04
18-6100 · Allow for Depreciation - Machine & Equipment -1,601,561.73
18-8010 · CIP - Cell 4 Expansion 104,136.13
18-8015 · CIP - Compost Expansion 116,324.28
18-8020 · CIP - Logan Springs 127,620.82
18-8025 · CIP - Soil Vapor Extraction 108,542.20
18-8030 · CIP - Spring Rehabilitation 13,271.78
18-3035 · CIP - License Expansion 6,991.50
18-8500 · Class 4 Waste Area 35,433.23
Total Fixed Assets 6,493,749.79
Total Fixed Assets 7,293,749.79
TOTAL ASSETS 20,603,353.72
LIABILITIES & EQUITY
Liabilities
Current Liabilities
Other Current Liabilities
Big Sky E-Recycling 5,582.01
L&L Site Services 4,875.00
City of Bozeman 7,940.00
Four Corners Recycling. 26,570.96
20-6120 · Wages Payable 20,974.60
20-6130 · Payroll Liability 19,467.52
20-6135 · W.C. Payroll Liability Payable 2,758.14
20-9100 · Compensated Absences Payable 8,176.01
21-4000 · Security Deposits Payable 91,000.00
Current Portion-Long Term Debt 125,000.00
Total Other Current Liabilities 312,344.24
Total Current Liabilities 312,344.24
Long Term Liabilities
23-5406 · Land Loan - Board of Investments 437,500.00
Current Portion -125,000.00
23-6000 · Closure Cost Liability 2,294,917.85
23-9000 · Compensated Absences - Non-Current 73,897.46
23-9500 · GASB 45 OPEB Net Obligation 71,497.56
Total Long Term Liabilities 2,752,812.87
Total Liabilities 3,065,157.11
Equity
3000 · Net Assets 1,046,820.07
3900 · Total Net Assets 14,398,542.56
Net Income 2,092,833.98
Total Equity 17,538,196.61
TOTAL LIABILITIES & EQUITY 20,603,353.72

78 | P a g e
“We make a living by what we get,
but we make a life by what we give.”
— Winston Churchill
Thank You for Your Service
GSWMD Board Volunteers