d i n c nigeria ndic annual report and …ndic.gov.ng/files/links/part two.pdf · 2015-02-11 ·...
TRANSCRIPT

NDIC ANNUAL REPORT AND STATEMENT OF ACCOUNT 2011
123
N
D I
CNIGERIADEPOSIT
INSURANCECORPORATION
SECTION 11THE OPERATING ENVIRONMENTTHE OPERATING ENVIRONMENT
11.1 Introduction
11.2 The Monetary Policy Environment
The environment in which insured deposit-taking financial institutions operated in 2011
was greatly influenced by developments in the domestic and international economies.
These developments, to a large extent, shaped the direction of monetary and fiscal
policies in the country during the year under review. The contractionary monetary
policy, the banking reforms and the slow recovery from the global financial crisis
continued to affect the operations of the banking system during the year under review.
The purchase of non-performing loans of banks by Asset Management Corporation of
Nigeria (AMCON) and subsequent injection of fresh capital into some of the banks led
to improvement in asset quality, liquidity and capitalization of banks. The shareholders'
funds of the banking industry increased by 696.18% from N312.36 billion in 2010 to
N2,486.95 billion in 2011. However, the slow recovery of the capital market continued as
the all-share index further depreciated from its opening figure of 24,770.52 at the
beginning of the year to about 20,763.26 at the end of the year.
The Central Bank of Nigeria (CBN) in its efforts to control money supply and bring down
inflation increased the Monetary Policy Rate (MPR) six times from 6.25% to 12% between
January and December 2011. Similarly, the cash reserve ratio (CRR) and liquidity ratio
were also increased. The reason for the increase of the MPR and other monetary policy
instruments was due to the monetary authorities' commitment to achieving the
objectives of a single digit inflation regime, positive real interest rates, and ensuring
exchange rate stability. It therefore, became imperative for the CBN to embark on tight
monetary policy stance in order to neutralize the effect of increased government
expenditure in the face of dwindling external reserves.
Presented in this section is a review of the operating environment for insured financial
institutions in 2011. The environment was impacted by regulatory, macroeconomic as
well as socio-political events during the year under review.
The objectives of monetary policy in 2011 remained the attainment of internal and
external balances in the form of maintenance of price and exchange rate stability as
well as ensuring an efficient payment system. The CBN adopted various policy
measures aimed at containing growth of monetary aggregates in order to achieve
monetary and price stability. Particular attention was paid to the need to curtail the
inflationary tendencies and specifically ensure that inflation rate was maintained
within the single digit limit. To achieve the aforementioned objectives, the major
monetary policy measures in 2011 included the following:

(a) Liquidity management measures
(b) Interest rate policy
(c) Exchange rate policy
11.3 Regulatory Developments in 2011
(a) Revised Microfinance Policy Regulatory and Supervisory Framework for Nigeria
(b) Granting of New Licences to DMBs
In order to contain the growth of monetary aggregates in the year under review, the
CBN increased the liquidity ratio from 25% to 30% while the Cash Reserve Ratio (CRR)
was increased from 1% to 8% between January and December 2011.
The MPR, being the anchor rate around which all other interest rates revolved, was
increased six times during the year from 6.25% to 12% to curtail inflationary pressures.
The upward reviews of the MPR became imperative given the increased government
spending in 2011, being an election year.
A major development in the foreign exchange market in 2011 was the depreciation of
the Naira by adjusting the target official exchange rate from N150.00/ US $1.00 to
N155.00/ US $1.00 at the WDAS. That, in addition to other measures taken by the CBN to
enhance the efficiency of the foreign exchange market, was in response to pressures
on the Naira especially due to the fall in oil prices and declining external reserves.
During the year under review, various circulars/guidelines were issued by the CBN in
order to guide the operations of insured DMBs and other deposit-taking financial
institutions. The circulars/guidelines included the following:
The revised microfinance policy provided among other things three categories of
microfinance banks (MFB) and stipulated minimum capital requirements for each
category as stated below:
1. Category 1: Unit Microfinance banks - These are MFBs authorised to operate in
one location and with a minimum paid-up capital of N20 million. They are
prohibited from opening branches/cash centres.
2. Category 2: State Microfinance Banks - These are MFBs authorised to operate
within one state or the Federal Capital Territory (FCT), and with a minimum paid-
up capital of N100 million and would be allowed to open branches/cash
centres within the same state, subject to prior approval of the CBN.
3. Category 3: National Microfinance Banks - These are MFBs authorised to
operate in more than one state, including the FCT with a minimum paid-up
capital of N2 billion and would be allowed to have branches in any part of the
country, subject to prior approval of the CBN.
In compliance with its circular BSD/DIR/GEN/UBM/03/025 on the review of Universal
Banks, the CBN during the year under review granted international banking licences to
NDIC ANNUAL REPORT AND STATEMENT OF ACCOUNT 2011
124
N
D I
CNIGERIADEPOSIT
INSURANCECORPORATION

9 banks, national banking licences to 10 banks and a regional banking licence to one
bank. In addition to this, 4 banks, namely: First Bank Plc, FCMB Plc, UBA Plc and Stanbic
IBTC Plc were permitted to operate as holding companies.
The banks that were granted international banking licences and which were expected
to operate with a minimum regulatory capital of N50 billion were Access Bank Plc,
Diamond Bank Plc, Fidelity Bank Plc, First Bank Plc, First City Monument Bank (FCMB) Plc,
Guaranty Trust Bank Plc, Skye Bank Plc, Zenith Bank Plc and United Bank for Africa Plc.
Those that were granted national banking licences and whose minimum regulatory
capital would be N25 billion were Citibank Ltd, Ecobank Plc, Stanbic IBTC Plc, Standard
Chartered Ltd, Sterling Bank Plc, Unity Bank Plc, Union Bank Plc, Keystone Bank Ltd,
Mainstreet Bank Ltd, and Enterprise Bank Ltd. The regional banking licence whose
regulatory capital would be N10 billion was granted to Wema Bank Plc.
Also banking licence was granted to Jaiz Bank Plc to operate as a national non-interest
banking institution with a regulatory capital of N10 billion.
The CBN, during the year under review, introduced a policy aimed at addressing the
inherent challenges of cash-based economy. The cashless (or cash-lite) policy was
introduced to:
i) Encourage the development of an efficient payment system which w i l l b e
nationally used actively, and recognised internationally;
ii) Enhance the role of the CBN in monetary policy, financial stability and overall
economic activity;
iii) Eliminate the delays in clearing time of cheques, infrastructural bottlenecks,
sharp practices and insider abuses which characterise operations in cash-based
economies, thereby boosting economic development and reducing financial
risks;
iv) Encourage the use of e-payment as an alternative method and therefore cut
operating costs of handling cash, which eats into banks' profits and liquidity;
v) Address the problem of corruption and money laundering;
vi) Facilitate financial inclusion in the country; and
vii) Facilitate the achievement of the vision 20:2020.
The introduction of the policy was expected to demonstrate that the electronic
channels and products were secure, convenient, fast and reliable and would not have
the short comings of cash-based transactions such as bulkiness, slow transaction speed,
revenue leakages, high cost of handling cash and risk of carrying cash.
In order to facilitate the implementation of the policy, the CBN in collaboration with the
Bankers Committee, placed limits on free cash withdrawals and lodgments by
(c) Introduction of Cashless (Cash-lite) Policy
NDIC ANNUAL REPORT AND STATEMENT OF ACCOUNT 2011
125
N
D I
CNIGERIADEPOSIT
INSURANCECORPORATION

individuals and corporate organizations. Under the policy, a daily cumulative limit of
N150, 000 and N1,000,000 on free cash withdrawals and lodgments by individual and
corporate customers respectively, with DMBs would be imposed with effect from June
1, 2012. Individuals and corporate organizations making cash transactions above the
limits would be charged a penal fee of N100/ thousand and N200/ thousand,
respectively for amounts above the limits.
In addition to the above, third party cheques above N150, 000 would not be eligible for
encashment over the counter. Value for such cheques would be received through the
clearing house. According to the policy, any DMB that did not comply with the law on
the encashment of 3rd party cheques would be liable to a sanction of 10% of the face
value of the cheque or N100, 000 whichever was higher.
Another notable point in the policy was that banks would from that day discontinue
cash in transit lodgment services rendered to merchant- customers. Customers would
be expected to engage the services of the CBN licensed cash-in-transit (CIT) firms to
aid cash movement to and from their banks at mutually agreed terms and conditions.
Contraventions of the policy would attract a fine of N1.0 million per specie movement.
The CBN, during the year under review, granted Jaiz Bank Plc operating licence to
operate as a non-interest bank. StanbicIBTC Bank was also granted approval to
operate a non-interest banking window.
It is instructive to note that a non-interest bank is a bank which transacts banking
business, engages in trading, investment and commercial activities as well as the
provision of financial products and services in accordance with any established non-
interest banking principles.
Non-interest banking and finance models are broadly categorized into two:
1. Non-interest banking and finance based on Islamic commercial jurisprudence.
2. Non-interest banking and finance based on any other established non-interest
principle.
Following the licence to Jaiz Bank and approval to Stanbic IBTC to operate non-interest
banking, the NDIC further fine-tuned its framework for extending deposit insurance
cover to non-interest deposit-taking financial institutions. That was with a view to
creating a level playing field for all operators and engender confidence in the new
banking model.
(d) Granting of approval in principle to Jaiz Bank to operate a Non-Interest Bank
NDIC ANNUAL REPORT AND STATEMENT OF ACCOUNT 2011
126
N
D I
CNIGERIADEPOSIT
INSURANCECORPORATION

(e) Recapitalisation of the Intervened Banks
BANK CAPITAL INJECTED BOND FACE VALUE
A lot of efforts were put in place to ensure the recapitalization of the intervened banks
in order to meet the September 30, 2011 deadline set by the CBN. It would be recalled
that while Unity Bank Plc was able to meet its capital requirement through Rights Issue,
Wema Bank Plc became fully capitalized through Special Placements.
To ensure the recapitalization of the remaining eight intervened banks before the
deadline, merger arrangements were concluded between Equitorial Trust Bank and
Sterling Bank, Finbank and First City Monument Bank, Intercontinental Bank and Access
Bank and Ecobank and Oceanic Bank. Union Bank was recapitalized by its
shareholders and a core investor, Union Global Partners Ltd (UGPL).
Meanwhile, the financial condition of the other three intervened banks, namely:
Afribank, Springbank, and BankPHB continued to deteriorate while the former owners of
the banks made no effort to recapitalize them on or before the set deadline. Given that
situation and in the interest of depositors and the banking system, the NDIC on August 5,
2011, pursuant to the provisions of Section 39 of the NDIC Act No. 16 of 2006, and after
due consultation with the CBN and the Federal Ministry of Finance, established three
bridge banks for subsequent transfer of assets and liabilities of Afribank Plc, BankPHB Plc,
and Spring Bank Plc. The three bridge banks and the failed banks whose assets were
taken over and liabilities assumed by the bridge banks are listed as follows:
Bridge Bank Bank with Revoked Licence
Mainstreet Bank Limited - Afribank (Nigeria) Plc
Keystone Bank Limited - BankPHB Plc
Enterprise Bank Limited - Spring Bank Plc
The CBN, thereafter, revoked the operating licences of the three banks (i.e. Afribank
(Nigeria) Plc, BankPHB Plc and Spring Bank Plc) on August 5, 2011.
The three bridge banks were subsequently acquired by AMCON by purchase and
assumption transaction. Following the acquisition, AMCON injected fresh capital
through share subscription into the banks to recapitalize them. That brought the
shareholders' fund to positive position and shored up each bank's Capital Adequacy
ratio to 15%. The breakdown of Capital inflow and relative Consideration Bond issued by
AMCON to the banks are detailed in the table below:
₦'Million ₦'Million
MAINSTREET BANK LTD 318,631 433,132
KEYSTONE BANK LIMITED 296,898 403,590
ENTERPRISE BANK LIMITED 121,417 165,049
736,946 1,001,771
NDIC ANNUAL REPORT AND STATEMENT OF ACCOUNT 2011
127
N
D I
CNIGERIADEPOSIT
INSURANCECORPORATION

With the foregoing development, the number of DMBs fell from 24 to 20 by the end of
December 2011.
A new policy aimed at reforming mortgage/housing finance sector was approved in
November 2011. The policy provided, among other things, two categories of PMBs and
stipulated minimum capital requirements for each category as stated below:
Category 1: State PMBs would be allowed to operate within a state with a minimum
paid-up capital of N2.5 billion.
Category 2: National PMBs would be allowed to operates in all parts of the country with
a minimum paid-up capital of N5 billion.
The policy also provided for the development of uniform underwriting standard for
mortgage loan origination and the establishment of a mortgage refinance/liquidity
company.
The performance of the global financial markets was sluggish during the year under
review. International economic and financial conditions deteriorated as there were no
serious signs of recovery during the year. Most of the advanced economies of America
and Europe remained economically weak as the recession that started earlier in 2010
continued in 2011. Global output growth deteriorated from 5.2% in 2010 to 3.8% in 2011.
The Euro-Zone debt crisis worsened leading to their sovereign credit ratings
downgrades, change of governments and implementation of austerity measures in
seriously affected countries within the zone. As a result, unemployment and inflation
rates remained high leading to large unsustainable fiscal imbalance and low demand.
The development had a direct negative impact on the global financial system stability
and international trade in 2011.
The impact of the weak and sluggish growth of the advanced economies was
relatively contained with minimal negative effects on the Nigerian economy. That was
due to government's commitment to the implementation of the economic
transformation programme aimed at sustaining a favourable macro-economic
performance. Investors' confidence in the economy remained stable during the year
as the sovereign credit rating was within acceptable level which impacted positively
on output. The real GDP growth rate however dropped marginally to 7.36% in 2011 as
against 7.98% in 2010. Although, the growth rate was impressive, rising poverty and
unemployment remained of serious concern during the year under review.
The moderate inflationary pressure witnessed in 2010 continued into 2011 as
government's pursuit of achieving a single digit inflation rate was not realized. Apart
(f) Reform of Primary Mortgage Banks (PMBs)
11.4 The Macro-economic Environment
NDIC ANNUAL REPORT AND STATEMENT OF ACCOUNT 2011
128
N
D I
CNIGERIADEPOSIT
INSURANCECORPORATION

from the months of August and September when a single digit of 9.4% and 9.3%
respectively, was achieved, all the other months recorded a double digit inflation
figure. For example, inflation rose from 12.1% in January to 12.8% in March before
declining to 10.2%, 10.3% and 10.3% in June, September and December 2011
respectively. The year-on-year headline inflation rate stood at 10.8% in December 2011
compared with 11.8% in December 2010. Similarly, food inflation declined from 12.2% in
January to 11.0% in December and was lower than its level in the preceding 3 years.
Core inflation declined marginally from 12.1% in January to 11.6% and 10.8% in
September and December 2011 respectively. It was 10.9% in December 2010.
The Country's crude oil output increased in 2011 averaging 2.39 million barrels per day
(mbpd) compared to 2.23 million barrels per day recorded in 2010. The higher crude oil
production was facilitated by the relative success of the Federal Government's
Amnesty Programme implementation initiated in 2009 which brought relative peace to
the Niger Delta region. In line with government's commitment to a tighter fiscal stance,
the benchmark price of oil was reduced from US $ 75.0 to US $ 70 per barrel in the third
quarter of the year. However, the average spot price of Nigeria's reference crude, the
Bonny Light, at the International market rose from US $97.96 to US $113.12 in October
2011. The increases in both output and price of oil were expected to boost government
revenue.
The performance of the non-oil activities was satisfactory in 2011. Agriculture and the
Service sectors as well as the recovery in crude oil output recorded significant
improvements especially in the fourth quarter of 2011.
The average exchange rate of the Naira depreciated in all the three segments of the
market. At the WDAS market, the exchange rate opened at N151.62/US $1.00 in
January 2011 but moved up to N154.45/US$ in June 2011 and further to N158.21/US $ in
December 2011. The depreciation of the exchange rate was due to the high demand
for foreign exchange in the market resulting from the import-dependent nature of the
economy compounded by the activities of speculators.
The external reserve position as at end of December 2011 stood at US$ 32.64 billion
compared to US$ 32.34 billion recorded in 2010, indicating a slight increase of US$ 0.30
billion over the 2010 figure. At the 2011 position, the external reserve level could finance
more than six months of imports thus exceeding the six months of import required by the
West African Monetary Zone (WAMZ) arrangement.
The AMCON which commenced operation in 2010, was very visible in the Nigerian
financial system in 2011 as it acquired three DMBs that were established to take over the
assets and assume the liabilities of the failing intervened banks.
NDIC ANNUAL REPORT AND STATEMENT OF ACCOUNT 2011
6
N
D I
CNIGERIADEPOSIT
INSURANCECORPORATION
NDIC ANNUAL REPORT AND STATEMENT OF ACCOUNT 2011
129
N
D I
CNIGERIADEPOSIT
INSURANCECORPORATION

Other activities that AMCON carried out during the year under review included the
completion of the purchase of Eligible Bank Asset, (EBA) from the participating twenty
banks; an addition to second tranches bought in December 2010 and April
respectively. Total EBA's valued at N807.9 billion was purchased from the eligible
financial institutions at a discounted value of N481.9 billion under the latest acquisition.
The AMCON issued 'Series V' Bond face value of N689.2 billion as consideration for the
EBAs purchased. Also, Bond face value of N77 billion (discounted value of N54 billion)
was issued by AMCON as Financial Accommodation to Union Bank of Nigeria. That was
subject to eventual acquisition by the core investor, Union Global Partners Ltd (UGPL)
at agreed terms.
Aggregate domestic credit (net) to the economy in 2011 grew by about 24.57% over
the December 2010 level. Credit to the private sector grew by 24.24% which was higher
than the target growth rate of 23.34% for 2011. However, credit to the Federal
Government stood at 21.65% against the 29.29% target for 2011 due to government's
prudent fiscal operations.
Activities at the money market showed an upward movement in market rates during
the year under review. The average open-buy-back (OBB) rate increased to 15.50% in
December 2011 from 6.22% in January. Similarly, average call rates rose to 14.09% in
December from 6.42% in January 2011. Both lending and deposit rates of deposit
money banks also moved up during the year under review. The maximum lending rate
increased to 23.21% in December from 21.75% in January 2011. The spread between
maximum lending rate and average deposit rate was 20.12% points in December from
19.22% in June.
The Nigerian capital market experienced a decline in its activities during the period
under review. The all-share index (ASI) decreased by 16.18% from 24,770.52 in
December 2010 to 20,763.26 in December, 2011. Similarly, market capitalization also
declined by 19.2% from N6.39 trillion over the same period due partly to the delisting of
the acquired banks and sluggish recovery of the market.
The socio-political scene witnessed a lot of activities during the year under review.
Nigeria conducted the fourth democratic presidential election that ushered in Dr.
Goodluck Ebele Jonathan, (GCFR) and Architect Namadi Sambo as President and
Vice President of the Federal Republic of Nigeria respectively. Also, the fight against
corruption by Economic and Financial Crimes Commission (EFCC) continued under
the new leadership of Mr. Ibrahim Lamorde who replaced Mrs. Farida Waziri. Similar
institutions such as the Independent Corrupt Practices and other Related Offences
Commission (ICPC) and the Code of Conduct Bureau also intensified their fight against
corruption.
11.5 Socio-Political Environment
NDIC ANNUAL REPORT AND STATEMENT OF ACCOUNT 2011
130
N
D I
CNIGERIADEPOSIT
INSURANCECORPORATION

However, the year witnessed several cases of unrest, bombings and ethno-religious
challenges in various parts of the country. The Federal Government was nevertheless
on top of the situation in its efforts to find a lasting solution through dialogue, economic
measures, enhanced intelligence and other security measures in order to ensure
peace and security of lives and properties and provide a conducive environment for
investment.
Although, the poor state of the nation's infrastructure witnessed a slight improvement in
road and electricity, a lot still needed to be done to improve on the cost of doing
business. The Federal Government continued with the reforms of the power and oil and
gas sectors for improved performance, increased revenue generation and addressing
the issue of corruption in the industry. Data from the National Bureau of Statistics
showed a rise in the unemployment rate to 23.9% in 2011 from 21.4% in 2010. It was
expected that the trend would be reversed by the various job-creation initiatives of the
Federal and State Governments as well as the private sector.
The nation's banking industry witnessed improvement especially in the areas of capital
adequacy and asset quality during the year under review. That development was
largely attributable to the activities of the AMCON through the purchase of non-
performing loans within the industry and the recapitalization of the three acquired
banks.
The efforts towards financial inclusion were heightened in 2011 with the review of the
microfinance policy which aimed at improving the capital base of the microfinance
banks, thereby equipping them to perform their functions better. Also, the
commencement of non-interest banking was expected to bring more depositors on
board as potential depositors who were averse to the interest-bearing products could
now be serviced.
Presented in Table 10.1 are key macro-economic indicators as well as some specific
indicators for the banking industry. The table shows that the total assets for the industry
(inclusive of OBS) recorded an increase of 17.31% from N18.66 trillion in December 2010
to N21.89 trillion in December 2011. The total deposits within the banking industry also
grew by 13.78% from N10.84 trillion in 2010 to N12.33 trillion in 2011. The tight monetary
stance of the CBN took its toll on total loans and leases as the table shows that this item
recorded a marginal increase of 2.04% from N7.17 trillion in 2010 to N7.31 trillion in 2011.
11.6 Review of Banking Industry Performance
NDIC ANNUAL REPORT AND STATEMENT OF ACCOUNT 2011
131
N
D I
CNIGERIADEPOSIT
INSURANCECORPORATION

Macroeconomic Indicators 2005 2006 2007 2008 2009 2010 2011
GDP (₦’ Trillion at Current Market Prices)
14.57 18.22 22.91 23.84 25.49 29.50 36.53
No.
of Banks
25
25
24
24
24 24 20
Inflation (%)
11.9
8.5
6.6
15.1
12.0 11.8 10.8
Total Deposits
of Banks (N’
Trillion)
2.47
3.41
5.36
8.70
9.99 10.84 12.33
Ratio of Total Bank Deposits
to GDP (%)
16.9
18.9
23.29
33.34
39.19 36.74 33.75
Total Assets
of Banks -
inclusive of
Off-Balance Sheet
Engagement ( OBS) ( N’
Trillion)
5.46
8.14
13.01
19.26
17.52 18.66 21.89
Ratio of Total Assets of Banks
to GDP (%)
37.5 44.7 56.8 66.6 68.7 63.26 59.92
Total Loans and Leases of
Banks (N’ Trillion)
1.83 2.84 4.68 7.41 8.91 7.17 7.31
TABLE 10.1
KEY MACROECONOMIC INDICATORS
NDIC ANNUAL REPORT AND STATEMENT OF ACCOUNT 2011
132
N
D I
CNIGERIADEPOSIT
INSURANCECORPORATION

SECTION 12
FINANCIAL CONDITIONS OF INSURED DEPOSIT
MONEY BANKS IN 2011
FINANCIAL CONDITIONS OF INSURED DEPOSIT
MONEY BANKS IN 2011
12.0 Introduction
12.1 Capital Adequacy
In 2011, the banking industry recorded significant improvement in the financial
condition and performance of DMBs as revealed by all financial indicators compared
to the previous year's position. One of the major factors that accounted for the
improved performance was the adoption of Mergers and Acquisition (M&A) Strategy
by some banks. The banks that were involved in the M&A were Access Bank Plc, First
City Monument Bank Plc, Ecobank Transnational Incorporated and Sterling Bank Plc
which acquired Intercontinental Bank Plc, Finbank Plc, Oceanic Bank Plc and Equitorial
Trust Bank Limited. Consequently, the number of DMBs reduced from 24 to 20 during the
year.
The banking industry's total assets grew by 17.27%, capital adequacy ratio increased
from 4.06% to 17.71%, asset quality ratio significantly improved as the non-performing
loans to total loans ratio declined from 15.04% to 5.82% due to the purchase of non-
performing loans by the AMCON. Also the average liquidity ratio for the industry rose to
65.69% in 2011 from 51.77% in December 2010.
The banking industry capital position was strong during the year under review. While the
equity capital decreased by about 11.81% from ₦249.71 billion in December 2010 to
₦220.21 billion in 2011, the reserves increased substantially to ₦2,266 billion in 2011 from
₦179.89 billion in 2010. The adjusted shareholders' funds increased to ₦1.93 trillion in
2011 from ₦312.36 billion in 2010. Consequently, the capital adequacy ratio (CAR) of
the DMBs improved from 4.06% in December 2010 to 17.71% in December 2011. It is
noteworthy, that the improvement in the banking industry capital adequacy was
primarily due to the purchase of non-performing loans by AMCON. However, two (2)
DMBs had their capital adequacy ratio below the prudential requirement of 10%. The
average capital adequacy ratio of the two under-capitalized banks was negative
8.31%. Table 12.1 shows some statistics on DMBs capital adequacy as at 31st
December, 2011 with comparative figures as at December 2010
NDIC ANNUAL REPORT AND STATEMENT OF ACCOUNT 2011
133
N
D I
CNIGERIADEPOSIT
INSURANCECORPORATION

NDIC ANNUAL REPORT AND STATEMENT OF ACCOUNT 2011
134
N
D I
CNIGERIADEPOSIT
INSURANCECORPORATION
* Revised Source: Bank Returns
Capital Adequacy Indicators Year
2010* 2011
Total Qualifying Capital (N’ billion) 424.46 1,900.31
Adjusted Shareholders’ Funds (N’ billion) 312.36 1,934.93
Capital to Total Risk Weighted Asset Ratio (%)
4.06 17.71
Number of Banks 24 20
12.2 Asset Quality
The Asset Quality of the banking industry significantly improved during the period under
review. Table 12.2 shows the quality of assets of the industry as at 31st December 2011
relative to December 2010. The performance of asset quality for the period is further
illustrated in charts 12A and 12B.
The industry total loans stood at ₦7.31 trillion in 2011, an increase of 2.04% over the 7.16
trillion reported in 2010. The industry's volume of non-performing loans significantly
decreased by ₦651.70 billion or 60.47% from ₦1.08 trillion in December 2010 to ₦425.96
billion in December 2011. The average non-performing loans to total loan ratio
decreased from 15.04% in December 2010 to 5.82% in December 2011, signifying
improvement in the quality of assets of the banks.
₦
Item
Year
2010*
2011
Total Loans (N, billion)
7, 166.76
7,312.72
Non Performing Loans (N, billion)
1, 077.66
425.96
Ratio of Non Performing Loans to Total Loans (%)
15.04
5.82
Ratio of Non Performing Loans to Shareholder's Funds (%)
250.85
17.13
* Revised Source: Bank Returns
TABLE 12.2
ASSET QUALITY OF INSURED BANKS
TABLE 12.1
INSURED BANKS CAPITAL ADEQUACY

NDIC ANNUAL REPORT AND STATEMENT OF ACCOUNT 2011
135
N
D I
CNIGERIADEPOSIT
INSURANCECORPORATION
CHART 12A
PROPORTION OF NON PERFORMING LOANS TO TOTAL LOANS
0
2
4
6
8
10
12
14
16
18
20
2010 2011
Adjusted Shareholders’ Funds Non PerformingLoans
0
10
20
30
40
50
60
70
80
2010 2011
Total Loans
CHART 12B
RATIO OF NON PERFORMING LOANS TO SHAREHOLDERS' FUNDS
Top seven (7) DMBs in the banking industry in December 2011 accounted for 68.22% of
total loans as shown in chart 12C.
CHART 12C

NDIC ANNUAL REPORT AND STATEMENT OF ACCOUNT 2011
136
N
D I
CNIGERIADEPOSIT
INSURANCECORPORATION
12.3 Earnings and Profitability
Total operating income of the industry stood at ₦2.33 trillion in 2011, representing an
increase of 7.90% over the ₦2.16 trillion reported in 2010. Similarly, Total Operating
Expenses increased from ₦932.53 billion in December 2010 to ₦1.79 trillion in December
2011. Consequently, the industry recorded a loss of ₦6.71 billion in December 2011 as
against a profit of ₦607.34 billion recorded in December 2010. A total of nine (9) banks
reported losses at the end of 2011 which resulted in the negative Return on Assets (ROA)
as well as Return on Equity (ROE) and adversely affected the industry performance
during the period under review. The Yield on Earning Assets also dropped to 10.05% as
at December, 2011 from 11.24% as at December 2010. Table 12.3 shows selected
financial indicators of earnings and profitability as at 31st December, 2011.
*Revised
Source: Bank Returns
Indicators
Year
2010*
2011
Profit Before Tax (N, billion)
607.34
-6.71
Net Interest income (N, billion)
824.62
817.14
Non Interest income(N, billion)
462.76
845.65
Interest Expenses (N, billion)
616.31
544.21
Operating Expenses (N, billion)
932.53
1,788.37
Yield on Earning Assets (%)
11.24
10.05
Return on Equity (%) 162.98 (0.28)
Return on Assets (%) 3.91 (0.04)
TABLE 12.3
EARNINGS AND PROFITABILITY INDICATORS

NDIC ANNUAL REPORT AND STATEMENT OF ACCOUNT 2011
137
N
D I
CNIGERIADEPOSIT
INSURANCECORPORATION
Items
Year
2010* 2011
Average Liquidity Ratio 51.77 65.69
Loans and Advances to Deposit Ratio
59.23
55.95
No of Banks with Less than the 30% minimum Liquidity ratio 1 Nil
TABLE 12.4
LIQUIDITY RATIO OF INSURED BANKS AS AT DECEMEBR 2010
The maturity profile of the industry's assets and liabilities showed a cumulative
mismatch. The mismatch was recorded for all the maturity bands except those
maturing after 365 days. That implied that short-term funds were used to fund long term
investments. Out of total deposits of ₦12.33 trillion, the sum of ₦9.48 trillion or 76.86%
would mature in 30days, ₦1.52 trillion or 12.37% had maturity of between 31 to 90 days
while the remaining ₦1.33 trillion or 10.79% would mature after 91 days. The charts 12D
and 12E illustrate the maturity structure of loans and deposit liabilities as at 31st
December, 2011.
* Revised
Source: Bank Returns
12.4 Liquidity and Funds Management
The banking industry liquidity position was strong in 2011 as the average liquidity ratio
rose from 51.77% in December 2010 to 65.69% in December 2011. All the DMBs met the
minimum liquidity ratio requirement of 30% as at the end of December 2011. Table 12.4
presents the liquidity position of the DMBs for 2010 and 2011.

NDIC ANNUAL REPORT AND STATEMENT OF ACCOUNT 2011
138
N
D I
CNIGERIADEPOSIT
INSURANCECORPORATION
CHART 12 E
12.5 Sectoral Allocation Of Credit
A review of the Industry Credit Portfolio showed that the eight (8) priority sectors
accounted for 83.53% while other sectors represented 16.47% of the total credits
extended by the DMBs in 2011 as shown in Table 12.5 and the charts 12F and 12G.
CHART 12 D

NDIC ANNUAL REPORT AND STATEMENT OF ACCOUNT 2011
139
N
D I
CNIGERIADEPOSIT
INSURANCECORPORATION
CHART 12F
DEC 2011 DEC 2010
DETAILS % N'BILLION %
OIL AND GAS
1,529.84
21.03
1,304.34
18.20
MANUFACTURING
1,108.64
15.24
967.10
13.49
GENERAL
854.10
11.74
926.42
12.93
GENERAL COMMERCE
809.20
11.12
710.49
9.91
INFORMATION AND
COMMUNICATION
628.14
8.64
608.43
8.49
GOVERNMENTS
542.93
7.46
439.05
6.13
REAL ESTATE ACTIVITIES
377.33
5.19
481.11
6.71
AGRIC., FORESTRY & FISHINGS 226.13 3.11 154.02 2.15
OTHERS 1,197.44 16.47 1,575.82 21.99
TOTAL 7,273.75 100 7,166.78 100
TABLE 12.5
SECTORAL DISTRIBUTION OF CREDITS OF DMBs IN 2011
N'BILLION

NDIC ANNUAL REPORT AND STATEMENT OF ACCOUNT 2011
140
N
D I
CNIGERIADEPOSIT
INSURANCECORPORATION
CHART 12G
12.6 Level of Soundness of the DMBs In 2011
The DMBs are usually categorized into five levels of soundness, namely: A-Very Sound;
B-Sound; C-Satisfactory; D-Marginal, and E-Unsound. The Banking Industry
performance and level of soundness during the year ended 31st December, 2011
indicated that five (5) banks were in Category B, thirteen (13) banks in Category C and
two (2) banks were in Category D. There were no banks in Categories A & E as at 31st
December, 2011. The combined Total Assets of the two (2) banks in Category D stood
at ₦560.02 billion or 3.07% of the Industry Total Assets.

SECTION 13BALANCE SHEET STRUCTURE OF DEPOSIT MONEY BANKS IN 2011BALANCE SHEET STRUCTURE OF DEPOSIT MONEY BANKS IN 2011
NDIC ANNUAL REPORT AND STATEMENT OF ACCOUNT 2011
141
N
D I
CNIGERIADEPOSIT
INSURANCECORPORATION
13.0 Introduction
13.1 Insured Banks' Structure of Assets
The structure of a bank's balance sheet, which is a statement of its assets and liabilities,
reflects the riskiness of its business. It also provides the regulatory authorities a guide as
to which supervisory efforts are necessary to track the health of a bank while providing
the discerning public the information required to take informed decisions in relation to
the bank.
Banks' balance sheet structure in 2011 reflected the volatility in interest rates arising from
increases in the Monetary Policy Rates (MPR). The increases in the MPR from 6.5% to 12%
between January and December 2011, led to increases in lending and other rates.
Consequently, short term investments became more attractive than long term
investments and that led to an increase in short term investments and a reduction in
long term investments.
On the liabilities side of the balance sheet, the impact of the activities of the AMCON
was felt as the purchase of non-performing loans from banks reduced the level of
provisioning they needed to make thereby improving their reserves and by extension
the shareholders' fund. The shareholders' fund was further boosted by the injection of
funds in the three banks acquired by AMCON in August 2011.
This section presents the balance sheet structure of insured DMBs in 2011 compared to
the position in 2010 with particular reference to changes in the structure of assets and
liabilities, shareholders' funds and ownership structure as well as insured banks' deposit
liabilities.
The structure of assets of insured banks (inclusive of Off-Balance Sheet Engagements) is
as presented in Table 13.1. As shown in the table, total assets increased by 17.31
percent from ₦18.66 trillion in 2010 to ₦21.89 trillion in 2011. A cursory look at the structure
of the banks' assets shows that there was a reduction in the proportion of loans and long
term investments in 2011 than in 2010.
As a proportion of Total Assets, most of the asset categories decreased except Cash
and Due from Other Banks as well as short term investments. Cash and Due from Other
Banks comprising vault cash, balances with CBN and balances held with other banks
increased from 10.70% in 2010 to 14.21% in 2011. Also, total short term investments
increased from 6.09% in 2010 to 17.11% in 2011. There was however, no change in the
proportion of Off Balance Sheet Engagements to Total Assets which maintained the
16.83% it recorded in 2010. On the other hand, the following asset categories
decreased: Interbank Placements from 6.22 percent in 2010 to 2.61 percent in 2011;

Other Short Term Funds, comprising money at call and placement with discount
houses, from 1.66 percent in 2010 to 1.63 percent in 2011; Net loans and advances from
32.20 percent in 2010 to 29.14 percent in 2011; Total Investments, comprising
Investments in Federal Government Development Stock, Investments in Preference
Shares and Debentures of other companies and other long term securities, from 18.10
percent in 2010 to 11.64 percent in 2011; Other Assets (net) from 4.57 percent in 2010 to
3.86 percent in 2011; and Net Fixed Assets from 3.63 percent in 2010 to 2.97 percent in
2011.
NDIC ANNUAL REPORT AND STATEMENT OF ACCOUNT 2011
142
N
D I
CNIGERIADEPOSIT
INSURANCECORPORATION
TABLE 13.1
INSURED BANKS' STRUCTURE OF ASSETS
13.2 INSURED BANKS' STRUCTURE OF LIABILITIES
Table 13.2 presents the structure of liabilities of insured banks in 2011 (compared with
the figures for 2010). During the period under review, there was a quantum leap in the
proportion of Reserves to Total liabilities as it increased from 0.96% in 2010 to 10.35% in
2011. The increase in Reserves was attributable to the purchase of non-performing
loans of DMBs by the AMCON. As a result of that, the amount of provisioning for non-
performing loans reduced. Another liability category that increased, albeit slightly was
Balances with CBN (Current Account) from 0.03 percent in 2010 to 0.30 percent in 2011.
Due to Other Banks also increased from 0.22 percent in 2010 to 0.66 percent in 2011.
The remaining categories of liabilities, when expressed as a proportion of total liabilities
reduced: Total Deposits from 58.07 per cent in 2010 to 56.33 percent in 2011; Interbank
Takings from 4.82 percent in 2010 to 0.78 percent in 2011; Other Liabilities from 12
Assets
Percentage Share as at 31st December
(%)
2010 2011 Cash and Due from other banks 10.70 14.21 Inter-Bank Placements
6.22
2.61
Total Short Term Investments
6.09
17.11
Other Short Term Funds
1.66
1.63 Net Loans and Advances/Leases
32.20
29.14
Total Investment
18.10
11.64 Other Assets(Net)
4.57
3.86
Net Fixed Assets
3.63
2.97
Off-Balance Sheet Engagements
16.83
16.83
Total Assets
100
100
Total Assets (inclusive of OBS) (N’ Billion)
N18,661.27
N21,891.56
Source: Bank Returns

NDIC ANNUAL REPORT AND STATEMENT OF ACCOUNT 2011
143
N
D I
CNIGERIADEPOSIT
INSURANCECORPORATION
Liabilities
Percentage Shareas at December (%)
2010
2011
Total Deposits
58.07
56.33
Interbank Takings
4.82
0.78
Central Bank (Current Account)
0.03
0.30
Due To Other Banks
0.22
0.66
Total Certificates of Deposits
0.00
0.00
Other Liabilities
12.00
9.60
Long Term Loans
5.72
4.22
Equity Capital
1.34
1.01
Reserves
0.96
10.35
Off-Balance sheet Engagement 16.83 16.83
Total Liabilities 100 100
Total Value of Liabilities Inclusive of Off Balance Sheet Engagements
N18,661.27 N21,891.56
Source: Bank Returns
TABLE 13.2
INSURED BANKS' STRUCTURE OF LIABILITIES IN 2010 & 2011
percent in 2010 to 9.60 percent in 2011; Long term loans from 5.72 per cent in 2010 to
4.22 per cent in 2011; Equity Capital from 1.34 per cent in 2010 to 1.01 percent in 2011.
13.3 INSURED BANKS' SHAREHOLDERS' FUND
There was a significant increase in the shareholders' funds from 312.36 billion in 2010 to
₦1,934.93 billion in 2011. That was largely attributable to the activities of AMCON
through the purchase of non-performing loans from banks.
The resolution of the problem of undercapitalization through the injection of fresh
capital, mergers and acquisitions and the recapitalization of the three banks acquired
by AMCON positively impacted on the banking industry's shareholders' funds. Table
13.3 shows the shareholders' funds of DMBs in 2011 compared to the figures in 2010.
₦

Source: Bank Returns
11
Skye Bank Plc.
90.14
99.64
12
Enterprise Bank plc
(92.40)
11.87
13
Stanbic
IBTC Bank Plc
66.09
70.25
14
Standard Chartered Bank Ltd.
35.92
37.4215
Sterling Bank Plc.
21.68
27.29
16
Union Bank Plc.
(281.49)
54.25
17 United Bank for Africa Plc. 174.69 141.68
18 Unity Bank Plc. 7.43 17.99
19 Wema Bank Plc. (3.49) 11.61
20 Zenith Bank Plc. 290.80 296.04
Total 312.36 1,934.93
S/N
BANKS
SHAREHOLDERS’FUNDS
(N’ BILLION)
2010
SHAREHOLDERS’ FUNDS (N’ BILLION)
2011
1
Access Bank Nig. Plc.
167.61
187.792
Mainstreet Bank plc
(265.27)
35.82
3
Keystone Bank plc
(209.45)
45.24
4
Citibank Nigeria Ltd.
32.17
33.70
5
Diamond Bank Plc.
110.36
91.36
6
Ecobank Plc.
72.28
44.99
7
Fidelity Bank Plc.
128.62
104.88
8 First Bank of Nig. Plc. 312.21 318.789 First City Monument Bank Plc. 127.43 130.34
10 Guaranty Trust Bank Plc. 174.49 173.99
TABLE 13.3
INSURED BANKS' SHAREHOLDERS' FUNDS AS AT DECEMBER 2010 AND 2011
13.4 Ownership Structure
The ownership structure of Nigerian banks in 2011 remained diversified as in the previous
years. Table 13.4 shows that government ownership of shares was below 10% in most of
the banks. As shown in the table, Union Bank, Unity Bank and Wema Bank were the
three banks that had up to 10% government equity ownership. The three banks,
namely: Mainstreet Bank Ltd, Enterprise Bank Ltd and Keystone Bank Ltd acquired by
AMCON had 100% government equity ownership.
Also, the table shows that six out of the twenty banks had some level of foreign
ownership during the period under review. Out of that number, four banks, namely:
Citibank Ltd, Standard Chartered Bank Plc, Stanbic IBTC Plc and Union Bank Plc had
substantial foreign equity holdings in excess of 50% of total equity capital.
NDIC ANNUAL REPORT AND STATEMENT OF ACCOUNT 2011
144
N
D I
CNIGERIADEPOSIT
INSURANCECORPORATION

NDIC ANNUAL REPORT AND STATEMENT OF ACCOUNT 2011
145
N
D I
CNIGERIADEPOSIT
INSURANCECORPORATION
13.5 INSURED BANKS ASSETS BY MARKET SHARE
As in previous years, the oligopolistic tendencies remained in the industry as assets were
concentrated among the larger banks. Out of total assets (excluding OBS) of ₦18.20
trillion as at end of December 2011, the assets of the top five (5) DMBs, amounted to
₦9.59 trillion representing 52.67% of the total assets of all the banks compared to its level
of ₦7.47 trillion or 48.26% of the total assets of the industry in 2010. The table also shows
that the assets of the top ten (10) DMBs stood at ₦14.17 trillion, representing 77.83% of
the total assets of the industry as at the end of December 2011 compared to ₦11.01
trillion, representing 71.08% in 2010. The remaining ten banks had assets to the tune of
₦4.03 trillion, which represented 22.17% of total assets as at the end of December 2011
as against ₦4.48 trillion, representing 22.17 % of total industry assets in 2010. Table 13.5
and Chart 13A present the market share by asset of DMBs in 2011.
S/N
BANKS
OWNERSHIP STRUCTURE (%)
GOVT. PRIVATE
(NIGERIAN)FOREIGN
1 Access Bank Plc 1 99 -
2 Citibank Nig Ltd - 18.1 81.9
3 Diamond Bank Plc - 100 4 Ecobank Plc - 100 5 Enterprise Bank 100 - -
6 Fidelity Bank 100 7 First Bank Plc - 100 -8
First City Monument Bank
100
-
9
Guaranty Trust
-
100
-
10
Keystone Bank
100
-
-
11
Mainstreet Bank
100
-
12
Standard Chartered Bank Nig Ltd
-
-
100
13
Skye Bank Plc
1
50
49
14
Stanbic IBTC Bank
Plc
-
47.31
52.69
15 Sterling Bank Plc 2.55 78.64 18.8
16 United Bank for Africa Plc 2.77 97.23 -
17 Union Bank Plc 19 21 60
18 Unity Bank Plc 35 65 -
19 Wema Bank Plc 10 90 -
20 Zenith Bank Plc 2.8 97.18 -
TABLE 13.4
INSURED BANKS' OWNERSHIP STRUCTURE AS AT DECEMBER 31, 2011
Source: Bank Returns

13.6 Insured Banks' Deposit Liabilities by Type, Market Share and Tenor
Bank deposits usually constitute the largest component of the liability of a bank's
balance sheet. An analysis of the types and sizes of deposits mobilised by banks would
reveal the relative effectiveness of asset/liability management in the financial
institutions. As had been the trend over the years, total deposit liabilities of insured banks
increased from ₦10.84 trillion as at December 2010 to ₦12.33 trillion as at December 31,
2011, representing an increase of 13.75%. Several reasons could account for the
NDIC ANNUAL REPORT AND STATEMENT OF ACCOUNT 2011
146
N
D I
CNIGERIADEPOSIT
INSURANCECORPORATION
Bank
2010 2011
Assets (N’ Billion)
(%) of Total
Assets ( N’ Billion)
(%)of Total
Top 5 7,471.42 48.26 9,586.8 52.67
Top10 11,005.88 71.08 14,166.77 77.83
All Other Banks 4,478.51 28.92 4,034.70 22.17
TABLE 13.5
SIZE OF ASSETS OF TOP INSURED BANKS
Source: Bank Returns
CHARTS 13A
ANALYSIS OF ASSETS HELD BY INSURED BANKS IN 2011

significant increase in deposit liabilities of insured banks. Amongst these were
improvement in service delivery, innovative and aggressive deposit mobilization by
insured banks, increase in the number of Automated Teller Machines (ATMs) in strategic
locations, the introduction of new products as well as the sanitisation efforts of the
Regulatory Authorities. Table 13.6 and Chart 13B give the analysis of the total deposit
liabilities of insured banks as at December 2011 with comparative figures for 2010.
As shown in Table 13.6 and Chart 13B, savings deposits in insured banks increased by
₦271.16 billion or 16.9%, from ₦1.60 trillion as at December 2010 to ₦1.87 trillion as at
December 2011. A further analysis of the situation in 2011 vis-à-vis 2010 revealed that
savings deposits increased not only in absolute terms but as a proportion of total
deposits. While savings deposits constituted 14.8% of total deposits in 2010, that
category of deposits was 15.16% of total deposits in 2011. Demand deposits of insured
banks amounted to ₦7.63 trillion and accounted for 61.91% of banks' total deposit
liabilities as at December 31, 2011. Demand deposit liabilities increased both in
absolute terms and as a proportion of total deposit. That category of deposits
increased significantly by ₦3.12 trillion or 69.04% from ₦4.52 trillion (41.7%) as at
December 31, 2010 to ₦7.63 trillion (61.91%) as at December 31, 2011. Time/term
deposits in insured banks decreased both in absolute terms and as a proportion of total
deposits. Time/term deposits decreased by ₦1.89 trillion from ₦4.72 trillion in December
2010 to ₦2.83 trillion as at December 2011. As a proportion of total deposits, time/term
deposits also decreased from 43.5% as at the end of 2010 to 22.93% as at the end of
December 2011.
13.6.1 Deposit Liabilities by Type
NDIC ANNUAL REPORT AND STATEMENT OF ACCOUNT 2011
147
N
D I
CNIGERIADEPOSIT
INSURANCECORPORATION
Type of Deposit
Liabilities
2010
2011
Amount
(=N=’M)
Percentage
of Total (%)
Amount
(=N=’M)
Percentage
of Total (%)
Savings Deposits
1,598,517.25
14.8
1,869,677.19 15.16
Demand
Deposits*
4,515,167.62
41.7
7,632,847.12 61.91
Time/Term
Deposits 4,723,459.18
43.5
2,827,739.47 22.93
TOTAL 10,837,144.06 100.00 12,330,263.78 100.00
TABLE 13.6
COMPOSITION OF TOTAL DEPOSIT LIABILITIES OF INSURED BANKS IN 2010 AND 2011
Source: Bank Returns
* Included in Demand Deposits are Electronic Purse, Domiciliary Accounts and Other Deposits, Certificates and Notes

NDIC ANNUAL REPORT AND STATEMENT OF ACCOUNT 2011
148
N
D I
CNIGERIADEPOSIT
INSURANCECORPORATION
*Included in Demand Deposits are Electronic Purse, Domiciliary Accounts, and Other
Deposits & Cert. & Notes.
CHART 13B
13.6.2 Deposit Liabilities by Market Share
The market share of deposit of the top five and top ten banks increased during the year
under review. Out of the total deposit liabilities of ₦12.33 trillion in 2011, the deposits of
the top five banks amounted to ₦6.49 trillion or 52.6% of the total deposits as against
46.7% held by the top five banks in 2010. Furthermore, deposit liabilities generated by
the top ten (10) banks stood at ₦9.70 trillion or 78.7% of the total deposit liabilities of all
insured banks as at December 2011 in contrast to 70.1% as at December 2010. The
remaining 15 DMBs held only 47.4% of total industry's deposit as at 31st December, 2011.
Table 13.7 and Chart 13C present the market share of deposit of the top 5 and Top 10
banks in 2011.

NDIC ANNUAL REPORT AND STATEMENT OF ACCOUNT 2011
149
N
D I
CNIGERIADEPOSIT
INSURANCECORPORATION
Banks
2010 2011
Deposits
(N’Billion)
Percentage of
Total (%)
Deposits
(N’ Billion)
Percentage of
Total (%)
Top Five Banks
5,056.15
46.7
6,486.26
52.6
Top Ten Banks
7,598.82
70.10
9,703.25
78.7
All Other Banks 3,238.32 29.90 2,627.01 21.3
TABLE 13.7
ANALYSIS OF DEPOSIT LIABILITIES HELD BY THE BIG INSURED BANKS
Source: Bank Returns
CHART 13C
13.6.3 Deposit Liabilities by Tenor
The total deposit liabilities of banks by tenor for 2011 and the comparative figures for
2010 are presented in Table 13.8 and Chart 13D. From the table, short-term deposits of
below 30 days increased in absolute terms from ₦8.10 trillion in 2010 to ₦9.48 trillion in
2011, representing an increase of 17.1%. Similarly, as a proportion of total deposits,
short-term deposits of below 30 days increased slightly from 76.30% in December 2010
to 76.86% in 2011. Deposits of between 31 and 90 days increased marginally from
₦1,524.30 billion in 2010 to ₦1,524.72 billion in 2011. However, as a proportion of total
deposits, it recorded a decrease from 14.4% in 2010 to 12.37% in 2011.

Deposits with tenor of between 91 and 180 days increased both in absolute term and as
a percentage of total deposit liabilities from ₦356.45 billion or 3.4% in 2010 to ₦548.80
billion or 4.45% in 2011. Deposits with tenor of between 181 and 365 days increased
marginally from ₦301.32 billion or 2.8% in 2010 to ₦510.29 billion or 4.14% in 2011. Long-
term funds of more than 365 days' duration (one year), however, declined both in
absolute terms and as a percentage of total deposit liabilities from ₦332.31 billion or
3.10% as at December 31, 2010 to ₦270.01 billion or 2.18% as at December 31, 2011.
The analysis of insured banks' deposits by tenor shows that depositors preferred to keep
their funds in short-term deposits with roll-over options, than keeping their funds for a
longer tenor in order to hedge against the volatility of interest rates.
NDIC ANNUAL REPORT AND STATEMENT OF ACCOUNT 2011
150
N
D I
CNIGERIADEPOSIT
INSURANCECORPORATION
Types of Deposits
2010 2011
Amount (N’M)
Percentage of Total
(%)
Amount ( N’M)
Percentage of Total
(%)
Below 30 Days
8,095,768.03
76.30
9,476,428.75 76.86
Between 31 and 90 Days
1,524,308.78
14.4
1,524,723.04 12.37
Between 91 and 180 Days
356,454.67
3.4
548,806.39 4.45
Between 181 and 365 Days
301,321.54
2.8
510,295.62 4.14
Above 365 Days 332,318.88 3.1 270,009.98 2.18
TOTAL 10,837,144.06 100 12,330,263.78 100
TABLE 13.8
ANALYSIS OF INSURED BANKS' DEPOSITS BY TENOR
CHART 13D

NDIC ANNUAL REPORT AND STATEMENT OF ACCOUNT 2011
151
N
D I
CNIGERIADEPOSIT
INSURANCECORPORATION
SECTION 14
INSURED BANKS REPORT ON FRAUDS/FORGERIES AND
FIDELITY BOND INSURANCE COVER
INSURED BANKS REPORT ON FRAUDS/FORGERIES AND
FIDELITY BOND INSURANCE COVER
14.0 Introduction
14.1 FRAUDS AND FORGERIES IN INSURED BANKS IN 2011
Sections 35 and 36 of the Nigeria Deposit Insurance Corporation (NDIC) Act No. 16 of
2006 provides for the rendition of monthly returns by all insured deposit money banks
(DMBs) on frauds and forgeries as well as the notification of the NDIC of any dismissal or
termination of staff on the grounds of frauds or financial malpractice.
This section presents the report on cases of frauds and forgeries in the banking industry
in the country in 2011. The section further provides information on the nature of the
cases reported as well as the number and categories of staff involved. The section is
concluded with a report on insured DMBs compliance with fidelity bond insurance
cover during the year under review.
A total of 2,352 fraud cases involving the sum of ₦28.40 billion with
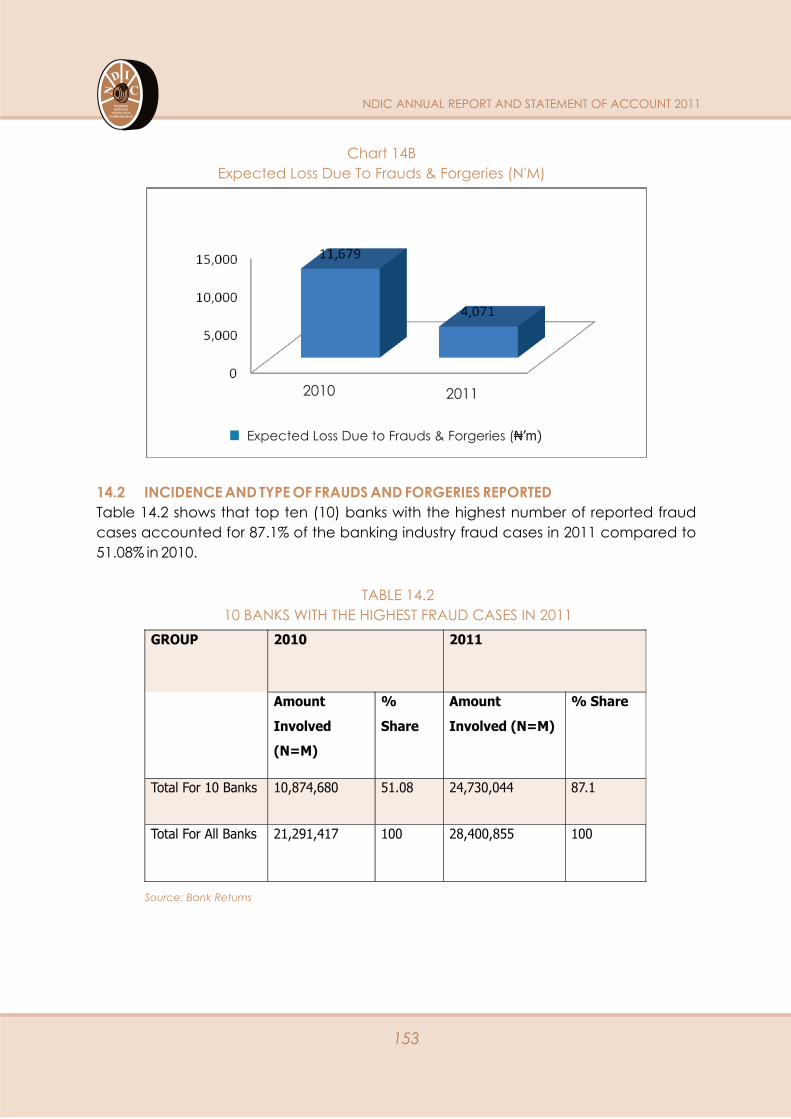
expected/contingent loss of about ₦4.071 billion were reported by DMBs in 2011. That
was an increase of 53.5% in 2011 over the number of reported fraud cases of 1532 in
2010. Although, the amount of frauds and forgeries increased by 33.40% from ₦21.29
billion in 2010 to ₦28.40 billion in 2011, the expected loss decreased by 65% from ₦11.68
billion in 2010 to ₦4.07 billion in 2011. Table 14.1 and Charts 14A and 14B presents returns
of insured banks on frauds and forgeries during the year under review.
Quarter
Year
Total No.
of
Fraud
Cases
(N’m)
Total
Amount
Involved
(N’m)
Total
Expected
Loss (N’m)
Proportion of
Expected Loss
To Amount
Involved (%)
1st 2011 612 2,301 837 36.38
2010
325
4,671
1,757
37.62
2nd
2011
509
3,807
654
17.18
2010
232
4,206
2,767
65.79
3rd
2011
577
2,207
776
35.16
2010
403
8,300
6,438
77.57
TABLE 14.1
RETURNS OF INSURED BANKS ON FRAUDS AND FORGERIES IN 2011

4th 2011 654 20,085 1,805 8.99
2010 572 4.114 717 17.43
Average/Total 2011 2,352 28,400.86 4,071 14.33
2010 1,532 21,291.41 11,679 54.85
NDIC ANNUAL REPORT AND STATEMENT OF ACCOUNT 2011
152
N
D I
CNIGERIADEPOSIT
INSURANCECORPORATION
Source: Bank Returns
As shown in Table 14.1, the increase of 53.5% in the number of attempted or successful
fraud and forgeries cases as reported in 2011 over the preceding year could be
attributed to rising fraud cases through internet banking and suppression of customer
deposits.
Chart 14A
Amount of Frauds & Forgeries (N'M)
Key
Series-Year
1-2010
2-2011
2010 2011
Amount of Frauds and Forgeries (₦’m)
NDIC ANNUAL REPORT AND STATEMENT OF ACCOUNT 2011
153
N
D I
CNIGERIADEPOSIT
INSURANCECORPORATION
Chart 14B
Expected Loss Due To Frauds & Forgeries (N'M)
14.2 INCIDENCE AND TYPE OF FRAUDS AND FORGERIES REPORTED
Table 14.2 shows that top ten (10) banks with the highest number of reported fraud
cases accounted for 87.1% of the banking industry fraud cases in 2011 compared to
51.08% in 2010.
GROUP 2010 2011
Amount
Involved
(N=M)
%
Share
Amount
Involved (N=M)
% Share
Total For 10 Banks
10,874,680
51.08
24,730,044
87.1
Total For All Banks
21,291,417
100
28,400,855
100
TABLE 14.2
10 BANKS WITH THE HIGHEST FRAUD CASES IN 2011
Source: Bank Returns
2010 2011
Expected Loss Due to Frauds & Forgeries (₦’m)

NDIC ANNUAL REPORT AND STATEMENT OF ACCOUNT 2011
154
N
D I
CNIGERIADEPOSIT
INSURANCECORPORATION
A further analysis of the types and nature of the frauds and forgeries committed during
the year under review revealed that ATM Frauds and Fraudulent transfers/withdrawals
accounted for the largest number of perpetrations as had been the case in the
preceding year. There were also rising fraud cases through internet banking and
suppression of customer deposits. The most common cases are listed in Table 14.3.
S/N Nature Of Fraud Frequency
1
ATM Fraud
738
2
Fraudulent Transfer/Withdrawal of Deposit
331
3 Presentation of Forged Cheques 280
4 Outright Theft 240
5 Suppression of Customer Deposit 219
6
Fraudulent Conversion of Cheques
123
7
Non Dispensing Of Money But Registered By
The Electronic Journal
112
8
Internet Fraud
108
TABLE 14.3
TYPE OF FRAUDS AND FORGERIES WITH FREQUENCY
14.3 BANKS' STAFF INVOLVED IN FRAUDS AND FORGERIES
Of the 2,352 fraud cases reported during the year under review, 498 were attributed to
staff/staff participation which showed an increase of 141 from 357 cases reported in
2010. Despite the increase, the losses resulting there from declined by 62.3% from ₦6.43
billion in 2010 to ₦2.42 billion in 2011. The reduction was as a result of better and
improved security and internal control measures put in place by the banks for
transactions involving large sums of money.
Table 14.4 shows the number of staff involved in fraud and forgeries in the past three
years with their respective status.
Source: Bank Returns

NDIC ANNUAL REPORT AND STATEMENT OF ACCOUNT 2011
155
N
D I
CNIGERIADEPOSIT
INSURANCECORPORATION
Status
2009 2010 2011
Number % Number % Number %
Supervisors & Managers
94
14.32
92
25.77
89
17.87
Officers, Accountants & Executive Assistants
137
20.88
79
22.13
126 25.30
Clerks & Cashiers
200
30.49
115
32.22
163 32.73
Typists, Technicians & Stenographers
64
9.76
23
6.44
7
1.41
Messengers, Drivers, Cleaners, Security Guards & Stewards
11
1.68
15
4.20
35
7.03
Temporary Staff 150 22.87 33 9.24 78 15.66
Total 656 100 357 100 498 100
TABLE 14.4
CATEGORIES OF BANKS' STAFF INVOLVED IN
FRAUDS AND FORGERIES IN 2011
The number of staff involved increased by 39% in 2011 from the preceding year. The
highest number of staff involved in cases of fraud and forgeries during the year under
review was from the clerks and cashier status as had been the case in the preceding
years with the lowest being from the typists, technicians and stenographers.
The causes of frauds could be categorised into two, namely: institutional/endogenous
factors and environmental/exogenous factors. The institutional/endogenous causes
are those that can be attributed to the internal domain of the organisation such as poor
accounting and weak internal control systems, poor management, inexperienced
staff and ineffective supervision of subordinates, uncompetitive remuneration and
perceived sense of inequity in reward, overstretching of staff, disregard of 'Know Your
Customers' (KYC) rules, et cetera. Environmental/exogenous factors are factors that
can be directly traced to the bank's operating environment and they include undue
societal demands, low moral values, slow and tortuous legal process, lack of effective
deterrent or punishment and, at times, reluctance on the part of the individual banks to
report fraud cases due to the negative publicity it could attract for their image.
In view of the extent of frauds and forgeries in the year under review, it is imperative that
all insured banks employ measures to strengthen their operational risk management
frameworks in the areas of internal control and security systems to combat the
incidence of frauds and forgeries. Insured banks should also endeavour to fully comply
with guidelines, rules and regulations on good corporate governance in order to take
14.4 CAUSES OF FRAUDS AND FORGERIES IN INSURED BANKS
Source: Bank Returns

control of the situation. The NDIC would also continue to ensure banks' compliance by
imposing sanctions in case of any breach by any insured bank. Furthermore, insured
banks should also thoroughly screen prospective employees by obtaining status report
from previous employers and relevant agencies while employees should be made to
be aware of the risks in defrauding or attempting to defraud the bank and the action
expected if caught. Insured banks should also endeavour to educate their customers
on the use of ATM and other electronic banking services.
In accordance to Section 33 of the NDIC Act of 2006, all insured banks are expected to
take up fidelity insurance cover which is a measure prescribed for protecting them
against any losses of money or property incurred as a result of fraudulent acts
committed by employees. It insures employers from incurring any losses caused by
dishonest actions of bank's staff and it is intended to cushion/reduce the adverse
impacts of such losses. It is therefore compulsory for all insured banks to take up fidelity
insurance cover as and when due. Table 14.5 presents banks' compliance with the
NDIC's fidelity insurance cover.
14.5 REPORT ON BANKS' FIDELITY BOND INSURANCE COVER
NDIC ANNUAL REPORT AND STATEMENT OF ACCOUNT 2011
156
N
D I
CNIGERIADEPOSIT
INSURANCECORPORATION
Year (a)
No. Of Banks In
operation
(b)
No. Of Banks
that Complied
(c=b/a)
% of Total
2011
20
18
90
2010
24
24
100
2009 24 23 95.83
Source: Bank Returns
TABLE 14.5
COMPLIANCE STATUS OF INSURED BANKS TO NDIC
FIDELITY INSURANCE COVER REQUIREMENT
As shown in the Table 14.5, two banks, namely: Fidelity Bank Plc and Sterling Bank Plc
failed to render returns on fidelity bond insurance cover in 2011. All DMBs that complied
with the requirement acquired their insurance policies from companies registered with
National Insurance Commission (NAICOM) as required by the NDIC Act.
Further analysis shows that only five out of the eighteen DMBs that complied with the
fidelity bond insurance policy met up with the required 15% paid-up capital implying
that the remaining 13 banks were underinsured due to inadequate fidelity bond
insurance cover during the year under review.

SECTION 15
INSURED BANKS' OFFICES, BRANCHES, BOARD OF DIRECTORS
AND APPROVED EXTERNAL AUDITORS
INSURED BANKS' OFFICES, BRANCHES, BOARD OF DIRECTORS
AND APPROVED EXTERNAL AUDITORS
NDIC ANNUAL REPORT AND STATEMENT OF ACCOUNT 2011
157
N
D I
CNIGERIADEPOSIT
INSURANCECORPORATION
15.1 Distribution of Insured Banks' Offices and Branches
As at the end of December 2011, there were a total of 5,763 branches/offices operated
by the twenty (20) insured DMBs in the system. That figure was an increase of 189
branches or 3.39% over the 5,574 branches/offices reported in 2010. Table 15.1 shows
the distribution of insured banks' branches/offices in the 36 states of the Federation and
the Federal Capital Territory (FCT), Abuja in 2011.
As evidenced in the table, Lagos State accounted for the highest number of bank
branches/offices with 1,731 branches, about 30.04% of the total. Abuja (FCT) came a
distant second with 397 branches/offices (6.89%), Rivers State came third with 301
branches/offices (5.22%), while Oyo State occupied the fourth position with a total of
234 branches/offices (4.06%). Other leading states during the year under review were
Anambra (233 or 4.04%), Delta (205 or 3.56%), and Edo with (184 or 3.19%).
S/N
States (Including
Abuja)
Number of Branches/Offices
Percentage Share
(%) 1.
Abia 139 2.41
2.
Abuja (FCT) 397 6.89
3.
Adamawa 64 1.11
4.
Akwa-Ibom 110 1.91
5.
Anambra 233
4.04
6.
Bauchi 59
1.02
7.
Bayelsa 36
0.62
8.
Benue 75
1.30
9.
Borno 77
1.34
10.
Cross River 72
1.25
11.
Delta
205
3.56
12.
Ebonyi
42
0.73
13.
Edo
184
3.19
TABLE 15.1
DISTRIBUTION OF INSURED BANKS' OFFICES AND
BRANCHES AS AT 31ST DECEMBER, 2011

NDIC ANNUAL REPORT AND STATEMENT OF ACCOUNT 2011
158
N
D I
CNIGERIADEPOSIT
INSURANCECORPORATION
14.
Ekiti
78 1.35
15.
Enugu 128 2.22
16.
Gombe 45 0.78
17.
Imo 105 1.82
18.
Jigawa 42 0.73
19.
Kaduna 177 3.07
20.
Kano 184
3.19
21.
Katsina 56
0.97
22.
Kebbi 44
0.76
23.
Kogi 84
1.46
24.
Kwara 78
1.35
25.
Lagos 1,731
30.04
26
Nassarawa
51
0.88
27.
Niger
78
1.35
28.
Ogun
176
3.05
29.
Ondo
117
2.03
30
Osun
103
1.79
31.
Oyo
234
4.06
32.
Plateau
79
1.37
33.
Rivers
301
5.22
34.
Sokoto
58
1.01
35.
Taraba
40
0.69
36.
Yobe
41
0.71
37.
Zamfara
40
0.69
Total
5,763
100
Source: Bank Returns

NDIC ANNUAL REPORT AND STATEMENT OF ACCOUNT 2011
159
N
D I
CNIGERIADEPOSIT
INSURANCECORPORATION
15.2 Head Offices' Addresses and Branches of Insured Banks
15.3 Insured Banks and Their Board of Directors
The distribution of branches per insured bank and Head Office is presented in Table
15.2. As in the past, two (2) banks, namely: First Bank of Nigeria Plc and United Bank for
Africa Plc maintained the first and second positions with the highest number of
branches, while there was a change in the third position from Union Bank Plc to
Ecobank Plc (due to the merger of Ecobank and Oceanic Bank Plc). First Bank of
Nigeria Plc was in the lead with a total of 650 branches, United Bank for Africa Plc was
second with a total of 607 branches, while Ecobank Plc came third with a total of 586
branches. The three banks, as shown in Table 15.2, accounted for 1,843 branches, or
31.98% of the total number of banks' branches/offices in the system. Other leading
banks in terms of branches/offices were Access Bank Plc with 487, Zenith Bank Plc with
393, Union Bank of Nigeria Plc with 382, FCMB with 321, Keystone Bank Ltd and Diamond
Bank Plc with 270 and 250 respectively. Unity Bank Plc had 241, Skye Bank Plc had 238
branches while Mainstreet Bank Ltd had 223.
A sound and responsive corporate governance is critical for the survival of any
organization. The board is a major vehicle for instituting corporate governance. The
board constitutes the highest policy making organ of a bank like in any other
organization as what happens at that level impacts significantly on the operations and
activities of the institution. Insured banks' directors are expected to review policies and
operations of their banks as well as undertake other responsibilities that enable the
banks to operate in a safe and sound manner. Experience has also shown that no
matter how effective regulation is, it does not substitute for the role of an active and
efficient board of directors in banks.
Banking institutions require the highest level of confidence of the members of the public
to survive. An important way of ensuring the survival of banks is for their boards to show
the highest sense of discipline, integrity, steadfastness and tenacity of purpose. Over
the years, the nation's Regulatory/Supervisory Authorities had continually raised issues
bordering on poor corporate governance in some of the banks which could impair
their viability. Regrettably, rather than improve, some of the banks, as revealed by
findings in their on-site examination reports in 2011, continued to exhibit weak
corporate governance practices which manifested in the form of inadequate risk
management framework, ineffective boards' risks management control functions and
regulatory infractions like non-adherence to the Code of Corporate Governance,
among others.
In 2007, the CBN issued Guidelines to all insured banks for the appointment of
Independent Directors. The Guidelines were issued so as to enable banks comply with

Section 5.3.6 of the Code of Corporate Governance for banks operating in Nigeria
effective April 3, 2006. As stated in that Section “at least two (2) non-executive board
members described as Independent Directors (who do not represent any particular
shareholders' interest and hold no special business interest in the bank) should be
appointed by the bank on merit”. In terms of compliance with that requirement, a
review of the nation's banking industry as at the end of year 2011, showed that a few of
the banks were yet to comply with that directive.
The list of insured banks' directors as at 31st December, 2011 is presented in Table 15.2.
As shown in the table, there were 322 directors serving on the boards of the 20 deposit
money banks operating in the system during the year under review.
Auditors play a vital role in the corporate governance process. As a result, the
Regulatory/Supervisory Authorities had continued to strengthen the roles of External
Auditors by encouraging measures that would ensure their independence, through the
regulation of their appointment and disengagement. The statutory reporting
requirements of insured banks' external auditors to the NDIC are stipulated under
Section 54 of the NDIC Act No. 16 of 2006. The CBN's directives and guidelines also
impose basic responsibilities/obligations on banks' external auditors. The external
auditors' reports are expected to lend credence to the banks' financial statements
thereby assisting in promoting confidence and transparency in the banking system.
Approved banks' external auditors are expected to complement the activities of the
Regulatory/Supervisory Authorities in making the banking industry safe and sound.
Their job includes examination of evidence relevant to amounts and disclosures in the
financial statements. It also includes an assessment of the significant estimates and
judgements made by the management and directors in the preparation of the
financial statements; and of whether the accounting policies are appropriate to the
bank's circumstances, consistently applied and adequately disclosed in line with best
practices.
As evidenced in Table 15.2, there were six (6) firms of Chartered Accountants approved
to conduct independent audit of the 20 insured DMBs operating in the system as at
December 31, 2011. KPMG Professional Services, from available statistics, topped the
list with 8 banks on their audit list, followed by PriceWaterhouse Coopers with 6 banks,
while Akintola Williams Deloitte had 4 banks, which were audited either wholly or jointly
with another firm during the year under review.
15.4 Insured Banks' Approved External Auditors
NDIC ANNUAL REPORT AND STATEMENT OF ACCOUNT 2011
160
N
D I
CNIGERIADEPOSIT
INSURANCECORPORATION

NDIC ANNUAL REPORT AND STATEMENT OF ACCOUNT 2011
161
N
D I
CNIGERIADEPOSIT
INSURANCECORPORATION
S/N Names & Addresses No. of Branches
Director’s Name
Status Approved Auditors
1.
Access Bank Plc Plot 999c, Danmole
Street, P.M.B. 80150, Victoria Island, Lagos.
www.accessbankplc.
com
487
Mr. Gbenga Oyebode,MFR Mr. Aigboje Aig -Imoukhuede
Mr. Herbert Wigwe
Mr. Taukeme Koroye
Mr. Okey Nwuke
Mr.Ebenezer Olufowose
Mr. Obeahon A. Ohiwerei
Dr.Cosmas M. Maduka
Mrs.Anthonia Ogunmefum
Dr. Mahmoud Isa -Dutse
Mr. Emmanuel Chiejina
Dr. Babatunde Folawiyo
Mrs. Mosunmola Belo-Olusoga
Otubu Oritsedere Samuel
Chairman GMD/CEO GDMD
ED
ED
ED
ED
Director
Director
Ind. Director
Ind. Director
Director
Director
Director
KPMG Professional Services
2.
Citibank Nigeria Ltd
Charles E. Sankey House,
27, Kofo Abayomi Street, P.O. Box 6391,
Victoria Island, Lagos.
www.citi.com
12
Olayemi Cardoso
Emeka Emuwa
Tariq Masaud
Omar Hafeez
Funmi Ogunlesi
Fatai Karim
Arthur Mbanefo
Prof. Yemi Osinbajo,SAN
Micheal Murray-Bruce
Dr. Hilary Onyiuke
Ade Ayeyemi
Naveed Riaz
Khalid Qurashi
Chairman
MD/CEO
ED
ED
ED
ED
ED
Ind. Director
Ind. Director
Director
Director
Director
Director
Director
Price Waterhouse Coopers
3.
Diamond Bank Plc
Plot 1261, Adeola Hopewell Street,
P.O.Box 70381, Victoria Island, Lagos.
www.diamondbank.co
m
250
HRM Igwe Nnaemeka
Dr. Alex Otti
Mr. Abdulrahman Yinusa
Mr. Victor Ezenwoko
Mr.Dele Akinyemi
Uzoma C. Dozie
Mrs. Caroline Anyanwu
Onwunna Clement Mazi
Lt. Gen. Useni Jeremaih (rtd)
Dr. Olubola Adekunle Hassan
Mr. Chris I. Ogbechie
Mr. Harfor d Simon
Chief John Edozien
Mr. Ian Greenstreet
Ms. Ngozi Edozien
Mr. Thomas Barry
Chairman
GMD/CEO
ED/CFO
ED
ED
ED
ED
Director
Director
Director
Director
Director
Director
Ind. Director
Director
Director
Price Waterhouse Coopers
4. Ecobank Nig. Plc Plot 21, Ahmadu Bello Way, P.O. Box 72688,Victoria Island, Lagos
www.ecobank.com
586 Olorogun Sunny F. Kuku, OFRJibril John AkuOladele AlabiKingsley AigbokhaevboFoluke AboderinOluwagbemiga O. KuyeAlh. Muazu AnacheDr. (Mrs.) N. DenloyeChief W. Belonwu
ChairmanMD/CEOEDEDEDEDDirectorInd Director.Ind Director.
Akintola Williams Deloitte
TABLE 15.2
INSURED BANKS’ ADDRESSED, BRANCHES, DIRECTORS AND
APPROVED EXTERNAL AUDITORS IN 2011

5. Enterprise Bank Nig Ltd Plot 143, Ahmadu Bello Way
Victoria Island Lagos
www.entbanking.com
199
Mr. Emeka Onwuka Mallam Ahmed Kuru Mrs. Louisa Olaloku
Mrs. Nneka Onyeali Ikpe Mr. Aminu Ismail
Mr. Niyi Adebayo
Mr. Audu Kazir
Mr. John Aderibigbe
Mr. Ogala Osoka
Mr. Ezekiel Gomos
Mr. Garba Imam
Mrs. Asmau Maikudi
Mr. Ebenzer Foby
Mr. Ismail Shuaibu
Mr. Lamis Dikko
Mr. Sanusi Monguno
Chairman GMD/CEO ED
ED ED
ED
ED
Ind. Director
Ind. Director
Ind. Director
Ind. Director
Ind. Director
Ind. Director
Ind. Director
Ind. Director
Ind. Director
Price WaterhouseCoopers
6.
Fidelity Bank Plc,
Fidelity Place,
1 Fidelity Bank Close
Off Kofo Abayomi Street, P.O.BOX. 72439, Victoria Island, Lagos.
www.fidelitybankpl
c.com
173
Chief Christopher I. Ezeh, MFR
Reginald Ihejiahi
Willie M. Obiano
Abdul-Rahaman Esene
I. K. Mbagwu
Mrs. Onome Joy Olaolu
Mrs. Bessie N. Ejeckam
Ichie Nnaeto Orazulike
Dim Elias E. Nwosu
Chief Nnamdi Oji
Mr. Gabriel Kayode O lowoniyi
Mallam Umar Yahaya
Arc. A.W.U Okam
Mr. Stanley I Lawson
Alh. Bashari Mohammed Gumel
Chairman
MD/CEO
ED
ED
ED
ED
Director
Director
Director
Director
Director
Director
Director
Ind Director
Ind Director
Ernest & Young
PILF-Professional Services
7.
First Bank of Nigeria Plc Samuel Asabia House,
35, Marina,
P.O.Box 5216, Lagos
firstcontact@first
banknigeria.com
650
Ajibola A. Afonja
Bisi Onasanya
Remi Odunlami (Mrs)
U. K. Eke
Bello M. Maccido
Kehinde Lawanson
Ibiai Ani (Mrs)
Ambrose Feese
Babatunde Hassan-Odukale, MFR
Alhaji Lawal K. Ibrahim
Obafemi A. Otudeko
Ibukun Awosika (Mrs)
Alhaji Mahey Rasheed
Ebenezer JolaosoKhadijah Alao-Straub (Mrs)Ibrahim Dahiru Waziri
Chairman
GMD/CEO
ED
ED
ED
ED
Director
Director
Director
Director
Director
Ind. Director
Director
DirectorDirectorDirector
Pricewater Coopers
Pannell Kerr Forster (PKF Professional)
8. First City Monument Bank PlcPrimrose Tower,17A, Tinubu StreetP.O.Box 9117, Lagos.
www.firstcitygroup
.com
321 Dr. Jonathan A.D. LongMrs. Ladi BalogunMr. Segun OdusanyaMr. Nabeel Anjum MalikMr. Peter ObasekiMr. Olufemi BakreMr. Nigel P. Kenny
ChairmanMD/CEODMDEDEDEDED
KPMG
NDIC ANNUAL REPORT AND STATEMENT OF ACCOUNT 2011
162
N
D I
CNIGERIADEPOSIT
INSURANCECORPORATION

NDIC ANNUAL REPORT AND STATEMENT OF ACCOUNT 2011
163
N
D I
CNIGERIADEPOSIT
INSURANCECORPORATION
9. GT Bank Plc Plural House, Plot 635, Akin Adesola Street, P.O.Box 75455,
Victoria Island, Lagos.
www.gtbank.com
191
Oduyemi Oluwole Sunday Segun Agbaje Echeozo Cathy
Demola Odeyemi Ohis Ohiwerei
Olutola Omotola
Wale Oyedeji
Agusto Olabode Mubasheer
Okolie Stella Chinyelu
Imomoh Egbert Ulogo
Hasssan Ibrahim
Adeola Kadri Adebayo
Alli Andrew
Akintoye Akindele Adeoye
Chairman MD/CEO DMD
ED ED
ED
ED
Director
Director
Director
Director
Director
Ind. Director
Ind. Director
Price Waterhouse Coopers
10.
Keystone Bank Nig Ltd
No. 1 Keystone Bank Crescent Off Adeyemo Alakija Street, P.M.B. 80054 Victoria Island, Lagos.
www.keystonebankng
.com
270
Ajekigbe Jacob Moyo
Ikomi Otimeyin Andrew
Adewale Ademola Moruf
Abubakar shehu
Uwuchue-
Mbanefo sally
Isichei Yvonne Uzoyibo
Muhammed shehu kuranga
Ekpe Adolphus Joe
Pam Jonathan Yusufu
Ibrahim Mustapha A
Philips Maria Olateju
Aminu-Kano Maude
Shehu Yakubu
Akenzua Prince Niyi
Umolu Charles Chidebe
Olusanya Jacob Olusegun
Chairman
MD/CE
ED
ED
ED
ED
ED
Director
Director
Director
Director
Director
Director
Director
Director
Director
KPMG Professional Services
11.
Mainstreet Bank Nig Ltd
Mainstreet Bank Plaza,
51/55, Broad Street, P.M.B. 12021, Lagos
www.mainstreetbank
limited.com
223
Mallam Falalu Bello, OFR, FCIB
Faith Tuedor -Matthews
Mr. Kola Ayeye
Roger Malcolm Woodbridge
Bolaji Shenjobi
Mr. Anogwi Anyanwu
Mr. Abubakar Sadiq Bello
Shuaibu Abubakar Idris
Professor Osita Ogbu
Sa’ad Shehu Usman
Chris Osiomha Itsede Phd.
Muhammed Gulani Shuaibu
Yabawa Lawan Wabi, mni
Mr. Joshua Ayodele Ajayi
Joshua Ounlowo, OON
Chairman
GMD/CEO
ED
ED
ED
ED
ED
Director
Director
Director
Director
Director
Director
Director
Director
KPMG Professional Services
12. SKYE Bank Plc3, Akin Adesola streetVictoria IslandLagoswww.skyebankng.com
238 Olatunde AyeniKehinde Durosinmi-EttiGbenga Ademulegun Timothy OguntayoDotun AdeniyiMrs. Amaka OnwughaluMrs. Ibiye EkongAwodein KolawoleVictor AdenigbagbeJason Fadeyi
ChairmanGMD/CEOEDEDEDEDEDNon-Exec. Dir.DirectorDirector
Akintola Williams Deloitte

13. Stanbic-IBTC Bank Plc Stanbic IBTC Place, Walter Carrington Crescent,
P.O. Box 71707,
Victoria Island, Lagos.
www.stanbicibtcbank.com
171
Atedo N.A. Peterside, OON Sola David-borha Sanni Yinka Omotosho
Moses Adedoyin Sam Cookey
Maryam Uwais MFR.
Ifeoma Esiri
Anold Gain
Ratan Mahtani
John Maree
Kruger Barend Johannes
Chairman MD/CEO DMD
Director Ind. Director
Ind. Director
Director
Director
Director
Director
Director
KPMG Professional Services
14.
Standard Chartered Bank Nigeria Ltd
142 Ahmadu Bello Way
Victoria Island
Lagos
www.standaredchart
erd.com
29
Chief Joseph Oladele Sanusi
Bola Adesola
Yemi Owolabi
Sade Kilaso
Ade Adeola
Anil Dua
Bill Moore
Alh. Muhammed Yahaya
Mr. Olusegun Bamidele Ajayi
Sir. Festus Oluremi Omotoso
Diana Layfield
Chairman
MD/CEO
ED
ED
ED
Director
Ind. Director
Ind. Director
Ind. Director
Ind. Director
Director
Akintola Williams Deloitte
15.
Sterling Bank Plc
20, Marina
P.M.B. 12735
Lagos, Nigeria
www.sterlingbankng.com
194
Dr. S. Adebola Adegunwa, OFR
Mr. Yemi Adeola
Mr. Lanre Adesanya
Mr. Devenra Nath Puri
Mr. Abubakar Sule
Mr.Rajiv Pal Singh
Capt.Harrison Kuti
Alh. Bashir M. Borodo, MFR
Mr. Yemi Idowu
Mr. Yinka Adeola
Mr. Rasheed A. Kolarinwa
Mr. Musibau A. Fashanu
Chairman
GMD/CEO
ED
ED
ED
Director
Director
Director
Director
Director
Ind. Director
Ind. Director
Ernst & Young
16.
Union Bank of Nigeria Plc
36, Marina, P.M.B. 2027, Lagos.
www.unionbankng.com
382
Prof. Musa Gella Yakubu
Mrs. Olufunke Iyabo Osibodu
Mr. AdeKunle Mickey Adeosun
Philip Ikeazor
Mr.Ibrahim Abubakar Kwargana
Folashodun Adeosun Shonubi
Ahmadu AbubakarMansur AhmedMrs. Onikepo AkandeIbrahim Abdullahi. GobirFestus B.O.OdimeguOnajite OkolokoOlusegun OnasanyaCosmas Paul Udofot
Chairman
GMD/CEO
ED
ED
ED
ED
DirectorDirector Director Director DirectorDirectorDirectorDirector
KPMG Professional Services
NDIC ANNUAL REPORT AND STATEMENT OF ACCOUNT 2011
164
N
D I
CNIGERIADEPOSIT
INSURANCECORPORATION

17. United Bank for Africa Plc UBA House, 57, Marina, P.O.Box 2406, Lagos
607
Chief Israel Chinwuba Ogbue Amb. Joe Keshi Mr. Phillips Oduoza
Mr. Victor Osadolor Mr. Abdulqadir Bello
Rasheed Olaoluwa
Mr. Emmanuel .N. Nnorom
Mr.
Kennedy Uzoka
Mr. Femi Olaloku
Mr. Ifeatu Onejeme
Mr. Dan Okeke
Chief Kolawale B. Jamodu
Mr. Adekunle Olumide, OON
Mrs. Angela Nwabuoku
Mr. Paolo .A. Dimartino
Mr. Jafaru Aliyu Paki
Ms. Runa Alam
Mr. Yahaya Zekeri
Foluke Kafayat Abdulrazaq
Chairman Vice Chairman GMD/CEO
ED ED
ED
ED
ED
ED
ED
ED
ED
Ind. Director
Director
Director
Ind. Director
Director
Director
Director
Price WaterhouseCoopers
18.
Unity Bank Plc,
Unity Bank Towers,
Plot 785, Herbert Macaulay Way, Central Business District, Abuja.
www.unitybanking.com
241
NU’uman Barau Danbatta, OON,mni
Alh. Ado .Yakubu Wanka
Alh. Ismaila A. Galadanchi
Alh. Ibrahim T. Mohammed
Alh. Ahmed Yusuf
Alh. Rislanudeen Muhammad
Mr. Lanre E. Fagbohun
Engr. Ahmed Ibrahim
Engr. Oluseun Mabogunje
Mr. Hakeem Shagaya
Mr. Thomas A. Etuh
Dr. Oluwafunsho Obasanjo
Alh. Aminu Babangida
Alh. Ibrahim M.A Kaugama
Mallam Gimba H. Ibrahim
Mr. Richard G. Asabia
Chairman
MD/CEO
ED
ED
ED
ED
ED
Director
Director
Director
Director
Director
Director
Director
Ind. Director
Ind. Director
Ahmed Zakari & Co.
19.
Wema Bank Plc
Wema Towers, 4th Floor, 54, Marina, P.M.B. 12862, Lagos.
www.wemebank.com
146
Chief Samuel Bolarinde Olaniyi
Segun Oloketuyi OlaniyiAdemola Adebise AbimbolaNurudeen Fagbenro AdeyemoChief Opeyemi Bademosi OlusolaAdebode Adefioye ObafemiDr. Patrick Akinyelure Ayo Mr. Ramesh Hathiramani Naraindas Mr. Abubakar Lawal Lawal Prof. Taiwo Osipitan Adetayo, SAN
Chairman
MD/CEOEDEDDirectorDirector DirectorDirectorDirectorDirector
Akintola Williams Deloitte
NDIC ANNUAL REPORT AND STATEMENT OF ACCOUNT 2011
165
N
D I
CNIGERIADEPOSIT
INSURANCECORPORATION
20. Zenith Bank Plc Plot 87, Ajose Adeogun Street, P.O.Box 75315, Victoria Island, Lagos.
www.zenithbank.com
393
Mr. Steve babatunde Omojafor Mr. Godwin I. Emefiele Mr. P eter Amangbo
Elias Igbin-Akenzua Mr. Apollos Ikpobe
Mr. Andy Ojei
Mr. Udom Emmanuel
Alh. Baba Tela
Mr. Lawal Sani
Prof. Chukuka Enwemeka
Mr. Jeffery Efeyin
Mr. Babatunde adejuwon
Chairman GMD/CEO ED
ED ED
ED
ED
Ind. DirectorInd. Director Director
Director
Director
KPMG Professional Services


SECTION 16
MAJOR DEVELOPMENTS IN OTHER INSURED
DEPOSIT-TAKING FINANCIAL INSTITUTIONS
MAJOR DEVELOPMENTS IN OTHER INSURED
DEPOSIT-TAKING FINANCIAL INSTITUTIONS
NDIC ANNUAL REPORT AND STATEMENT OF ACCOUNT 2011
167
N
D I
CNIGERIADEPOSIT
INSURANCECORPORATION
16.0 Introduction
16.1 Operations and Performance of Microfinance Banks (MFBs) in 2011
·
·
·
·
All Microfinance Banks (MFBs) and Primary Mortgage Banks (PMBs) were members of
the Deposit Insurance System (DIS) in 2011, in line with the NDIC Act No. 16 of 2006.
Microfinance banking was initiated to enhance the access of micro entrepreneurs and
low income households to financial services required to expand and modernize their
operations in order to contribute to economic growth and reduce level of poverty in
the country. The PMBs were established under the Federal Government's National
Housing Policy to solve the housing problems facing the country. They were expected
to provide mortgage finance and also help in the disbursement of the National Housing
Fund (NHF) established by the Federal Government of Nigeria.
The extension of deposit insurance cover to these institutions was aimed at improving
the level of confidence of the banking public in the MFBs and PMBs, thereby
strengthening them to play their intermediation role in the economy like the DMBs. The
section highlights the major developments and performance of these other insured
deposit-taking financial institutions as well as the challenges affecting their effective
operation during the period under review.
The Microfinance Policy was launched on the 15th December, 2005 by the Central
Bank of Nigeria as one of the Federal Government Strategies to achieve the Millennium
Development Goals (MDGs). According to the policy framework, MFBs were promoted
to provide financial services to the economically active poor in the society. The Policy
was targeted at creating an environment of financial inclusion to boost capacity of
micro, small and medium enterprises (MSEMEs) thereby contributing to economic
growth and development through job creation that would lead to improved standard
of living and poverty reduction.
The specific objectives of the microfinance policy were as follows:
Make financial services accessible to a large segment of the potentially
productive Nigerian population which hitherto had little or no access to
financial services;
Promote synergy and mainstreaming of the informal sub-sector into the national
financial system;
Enhance service delivery by microfinance institutions to micro, small and
medium entrepreneurs;
Contribute to rural transformation; and

·
·
·
·
Promote linkage programmes between deposit money banks, development
banks, specialized institutions and microfinance banks.
In 2011, the Central Bank of Nigeria (CBN) issued a revised Microfinance Policy to
enhance the provision of diversified microfinance services on a sustainable basis for the
economically active poor and low income households. Although the 2005
microfinance policy still remained valid, the CBN believed a review of the policy to
reflect lessons from experience, global economic trends and the envisioned future for
small business development in Nigeria had become auspicious. The new revised policy
was also meant to provide more appropriate machinery for tracking the activities of
development partners and other non-bank service providers in the microfinance sub-
sector of the Nigerian economy.
The revised Microfinance Policy permitted the establishment of three categories of
MFBs, namely:
MFB operating as a unit bank would be required to have a minimum capital of
N20 million;
MFB licensed to operate in a State and open branches within the state would be
required to have a minimum capital of N100 million; and
MFB licensed to operate and open branches in all states of the Federation
would be required to have a minimum capital of N2 billion.
In 2011, the NDIC, in collaboration with the CBN, conducted routine examination of all
MFBs in Nigeria. The CBN/NDIC Examiners' findings revealed that many of the institutions
were incapable of honouring their obligations to their customers as and when due,
while some voluntarily closed shops. The major findings from the routine examination of
the MFBs still in operation included but not limited to weak corporate governance,
inadequate capital, weak board oversight, poor internal control and record keeping,
lack of understanding of the microfinance business, weak earnings, poor asset quality
and insider abuses. Meanwhile, the NDIC in collaboration with CBN was working out
appropriate failure resolution options for the institutions that were either distressed or
had closed shops.
The NDIC continued with the liquidation activities for the 103 MFBs whose licences were
revoked in 2010 with the payment of insured deposits to depositors. The CBN continued
to monitor the 121 MFBs whose licences were reinstated in 2010. The CBN special
examination of the institutions revealed that 76 had either fully recapitalized or been
absorbed by other MFBs while 45 were still being monitored for the exact state of their
financial health.
NDIC ANNUAL REPORT AND STATEMENT OF ACCOUNT 2011
168
N
D I
CNIGERIADEPOSIT
INSURANCECORPORATION

As at December 31, 2011, 880 MFBs including 121 with provisional approvals were in
operation. Table 16.1 presents the distribution of MFBs by States and Federal Capital
Territory (FCT) while Table 16.2 shows the distribution by geo-political zones.
NDIC ANNUAL REPORT AND STATEMENT OF ACCOUNT 2011
169
N
D I
CNIGERIADEPOSIT
INSURANCECORPORATION
STATE
CBs CONVERTED TO MFBs NEW INVESTORS
TOTAL
FINAL
LICENCE
PROV
APPROVAL
PROV
LICENCE
SUB-
TOTAL
FINAL
LICENCE
AIP
PROV
LICENCE
SUB-
TOTAL
ABUJA FCT 6 0 0 6 45 1 1 47 53
ABIA 13 0 1 14 5 3 0 8 22
ADAMAWA 7 0 0 7 0 0 0 0 7
AKWA
IBOM 6 0 0 6 7 1 0 8 14
ANAMBRA 64 1 3 68 6 1 0 7 75
BAUCHI 7 1 1 9 3 1 0 4 13
BAYELSA
0
0
0
0
3
1
0
4
4
BENUE
7
0
0
7
2
1
1
4
11
BORNO
1
2
0
3
1
0
0
1
4
CROSS
RIVER
13
0
1
14
1
0
0
1
15
DELTA
18
1
2
21
15
1
1
17
38
EBONYI
4
0
1
5
3
0
0
3
8
EDO
15
1
2
18
3
0
0
3
21
EKITI
11
0
1
12
0
0
0
0
12
ENUGU
17
0
2
19
4
0
0
4
23
GOMBE
3
0
0
3
1
0
0
1
4
IMO
29
3
1
33
7
1
0
8
41
JIGAWA
3
0
0
3
8
0
0
8
11
KADUNA
16
0
0
16
7
1
0
8
24
KANO
4
0
0
4
3
0
0
3
7
KATSINA
3
0
0
3
2
1
0
3
6
KEBBI
3
1
0
4
1
1
0
2
6
KOGI
18
0
2
20
2
0
0
2
22
KWARA
17
0
0
17
5
0
0
5
22
LAGOS
33
5
5
43
120
6
9
135
178
NASARAWA 2 1 0 3 5 1 0 6 9
TABLE 16.1
STATE DISTRIBUTION OF THE MFBS AS AT DECEMBER 31, 2011

NDIC ANNUAL REPORT AND STATEMENT OF ACCOUNT 2011
170
N
D I
CNIGERIADEPOSIT
INSURANCECORPORATION
Source:Committee on the implementation of the National Microfinance Policy
NIGER 9 0 0 9 16 1 1 18 27
OGUN 38 2 4 44 5 2 0 7 51
ONDO 12 2 1 15 1 1 0 2 17
OSUN 25 0 2 27 6 0 0 6 33
OYO 36 2 1 39 12 0 0 12 51
PLATEAU 9 0 0 9 2 1 0 3 12
RIVERS 12 0 1 13 10 0 1 11 24
SOKOTO 4 0 0 4 0 0 0 0 4
TARABA 3 0 0 3 1 0 0 1 4
YOBE 1 0 0 1 0 0 0 0 1
ZAMFARA 5 1 0 6 0 0 0 0 6
T O T A L
474
23
31
528
312
26
14
352
880
GEO-POLITICAL ZONES
NUMBER OF MFBs
TOTAL PER ZONE
% OF TOTAL
NORTH-WEST
64
7.3
JIGAWA
9
KADUNA
24
KANO
7
KATSINA
6
KEBBI 6
SOKOTO 4 ZAMFARA 6
SUB -TOTAL
64
NORTH-CENTRAL
156
17.7
ABUJA FCT
53
BENUE
11
KOGI
22
KWARA
22
NASSARAWA
9
NIGER
27
PLATEAU
12
SUB -TOTAL
156
TABLE 16.2
DISTRIBUTION OF MFBS BY GEO-POLITICAL ZONES AS AT
DECEMBER 31, 2011.

NDIC ANNUAL REPORT AND STATEMENT OF ACCOUNT 2011
171
N
D I
CNIGERIADEPOSIT
INSURANCECORPORATION
NORTH-EAST
33
3.8
ADAMAWA
7
BAUCHI
13
BORNO
4
GOMBE
4
TARABA
4
YOBE
1
SUB -TOT AL
33
SOUTH WEST
342
38.9
EKITI
12
LAGOS
178
OGUN
51
ONDO
17
OSUN 33
OYO 51 SUB -TOTAL 342
SOUTH-SOUTH
116
13.2
AKWA IBOM
14 BAYELSA
4
CROSS RIVER
15
DELTA
38
EDO
21
RIVERS
24
SUB-TOTAL
116
SOUTH-EAST
169
19.2
ABIA
22
ANAMBRA
75
EBONYI
8
ENUGU
23
IMO
41
SUB-TOTAL
169
TOTAL
880
880
100.0
Source: Committee on the implementation of the National Microfinance Policy

NDIC ANNUAL REPORT AND STATEMENT OF ACCOUNT 2011
172
N
D I
CNIGERIADEPOSIT
INSURANCECORPORATION
Table 16.1 shows that the MFBs were concentrated in the states of Lagos (178),
Anambra (75), Abuja FCT (53), Ogun (51), Oyo (51) and Imo (41). The five states and FCT
accounted for 449 or 51.02% of the total number of existing MFBs as at December 2011.
The remaining 31 States accounted for the balance of 431 MFBs representing 48.98%. In
terms of the spread across geo-political zones as shown in Table 16.2, the Northern
States had fewer MFBs with Yobe State having only one MFB while ten other States in the
region had less than 10 MFBs in 2011. Similarly, about 38.9% or 342 MFBs were located in
the South- West geo-political zone followed by South East with 19.2% or 169 MFBs. North-
East zone had the least with 3.8% or 33 MFBs in 2011.
A total of seven (7) out of the 880 MFBs as at 31 December, 2011 were state-wide MFBs.
During the year under review, two (2) of the erstwhile state MFBs were de-listed. They
were UBA MFB Ltd, which returned its operating licence on June 22, 2010 and
Integrated MFB Ltd, which had its operating licence revoked and was closed on
September 24, 2010. The list of the State-wide MFBs as at December 31, 2011 is
presented in Table 16.3.
S/N
Name
Status
Dominant State
of Operation
Branch/Expansion to other State, Abuja, Rivers
1
NPF Microfinance Bank Ltd
Converted CB
Lagos
Abuja, Rivers
2
FBN MFB Ltd
Subsidiary of a deposit money bank
Lagos
None yet
3
Blue Intercontinental MFB
Subsidiary of a deposit money bank
Lagos
Oyo
4
AB MFB Ltd
New MFB Foreign Ownership
Lagos
None yet
5
Afribank MFB Ltd
Subsidiary of a deposit money bank
Lagos
None yet
6 LAPO MFB Ltd Transforming NGO-MFI, Final license granted
Edo 18 Others
7 COWAN MFB Ltd Transforming NGO-MFI AIP* granted Ondo 16 Others
Source: Committee on the implementation of the National Microfinance Policy
* AIP - Approval in Principle
TABLE 16.3
LIST OF STATE-WIDE MICROFINANCE BANKS AS AT 31ST DECEMBER, 2011
Table 16.4 shows that nine (9) deposit money banks (DMBs) had interest in MFBs. While
three (3) of the DMBs had established microfinance units at their Head Offices, the
remaining six (6) had ownership interest in various proportions in MFBs.

NDIC ANNUAL REPORT AND STATEMENT OF ACCOUNT 2011
173
N
D I
CNIGERIADEPOSIT
INSURANCECORPORATION
S/N DMBs Subsidiary/Window Ownership Status1 First Bank Nig Plc FBN MFB Ltd FBN 100%
(Wholly Owned)
Final License Approved
2 Intercontinental Bank (acquired by Access Bank Plc)
Blue Intercontinental MFB Ltd
Intercontinental Bank 35%
Final License approved
3
Mainstreet Bank Ltd (defunct Afribank Nig. Plc)
Afribank MFB
Ltd
Mainstreet Bank Ltd 100% (Wholly Owned)
Final License approved
4
Ecobank Plc
ACCION MFB Ltd
Ecobank 18.47%
Final License approved
5
Zenith Bank Plc
ACCION MFB Ltd
Zenith 10%
Final License approved
6
NIB (Citibank)
ACCION MFB Ltd
NIB 19.90%
Final License approved
7
Oceanic Bank Plc
(Acquired by Eco Bank Plc)
Microfinance Unit/Dept
N/A
N/A
8 Diamond Bank Plc Microfinance Unit/Dept N/A N/A
9 Union Bank Nig Plc Microfinance Unit/Dept N/A N/A
TABLE 16.4
DMBs WITH MFBs AS SUBSIDIARIES/WINDOWS AS AT DECEMBER 31, 2011
Source: Committee on the implementation of the National Microfinance Policy
The NDIC supervises the activities of the MFBs, through the Special Insured Institutions
Department (SIID). One of the major challenges that the NDIC faced in the supervision
of the MFBs during the period under review was the non-rendition of returns by some of
the institutions. That was partly addressed in 2011 by making MFBs to submit their returns
through NDIC Zonal Offices and electronically by e-mail, which, as a result, improved
rendition of returns.
During the year under review, returns for 715 MFBs were consolidated out of 880 MFBs
that were in operation. An analysis of the financials of the 715 MFBs that rendered
returns revealed that total assets stood at N150.40 billion, total deposit liabilities
amounted to N75.95 billion, total loans and advances stood at N58.22 billion while total
paid-up capital was N40.94 billion as at the end of 2011. It was observed that some of
the MFBs continued to operate like DMBs, with high unsustainable and unrealistic
overhead cost. Most of the MFBs preferred to grant commercial loans to high net-worth
businessmen rather than the economically active poor that should be their
primary/target customers.
The MFBs tended to be risk averse as many of them kept large sums of money in interest-
yielding accounts with the DMBs rather than giving such funds as loans. Some were

even so risk averse that a large proportion of their funds were invested in Treasury Bills.
The overall picture in 2011 revealed that, the MFBs committed an average of 43.5% of
their total assets to cash, placements with other banks and investments in money
market instruments while micro loans accounted for an average of 35% or ₦52.95 billion
of their total assets.
In view of the need for a long-term fund to assist the Small and Medium Enterprises in the
system, a new policy on Micro, Small and Medium Enterprises Fund was being
considered by the CBN during the year under review. However, in view of the recent
cleansing of the distressed MFBs, implementation had been delayed until there was
relative stability in the system.
Microfinance remained a novel idea in the country and both regulators and operators
did not have adequate knowledge and skills for microfinance operations. In that
regard, the NDIC during the year under review, partnered with CBN to build capacity
for the operators and their staff. In 2011, three examiners visited Bangladesh as part of
Deutsche Gesellschaft Fur Internationale Zeshmmenarbeit (GIZ) initiative to expose the
regulators to operations of microfinance institutions in that country.
The microfinance sub-sector was faced with a number of challenges during the year
under review, some of which included the following:
Shareholders' funds of most of the MFBs had been impaired by losses. The poor quality
of loan assets and the need to make adequate provision for loan losses had negative
impact on the capital base of the banks. Moreover, due to weak earnings, the
institutions lacked capacity to internally generate additional capital.
Communication barriers continued to exist in most parts of the rural areas in Nigeria due
to high level of illiteracy amongst the rural populace. That affected the level of their
awareness on the microfinance concept and its implementation.
Due to poor and inadequate functional infrastructures in the country, cost of
maintaining operating expenses for the microfinance banks remained very high during
16.2 Regulatory/Supervisory Agencies Support For the Development of MFBs in the
System
16.2.1 Establishment of Micro Credit Fund
16.2.2 Capacity Building
16.3 Challenges faced by the Microfinance Sub-Sector
i) Weak Capital Base
ii) High illiteracy level especially in the rural areas
Iii) High Operating Costs
NDIC ANNUAL REPORT AND STATEMENT OF ACCOUNT 2011
174
N
D I
CNIGERIADEPOSIT
INSURANCECORPORATION

the year under review. Also the costs of office accommodation, mostly in the urban
areas, were very high and therefore affected the loanable funds available to most of
the MFBs. Hence, a good number of MFBs ended up with liquidity problems as funds that
would have been utilized to create earning assets were tied down as fixed assets.
MFBs, like other deposit-taking financial institutions, rely on deposits for creating loans
and advances as well as other assets. However, due to their heavy investment in fixed
assets some MFBs had limited amount for extending credits to customers during the
year under review. The market for wholesale fund was yet to be in place. Access to
donor fund and government poverty alleviation palliatives had been limited to only a
few MFBs.
As a relatively new mode of financial intermediation with a unique business model,
majority of the staff of MFBs in Nigeria did not have required knowledge and skills in
microfinance. Most of the MFBs staff had conventional banking experience which
explained why some of them focused mainly on conventional banking products.
The operations of some of the MFBs were yet to be computerized and that had
implications for the early implementation of e-FASS for the electronic rendition of
statutory returns. Meanwhile, the manual operations by the MFBs had made accurate
record keeping cumbersome.
The Board of Directors of a microfinance bank has the sole responsibility for establishing
strategic objectives, policies and procedures that would guide and direct the activities
of the bank. These were lacking in most MFBs examined as many of them operated
without strategic plans, policies and procedures. Also, there were rampant issues of self-
serving practices and insider abuse by the owners, board and management of some of
the MFBs. These also manifested in inaccurate financial reports, weak internal control
systems and high scale of frauds and forgeries.
The level of classified credits/portfolio at risk (PAR) in some of the MFBs was found to be
worrisome. Some institutions had PAR ratios in excess of 50% as against the prudential
maximum ratio of 2.5%. The ''Know Your Customer'' (KYC) rule, which should form the
basis of lending had been overtaken by the drive for immediate profit and rampant
cases of failure to appraise the facility properly and obtain security where necessary
before disbursement. The legal and judicial systems made it difficult and slow for the
MFBs to recover loans and realize collaterals obtained to secure loans through the
court.
iv) Paucity of Loanable Funds
v) Lack of Microfinance Experience
vi) Inadequate Management Information System
vii) Poor Corporate Governance Practices
viii) Poor Asset Quality
NDIC ANNUAL REPORT AND STATEMENT OF ACCOUNT 2011
175
N
D I
CNIGERIADEPOSIT
INSURANCECORPORATION

16.4 Operations and Performance of the Primary Mortgage Banks (PMBs) in 2011
16.4.1 Challenges Faced By the Primary Mortgage Institutions (PMIs) in 2011
a) Dearth of Long Term Funds
b) Difficulties in Mobilizing Deposits
In 2011, the PMBs continued to enhance their capital base to comply with the new
minimum capital requirement of ₦2.5 billion and ₦5 billion for State and National PMBs
respectively.
One of the challenges that the NDIC faced was the failure of the PMBs to render returns
as and when due. Out of the 100 PMBs that were in operation as at December 31, 2011
only 44 rendered returns. The analysis of the information rendered by the forty-four (44)
PMBs in 2011 revealed that their total asset stood at ₦242.5 billion, total credit was
N105.3 billion, total deposit was ₦125.9 billion while the sum of ₦19.1 billion was obtained
from the National Housing Fund (NHF) for on-lending.
The ratio of mortgage loans to total assets stood at 31.9% compared to the prescribed
minimum of 30%. That indicated an improvement in mortgage facilities granted when
compared to previous year's figure of 27.7%. Mortgage assets amounted to ₦77.33
billion or 61.43% of the total loanable funds of ₦125.88 billion as at December 2011. That
was slightly above the prudential minimum ratio of 60% for the sub-sector.
The PMBs, during the year under review, faced many challenges that militated against
their performance in terms of achieving the policy objectives of acting as a catalyst for
the development and provision of affordable houses to average Nigerians. Some of the
challenges included:
The PMBs encountered a lot of delays before NHF funds were disbursed to only a few of
them. Some PMBs found it difficult to provide the required bank guarantee to access
the NHF funds. Only 4 out of 100 PMBs in operation were listed on the Nigerian Stock
Exchange (NSE). Hence, others had no access to long term funds through the stock
market. The restrictive investment guideline for pension funds made them inaccessible
for PMBs.
The PMBs had a lot of challenges in the area of deposit mobilization. The banking public
preferred to open accounts with the DMBs rather than with the PMBs whose operations
were too complicated for them to understand. The PMBs found it difficult to mobilize
long-term deposits to finance their housing projects which were usually long-term in
nature.
The Land Use Act had made the process of perfecting title to a landed property
cumbersome, slow and costly. That had seriously hampered the development of the
c) Land Use Act
NDIC ANNUAL REPORT AND STATEMENT OF ACCOUNT 2011
176
N
D I
CNIGERIADEPOSIT
INSURANCECORPORATION

housing sector as landed properties were treated with caution. It had also negatively
affected recovery of past loans granted.
In advanced economies, there exist a lot of mortgage-backed securities that are freely
traded on recognized stock exchanges. In Nigeria, there was paucity of mortgage-
backed securities during the year under review. Securitization of mortgage assets
would help to deepen the market if the inherent risks are well managed.
The state of infrastructural facilities such as roads, transportation, power and water in
the country was still appalling. Also a lot of building materials like cement, tiles and
ceramic wares were still being imported in spite of the high foreign exchange rate.
Hence, due to high cost of construction, houses meant for low income earners were
priced beyond their reach.
Some PMBs were yet to imbibe the culture of good corporate governance and sound
risk management practices. Hence, they continued with lapses such as improperly
constituted Board, non-frequent Board and Committee meetings, unqualified and
inexperienced staff and management, poor internal control systems and failure to
render or rendering of inaccurate returns. Some were yet to put needed procedures in
place to identify, monitor and manage risks associated with their operations.
In Nigeria, most borrowers see loan facilities as their share of “National Cake”. Hence,
that observed attitude coupled with difficulty in realizing pledged securities had
resulted in huge non-performing loans in the PMBs' loan portfolio.
d) Undeveloped Mortgage-Backed Securities Market
E) High Cost of Building Construction
f) Weak Corporate Governance and Poor Risk Management Practices
g) Poor Loan Repayment Culture
NDIC ANNUAL REPORT AND STATEMENT OF ACCOUNT 2011
177
N
D I
CNIGERIADEPOSIT
INSURANCECORPORATION
