d iamond o ffshore (do) october 24, 2013 1 michael derenzo jason chan paddy gu caleb pierson
TRANSCRIPT

DIAMOND OFFSHORE (DO)October 24, 2013
1
Michael DeRenzoJason ChanPaddy GuCaleb Pierson

AGENDA• Introduction• Company Overview• Macroeconomic Outlook• Relevant Stock Market Prospects• Financial Analysis• Valuation• Recommendation
2

DIAMOND OFFSHORE IN RCMP
3
• February 2008: Purchased 100 shares at $122.82 per share• November 2008: Purchased 50 shares at $72.96 per share• April 2009: Sold a Sep. $80 call at $5.85; Bought a Sep. $60 put
at $4.78• September 2009: Sold 100 shares at $76.25 vs. exercise
adjusted strike on short call• October 2010: Purchased 100 shares at $68.02 per share• Current share price: $63.23 • Accounts for 2.4878% of total portfolio value
COMPANY OVERVIEW
4
Diamond Offshore Drilling
• Found in 1989 and headquartered in Houston, Texas• Global offshore oil drilling contractor that serves independent
oil and gas companies as well as government-owned oil companies• Operates Ultra-Deepwater, Deepwater, Mid-Water and Jack-up
oil rigs• Loews Corp. currently holds a 50.42% stake• Insurance companies, investment managers, hedge funds and
government pension sponsors hold a combined 49.35% stake• DO offers its oil rigs to 35 different customers– Major customers include Petróleo Brasileiro S.A. and OGX
Petróleo e Gás Ltda.– Accounts for 26 and 5 percent of gross trade accounts respectively– Compared to competitors, DO has a relatively large customer base
Source: Capital IQ, Form 10-Q 2Q 2013
FINANCIAL ANALYSIS
FINANCIAL ANALYSIS
COMPANY OVERVIEWCOMPANY OVERVIEW
STOCK MARKET
PROSPECTS
STOCK MARKET
PROSPECTS
MACRO OUTLOOK
MACRO OUTLOOK VALUATIONVALUATION

COMPANY OVERVIEW
5
Management’s Outlook
• Key factors that impact DO’s rigs operating results– Regulatory surveys and planned downtime
– 7 rigs will undergo surveys during second half of 2013– In total the 7 rigs will be out of service for approximately 670 days
– Physical damage on rigs– Construction and capital upgrade projects• All of these factors impact the revenue earning days for each of
the oil rigs, ultimately lowering the overall utilization rates and average daily revenue• Ultra-Deepwater and Deepwater Floater markets consists of
highest utilization rates– This will result in overall increased competition within these
markets
Source: Form 10-Q 2Q 2013
FINANCIAL ANALYSIS
FINANCIAL ANALYSIS
COMPANY OVERVIEWCOMPANY OVERVIEW
STOCK MARKET
PROSPECTS
STOCK MARKET
PROSPECTS
MACRO OUTLOOK
MACRO OUTLOOK VALUATIONVALUATION

BREAKDOWN OF OIL RIGS BY OCEAN DEPTH
6FINANCIAL ANALYSIS
FINANCIAL ANALYSIS
COMPANY OVERVIEWCOMPANY OVERVIEW
STOCK MARKET
PROSPECTS
STOCK MARKET
PROSPECTS
MACRO OUTLOOK
MACRO OUTLOOK VALUATIONVALUATION
Source: Diamond Offshore, 2012. DiamondOffsore: Investors:Annual Reports and Proxy Statements. 2012. 21 Feb. 2013http://investor.diamondoffshore.com/phoenix.zhtml?c=78110&p=irol-reportsandproxy

COMPANY OVERVIEW
7
- Source: IHS, . N.p.. Web. 29 Oct 2013. <http://www.ihs.com/products/oil-gas-information/drilling-data/weekly-rig-count.asp&xgt;.
DO Oil Rigs Ultra-Deepwater Deepwater Mid-Water Jack-ups
Revenue Earning Days (2013) 1,198 873 2,099 918
Utilization (2013) 83% 97% 64% 72%
Average Daily Revenue (2013) $350,000 $399,200 $266,500 $86,800
Breakdown Of DO Oil Rigs
• DO recently increased total rig count to 45 – 38 floaters (Ultra-Deepwater, Deepwater, Mid-Water) and 7 Jack-ups– The newest rig is expected to be completed by Q1 2016 and has been contracted for use
in Q3 2016• As of 10/18/2013 global supply of oil rigs hit 814– Marketed utilization rate of 95.1%
FINANCIAL ANALYSIS
FINANCIAL ANALYSIS
COMPANY OVERVIEWCOMPANY OVERVIEW
STOCK MARKET
PROSPECTS
STOCK MARKET
PROSPECTS
MACRO OUTLOOK
MACRO OUTLOOK VALUATIONVALUATION
8
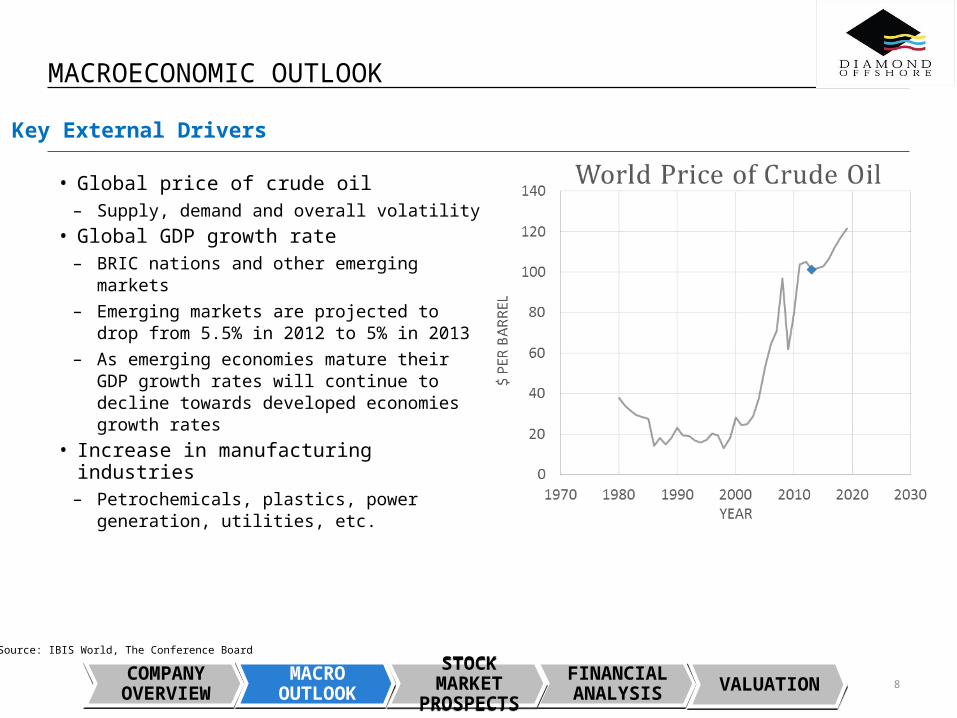
Key External Drivers
Source: IBIS World, The Conference Board
• Global price of crude oil– Supply, demand and overall volatility
• Global GDP growth rate– BRIC nations and other emerging markets– Emerging markets are projected to drop
from 5.5% in 2012 to 5% in 2013– As emerging economies mature their GDP
growth rates will continue to decline towards developed economies growth rates
• Increase in manufacturing industries– Petrochemicals, plastics, power generation,
utilities, etc.
MACROECONOMIC OUTLOOK
FINANCIAL ANALYSIS
FINANCIAL ANALYSIS
COMPANY OVERVIEWCOMPANY OVERVIEW
STOCK MARKET
PROSPECTS
STOCK MARKET
PROSPECTS
MACRO OUTLOOK
MACRO OUTLOOK VALUATIONVALUATION

9
PROJECTED GLOBAL SUPPLY & DEMAND OF OIL
Source: . N.p.. Web. 29 Oct 2013. <http://www.eia.gov/forecasts/ieo/more_highlights.cfm
• Liquid fuels still remain the largest energy source– Liquid share of world energy consumption expected to fall from 34% (2010) to 28% (2040)
Global Oil Production Global Oil Demand
FINANCIAL ANALYSIS
FINANCIAL ANALYSIS
COMPANY OVERVIEWCOMPANY OVERVIEW
STOCK MARKET
PROSPECTS
STOCK MARKET
PROSPECTS
MACRO OUTLOOK
MACRO OUTLOOK VALUATIONVALUATION

INDUSTRY OVERVIEW
10
Volatile prices prevail
BRIC demand
Deep-water Horizon
Oil and Gas consumption is expected to expand moderately as global economic growth continues
Environmental concerns associated with deep-sea oil and gas drilling
Rising operating costs through compliance monitoring and longer lead times
Industry's revenue is forecast to grow at an annualized rate of 2.5% in the five years to 2018 to $5.1 trillion
Ability to accommodate environmental requirements
Downstream ownership links
Output is sold under contract - incorporate long-term sales contracts
Control cost structure
Keys To Success
Industry TrendsCurrent Performance
FINANCIAL ANALYSIS
FINANCIAL ANALYSIS
COMPANY OVERVIEWCOMPANY OVERVIEW
STOCK MARKET
PROSPECTS
STOCK MARKET
PROSPECTS
MACRO OUTLOOK
MACRO OUTLOOK VALUATIONVALUATION

INDUSTRY LIFE CYCLE
Mature•Industry contribution to US economy average at 1.4% per year•Lag the global economy’s GDP •Technological change tend to be incremental•Merger activity is ongoing
11
Intr
od
uct
ion
Gro
wth
Mat
uri
ty
Dec
lin
e
TimeT
ota
l In
du
stry
R
eve
nu
e
FINANCIAL ANALYSIS
FINANCIAL ANALYSIS
COMPANY OVERVIEWCOMPANY OVERVIEW
STOCK MARKET
PROSPECTS
STOCK MARKET
PROSPECTS
MACRO OUTLOOK
MACRO OUTLOOK VALUATIONVALUATION
Source: IBIS World
PORTER’S FIVE FORCES
12
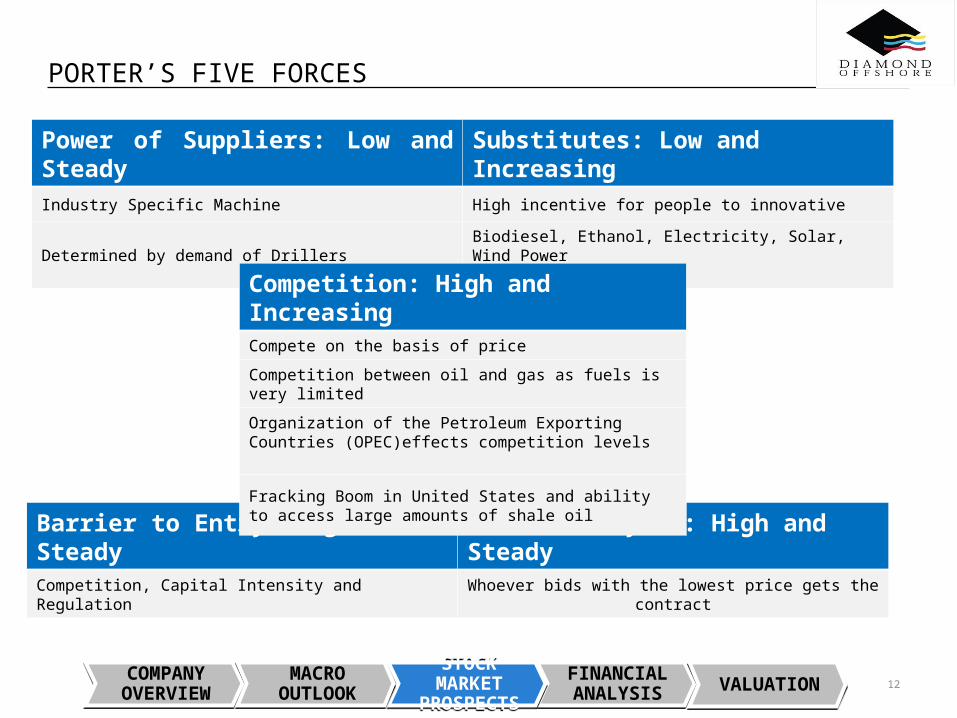
Power of Suppliers: Low and Steady Substitutes: Low and IncreasingIndustry Specific Machine High incentive for people to innovative
Determined by demand of Drillers Biodiesel, Ethanol, Electricity, Solar, Wind Power
Barrier to Entry: High and Steady Power of Buyers: High and SteadyCompetition, Capital Intensity and Regulation Whoever bids with the lowest price gets the contract
Competition: High and IncreasingCompete on the basis of price
Competition between oil and gas as fuels is very limited
Organization of the Petroleum Exporting Countries (OPEC)effects competition levels
Fracking Boom in United States and ability to access large amounts of shale oil
FINANCIAL ANALYSIS
FINANCIAL ANALYSIS
COMPANY OVERVIEWCOMPANY OVERVIEW
STOCK MARKET
PROSPECTS
STOCK MARKET
PROSPECTS
MACRO OUTLOOK
MACRO OUTLOOK VALUATIONVALUATION

13
INDUSTRY ANALYSIS – OIL & GAS EXPLORATION & DRILLING
Revenue Revenue Growth
Source: U.S. Energy Information Administration (EIA)." U.S. Energy Information Administration (EIA). N.p., n.d. Web. 29 Oct. 2013.
• Expected revenue: $4.5 Trillions in 2013• Up from $4.2 trillion in 2008• Annualized growth rate of 1.3% from 2008 to 2013. • Revenue is expected to grow 3.0% in 2013 • Industry performance did experience significant pitfalls• Profit has fluctuated according to oil and gas prices.
FINANCIAL ANALYSIS
FINANCIAL ANALYSIS
COMPANY OVERVIEWCOMPANY OVERVIEW
STOCK MARKET
PROSPECTS
STOCK MARKET
PROSPECTS
MACRO OUTLOOK
MACRO OUTLOOK VALUATIONVALUATION

DRILLING DAY RATES & UTILIZATION PERCENTAGES
14
Mid-Water Oil Rigs Deepwater & Ultra-Deepwater Oil Rigs
• IHS Petrodata Day Rate Indices track drilling fleet day rates and utilization percentages
• Day rates for Mid-Water Oil Rigs reached the highest level in October since the index’s inception in 1994
Source: "Day Rate Index | IHS." IHS Home Page. N.p., n.d. Web. 29 Oct. 2013.
FINANCIAL ANALYSIS
FINANCIAL ANALYSIS
COMPANY OVERVIEWCOMPANY OVERVIEW
STOCK MARKET
PROSPECTS
STOCK MARKET
PROSPECTS
MACRO OUTLOOK
MACRO OUTLOOK VALUATIONVALUATION

UNDERSTANDING MARKET POWER
15
Strengths Weaknesses- Majority of fleet is in
sector with highest utilization rate
- Have five new ultra deep rigs becoming available soon
- Highly dependent on cash flow from a volatile emerging market
- Rely on a relatively small number of customers
Opportunities Threats- New technology allows for
deeper water exploration- Market does not have a
dominant company
- Volatility of crude oil prices
- Decline in GDP growth rates in emerging markets
- High incentives towards alternative energy
FINANCIAL ANALYSIS
FINANCIAL ANALYSIS
COMPANY OVERVIEWCOMPANY OVERVIEW
STOCK MARKET
PROSPECTS
STOCK MARKET
PROSPECTS
MACRO OUTLOOK
MACRO OUTLOOK VALUATIONVALUATION

FINANCIAL ANALYSIS - RATIOS
16
DO, Financial Analysis
Liquidity Ratios2008 2009 2010 2011 2012
Current Ratio 2.88 4.17 2.98
4.66
4.39
Quick Ratio 2.88 4.17 2.98
4.66
4.39
Cash Ratio 1.45 1.88 1.72
2.89
3.06
Profitability Ratios2008 2009 2010 2011 2012
Operating Profit Margin 52.41% 42.89% 37.79% 32.22% 39.68%Net Margin 37.90% 28.75% 28.97% 24.12% 25.52%ROA 27.87% 15.25% 14.31% 10.35% 10.32%ROE (Book Value) 41.10% 26.32% 24.93% 16.63% 16.31%
Solvency Ratios2008 2009 2010 2011 2012
Debt/Assets 0.12 0.24 0.22 0.21
0.21
Debt/Equity 0.18 0.41 0.39 0.35
0.33
Interest Coverage 189.20 38.36 15.72
17.17 20.82
Activity Ratios2008 2009 2010 2011 2012
A/R Turnover 6.17 4.59 5.45 5.89
5.98
Days Sales Outstanding 59.20 79.51
66.96 61.95
61.07
Fixed Asset Turnover 1.04 0.82 0.78
0.71
0.61
Total Asset Turnover 0.72 0.58 0.49 0.48
0.41
FINANCIAL ANALYSIS
FINANCIAL ANALYSIS
COMPANY OVERVIEWCOMPANY OVERVIEW
STOCK MARKET
PROSPECTS
STOCK MARKET
PROSPECTS
MACRO OUTLOOK
MACRO OUTLOOK VALUATIONVALUATION

FINANCIAL ANALYSIS – DUPONT
DuPont Analysis2008 2009 2010 2011 2012
Tax Burden 70.95% 73.66% 71.52% 81.62% 78.48%
Interest Burden 96.69% 98.17% 93.73% 93.93% 95.40%
Operating Profit Margin 52.41% 42.89% 37.79% 32.22% 39.68%
Asset Turnover 72.1% 57.97% 49.40% 47.71% 41.28%
Leverage 1.47 1.73
1.74
1.61 1.58
ROE 38.06% 31.02% 21.80% 18.94% 19.38%
17FINANCIAL ANALYSIS
FINANCIAL ANALYSIS
COMPANY OVERVIEWCOMPANY OVERVIEW
STOCK MARKET
PROSPECTS
STOCK MARKET
PROSPECTS
MACRO OUTLOOK
MACRO OUTLOOK VALUATIONVALUATION

RECENT STOCK PERFORMANCE
18
20 & 200 Day Moving Average Stock Chart
• DO’s stock price has been well below the 200 day moving average since the end of July, 2013
• Currently the stock price is hovering right around the 20 day moving average and looks as if it may fall below the 20 day moving average in the near future
FINANCIAL ANALYSIS
FINANCIAL ANALYSIS
COMPANY OVERVIEWCOMPANY OVERVIEW
STOCK MARKET
PROSPECTS
STOCK MARKET
PROSPECTS
MACRO OUTLOOK
MACRO OUTLOOK VALUATIONVALUATION
Source: Yahoo Finance

VALUATION – UTILIZATION RATES
Utilization Rates - DOHistorical figures Forecast Figures2010A 2011A 2012A 2013P 2014P 2015P 2016P 2017P
Average Utilization Rates: Ultra-Deepwater 66% 82% 85% 85% 85% 84% 84% 83%
Deepwater 74% 94% 88% 88% 88% 87% 87% 86%
Mid-Water 79% 72% 68% 64% 64% 64% 63% 62%
Jack-Ups 61% 47% 53% 50% 50% 49% 48% 47%
Average Dayrates:
Ultra-Deepwater 358.40 342.90 354.90 365.55 376.51 387.81 399.44 411.43
Deepwater 401.90 416.50 368.80 379.86 391.26 403.00 415.09 427.54
Mid-Water 281.00 269.60 263.60 271.51 279.65 288.04 296.68 305.58
Jack-Ups 87.70 81.90 90.20 92.91 95.69 98.56 101.52 104.57
Number of Rigs
Ultra-Deepwater 9 11 12 12 12 12 13 13
Deepwater 5 6 7 7 7 7 7 8
Mid-Water 19 19 18 18 18 18 18 18
Jack-Ups 13 13 7 7 5 5 4 4
Total 46 49 44 44 42 42 42 43
19
Total Revenue ($ in millions) Ultra-Deepwater 777.05 1,128.93 1,321.29 1,440.99 1,500.71 1,562.71 1,762.68 1,835.09
Deepwater 542.77 857.41 829.21 873.50 899.70 936.99 965.10 1,148.54
Mid-Water 1,539.50 1,346.17 1,177.66 1,141.64 1,194.26 1,230.09 1,305.97 1,365.23
Jack-Ups 253.84 182.65 122.14 118.69 87.32 89.94 74.11 76.33
Total Contract Drilling Revenue 3,113.16 3,515.15 3,450.31 3,574.81 3,681.99 3,819.73 4,107.87 4,425.19

VALUATION – WACC
WACC Calculation
Capital Structure
Debt-to-Total Capitalization 24.2%Equity-to-Total Capitalization 75.8%
Cost of Debt
Cost of Debt 5.9%
Tax Rate 30.0%
After-tax Cost of Debt 4.1%
Cost of Equity
Risk-free Rate(1) 2.7%
Market Risk Premium 6.8%
Levered Beta 1.30
Cost of Equity 11.5%
WACC 9.7%
(1) Interpolated yield on 10-year U.S. Treasury
(2) Sourced from Capital
20
Comparable Companies Unlevered Beta
Market Market Debt/ Marginal Unlevered
Company Levered Beta Value of Debt Value of Equity Equity Tax Rate Beta
Transocean Ltd. (NYSE:RIG) 1.42 $12,459.0 $16,297.8 68.9% 30.0% 0.96
Ensco plc (NYSE:ESV) 1.33 $4,845.9 $12,802.0 39.0% 30.0% 1.04
Noble Corp. (NYSE:NE) 1.50 $4,634.4 $9,521.0 59.9% 30.0% 1.06
Rowan Companies plc (NYSE:RDC) 1.50 $2,009.6 $8,778.0 42.7% 30.0% 1.15
Atwood Oceanics, Inc. (NYSE:ATW) 1.59 $838.3 $4,512.0 63.9% 30.0% 1.10
Mean 1.47 0.55 1.06
Median 1.50 0.60 1.06
Relevered Beta
Mean Target Target
Unlevered Debt/ Marginal Relevered
Beta Equity Tax Rate Beta
Relevered Beta 1.06 31.9% 30.0% 1.30
FINANCIAL ANALYSIS
FINANCIAL ANALYSIS
COMPANY OVERVIEWCOMPANY OVERVIEW
STOCK MARKET
PROSPECTS
STOCK MARKET
PROSPECTS
MACRO OUTLOOK
MACRO OUTLOOK VALUATIONVALUATION

CAPEX PROJECTIONS
21
Comparable Companies Capital Expenditures (2008) Capital Expenditures (2009) Capital Expenditures (2010) Capital Expenditures (2011) Capital Expenditures (2012) Average Growth Rate
Transocean Ltd. (NYSE:RIG) ($2,208.00) ($3,041.00) ($1,349.00) ($974.00) ($1,303.00)
Growth Rate(%) 37.73% -55.64% -27.80% 33.78% -2.98%
Ensco plc (NYSE:ESV) ($764.20) ($857.20) ($875.30) ($729.00) ($1,802.20)
Growth Rate(%) 12.17% 2.11% -16.71% 147.22% 36.20%
Noble Corp. (NYSE:NE) ($1,123.69) ($1,495.06) ($1,266.83) ($2,540.19) ($1,790.89)
Growth Rate(%) 33.05% -15.27% 100.52% -29.50% 22.20%
Rowan Companies plc (NYSE:RDC) ($829.16) ($566.38) ($490.56) ($1,517.67) ($685.26)
Growth Rate(%) -31.69% -13.39% 209.38% -54.85% 27.36%
Atwood Oceanics, Inc. (NYSE:ATW) ($328.25) ($430.47) ($187.09) ($514.86) ($785.08)
Growth Rate(%) 31.14% -56.54% 175.19% 52.49% 50.57%
Average Growth Rate: 26.67%
DO’s Capex growth rate based off of the average historical Capex of the Comparable Companies from FY2008 – FY2012

VALUATION – DCF
22FINANCIAL ANALYSIS
FINANCIAL ANALYSIS
COMPANY OVERVIEWCOMPANY OVERVIEW
STOCK MARKET
PROSPECTS
STOCK MARKET
PROSPECTS
MACRO OUTLOOK
MACRO OUTLOOK VALUATIONVALUATION
Discounted Cash Flows - DO
Historical Figures Forecast Figures
2008A 2009A 2010A 2011A 2012A 2013P 2014P 2015P 2016P 2017P
EBIT 2,011,491.00 1,998,154.00 1,472,111.00 1,309,995.00 991,731.00 1,526,725.89 1,464,752.29 1,476,298.42 1,510,323.77 1,574,801.63
Less: Income Taxes (536,499.00) (492,212.00) (380,559.00) (216,729.00) (197,604.00) (406,119.86) (389,762.17) (360,214.94) (376,172.27) (416,173.42)
Plus: D&A 287,417.00 346,446.00 393,177.00 398,612.00 392,913.00 533,312.47 731,495.82 926,146.86 1,262,794.12 1,713,025.32
Less: CapEx (666,857.00) (412,444.00) (434,262.00) (774,756.00) (702,041.00) (888,854.11) (1,125,378.19) (1,424,841.32) (1,803,991.60) (2,284,033.77)Less: Change in Working Capital: (311,884.00) 160,661.00 (458,810.00) (80,338.00) (28,580.73) 3,522.25 (109,542.07) 81,011.82 10,566.76
Unlevered FCF 687,507.87 559,091.60 284,703.68 293,660.48 (7,343.07)
Terminal Value = 19,385,911.52
Present Value of Cash Flows 693,032.98 611,792.63 470,924.54 556,161.01 481,175.11 PV of Terminal Value = 10,521,896.10
Discount Rate: 13.0%
EV = 11,941,596.76
3.3% premium added due to business risks involved

VALUATION – DCF
23
Terminal Value Assumption
Terminal Multiple 8.0x
Terminal Value 19,385,911.52
Calculation of Implied Share Price
Implied Enterprise Value $ 11,941,597
Less: Debt $ 1,496,066
Plus: Cash $ 1,485,590
Implied Market Cap $ 11,931,121
Implied Share Price $ 85.81
EBITDA Exit Multiple
EV/EBITDA Weighted
Transocean Ltd. (NYSE:RIG) 8.6x 20.0%
Ensco plc (NYSE:ESV) 7.7x 55.0%
Noble Corp. (NYSE:NE) 9.0x 5.0%
Rowan Companies plc (NYSE:RDC) 9.6x 10.0%
Atwood Oceanics, Inc. (NYSE:ATW) 8.9x 10.0%
Weighted Average: 8.0x
FINANCIAL ANALYSIS
FINANCIAL ANALYSIS
COMPANY OVERVIEWCOMPANY OVERVIEW
STOCK MARKET
PROSPECTS
STOCK MARKET
PROSPECTS
MACRO OUTLOOK
MACRO OUTLOOK VALUATIONVALUATION

VALUATION – COMPARABLES COMPANY ANALYSIS
24
Multiples Weight Implied DO Share Price
Price/Book Value 20% $ 41.37
Forward TEV/Sales 20% $ 85.76
Forward TEV/EBITDA 25% $ 36.35
Forward P/E 25% $ 58.28
DCF 10% $ 85.81
DO Implied Stock Price $ 57.66
Comparables - DOEnterprise
Value / Price / Growth Rates Profitability
CY 2012 CY 2013 CY 2014 LT
Equity Debt/ Enterprise EPS EPS EPS EPS 1 Year Margins
Value Equity Value Rev. EBITDA BV Actual (1) Est. (1) Est. (1) Growth (1) Rev. EBITDA EBITDA NI
Transocean Ltd. (NYSE:RIG) $ 16,298 68.9% $ 23,722 2.5x 8.6x 1.0x 10.1x 11.5x 8.7x 22.8% 3.1% -1.5% 29.5% 7.5%
Ensco plc (NYSE:ESV) $ 12,802 39.0% $ 17,127 3.7x 7.7x 1.0x 10.0x 8.6x 7.5x 16.1% 16.1% 14.8% 48.5% 26.9%
Noble Corp. (NYSE:NE) $ 9,521 59.9% $ 15,399 4.1x 9.0x 1.2x 16.8x 12.9x 8.4x 20.3% 19.7% 29.5% 47.1% 18.7%
Diamond Offshore Drilling, Inc. (NYSE:DO) $ 8,778 31.9% $ 9,055 3.1x 6.6x 1.9x 12.6x 13.3x 10.0x 17.6% -0.7% -5.0% 46.9% 24.0%
Rowan Companies plc (NYSE:RDC) $ 4,512 42.7% $ 55,159 3.6x 9.6x 1.0x 18.2x 16.7x 10.2x 21.6% 14.0% 9.6% 37.8% 15.4%
Atwood Oceanics, Inc. (NYSE:ATW) $ 3,462 63.9% $ 4,581 4.6x 8.9x 1.7x 10.8x 10.3x 8.4x 23.5% 34.8% 39.7% 51.6% 33.6%
Mean 3.7x 8.8x 1.2x 13.2x 12.0x 8.6x 0.2x 0.2x 0.2x 0.4x 0.2xMedian 3.7x 8.9x 1.0x 10.8x 11.5x 8.4x 0.2x 0.2x 0.1x 0.5x 0.2x
High 4.6x 9.6x 1.7x 18.2x 16.7x 10.2x 0.2x 0.3x 0.4x 0.5x 0.3xLow 2.5x 7.7x 1.0x 10.0x 8.6x 7.5x 0.2x 0.0x 0.0x 0.3x 0.1x
FINANCIAL ANALYSIS
FINANCIAL ANALYSIS
COMPANY OVERVIEWCOMPANY OVERVIEW
STOCK MARKET
PROSPECTS
STOCK MARKET
PROSPECTS
MACRO OUTLOOK
MACRO OUTLOOK VALUATIONVALUATION

COMPARABLES STOCK CHART
25FINANCIAL ANALYSIS
FINANCIAL ANALYSIS
COMPANY OVERVIEWCOMPANY OVERVIEW
STOCK MARKET
PROSPECTS
STOCK MARKET
PROSPECTS
MACRO OUTLOOK
MACRO OUTLOOK VALUATIONVALUATION
• From the start of the year (2013), DO’s stock price has been one of the lowest (Jan – May) and the lowest (May – Dec) among its competitors.
Source: Yahoo Finance

DECISION DRIVERS
• Strengths– Positioned to take advantage of deep water and ultra-deep water opportunities
with forthcoming drillships and semisubmersibles– Deepwater and ultra-deep water are the areas with the highest current utilization
rate• Concerns– Slow down in emerging market GDP growth – Alternative sources of energy and oil– Large forthcoming capital expenditures for fleet maintenance/upgrade– Stock performance vs. comparables show poor performance– Highly competitive and cyclical industry
26FINANCIAL ANALYSIS
FINANCIAL ANALYSIS
COMPANY OVERVIEWCOMPANY OVERVIEW
STOCK MARKET
PROSPECTS
STOCK MARKET
PROSPECTS
MACRO OUTLOOK
MACRO OUTLOOK VALUATIONVALUATION
RECOMMENDATION
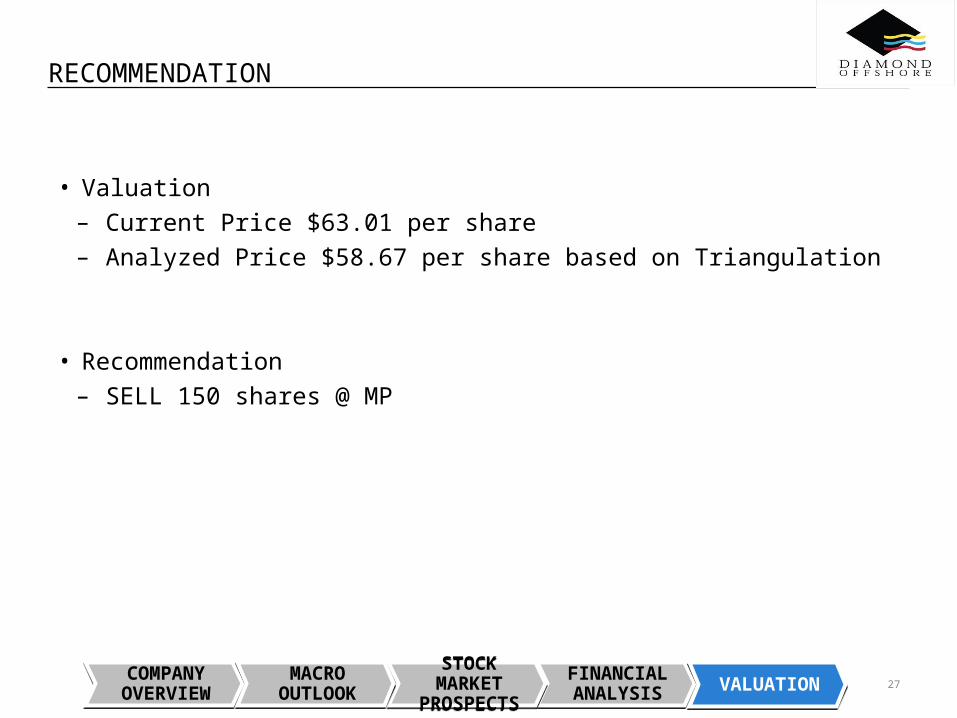
• Valuation– Current Price $63.01 per share– Analyzed Price $58.67 per share based on Triangulation
• Recommendation– SELL 150 shares @ MP
27FINANCIAL ANALYSIS
FINANCIAL ANALYSIS
COMPANY OVERVIEWCOMPANY OVERVIEW
STOCK MARKET
PROSPECTS
STOCK MARKET
PROSPECTS
MACRO OUTLOOK
MACRO OUTLOOK VALUATIONVALUATION

QUESTIONS?
28