d macroeconomic o n - vliz
TRANSCRIPT
LAND-OCEAN INTERACTIONS IN THE COASTAL ZONE (LOICZ)
Core Project of theInternational Geosphere-Biosphere Programme: A Study Of Global Change (IGBP)
of the International Council of Scientific Unions (ICSU)
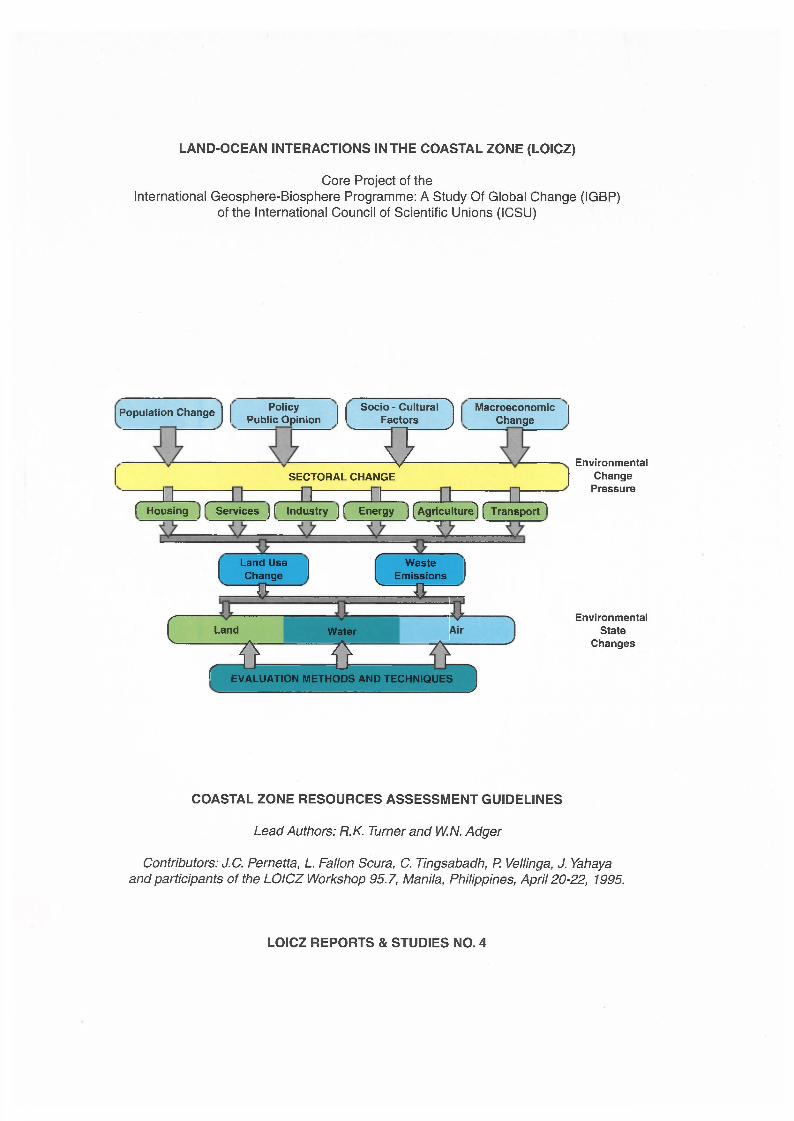
Population Change Policy Public Opinion
Socio - Cultural Factors
o nD Macroeconomic
Change
SECTORAL CHANGE
C
Land Use Change
= 0= C WasteEmissions
’O' _
Land Water
r £ gEVALUATION METHODS AND TECHNIQUES
EnvironmentalChange
Pressure
f Housing j f Services J f Industry J f Energy j [Agriculture] [ Transport 1
EnvironmentalState
Changes
COASTAL ZONE RESOURCES ASSESSMENT GUIDELINES
Lead Authors: R.K. Turner and W.N. Adger
Contributors: J.C. Pernetta, L. Fallon Scura, C. Tingsabadh, P. Velllnga, J. Yahaya and participants of the LOICZ Workshop 95.7, Manila, Philippines, April 20-22, 1995.
LOICZ REPORTS & STUDIES NO. 4

COASTAL ZONE RESOURCES ASSESSMENT GUIDELINES
Lead Authors:R.K. Turner and W.N. Adger
Centre for Social and Economic Research on the Global Environment,University of East Anglia and University College London.
The Centre for Social and Economic Research on the Global Environment (CSERGE) is a designated research centre of the UK Economic and Social Research Council (ESRC).
Contributors: J.C. Pemetta, L. Fallon Scura, C. Tingsabadh, P. Vellinga, J. Yahaya, and participants in the LOICZ Workshop 95.7, Manila, Philippines, April 20-22, 1995.
LOICZ
I G B P
LOICZ REPORTS & STUDIES No. 4
Published in the Netherlands, 1996 by: LOICZ Core Project Netherlands Institute for Sea Research P.O. Box 591790 AB Den Burg - Texel The Netherlands
The Land-Ocean Interactions in the Coastal Zone Project is a Core Project of the “International Geosphere-Biosphere Programme: A Study Of Global Change”, of the International Council of Scientific Unions.
The LOICZ Core Project is financially supported through the Netherlands Organisation for Scientific Research by: the Ministry of Education, Culture and Science; the Ministry of Transport, Public Works and Water Management; the Ministry of Housing, Planning and Environment; and the Ministry of Agriculture, Nature Management and Fisheries of The Netherlands, as well as The Royal Netherlands Academy of Sciences, and The Netherlands Institute for Sea Research.
COPYRIGHT © 1996, Land-Ocean Interactions in the Coastal Zone Core Project of the IGBP.Second edition.
Reproduction of this publication for educational or other, non-commercial purposes is authorised without prior permission from the copyright holder.
Reproduction for resale or other purposes is prohibited without the prior, written permission of the copyright holder.
Citation: Turner, R.K. and W. N. Adger. 1996. Coastal Zone Resources Assessment Guidelines.LOICZ/R&S/96-4, iv + 101 pp. LOICZ, Texel, The Netherlands.
ISSN: 1383-4304
Cover: Extract from Pressure-State-Response (P-S-R) framework flowchart.
Disclaimer : The designations employed and the presentation of the material contained in this report do not imply the expression of any opinion whatsoever on the part of LOICZ or the IGBP concerning the legal status of any state, territory, city or area, or concerning the delimitation’s of their frontiers or boundaries. This report contains the views expressed by the authors and may not necessarily reflect the views of the IGBP.
The LOICZ Reports and Studies Series is published and distributed free of charge to scientists involved in global change research in coastal areas.
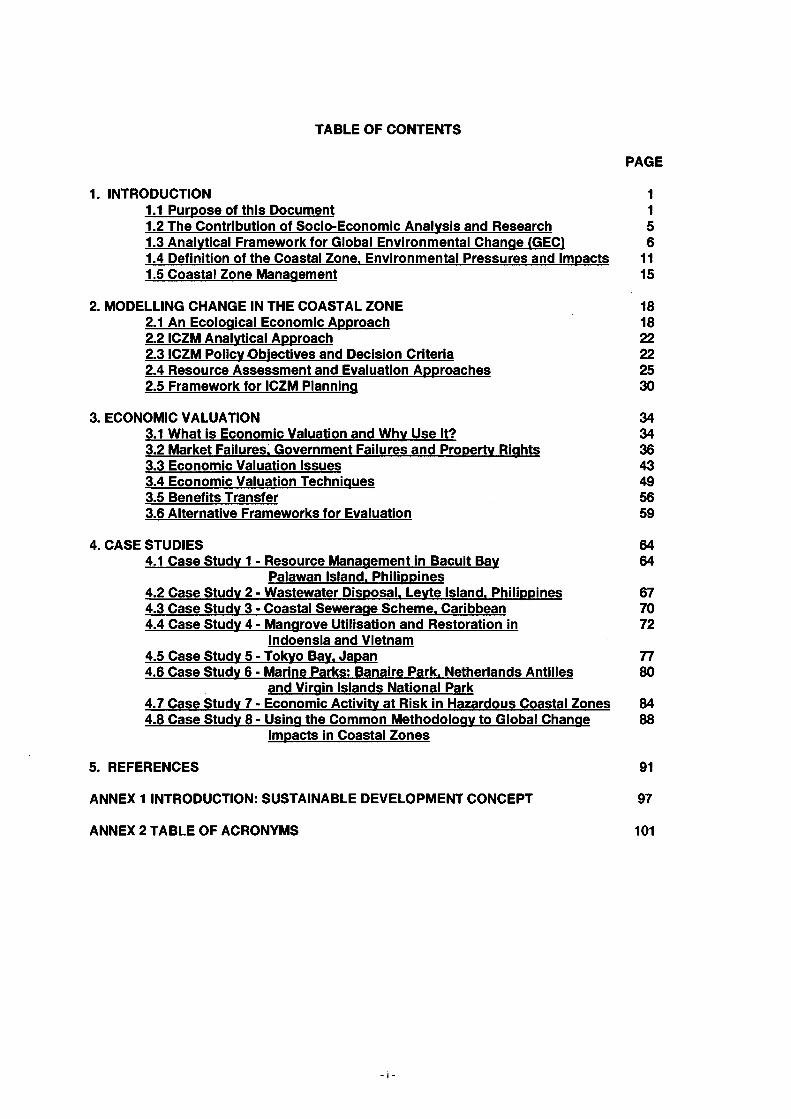
TABLE OF CONTENTS
PAGE
1. INTRODUCTION 11.1 Purpose of this Document 11.2 The Contribution of Socio-Economic Analysis and Research 51.3 Analytical Framework for Global Environmental Change (GEC) 61.4 Definition of the Coastal Zone. Environmental Pressures and Impacts 111.5 Coastal Zone Management 15
2. MODELLING CHANGE IN THE COASTAL ZONE 182.1 An Ecological Economic Approach 182.2 ICZM Analytical Approach 222.3 ICZM Policy Objectives and Decision Criteria 222.4 Resource Assessment and Evaluation Approaches 252.5 Framework for ICZM Planning 30
3. ECONOMIC VALUATION 343.1 What is Economic Valuation and Why Use It? 343.2 Market Failures. Government Failures and Property Rights 363.3 Economic Valuation Issues 433.4 Economic Valuation Techniques 493.5 Benefits Transfer 563.6 Alternative Frameworks for Evaluation 59
4. CASE STUDIES 644.1 Case Study 1 - Resource Management in Bacuit Bav 64
Palawan Island. Philippines4.2 Case Study 2 - Wastewater Disposal. Levte Island. Philippines 674.3 Case Study 3 - Coastal Sewerage Scheme. Caribbean 704.4 Case Study 4 - Mangrove Utilisation and Restoration in 72
Indoensia and Vietnam4.5 Case Study 5 - Tokvo Bav. Japan 774.6 Case Study 6 - Marine Parks: Banaire Park. Netherlands Antilles 80
and Virgin Islands National Park4.7 Case Study 7 - Economic Activity at Risk in Hazardous Coastal Zones 844.8 Case Study 8 - Usina the Common Methodology to Global Change 88
Impacts in Coastal Zones
5. REFERENCES 91
ANNEX 1 INTRODUCTION: SUSTAINABLE DEVELOPMENT CONCEPT 97
ANNEX 2 TABLE OF ACRONYMS 101
PAGETEXT BOXES
Text Box 1. Summary of appraisal manuals for environmental projects and policies. 1Text Box 2. Characteristics and importance of the coastal zone. 8Text Box 3. A general value typology (Hargrove, 1992). 44
TABLES
Table 1. Environmental pressures and impact categories (Turner etal., in press). 12Table 2. Populations in the coastal zone in relation to country population and area. 14
(World Bank, 1995).Table 3. Forest areas, deforestation rate and loss of mangrove in selected 19
African countries. (World Bank, 1995).Table 4. Comparative evaluation of different decision frameworks (Lave and Malès, 1989). 24 Table 5. Environmental evaluation methods, showing increasing complexity 25
and scale of analysis (Pearce and Turner, 1992).Table 6. Coastal environmental impacts and valuation methods. 26Table 7. Private and public goods typology (OECD, 1994). 34Table 8. Mangrove conversion versus conservation of the source 36
(Dixon and Burbridge, 1984).Table 9. Implicit willingness to pay in debt-for-nature-swaps (Pearce, 1993). 47Table 10.Typology of ecological functions of wetlands (Turner and Jones, 1991). 57Table 11. Economic values and wetland functions (Pearce, 1993). 58Table 12. Comparison of decision-aiding techniques (OECD, 1992). 63Table 13.10 year aggregate gross revenues and present values of gross revenues 65
in US$ (Hodgson and Dixon, 1988).Table 14. Rice productivity damage cost (Dixon and Hufschmidt, 1986). 68Table 15.Marine fisheries damage cost (Dixon and Hufschmidt, 1986). 68Table 16. Waste disposal options: comparative cost-effectiveness 69
(Dixon and Hufschmidt, 1986).Table 17. Parameters and valuation assumptions in valuing mangrove conversion, 73
Bintuni Bay, Indonesia (Ruitenbeek, 1994). (Note: US$ 1 = Rp 2000.)Table 18. Benefits and costs of mangrove rehabilitation in Vietnam and their valuation 75
(Tri et al., 1996). (Note: US$ 1 = VND 11,000)Table 19. Costs and benefits of direct and indirect use values of mangrove rehabilitation 75
(Tri etal., 1996).(Note: US$ 1 = VND 11,000; B:C ratio = NPV Benefits / NPV Costs)
Table 20. Estimated gross benefits of recreation (1091980 yen) under 78alternative scenario-policy combinations (Bower and Takao, 1993).
Table 21 .Costs and benefits for selected cases, management of Tokyo Bay 79(Bower and Takao, 1993).
Table 22.Bonaire Marine Park: Revenues and costs (Dixon etal., 1994). 81Table 23.National park’s economic Impact (Dixon and Sherman, 1990). 82Table 24.Imputed economic impact of tourism expenditure (1980) 83
(Dixon and Sherman, 1990).Table 25. GDP at risk from sea level rise in the Nile Delta, Egypt and Bangladesh 86
(Edwards, 1987; Milliman etal. 1989).Table 26. GDP affected by projected 0.8 m sea level rise in the Bengal Delta 87
(Edwards, 1987).Table 27. Costs and benefits of policy responses to sea level rise in East Anglia 90
(Turner etal., 1995).
FIGURES
Figure 1. Research agenda for integrated management of coastal zone 3research use and sustainable development.
Figure 2. Relationship between the LOICZ defined research tasks and sub-tasks 4and the conceptual research framework outlined in Figure 1.
Figure 3. Pressure-State-Response (P-S-R) Framework (based on OECD 9Environmental Indicators Format).
Figure 4. Coastal zone: Pressure-State-Response framework.. 10Figure 5. A general model of decision processes 16
(Mintzberg etal., 1976; quoted in Janssen; 1991)Figure 6. Simple schematic of the elements of ICZM. 17Figure 7. Valuing coastal zone benefits (Turner, 1988; Barbier, 1989). 20Figure 8. Spectrum of appraisal methods. 24Figure 9. Stepwise approach for vulnerability analyses (IPCC, CZMS, 1992). 29Figure 10. A planning framework for integrated coastal zone management 31
(Ehlerand Bower, 1995).Figure 11. Spectrum of environmental commodities and valuation 35
(Bateman and Turner, 1993).Figure 12. A typology of common property resources (Buck, 1989). 37Figure 13. Methods for the monetary evaluation of the environment. 50Figure 14. Evaluating recreation using the travel cost method. 52Figure 15. Net present values of direct and indirect benefits of mangrove rehabilitation 76
in northern Vietnam by discount rate (Tri etal., 1996).Figure 16. Net present value of GDP at risk (1990-2050) from sea level rise through 85
erosion and flooding threats in East Anglia, United Kingdom (Turner etal., 1995).Notes: Growth refers to GDP growth per year (see text).
Figure 17. Spectrum of overlapping sustainability positions. 98Figure 18. Sustainability practice (Turner, 1993). 100
- iii -

1. INTRODUCTION
1.1 Purpose of this Document
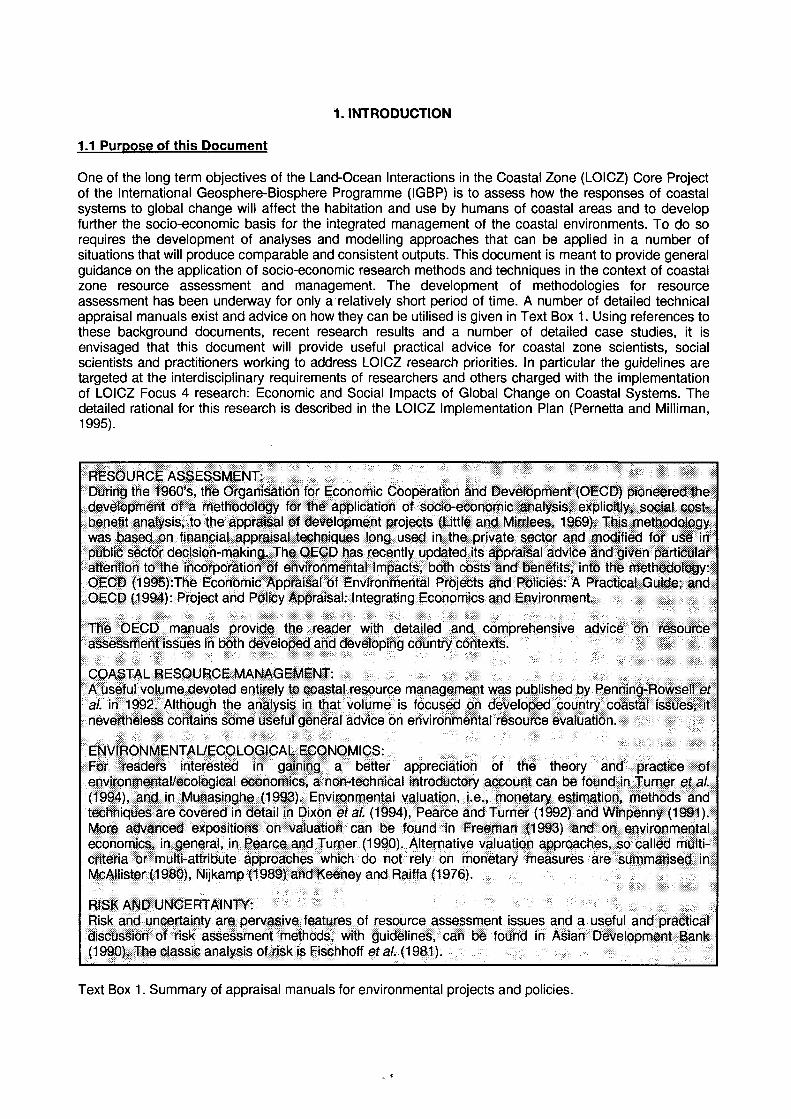
One of the long term objectives of the Land-Ocean Interactions in the Coastal Zone (LOICZ) Core Project of the International Geosphere-Biosphere Programme (IGBP) is to assess how the responses of coastal systems to global change will affect the habitation and use by humans of coastal areas and to develop further the socio-economic basis for the integrated management of the coastal environments. To do so requires the development of analyses and modelling approaches that can be applied in a number of situations that will produce comparable and consistent outputs. This document is meant to provide general guidance on the application of socio-economic research methods and techniques in the context of coastal zone resource assessment and management. The development of methodologies for resource assessment has been underway for only a relatively short period of time. A number of detaiied technical appraisal manuals exist and advice on how they can be utilised is given in Text Box 1. Using references to these background documents, recent research results and a number of detailed case studies, it is envisaged that this document will provide useful practical advice for coastal zone scientists, social scientists and practitioners working to address LOICZ research priorities. In particular the guidelines are targeted at the interdisciplinary requirements of researchers and others charged with the implementation of LOICZ Focus 4 research: Economic and Social Impacts of Global Change on Coastal Systems. The detailed rational for this research is described in the LOICZ Implementation Plan (Pernetta and Milliman, 1995).
During the 1960’s, the Organisation for Economic Cooperation and Development (OECD) pioneered the development of a methodology for the application of socio-economic analysis, explicitly, social cost- benefit analysis, to the appraisal of development projects (Little and Mirrlees, 1969). This methodology
public sector decision-making. The OECD has recently updated its appraisal advice and given particular attention to the incorporation of environmental impacts, both costs and benefits, into the methodology: OECD (1995):The Economic Appraisal of Environmental Projects and Policies: A Practical Guide; and
A useful volume devoted entirely to coastal resource management was published by Penning-Rowsell et
ÍfW f|lm ||É ÍÍlÍli||iiái;llM
McAllister (1980), Nijkamp (1989) and Keeney and Raiffa (1976).
Risk and uncertainty are pervasive features of resource assessment issues and a useful and practical discussion of risk assessment methods, with guidelines, can be found in Asian Development Bank (1990). The classic analysis of risk is Fischhoff etal. (1981).
Text Box 1. Summary of appraisal manuals for environmental projects and policies.
The research agenda required to support successful coastal zone management is extensive ranging from basic environmental and socio-economic data compilation, to analysis, model generation and application, to the development and application*of policies and regulations (Figure 1). In the LOICZ Implementation Plan (Pemetta and Milliman, 1995), under Focus 4, three high priority areas of research have been identified:
4.1 Evolution of coastal systems under different scenarios of global change;4.2 Effects of changes to coastal systems on social and economic activities; and4.3 Development of improved strategies for the management of coastal resources.
Thus, the primary concern of Focus 4 research will deal with those issues illustrated in the box at the top of Figure 1. The relationship between the research activities, shown at the top of Figure 1, and the tasks and sub-tasks as laid out in the LOICZ Implementation Plan are shown in Figure 2.
In addition to recognising the importance of coastal zone resources to humans, and the direct and indirect effects that increased human utilisation of these resources will have on the functioning of coastal systems, LOICZ Focus 4 research seeks to forecast possible future states for coastal systems under different scenarios of global change. The development of ‘realistic’ scenarios will require an interdisciplinary research effort involving both natural and social scientists (Activity 4.1). Such scenarios must encompass not merely the changes to the physical, chemical and biological components of the coastal sub-system of the biosphere-geosphere complex, but also realistic scenarios of land-use, population growth and migration, consumption patterns and the use of coastal space and resources.
Developing ‘realistic’ scenarios of change in coastal systems that are of practical value to coastal zone managers, involves the recognition of pervasive feedback mechanisms between the coastal environment and coastal populations (Activity 4.2). Economic and environmental systems are now becoming jointly determined, and the scale of economic activity is now such that the issues of human use of coastal environments are critical to most regions of the world. Environmental feedback effects are being observed that have potentially important implications for the welfare of both present and future generations. The sustainable development policy objective has received widespread support since the late 1980s, but the details of a practical sustainability policy strategy have yet to be fully worked out, following the Brundtland Commission’s lead (WCED, 1987), see Annex 1.
It is possible that the dynamics of the jointly determined economic-ecological system are characterised by discontinuous change around critical threshold values for both species and their habitats and for ecosystem processes and functions. The existing size of the human population, current utilisation of coastal resources and consequential rates of growth in the demand for ecological services, have led to an increased recognition of the importance of feedbacks between ecological and economic systems. This process of environmental change may have moved societies and ecosystems into such novel and unfamiliar territory that the future evolution of both has become much more unpredictable than it was for earlier generations.
The closer the joint system is to a threshold, the smaller the perturbation needed to dislodge it. There already exist numerous examples of discontinuous change as a result of a gradual build-up of economic pressure. In many such cases large-scale modifications of ecosystems are the result of many local and disconnected activities, i.e., the tyranny of small decisions (Turner et al., 1995b). The widespread destruction of mangroves and coastal wetlands in tropical Asia, Africa and America for shrimp farming is one example. In this case, the incremental destruction of mangrove systems has had a non-incremental effect on the ability of these systems to provide spawning and nursery grounds for fish and shellfish. In another case, the incremental build-up of pollutants in many coastal waters has changed the structure of plankton communities causing an increase in toxic algal blooms.
LOICZ activities under Focus 4 are meant to contribute to the scientific basis for sound management of the coastal zone, although they are not in themselves required to generate precise detailed management guidelines. Rather, work under Activity 4.3 will be designed to assess the extent to which scientific understanding of coastal zone processes and the nature of changes occurring in these areas could contribute to the formulation of integrated coastal zone management strategies designed to ensure sustainable use of coastal environments and resources.
LOICZ FOCUS 4 PRIMARY CONCERNS
RESOURCE BASE AUDITInformation failure
DRIVING FORCES FOR GLOBAL CHANGEEnvironmental and Socio-economic
Baseline Data, Inventories and Analyses
RESOURCE USE SCENARIOSMarket failure
1------------------CASE STUDIES
Policy failure
Biophysical and socio-economic data relating to processes, functions and structures - including institutional
structures and financing arrangements
Underlying causes and patterns of existing and future use including
population change, industrial development, tourism etc. and
related legal issues
ICovering past success and
failures in Coastal Zone Management
GLOBAL ENVIRONMENTAL CHANGE SCIENTIFIC DATA
COMMUNITY AND STAKEHOLDER ANALYSIS
attitudes, values, views and perceptions include, future generations
► EVALUATION OPTIONS
Monetary Valuation and Cost Benefit Analysis. Non-Monetary Valuation and Environmental Impact Assessment include. Multi-Criteria Analysis
RESOURCE BASE «“Carrying Capacities.
Feedback Mechanisms and Systems Analyses
INTER AND INTRA GOVERNMENTAL ASPECTS
Obligations and agreements, policies and criteria
PROACTIVE, PRECAUTIONARY
POLICY OPTIONS FOR RESOURCE USE AND
DEVELOPMENT Alternative Priorities
patterns of resource use and development and their feedback effects
J
CASE STUDIES Temporal and Spatial Scales Problems System Processes
Strategies
-► INTEGRATED COASTAL ZONE MANAGEMENT <-----STRATEGY ANALYSIS
Goals and Objectives
Integration of value conflicts, sustainable economic development, management principles,
implementation mechanisms, institutional arrangements
IMPLEMENTATION PROGRAMME ANALYSIS
SECONDARY FEEDBACK MECHANISMS
WORKS PROGRAMME
Capital works, rehabilitation, restoration, relocation,, recreation
REGULATION
Strategic Plans integration, approval, enforcement, dispute/conflict resolution
RESOURCING & FINANCING
Charges, Pricing, Taxes, levies etc.
MONITORING AND EVALUATION
MANAGEMENT OF IMPLEMENTATION
Figure 1. Research agenda for integrated management of coastal zone research use and sustainable development.
RESOURCE BASE AUDIT(Information Failure)
Biophysical and socio-economic data relating to processes, functions and structures - including institutional structures and financing arrangements
Task 4.1.1 Linking natural and social science research on coastal issues
Sub Task 4.1.1.1Data requirements for scenario building and forecasts
Sub Task 4.1.1.2 Post-hoc evaluation of change in use of coastal areas
Sub Task 4.1.1.3 Projected change in use of coastal areas
RESOURCE USE SCENARIOS(Market Failure)
Underlying causes and patterns of existing and future use including population change, industrial development, tourism etc. and related legal issues
Task 4.1.2 Socio-economic pressures driving coastal change - changes in use of coastal space
Sub Task 4.1.2.1Congestion in coastal areas
Sub Task 4.1.2.2 Carrying capacity of coastal areas
Sub Task 4.1.2.3Present and future capacity of small islands for tourist development
Task 4.1.3 Relationships between people and specific coastal ecosystems - changes in use of coastal resources
Sub Task 4.1.3.1Relationships between people and mangroves
^ Sub Task 4.1.3.2Shrimp culture in mangrove ecosystems
COMMUNITY AND STAKEHOLDER ANALYSIS
Attitudes, values, views and perceptions including future generations
RESOURCE BASE
Carrying Capacities,Feedback Mechanisms and Systems Analyses
INTER AND INTRA GOVERNMENTAL ~ ASPECTS
Obligations and agreements, policies and criteria
CASE STUDIES(Policy Failure)
Covering past success and failures in Coastal Zone Management
Task 4.2.1 Economic valuation studiesSub Task 4.2.1.1
Damage cost valuation studies Sub Task 4.2.1.2
Abatement cost valuation studies Sub Task 4.2.1.3
Long-term environmental and economic costs and benefits of coastaltourism
Sub Task 4.2.1.4Cost benefit analyses of alternative uses of coastal area and
resources
Task 4.2.2 Stakeholder analysesSub Task 4.2.2.1
Marine resource dependence studies - local Sub Task 4.2.2.2
Marine resource dependence studies - national Sub Task 4.2.2.3
Analyses of the impacts of different institutional arrangements on rates of change in coastal environments
Sub Task 4.2.2.4Analyses of the impacts of different patterns of ownership and
_ usufruct rights on coastal resource use
Task 4.2.3 Vulnerability of coastal systems and human populations to global changeTask 4.3.1 Management of recovery of degraded coastal environmentsTask 4.3.2 Analysis of distance effects in sustainable use of coastal areasTask 4.3.3 Evaluating past successes and failures in coasta! zone management
Figure 2. Relationship between the LOICZ defined research tasks and sub-tasks and the conceptual research framework outlined in Figure 1.
1.2 The Contribution of Socio-Economic Analysis and Research
1.2.1 Economics and cost-benefit analysis
A particular contribution of socio-economic research is the incorporation of evaluation methods and techniques, which can be applied to specific resource utilisation situations, projects or policies, including coastal resource management instruments and options. A typical evaluation method is economic cost- benefit analysis, which may be deployed as a conventional economic efficiency analysis, or in a constrained form as a cost-effectiveness analysis. The latter analysis of activities, projects or policies, is conditioned by the prior adoption of precautionary constraints such as pollution emission limits, or natural habitats zoning. The evaluation process then becomes a cost-based analysis, designed to determine the least costly option available which meets the prior requirements laid down in the environmental standard or other constraints. In this context there is no presumption that economic development is superior to, or more beneficial, than protection of the coastal environment, or practices such as the local non-commercial utilisation of resources.
Lack of information about environmental thresholds and the precise consequences of breaching them provide a rationale for the adoption, in some circumstances, of a precautionary approach in preference to a cost-benefit approach. The former approach would favour ecosystem conservation and environmental protection measures, unless the social opportunity costs, that is, the foregone economic development net benefits, are ‘unacceptably’ large. The latter approach would compare all resource use options on the same basis, that is, the full economic costs and benefits generated by a given option, and would favour the options with the largest net benefits, as discussed below in Sections 2 and 3.
The standard economic approach to environmental resource valuation is based on an individual human ‘preference-based’ value system, in which the benefits of environmental gain, or the damages from environmental loss, are measured by a concept known as ‘total economic value’ (TEV). Within this approach important distinctions are made between use values and non-use values. The latter cover a number of motivations that individuals might hold, not in relation to present resource use, but relating to the mere knowledge that certain resources are conserved and will continue to be so in the future. This is known as existence value.
Debate continues over the precise boundaries between these different components of economic value. The conventionally accepted approach to the valuation of environmental resources is based on the assumption that individuals maximise well-being deriving from the components of value outlined above, subject to an income constraint. The private willingness-to-pay of individuals for goods and services is a function of prices, income and tastes, together with conditioning variables such as household size, level of education and so on. The social value of environmental resources committed to some use is then simply the aggregation of private values.
1.2.2 Ecosystems and the precautionary principle
From the precautionary perspective two modifications are made to the total economic value (TEV) concept. First, without altering the logic of TEV, much stronger emphasis is placed on the ‘health’ of overall systems and life support functions served by ecological processes, known as biogeochemical cycles. From this more holistic perspective, it is argued that TEV does not adequately capture the ‘true’ social value of ecosystems and their interrelationships. This results in the view that TEV captures ‘secondary’ values, associated with useful functions and services of an ecosystem but not ‘primary’ values. Primary value in this context is defined as the value of an overall healthy and evolving ecosystem, necessary to support the provision of a range of secondary values. In the context of actual environmental conservation versus development conflicts, conventional economists would deploy TEV analysis within an economic efficiency and cost-benefit framework. Precautionary principle advocates would be more inclined to ensure that conservation of system integrity, i.e., sufficiently large ‘chunks’ of ecosystems to ensure species diversity and complexity of relationships, was a high priority. This position is reinforced by their belief that some ecological assets have few if any substitutes. Environmental standards, known as ‘safe minimum standards’ or ‘sustainability constraints’, would be advocated and would be deployed in order to conserve ‘critical’ environmental resources before cost-benefit analysis was carried out, reducing this analysis to a cost-effectiveness exercise.
Some analysts would also want to give wider emphasis to 'intrinsic' values, or values ‘in’ things compared to purely ‘instrumental’ values, or values ‘of things. This has led to questions being raised about the nature of the conventional distinction between use and non-use value and therefore whether there is such a thing as environmental existence value that can be measured (Cummings and Harrison, 1995; Crowards, in press). There are variations in the extent to which such wider values are encompassed, partly depending on the practicality of entering intrinsic values into decision-making and the problems of choosing a meta-ethical principle that enables trade-offs between intrinsic and instrumental values.
The precautionary approach should, however, not be interpreted to mean conservation of all species at any cost. The stability of the jointly determined economic-ecological system probably depends less on the stability of individual resources, than on the resilience of the system. Resilience is the ability of the system to sustain its self-organising capacity in the face of stress and shock, both natural and human-induced, but this will require the maintenance of essential ecosystem processes and supporting structure, known as critical natural capital.
In the short term, so-called ‘redundant species’ may be removed without apparently impairing the ecosystem and linked processes. Removal of ‘sentinel’ or ‘keystone’ species, however, may lead to rapid and unexpected changes in processes and systems. In the long term, which is not easy to define, all species erosion contributes to ecosystem change. What replaces systems that are lost is problematic, but such losses may have direct and observable economic impact, for example, the loss of corals or mangroves, or less obvious effects, for example, changes in plankton populations and the effect of that on predator species. A central problem in the economic analysis of, and policy prescriptions for, environmental resource use is the fact that market prices do not indicate whether a system is approaching the limits of system resilience. This is partly due to the structure of property rights and other institutions, partly to our lack of understanding of ecosystem dynamics and partly to the public good, that is, open access, nature of many environmental resources.
Not all impacts and values, however, fit meaningfully into the conventional monetary valuation approach and related project and policy appraisal framework. A number of important traditional community, cultural and aesthetic asset values, as well as equity and other moral values, do not sit comfortably within this framework. While equity weights can be applied to economic costs and benefits within the conventional analytical framework, this practice has not been routinely adopted. When such assets and associated values are subject to a process of change, alternative assessment methods are required. Multi-objective or multi-criteria analysis methods offer some scope for assisting the decision-making process when a range of objectives are relevant (see Section 3). Such methods encompass a diverse range of criteria and usually operate with quantified but non-monetised data, adjusted via weighting schemes which reflect the relative priorities given to different criteria and underlying stakeholder interests.
1.3 Analytical Framework for Global Environmental Change (GEC)
1.3.1 The global environmental change process
The process of Global Environmental Change (GEC), in the sense defined at the United Nations Conference on Environment and Development (UNCED) held in Rio de Janeiro in 1992 and embodied in the two main United Nations Framework Conventions on Climate Change and on Conservation of Biological Diversity, is complex. It involves a plethora of factors which manifest themselves at a number of different spatial scales, (global, regional, national and local), and on a number of temporal scales. It is, however, possible to identify a group of interrelated socio-economic and socio-cultural trends and pressures which contribute significantly to environmental change (Turner et al., in press), as well as to an increasing degree of systemic and cumulative global environmental risk to biophysical and socioeconomic systems.
The basic global socio-economic drivers include:
• population growth;• increasing rates of urbanisation;• increasing industrialisation and intensification of external input use in agriculture;• increasing rate of economic growth (measured in terms of Gross National Product [GNP] per capita) of the
world economy;• increasing international economic interdependency contributing to, for example, rapid growth of the
international transportation goods and services, and the growth of global tourism, much of which is concentrated in coastal zones;
• the globalisation of information transfer and communications; and• increasing rate of social change in terms of attitudinal and lifestyle changes, including leisure pursuits, across
all sectors of different economies and societies.
The increasing ‘scale’ of economic activities world-wide results inevitably in an increased ‘throughput’ of matter and energy, and also of the consequent waste products. It is therefore likely that, ‘source’ and ‘sink’ constraints at the global level will be observed in the foreseeable future. This need not necessarily mean that there are physical limits to economic development in the manner suggested by Meadows et al. (1972), or that the world will not be able to feed itself in future (Brown, 1996). It means rather that there are severe institutional and political challenges in adapting to a physical environment where traditional development ‘solutions’ related to economic intensification and expansion are not available.
While it is certainly the case that ecological systems underpin and support economic systems and not vice versa, there are nevertheless many technology-driven possibilities for a partial decoupling of economic activities from the surrounding environment. Whether or not critical threshold levels are currently being approached or breached is very uncertain, but some environmental and socio-economic indicators are a cause for concern at the local and national level in developed and developing countries:
• possible climatic changes in temperature, precipitation and weather-related extreme events;• accelerated sea level rise, although regional impacts and timescales are still uncertain;• biodiversity degradation and loss such as mangroves, wetlands, coral reefs, sand-dune habitats;• increasing financial and social costs of land-based and other conventional waste management options;• increasing severity of some pollution related problems such as stratospheric ozone depletion, acid rain,
eutrophication and water quality decline, and pesticide contamination of food;• increasing concern over landscape and cultural environmental changes and losses;• increasing concern over unsustainable current resource usage, such as groundwater extraction;• divergence between expert and public perceptions of environmental risks;• increasing recognition of new ‘environmental’ liability issues by government, industry, banks and insurance
companies• declining rate of growth in national and international ‘public’ spending on research and development
investment.
The environmental pressure and damaging environmental impacts are particularly evident in the world’s coastal zone’s. Both resource stocks and waste assimilation capacities and nutrient cycling functions are now under particularly severe pressure from a range of often competing demands.
1.3.2 The pressure-state-response (P-S-R) framework
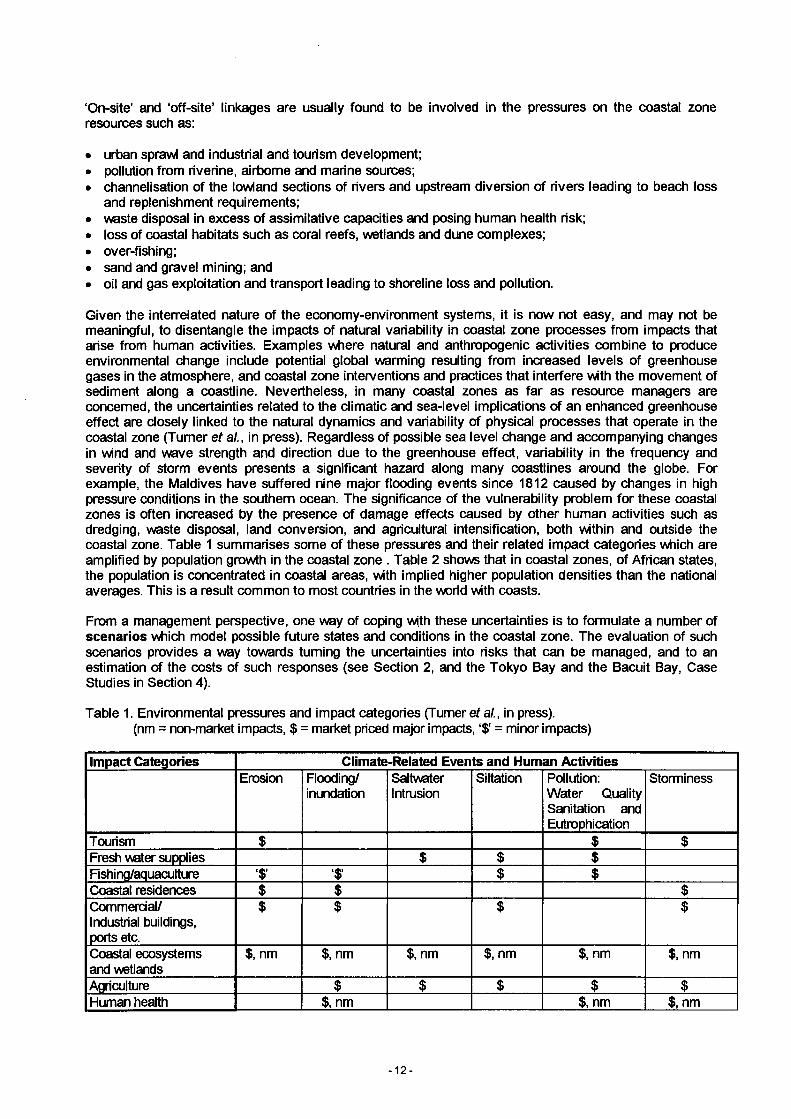
Global environmental change raises important issues for social science as well as highlighting the importance of interdisciplinary research. First, the factors causing global change have to be defined and their relative importance assessed. We have therefore to determine the proximate pressure on the environment arising from sectoral change in the economy which in turn reflects population change, cultural and public policy, including changes in property rights regimes and public opinion, and macroeconomic changes to prices, international trade and overall national wealth as indicated for example by Gross National Product. Evaluating the importance, in human welfare terms, of the various sectoral impacts requires that their effects be measured in biophysical and then, where feasible, translated into impact on human well-being. But we also need to know why GEC-related activities and the environmental state changes take place in the form they do. For example, prices may not reflect the full social and environmental costs of ecosystem disturbance, or subsidies may encourage wasteful exploitation of some resources. But the subsidies may be politically necessary to help a particular group of interests. Such conflicts highlight the need for sociological, political and anthropological research in order to identify relevant stakeholders, their function and role in coastal societies as well as their preferences. Finally, resource management and policy response options to GEC should be reviewed and assessed. But addressing solutions is meaningless unless the causes are understood. Hence the need to focus on the design of institutions in their broadest sense, including the unifying principles that drive evaluation and assessment, such as the cost-benefit principle, the precautionary principle, risk-benefit assessment, tradeoff analysis and others. One approach is summarised in the Pressure-State-Response framework (P-S-R). A general outline of the P-S-R framework is given in Figure 3. This can be adapted to more specifically address coastal zone issues as in Figure 4.
The long term objective of socio-economic research can be the formulation and ‘validation’ of a general socio-economic ‘theory’ of environmental change together with enabling policy measures. Such a theory rests on assessing the importance of environmental degradation, priorities for action, causes of the problem, instruments for correction, and institutional design to assist the transition.
LOICZ research is designed to contribute to a better understanding of the ‘pressure’ and the ‘state’ components of the GEC model, while at the same time contributing to the development of sustainable resource usage management rules and policy response options. It seeks to focus particular attention on the coastal zone because coastal areas contain some of the world’s most productive and diverse resources which are highly sensitive to human interventions. Coastal zones are therefore environmentally, economically, socially and politically important, (Text Box 2).
The coastal ocean:• occupies 18 percent of the surface of the globe;• is the area where around 25 percent of global primary productivity occurs;• is the area where around 60 percent of the human population lives;• is the area where between 60 percent and 70 percent of the world’s cities with populations of over
1.6 million people are located; and• supplies approximately 90 percent of world fish catch.
The coastal ocean accounts for:• 8 percent of the ocean surface;• <0.5 percent of the ocean volume;• between 18 percent and 33 percent of global ocean production;• 80 percent of the global organic matter burial;• 90 percent of the global sedimentary mineralisation;• 75-90 percent of the global sink of suspended river load and its associated elements/pollutants; and• in excess of 50 percent of present day global carbonate deposition.
Text Box 2. Characteristics and importance of the coastal zone.
POPULATION CHANGE POLICY SOCIO-CULTURAL MACROECONOMICPUBLIC OPINION FACTORS CHANGE
GROWTH MIGRATION FAMILYSTRUCTURE
1 - 4
ag dp tr a d e pr ic es
SECTORAL CHANGE
HOUSING SERVICES INDUSTRY ENERGY AGRICULTURE TRANSPORT
LAND USE WASTE. CHANGE EMISSIONS
INDIVIDUALRESPONSE
IPUBLIC
OPINION
GOVERNMENTRESPONSE
AVERTIVEEXPENSE
REGULATIONI
FISCAL
LAND WATER AIR NOISE
HABITATCHANGE
CONTAMINATION & DERELICTION
FRESHWATER SURFACE GROUNDWATER
ESTUARY MARINE
LOCAL X X X X X X X
NATIONAL X X X X X
INTERNATIONAL X X X
GLOBAL X X X
USE VALUEi r
Health X X X X X X X
Structures X
Forests X X
Crops X X X
Recreation X X X X X
Ecosystems X X X X X X X
NON USE VALUES
X X X X X X
BUSINESS
Surveys NGOs / \ Domestic International
Insulation Relocation Expenditure Instruments
Expenditure
UNDERLYINGPRESSURE
PROXIMATEPRESSURE
IMPACT BY RECEIVING MEDIA
“S.O.E.INDICATORS”
IMPACT BY EFFECT
“EFFECTINDICATORS”
RESPONSE
Audit
Figure 3. General Pressure-State-Response (P-S-R) Framework (based on OECD Environmental Indicators format).

GLOBAL WARMING NATURAL SYSTEMS DYNAMICS
CLIMATEI
LONG TERM CHANGE (A mean temperature)
EXTREMEEVENTS
I I
SEA LEVEL RISE
ITEMPERATURE, WIND,
PRESSURE, PRECIPITATION,
WAVES
PHYSICAL IMPACTS IN
HINTERLANDS
SEA LEVEL CHANGES/STORMS
ICOASTAL ZONE
PHYSICAL IMPACTS:Land and ecosystem loss;
flooding, salinization
COMBINED IMPACT EFFECTS IN THE COASTAL ZONE
POPULATION PRESSURE; LAND USE CHANGE;
DEVELOPMENT PRESSURES; WASTE DISPOSAL PRESSURE; SOCIO-CULTURAL PRESSURES
SOCIO-ECONOMIC AND ENVIRONMENTAL
IMPACTS: Loss of productive capacity and potential Physical
and Human capital losses Natural capital losses
EXACERBATION OF INFORMATION,
MARKET AND POLICY FAILURES INSIDE AND
OUTSIDE THE COASTAL
VULNERABILITY STATUS OF COASTAL ZONE:
Ecological factors, physical factors and socio-economic factors:
e.g., GNP per capita, Population growth, indebtedness, etc.
POLICY RESPONSES: ICZM
P = PRESSURE; S = STATE OF THE ECONOMY-ENVIRONMENT; R = POLICY RESPONSE
Figure 4. Coastal zone Pressure-State-Response framework.
- 10-
1.4 Definition of the Coastal Zone. Environmental Pressures and Impacts
Following the 1991 approach of the Organisation for Economic Cooperation and Development Environment Directorate (OECD, 1993a) the coastal zone can be defined according to the nature of the problem being examined, particularly the objectives of management. Thus, for most contexts, the marine boundary of a coastal zone can be taken as the ‘exclusive economic zone’ limit. While on the landward side, the boundary can be fixed in terms of existing local government administrative areas, or the potentially more extensive natural drainage basins. These boundaries will coincide with only some of the areas from which demands are imposed on the resources of the coastal area. The boundaries are also not likely to delimit the influences of some coastal processes on the designated area, such as sediment transfers and atmospheric deposition of materials.
The LOICZ Science Plan (Holligan and de Boois, 1993) defines the coastal zone as:
“extending from the coastal plains to the outer edge of the continental shelves, approximately matching the region that has been alternately flooded and exposed during the sea level fluctuations of the late Quaternary period”
This coastal domain, broadly considered to range from 200 m above to 200 m below sea level, can be characterised by the features detailed in Text Box 2.
In an effort to maximise the scientific benefits of LOICZ research, a global coastal zone typology is being developed which will group the world’s coastal zone into several clusters of discrete, scientifically valid units based on both natural and socio-economic features and processes. Preliminary work has resulted in a large-scale regional typology containing around 80 coastal regions (see LOICZ, 1995). Additional work is presently underway to generate a more useful typology on the higher spatial resolution of specific coastal lowlands. This work will require the results of coastal zone assessment methodologies, as laid out in this document. It will also be useful for generalising the results, from both the environmental and socioeconomic research fields, from well-studied areas to areas with more limited information.
Coastal zone resources have been, and continue to be, modified by a wide range of human activities. The scale of modification ranges from dredging operations that directly affect local water bodies, to regional- scale changes in land use, such as draining and clearing of wetlands for agriculture and residential development. These latter impacts can affect the dynamics of water catchments and offshore water quality. There can be no doubt therefore that coastal zones are subject to relatively high rates of change and subsequent pressures:
• the rate of population growth and economic development;• the rate of degradation of natural resources;• the rate of coastline modification resulting in dynamic changes, including barrier and nearshore islands;• significant decline in biological productivity and biological diversity;• increasing exposure of coastal populations to natural and anthropogenic hazards;• increasing risk of over utilisation of sink assimilative capacity because of extensive links to ‘upstream’
human activities;• declining management effectiveness resulting from complexities related to the problem of co
ordination between different management regimes for marine and land resources; and• vulnerability to potential climate change effects, including accelerated sea level rise.
For many developing and some developed countries the coastal zone represents a microcosm of the economic, social and environmental problems confronting nations and transnational regions. It has been estimated, for example, that a continuation of current ‘business as usual’ trends in Africa up to the year 2025 will mean population growth rates in rural coastal areas of >3 percent per annum. Urban coastal populations will grow at 4 to 6 percent over the same horizon. This pressure will result in the deforestation of 70 percent of mangrove areas in Africa and the degradation of most East African coral reefs. Many coastal lagoons will also become so polluted that adjacent human populations will be at significant health risk (World Bank, 1995).
-11 -
‘On-site’ and ‘off-site’ linkages are usually found to be involved in the pressures on the coastal zone resources such as:
• urban sprawl and industrial and tourism development;• pollution from riverine, airborne and marine sources;• channelisation of the lowland sections of rivers and upstream diversion of rivers leading to beach loss
and replenishment requirements;• waste disposal in excess of assimilative capacities and posing human health risk;• loss of coastal habitats such as coral reefs, wetlands and dune complexes;• over-fishing;• sand and gravel mining; and• oil and gas exploitation and transport leading to shoreline loss and pollution.
Given the interrelated nature of the economy-environment systems, it is now not easy, and may not be meaningful, to disentangle the impacts of natural variability in coastal zone processes from impacts that arise from human activities. Examples where natural and anthropogenic activities combine to produce environmental change include potential global warming resulting from increased levels of greenhouse gases in the atmosphere, and coastal zone interventions and practices that interfere with the movement of sediment along a coastline. Nevertheless, in many coastal zones as far as resource managers are concerned, the uncertainties related to the climatic and sea-level implications of an enhanced greenhouse effect are closely linked to the natural dynamics and variability of physical processes that operate in the coastal zone (Turner et al., in press). Regardless of possible sea level change and accompanying changes in wind and wave strength and direction due to the greenhouse effect, variability in the frequency and severity of storm events presents a significant hazard along many coastlines around the globe. For example, the Maldives have suffered nine major flooding events since 1812 caused by changes in high pressure conditions in the southern ocean. The significance of the vulnerability problem for these coastal zones is often increased by the presence of damage effects caused by other human activities such as dredging, waste disposal, land conversion, and agricultural intensification, both within and outside the coastal zone. Table 1 summarises some of these pressures and their related impact categories which are amplified by population growth in the coastal zone . Table 2 show« that in coastal zones, of African states, the population is concentrated in coastal areas, with implied higher population densities than the national averages. This is a result common to most countries in the world with coasts.
From a management perspective, one way of coping with these uncertainties is to formulate a number of scenarios which model possible future states and conditions in the coastal zone. The evaluation of such scenarios provides a way towards turning the uncertainties into risks that can be managed, and to an estimation of the costs of such responses (see Section 2, and the Tokyo Bay and the Bacuit Bay, Case Studies in Section 4).
Table 1. Environmental pressures and impact categories (Turner et al., in press).(nm = non-market impacts, $ = market priced major impacts, ‘S’ = minor impacts)
Impact Categories Climate-Related Events and Human ActivitiesErosion Flooding/
inundationSaltwaterIntrusion
Siltation Pollution:Water Quality Sanitation and Eutrophication
Storminess
Tourism $ $ $Fresh water supplies $ $ $Fishing/aquaculture '$’ •$' $ $Coastal residences $ $ $Commercial/ Industrial buildings, ports etc.
$ $ $ $
Coastal ecosystems and wetlands
$, nm $, nm $, nm $, nm $, nm $, nm
Agriculture $ $ $ $ $Human health $, nm $, nm $, nm
- 1 2 -
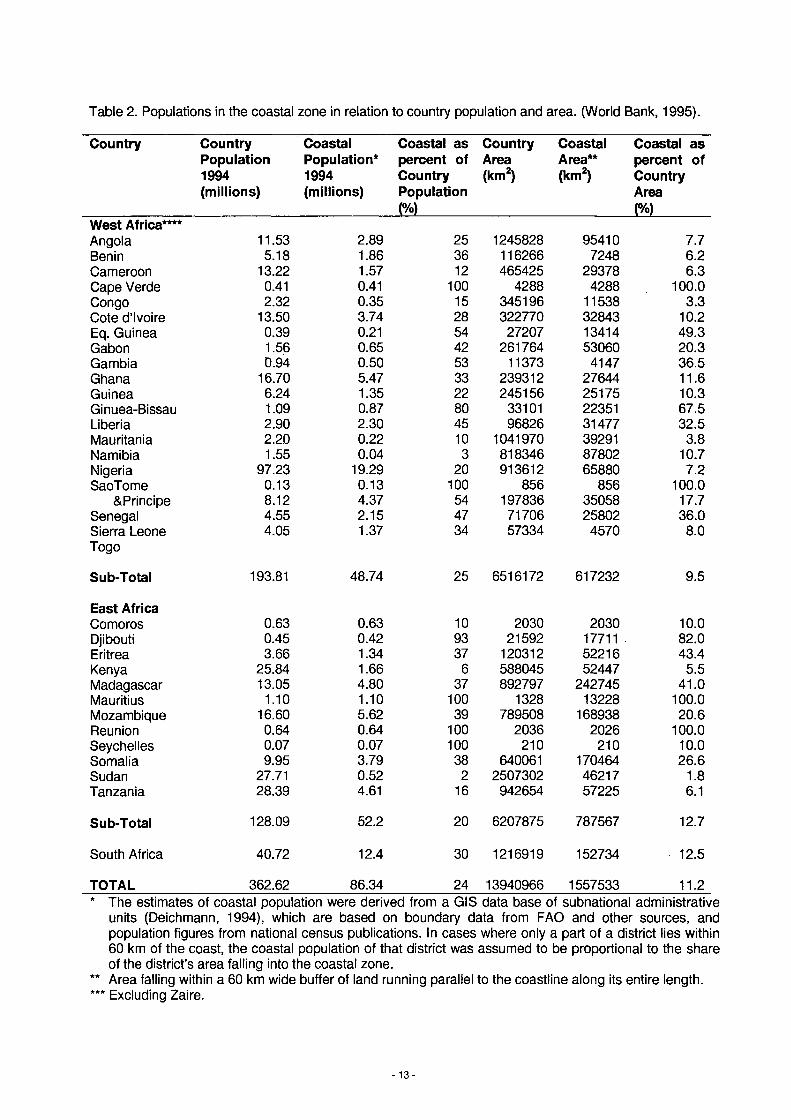
Table 2. Populations in the coastal zone in relation to country population and area. (World Bank, 1995).
Country CountryPopulation1994(millions)
CoastalPopulation*1994(millions)
Coastal as percent of Country Population (%)
CountryArea(km2)
CoastalArea**(km2)
Coastal as percent of Country Area (%)
West Africa****Angola 11.53 2.89 25 1245828 95410 7.7Benin 5.18 1.86 36 116266 7248 6.2Cameroon 13.22 1.57 12 465425 29378 6.3Cape Verde 0.41 0.41 100 4288 4288 100.0Congo 2.32 0.35 15 345196 11538 3.3Cote d’Ivoire 13.50 3.74 28 322770 32843 10.2Eq. Guinea 0.39 0.21 54 27207 13414 49.3Gabon 1.56 0.65 42 261764 53060 20.3Gambia 0.94 0.50 53 11373 4147 36.5Ghana 16.70 5.47 33 239312 27644 11.6Guinea 6.24 1.35 22 245156 25175 10.3Ginuea-Bissau 1.09 0.87 80 33101 22351 67.5Liberia 2.90 2.30 45 96826 31477 32.5Mauritania 2.20 0.22 10 1041970 39291 3.8Namibia 1.55 0.04 3 818346 87802 10.7Nigeria 97.23 19.29 20 913612 65880 7.2SaoTome 0.13 0.13 100 856 856 100.0
&Principe 8.12 4.37 54 197836 35058 17.7Senegal 4.55 2.15 47 71706 25802 36.0Sierra Leone Togo
4.05 1.37 34 57334 4570 8.0
Sub-Total 193.81 48.74 25 6516172 617232 9.5
East AfricaComoros 0.63 0.63 10 2030 2030 10.0Djibouti 0.45 0.42 93 21592 17711 82.0Eritrea 3.66 1.34 37 120312 52216 43.4Kenya 25.84 1.66 6 588045 52447 5.5Madagascar 13.05 4.80 37 892797 242745 41.0Mauritius 1.10 1.10 100 1328 13228 100.0Mozambique 16.60 5.62 39 789508 168938 20.6Reunion 0.64 0.64 100 2036 2026 100.0Seychelles 0.07 0.07 100 210 210 10.0Somalia 9.95 3.79 38 640061 170464 26.6Sudan 27.71 0.52 2 2507302 46217 1.8Tanzania 28.39 4.61 16 942654 57225 6.1
Sub-Total 128.09 52.2 20 6207875 787567 12.7
South Africa 40.72 12.4 30 1216919 152734 12.5
TOTAL 362.62 86.34 24 13940966 1557533 11.2* The estimates of coastal population were derived from a GIS data base of subnational administrative
units (Deichmann, 1994), which are based on boundary data from FAO and other sources, and population figures from national census publications. In cases where only a part of a district lies within 60 km of the coast, the coastal population of that district was assumed to be proportional to the share of the district’s area falling into the coastal zone.
** Area falling within a 60 km wide buffer of land running parallel to the coastline along its entire length.*** Excluding Zaire.
- 13 -
1.5 Coastal Zone Management
Whilst LOICZ Focus 4 research is not concerned with implementing management it is concerned with the scientific basis for management regimes. In this context LOICZ research will contribute to the development of a common framework for analysis that would encompass both the natural and socioeconomic sciences viewpoints.
1.5.1 Rationale for ICZM
The coastal zone generates a range of different products and services, not all of which are mutually compatible. Conflicts and trade-offs are therefore inevitable with a diversity of different stakeholders present in any given coastal zone. The policy objective becomes one of determining a ‘socially desirable’ mix of coastal zone products and services which can be sustained over time. This social mix can be most efficiently provided by an integrated approach to coastal zone planning and management. Such an approach offers the best opportunity to maximise the net flow of benefits from coastal resources to society, while minimising environmental costs. Integrated coastal zone management (ICZM) is most usefully seen as just another aspect of sustainable resource management within a national economic development strategy.
1.5.2 The resource management process
The World Coastal Conference 1993 (WCC ‘93) Conference Statement states that integrated coastal zone management (ICZM):
“involves the comprehensive assessment, setting of objectives, planning and management of coastal areas and resources, taking into account traditional cultural and historical perspectives and conflicting interests and uses; it is a continuous and an evolutionary process for achieving sustainable development.”
There are at least two fundamental characteristics of ICZM implied in this process:
• ICZM does not require facilitation through a single agency, rather it requires formal linkage mechanisms among the different agencies already involved in the coastal zone. The configuration of the linkage mechanisms will vary from zone to zone and country to country; and
• ICZM will be a continuous adaptive process, involving periodic re-analysis of pressures, trends, impacts and the effectiveness of policy measures. This re-evaluation procedure should also be capable of encompassing climate-change related factors as long as these exhibit medium to long term effects and they occur at a steady rate over time.
According to the World Bank (1995), ICZM can be distinguished from other development planning modes by its process, multi-sectoral and participatory, as much as by the end result.
1.5.3 Different settings for ICZM
There are three settings where different ICZM approaches could be applied. These are:
• Small island states. These countries tend to be small enough for coastal zone management to be organised via an inter-ministerial council and agency with its own small complement of staff in order to implement ICZM and mediate inter-ministerial conflicts. The question of a ‘boundary’ for ICZM is not relevant in this context, since the entire land mass is effectively included in the coastal zone and most planning and development decisions relate directly or indirectly to coastal zone resources. The number of separate economic sectors and therefore Ministries would be quite small.
• Larger island states. These countries require a number of separate ministries to cover a number of different economic aspects of coastal zone resource use, such as forestry, mining, tourism, fisheries, and agriculture. ICZM could be facilitated in this context via a planning committee staffed by an overarching agency of committee. This committee would be responsible for integration between sectoral ministries and for any co-ordination operations. A relatively large technical staff would be required to service such a committee.
- 14-
• Mainland Countries. The ICZM ‘boundary’ question becomes a much more complicated question in this context. The coastal zone boundaries are ‘politically’ as well as spatially determined. The extent of the zone will therefore vary from location to location and will be determined in practice by three main characteristics: the level of economic development present; the degree of centralisation achieved in terms of existing government infrastructure; and the ability of agencies to raise financial revenues and decide on discretionary spending. These three paramount determinants are influenced by four other characteristics: extent and degree of organisation of stakeholders; level of specialisation of the economy, especially in terms of resource endowment and technology; the stock of human resources and expertise; and the existing relevant data inventory and its availability.
On the basis of these characteristics, mainland countries can be further sub-divided into four categories:
• ICZM set in the context of a low income and relatively centralised country, with the spatial extent of the landmass also playing a contributing role;
• ICZM set in the context of a higher income and relatively centralised country;• ICZM set in the context of a higher income and relatively decentralised country, i.e., with regional/state
legislatures in possession of revenue raising and spending powers; and• ICZM set in the context of a low income and highly decentralised country.
1.5.4 ICZM framework
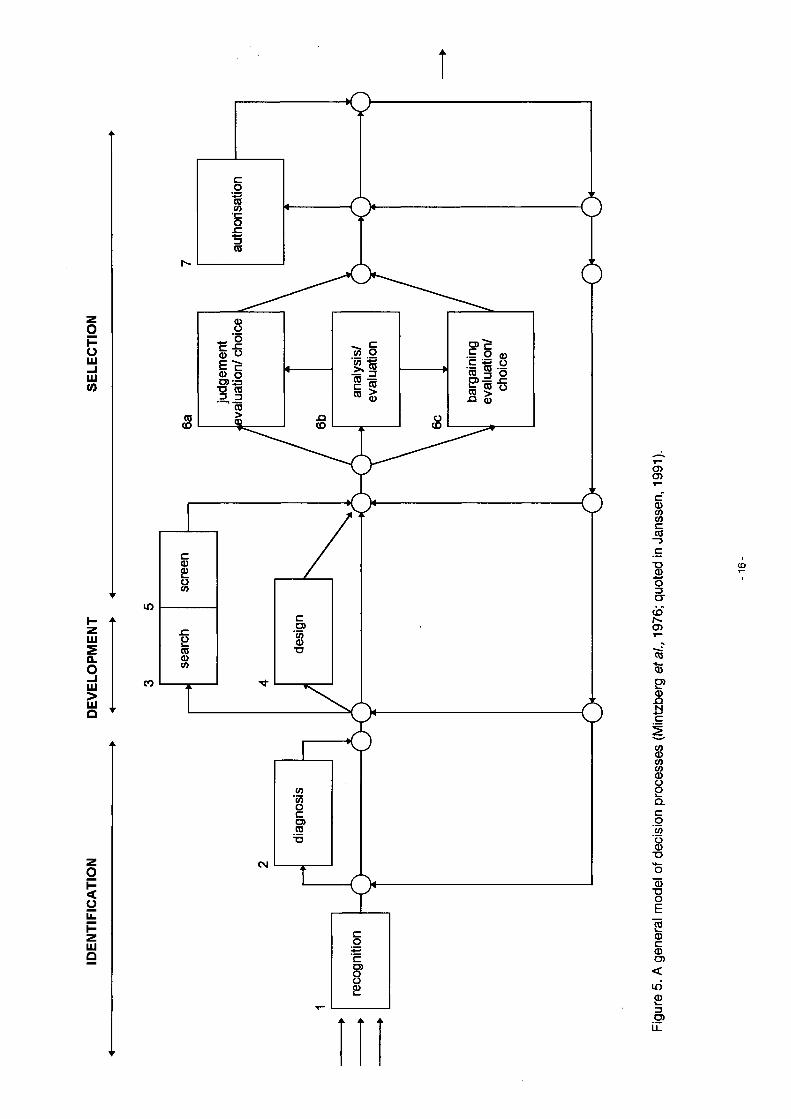
A decision process is a set of actions and dynamic factors that begins with the identification of a stimulus for action and ends with a specific commitment to action (Mintzberg et al., 1976). Decision makers are individuals or groups who, directly or indirectly, provide value judgements on the decision process necessary to define and choose between alternative courses of action. In Figure 5 a general model of decision processes is illustrated which encompasses three phases: identification; development; and selection. The identification phase contains both recognition and diagnostic activities which lead to problem and opportunity identification, and cause and effect relationship analysis. The development phase involves the search for response options, and the selection phase involves final evaluation of options, choice and implementation. As far as the coastal zone management decision process is concerned, the LOICZ research programme will be targeted more particularly on the identification and development phases of Figure 5, and only partially on the selection phase.
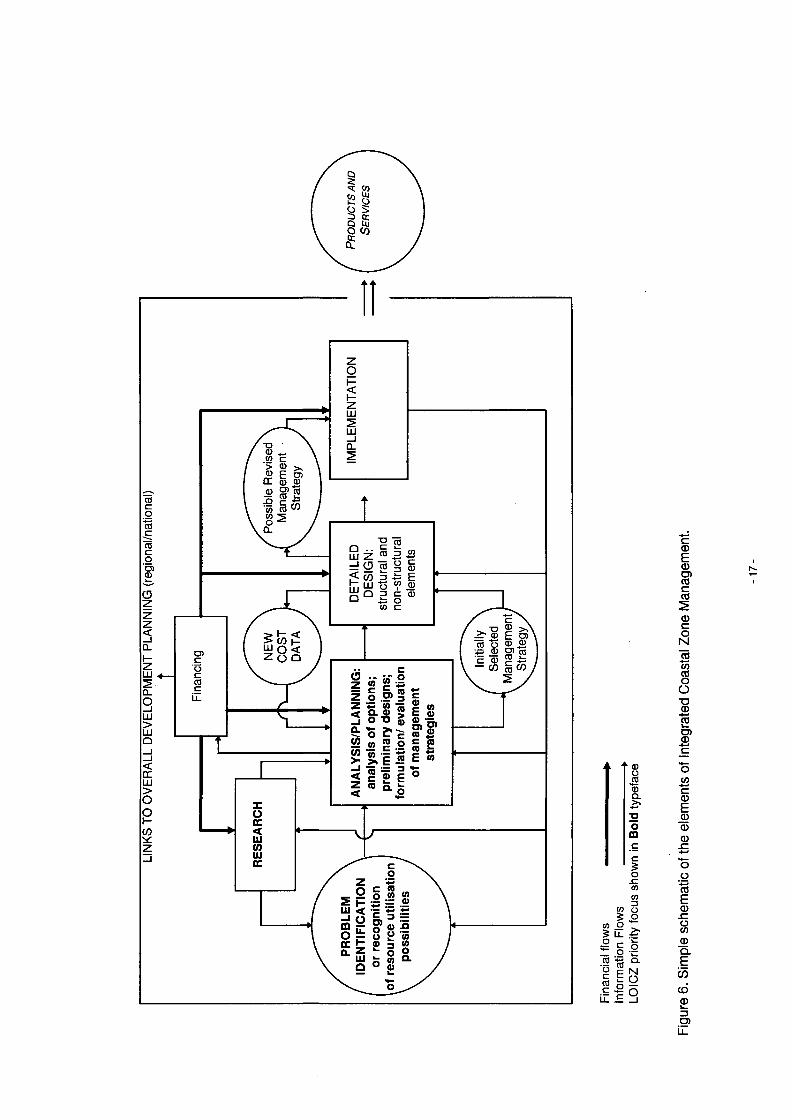
The various elements in ICZM can be portrayed simply in terms of Figure 6. For the purposes of this resource assessment guidelines document we are particularly concerned with:
• problem identification,• analysis and research.
It is these main elements that are required to formulate and evaluate the P-S-R framework outlined earlier.
- 1 5 -
IDEN
TIFI
CATI
ON
DEVE
LOPM
ENT
SELE
CTI
ON
î
05 cr— Sc/> O
SIE tCD O 05 ‘¿5 -o CO
CD
O)
CO
O)
CM
Figur
e 5.
A ge
nera
l m
odel
of de
cision
pr
oces
ses
(Min
tzber
g et
al.,
1976
; qu
oted
in Ja
nsse
n, 1
991)
.
LINKS
TO
OVER
ALL
DEVE
LOPM
ENT
PLAN
NING
(re
gion
al/n
atio
nal)
^ ÇO
o $^ QC Q üjo co
Î Î
.2 c > cd 0) E O)
DC 0 Q)
2 I ICO fl w CO ^ o ^
lu < •— ’-M 5¿ g | S sg £ § § 8
2 * 0 E D) 75 o © B
CD O ) coC (D 2 -M- co §co
UL
O)C
LU Z=! O 75
co
o c
LU
.2 •§> J Ia « S E S 0 'o S ® ö, 'S S 'c * 5 .2 S -2 § g > g © E ©
<0 Q.
‘ CD
jôOQ .■4-̂2omc £ o
-C CO
CO
CO O
£ £co o t:^ L L .-W
— .2 '5= CO -E Q .
c E Nl i i
Figur
e 6.
Simp
le sc
hem
atic
of the
ele
men
ts
of In
tegr
ated
Coas
tal
Zone
M
anag
emen
t.
2. MODELUNG CHANGE IN THE COASTAL ZONE
2.1 An Ecological Economic Approach
This section outlines an approach to the interface between environmental and economic change in coastal zones and their potential vulnerability.
Vulnerability is a multi-dimensional concept encompassing, biogeophysical, socio-economic and political factors. Analysis of the vulnerability of a coastal zone includes some notion of the susceptibility of that zone to stress and shock and consequent damage imposed by global change pressures, including climate change, as well as associated sea-level rise, and potentially altered storm frequency and severity. The susceptibility status of an area is conditioned by the resilience of the natural coastal system, which is greatly influenced by past, current and future population and settlement patterns, and rates of socio-economic change. Additionally vulnerability status is further determined by the technical, institutional, economic and cultural capabilities of a country or region to cope with or manage the impacts of climate-induced change (IPCC, 1994; Turner et al., in press).
A significant number of coastal areas are already vulnerable to present-day climate variability and changes in global mean sea level. These areas include deltaic areas, low-lying stretches of continental shorelines and many small islands. Their vulnerability is determined by a combination of susceptibility, resilience and institutional problems. These problems have been directly caused or exacerbated by the existence of three types of interrelated “failures” (Turner, 1991; and Figure 1):
• information failures such as lack of data on natural systems and processes and their total economic value, and the lack of system-wide integrated thinking;
• policy failures leading to inappropriate and uncoordinated projects and development planning in coastal zones and small islands; and
• market failures leading to pollution and resource depletion because of the lack of proper resource pricing and property rights.
While these “failures” phenomena are pervasive, their significance, and thus the vulnerability to environmental change, is likely to be greater in the coastal zones of developing countries. When such economies are hit by weather-related disasters such as tropical cyclones with coastal zones facing the brunt of such storms, they face a disproportionate impact, especially in terms of the loss of human lives. An estimated 85 percent of the people killed, injured or made homeless as a result of storms, cyclones and floods between 1960 and 1990 were from developing countries (Berz, 1991). National economic losses as a percentage of total GNP follow a similar pattern. In 1989, for example, US$ 7.6 billion of losses from natural disasters were recorded in the United States, with more than 50 percent due to one event, Hurricane Hugo. But these losses represent less than 0.1 percent of the GNP of the United States. Three countries in Latin America - Bolivia, Ecuador and Peru - had to face costs of US$ 4 billion due to the ENSO event of 1982-1983. This cost burden, however, represented 10 percent of their combined GNP (Mitchell and Ericksen, 1992).
Of direct relevance when analysing socio-economic impacts is the evaluation of the potential loss of environmental assets. In economic terms an ecosystem such as, for example, a coastal wetland, can yield direct-use values and indirect-use values, based on its regulation and user and production functions, as well as non-use values such as information functions (Turner, 1988, 1991; Barbier, 1994). The benefits of ICZM can also therefore be classified in terms of use and non-use values to be derived from the environmental resources present in the coastal zone.
No matter how they are defined, coastal zones are highly dynamic and ‘open’ combined natural and socio-economic systems. A significant proportion of social and economic welfare depends directly or indirectly on the availability of environmental goods and services provided by marine and coastal systems. Coastal zones represent the narrow transition zone between terrestrial and oceanic systems. They are also characterised by highly diverse ecosystems, with the result that a large number of functions are performed over a relatively small area. This concentration of functions, together with their spatial location, makes these zones attractive areas for people to live and work in.
- 1 8 -
Following Turner (1988), Barbier (1989) and de Groot (1992) the environmental functions and services performed by natural systems can be categorised as:
• Regulatory functions: Nutrient cycling, carbon sink, waste assimilation, and sedimentation are particularly important in maintaining system resilience in the face of both natural hazards, cyclones, storm surges and human-induced stresses. There is also a sense in which these processes are an important component of the life-support system.
• User and production functions: Coastal zones provide a wide array of direct and indirect use values including protection from storm surges, flooding, habitat loss reduction, recreation, groundwater protection surface water, marine resources, marine transport, waste disposal, and marine sanctuaries. Such resources also exhibit existence values relating to stakeholder groups that possess valuation motives particularly with regard to unique resources.
• Information functions: The diverse nature of coastal zone ecosystems provides a ‘naturallaboratory’ with a vast potential stock of scientific knowledge.
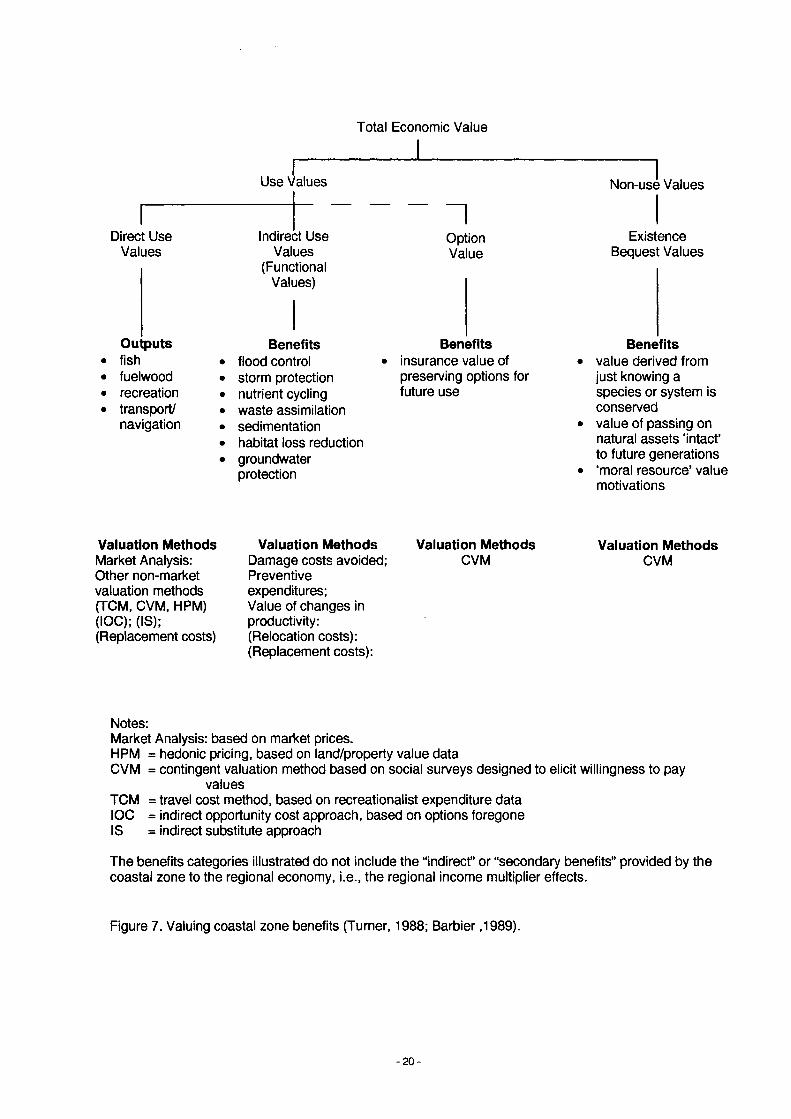
In economic terms a component of a coastal zone system, for example a coastal wetland, can yield direct and indirect use values, as well as non-use values (Turner, 1991; Barbier, 1994). A range of valuation methods are available to evaluate such environmental benefits. Figure 7 provides an example for a coastal wetland. A full range of valuation techniques is required to quantify the economic value of wetlands. Even if all the elements are appraised, another issue arises in the aggregation of the values to obtain a total economic value. This is the argument that ecosystems have primary value which is conditional on the existence and maintenance of the “healthy” ecosystem rather than on any one individual human use component (Section 3). In other words thesum of the total system value is greater than the sum of the component parts.
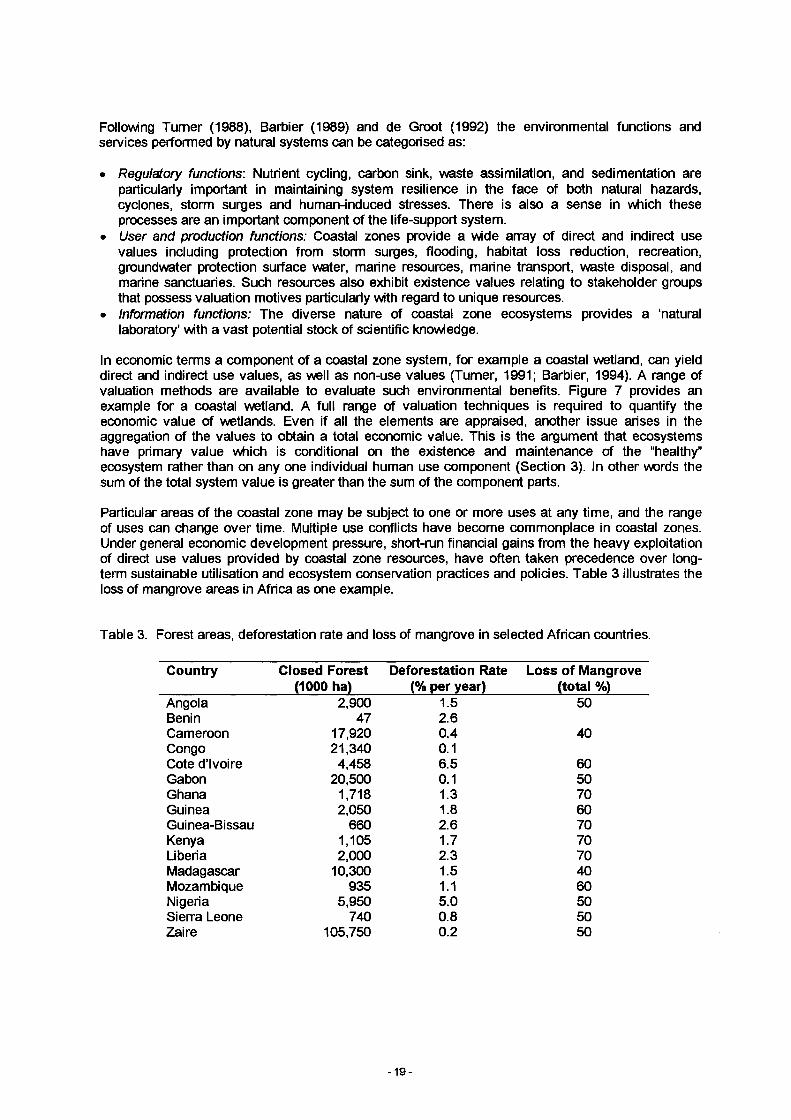
Particular areas of the coastal zone may be subject to one or more uses at any time, and the range of uses can change over time. Multiple use conflicts have become commonplace in coastal zones. Under general economic development pressure, short-run financial gains from the heavy exploitation of direct use values provided by coastal zone resources, have often taken precedence over longterm sustainable utilisation and ecosystem conservation practices and policies. Table 3 illustrates the loss of mangrove areas in Africa as one example.
Table 3. Forest areas, deforestation rate and loss of mangrove in selected African countries.
Country Closed Forest Deforestation Rate Loss of Mangrove(1000 ha) (% per year) (total %)
Angola 2,900 1.5 50Benin 47 2.6Cameroon 17,920 0.4 40Congo 21,340 0.1Cote d’Ivoire 4,458 6.5 60Gabon 20,500 0.1 50Ghana 1,718 1.3 70Guinea 2,050 1.8 60Guinea-Bissau 660 2.6 70Kenya 1,105 1.7 70Liberia 2,000 2.3 70Madagascar 10,300 1.5 40Mozambique 935 1.1 60Nigeria 5,950 5.0 50Sierra Leone 740 0.8 50Zaire 105,750 0.2 50
- 1 9 -
Total Economic Value
Direct Use Values
Outputsfishfuelwoodrecreationtransport/navigation
Use Values
Indirect Use Values
(Functional Values)
Benefitsflood control storm protection nutrient cycling waste assimilation sedimentation habitat loss reduction groundwater protection
nOptionValue
Benefitsinsurance value of preserving options for future use
Non-use Values
Existence Bequest Values
Benefitsvalue derived from just knowing a species or system is conserved value of passing on natural assets ‘intact’ to future generations ‘moral resource’ value motivations
Valuation MethodsMarket Analysis: Other non-market valuation methods (TOM, CVM, HPM) (IOC); (IS); (Replacement costs)
Valuation MethodsDamage costs avoided;Preventiveexpenditures;Value of changes in productivity:(Relocation costs): (Replacement costs):
Valuation MethodsCVM
Valuation MethodsCVM
Notes:Market Analysis: based on market prices.HPM = hedonic pricing, based on land/property value dataCVM = contingent valuation method based on social surveys designed to elicit willingness to pay
valuesTCM = travel cost method, based on recreationalist expenditure data IOC = indirect opportunity cost approach, based on options foregone IS = indirect substitute approach
The benefits categories illustrated do not include the “indirect” or “secondary benefits” provided by the coastal zone to the regional economy, i.e., the regional income multiplier effects.
Figure 7. Valuing coastal zone benefits (Turner, 1988; Barbier ,1989).
- 2 0 -
The risks of such a development strategy are twofold. There is the obvious danger of depleting, to exhaustion, the resource stocks providing the direct use value, or severely degrading the ‘quality’ of the resource services. But secondly, the over-exploitation of the use function capacities of coastal zone resources has implications for the maintenance of the regulatory and indirect use value functions, as well as the information provision function, of the overall coastal zone system. Thus, for example, the extensive conversion of coastal wetlands to provide land for residential, industrial or agricultural activities can produce widespread negative effects such as biodiversity loss, storm buffering capacity loss, with consequent increased flood damage and loss of human life, water quality deterioration in coastal waters, fishing productivity decline, and threats to cultural sites and livelihoods. Degradation of coastal habitats, through direct loss or alteration of their composition and structure, therefore risks reducing their capacity to function effectively as ecosystems.
Many coastal zones provide a significant proportion of the national Gross National Prodiict (GNP). The maintenance of the proper functioning of the marine and coastal zone system is therefore of critical economic importance. Policies and practices which maximise short-term financial returns should not be given priority over longer-term, economically beneficial, sustainable resource uses, unless resource substitutions are available and are practicable propositions.
Many of the functions and services provided by coastal wetlands, for example, are non-market goods and therefore do not carry appropriate market prices and value. It is also the case that while wetlands are capable of yielding a range of goods and services, some uses preclude others, and so some caution is necessary when total economic value estimates are utilised. Published estimates of the total economic value of wetland functions vary from US$ 1.5 million/km2 to US$ 13 million/km2, but the average is between US$ 2-5 million/km for OECD countries and US$ 1.25 million/km2 for developing countries (Fankhauser, 1995).
The Broadlands coastal wetland in England, for example, is estimated to provide recreation and amenity benefits of around US$ 5 million per year (Bateman et al., 1995). The storm buffering function of the Terrebonne coastal wetlands in Louisiana has been valued in terms of storm damage avoided. If the wetlands continue to recede at their present rate, incurred property damage over time may amount to US$ 2-3 million per year (Costanza et al., 1989). Both these examples represent use values, but environmental systems and their components are also valuable even if no use is taking place or is anticipated. Humans may value nature purely because it exists and would feei a loss if it was damaged or destroyed. Non-use values can therefore be assigned to the information functions that are provided by environmental systems. Non-use values are much more difficult to estimate in monetary terms but the studies that have been undertaken suggest that the values are significant.
Attention should also be paid to traditional, aesthetic and cultural values, such as those of subsistence economies and traditional land tenure systems. The conventional impact evaluation techniques, such as economic cost-benefit analysis, reflect largely market-oriented approaches for assessing potential damages from global change events. Alternative methodologies that seek to assess changes in culture, community, and habitat, are being developed for some regions.
A study of coastal vulnerability and resilience to sea-level rise and climate change in Fiji and Western Samoa was published in 1994 by the Japanese Overseas Environmental Cooperation Centre in collaboration with the South Pacific Regional Environment Programme, (Nunn etal., 1994). The study computes a Sustainable Capacity Index based on the sum of ratings of vulnerability and resilience for many categories of cultural, social, agricultural and industrial impacts, at the local, regional and national level. Areas with higher concentrations of assets are judged to be more vulnerable, while areas with diversity and flexibility in the system, whether natural or managerial, tend to be viewed as more resilient in this analysis. The study evaluated potential impacts to subsistence economies according to the view that communities in which the exchange economy involves little cash are more vulnerable, but that subsistence economies in which staples can be replaced with other crops tend to be more resilient. In addition, cultural sites are ranked according to the level of national interest in their preservation. The study concluded that subsistence economies and cultural assets are more vulnerable in Fiji, and that conventional and quick analyses of relatively high-lying islands such as Fiji would tend to underestimate the potential vulnerability of these areas, given that more people live in the low-lying coastal plain, and the majority of cash and subsistence economic activities take place in the low-lying areas (Nunn etal., 1994).
-21 -
The extent of integration of livelihoods into the market economy, as demonstrated by this study, is a critical factor in social vulnerability to global change. There is, however, little agreement on whether market integration increases or decreases vulnerability. The decline of customary collective coping strategies overtime due, to market integration, has been observed by Watts (1983) and Swift (1993). They hypothesise that the mechanisms by vtfiich this occurs is through loss of communally managed resources which act as a buffer for poorer households, and through the extension of state control which replaces traditional with formal social security (Platteau, 1991).
Contrary evidence, however, for the decline in non-reciprocal informal social security through market integration, is available. Paulson (1993), for example, studies the impact in Western Samoa of both the integration of agriculture into the world economy through cash crops, and of the presence or absence of reciprocal social security in the aftermath of widespread hurricane damage in 1990. She observes that the cultivation of some hunricane resistant crops and famine foodstuffs have declined by Western Samoan farmers and cash crops were being grown and usually sold for export. However, this did not increase vulnerability in comparison with regions which did not grow these crops. This is partly explained in this case by a low reliance on coconuts, which are particularly susceptible to loss of the whole crop from high winds.
The hazard characteristics of the crops grown, rather than the extent to which they were integrated into the market system explained the impact of the climate hazard in this case (Paulson, 1993). Further, although poorer villages did seem to experience greater impacts and take longer to recover from the 1990 hurricane, this was attributable in part to a weakening of the so-called ‘moral economy’. Nevertheless, non-monetary informal arrangements for sharing of food persisted in general, and the so-called ‘moral economy' seems to be resilient to increased state and market involvement in Western Samoa (Paulson, 1993). These examples demonstrate that the roles of social organisation and institution are important in any assessment of resource use pressures and change in coastal zones.
2.2 ICZM Analytical Approach
Although not directly relevant to the immediate LOICZ Focus 4 research activities, the economic evaluation approach would require that a ‘with ICZM’ versus a ‘without ICZM’ approach should be adopted, with the net benefits of ICZM being represented by the difference between the two states of the world in a given coastal zone situation. The benefits and costs of ICZM will be determined by the range of processes, functions, products and services found ‘on-site’, and their interrelationships with ‘off-site’ factors.
The ‘without ICZM' situation is characterised by determining current baseline conditions and significant parameter trends in the zone. The ‘with ICZM’ situation can be characterised by forecasting the modified development and resource usage rates and patterns that will occur if ICZM is implemented, together with their relevant economic costs and benefits. It is important to recognise that there will be both direct and indirect implications and impacts. Modelling the potential changes is best achieved with the use of scenario analysis.
2.3 ICZM Policy Objectives and Decision Criteria
2.3.1 Sustainable development policy objective
The underlying goal of ICZM is the promotion of sustainable economic development, both in the zone itself, and as part of the national economy. According to the most publicised definition, sustainable development is ‘development that meets the needs’ of the present without compromising the ability of future generations to meet their own needs (WCED, 1987, p.43). Another way of putting it would be that the sustainability objective requires development that improves the total quality of life, both now and in the future, in a way that maintains the ecological process on which life depends (Resource Assessment Commission, 1993).
- 22 -
Some of the core objectives, or principles, of the sustainability concept (Annex 1) are:
• improvement of the welfare of the current generation, with particular emphasis on the welfare of the poorest members of society, while simultaneously avoiding uncompensated and ‘significant’ costs on future generations;
• the incorporation of an equity principle alongside economic efficiency principle, on both an intragenerational and intergenerational basis;
• a recognition of the global dimension and the pressures of global environmental change; and• a recognition of the significance of biodiversity conservation and the need to safeguard and
maintain ‘system-wide’ ecological processes and functions in a precautionary manner.
2.3.2 Sustainability and coastal zones
In the specific context of coastal zone resource management, valuation of multiple resources and competing resource uses is an important sustainability objective and principle. But the incorporation of economic valuation into the decision making process is not in itself sufficient to guarantee sustainable development. Such a strategy also requires an intergenerational equity commitment (Howarth, 1995). The resource assessment process can be based on the cost-benefit criterion, tempered by any relevant equity, aesthetic, cultural or moral considerations. Given the management consequences arising from the highly dynamic nature of coastal environments, a precautionary approach has much to recommend it. This approach would take due notice of the importance of protecting and maintaining natural processes and functions, at a system level. This would involve the recognition of a total system value which is greater than the aggregated value of the individual use and non-use component values. The implementation of the precautionary principle would require standards, regulations or quotas to be imposed on coastal resource users. Such sustainability constraints would of course carry their own ‘resource cost’ implications, usually in terms of foregone economic development benefits of one sort or another, which would require assessment and valuation.
As a result of the dynamic and ‘open system’ nature of coastal zones, resource assessment will have to be undertaken on a total catchment management basis, with due regard for ‘off-site’ as well as ‘onsite’ pressures and impacts. This is especially important for issues concerning waste disposal activities and linked water quality deterioration impacts.
Since the coastal zone is the most biodiverse zone, it may be prudent to impose a ‘zero net loss' principle or constraint on resource utilisation, affecting habitats, biodiversity and the operation of natural processes, in the zone, at least at the start of the resource assessment process. But such a set of constraints will probably conflict with some other human needs, including, for example, the needs of indigenous people.
A typical multiple objective and value conflict problem is posed, for example, by the need of artisanal fisheries to increase fisheries yield in a given zone, together with the increasing use of the same or nearby waters for waste disposal. Further pressure may then be put on the zone as port authorities seek to improve conditions for marine transport, and regulatory authorities see an increasing need to raise the quality of bathing waters by increasing the stringency of pollution controls on dischargers to coastal waters. A difficult sustainability balance will need to be struck depending on the real economic value of the various resource management options, the extent to which sustainable human livelihoods can be fostered with alternative income sources substituting for unsustainable current usages, and the actual resilience of various natural systems and processes.
General goals of CZM need to be translated into quantitative objectives before analysis, via economic and other evaluation methods of alternative strategies, is possible see Figure 8. For example, maintaining the marine ecosystem can be partially achieved by improving water quality. This improvement goal must be defined in more specific terms such as concentrations of particular substances in the water column and in sediments. Making more efficient use of coastal zone resources can also make a contribution to increased regional economic development. In this case the specific goal would be to maximise net regional product minus normal production costs, discharge reduction costs, ecosystem protection costs, any remaining damage impacts (since zero pollution is rarely economically optimal), and administrative costs and other benefits not included in net regional product.
-2 3 -
This exercise in goal setting and definition can be facilitated through the use of economic evaluation methods, cost-benefit analysis, risk-benefit analysis, and related methods such as cost-effectiveness analysis together with multi-criteria, non-monetary, analysis, see Table 4 and Figure 8.
Table 4. Comparative evaluation of different decision frameworks (Lave and Malès, 1989). (PP = precautionary principle; CBA = cost-benefit approach).
Regulatory Approach EconomicEfficiency
Equity AdministrativeSimplicity
Acceptability RiskReduction
No risk (bans) zero PP emissions
v. low v. high high v. high v. high
Risk-based(regulations)
low high high high high
Technology-based(standards)
v. low low v. high high high
Risk-benefit CBA analysis
high low low low low
Cost-benefit analysis (with economic incentives)
v. high low low low low
Natural resources provide both goods and services, a mangrove forest, for example, may provide goods as fuelwood, timber, crabs and medicinal plants. It also produces services than can be easily identified such as breeding grounds for fish and services that are less obvious such as a potential site for wastewater treatment. Thus a particular use or set of uses of the mangrove can generate positive and negative impacts. Conversion of some of the mangrove to agricultural use might have a negative effect in the form of a reduced shellfish harvest in the mangrove. The positive benefit of the conversion will be the increased crop production on the net agricultural land. The mangrove conversion might produce on-site impacts such as reduced harvesting of wood and charcoal, and off- site aspects such as reduced fishery yields in affected adjacent coastal waters. If very extensive, the mangrove conversion might also result in the loss of biodiversity, lost income or even livelihoods and culture for some indigenous communities.
Financial Appraisal Economic Appraisal Multi-Criteria ApproachBased on private costs and benefits in cash flow term.
Based on social costs and benefits, expressed in monetary terms, including environmental effects.
Based on non-monetary estimates of a diverse range of effects, social, political and environmental.
Analysis is related to an individual economic agent, i.e., farmer, householder, firm or agency.
Typical techniques: discounted cash flows and balance sheets; payback periods and internal rates of return.
Social costs/benefits = private costs/benefits + external costs and benefits.
Typical techniques: cost-benefit analysis, extended cost-benefit analysis, and risk-benefit analysis.
Scaling and weighting of impacts.
Typical techniques: impact matrices, planning balance sheets, concordance analysis, networks, and trade-off analysis.
less comprehensive/less data intensive more comprehensive/more data intensive
Figure 8. Spectrum of appraisal methods.
When environmental goods and services are bought and sold in the market, it is relatively easy to assign an economic value via market prices to a change in their quality or availability. However, market prices do not always reflect the true value of a particular environmental good or service. Furthermore, market prices do not even exist for many environmental goods and services. Economists have attempted to find other ways to place monetary values on such goods and services (Section 3).
2.4 Resource Assessment and Evaluation Approaches
Faced with the need to make consistent choices between coastal resource conservation, preservation and utilisation options, or between a decision to prohibit, modify or sanction economic activities that are pressurising the coastal environment resource system, resource managers and policy makers require the application of a consistent appraisal methodology for evaluating the alternative options. The economic appraisal methodology is based on the quantification and monetary valuation of all relevant social costs and social benefits associated with each option (section 3). Other appraisal methodologies rely on non-monetary evaluation in their assessment of the gains and losses associated with the available options, as illustrated in Table 5.
Table 5. Environmental evaluation methods, showing increasing complexity and scale of analysis (Pearce and Turner, 1992).
Financial Economic Extended Cost- Environmental Multi-CriteriaAnalysis Costs-Benefit Benefit Analysis Impact Decision
Analysis Assessment Methodsfinancial economic sustainable quantification of a multiple decisionprofitability efficiency development diverse set of criteria;criterion; criterion; principles; effects on a monetary andprivate costs and social costs and economic common scale, non-monetaryrevenues; benefits; efficiency and but no evaluation evaluationmonetary monetary equity trade-offvaluation valuation environmental
standards as constraints; partial monetary valuation
Policy decisions are required relating to a range of spatial scales and socio-economic and political levels. Three broad categories of resource assessment are required corresponding to the different types of policy decisions (Barbier, 1993). This tripartite categorisation is used to differentiate the case studies presented in Section 4 of this report:
• impact analysis - an assessment of the damage inflicted on individual resources or sets of resources from a specific environmental impact, e.g., heavy metal pollution, oil spills, or sewage disposal etc.
• partial valuation - an assessment of alternative resource allocations or project options involving coastal resources, such as the conversion of coastal wetlands for residential housing or agriculture or port and harbour facilities;
• total valuation - an assessment of the total economic value of coastal resource systems, in order to determine its worth, for example, as a conservation zone or marine park area.
- 2 5 -
Within each assessment approach a variety of valuation (monetary) techniques may be deployed in order to convert each environmental impact from physical units to monetary units. If time and other resources permit, empirical research can be conducted via several “primary” valuation methods:
• market orientated benefit valuation - benefit valuation using actual market prices of productive goods and services based on changes in the value of output, or loss of earnings. Examples include loss of fisheries output due to pollution, or value of productive services or recreational benefits loss, through increased illness caused by coastal waters pollution.
• surrogate markets benefit valuation - environmental surrogates may include marketed goods, property values, other land values, travel costs of recreation, wage differentials, compensation payments. Examples of such proxies are entrance fees to national parks as a proxy for value of visits to protected areas, changes in commercial property values as a result of water pollution, or compensation for damage to fisheries.
• cost valuation using actual market prices of environmental protection inputs - preventive expenditures, replacement costs, shadow projects, cost-effectiveness analysis. For example the cost of environmental safeguards in project design, cost of replacing resource damaged by pollution or conversion, cost of supplying alternative recreational facilities destroyed by development activities, or cost of alternative means of sewage sludge disposal in marine waters can be used as cost indicators.
• survey orientated (hypothetical valuation) - contingent valuation or contingent ranking questionnaire-based surveys of individuals to elicit willingness-to-pay or to-be-compensated valuations.
The main environmental pressures and impacts that are affecting coastal zones were summarised in Figure 5. To assess the economic aspects of these issues the impacts can be split into four distinct categories:
• direct and indirect productivity effects;• health effects;• amenity effects; and• existence effects such as loss of biodiversity or cultural assets.
Different valuation techniques are appropriate for each of the four broad impact categories and the various options are set out in Table 6. Choice of technique will depend on the magnitude and significance of impacts, on the availability of data, and on the analytical resources available in any given context.
Table 6. Coastal environmental impacts and valuation methods.
Impact Categories Valuation Method OptionsPRODUCTIVITY: market valuation via prices or surrogatese.g., Fisheries, agriculture, tourism, preventive expenditurewater resources, industrial production, replacement cost/shadow projects/cost-effectivenessmarine transport, storm buffering and analysiscoastal protection. defensive expenditure
HEALTH human capital or cost of illness contingent valuationpreventive expenditure (avertive behaviour) defensive expenditure
AMENITY contingent valuation/rankingCoastal ecosystems, wetlands, dunes, travel costbeaches, etc., and some landscapes, including cultural assets and structures.
hedonic property method
EXISTENCE VALUES Ecosystems; cultural assets
contingent valuation
- 2 6 -
It may be the case, however, that the lack of time or resources permit only the deployment of what we can call a “secondary” valuation method, known as benefits transfer. This method uses the results of original-research studies done elsewhere that have monetised similar impacts to ones relevant to the situation being studied. This benefits transfer method requires that a number of quite restrictive conditions be present if the estimates are to be considered reliable. It should therefore only be relied on with great caution if at all.
Under the first generic approach, impact analysis, assessing a specific environmental impact involves valuing the changes in the coastal resource resulting from that impact. For example, assume that discharges of effluent from a metal plating plant are regularly polluting an estuary and nearby coastal waters, affecting water quality and the productivity of local shell fisheries. The costs of the waste disposal activity are the losses in resource value arising from damage to the coastal marine ecosystem and its resource base. These damage costs would amount to the losses in net production benefits, the economic benefits of production less the costs from the impacts of the pollution on the shell fishery, plus any losses in net environmental benefits in terms of the general decline in estuarine and coastal water quality. The assessment and valuation of these losses represents an estimate of the net production and environmental benefits of the existing coastal resources (NBfe) that are affected by the pollution. The total cost of this pollution impact Pc, in terms of damage to the coastal resource base, are the forgone net benefits, NBfe:
Pc = NBfe
Dixon and Hufschmidt (1986) and Dixon et al., (1994) provide case studies of applying this particular approach in the context of coastal zone resources evaluation. They utilised cost-effectiveness analysis to assess various options for disposing of waste water from a geothermal power plant on the island of Leyte in the Philippines. It was only found possible to quantify some of the environmental impacts, e.g. lost marine fishery production and rice production, and not energy loss, lost riverine fishery production, human health effects and amenity effects. Nevertheless, this cost-based analysis did provide significant policy relevant information. It indicated that the quantifiable environmental costs of releasing untreated waste into the Bao River or into the Mahiao River were high, accounting for 41 per cent and 35 per cent of total measurable costs of these options respectively (Case Study 2 in Section 4).
In another impact analysis study in the Philippines the downstream effects of logging-induced sedimentation on the marine environment of Bacuit Bay, Palawan were estimated (Hodgson and Dixon, 1988). The analysis based on lost earnings and changes in the value of output showed that continued logging of the Bacuit Bay watershed would result in a reduction in gross revenues of more than US$ 40 million from tourism and marine fisheries, linked to coral reef deterioration, over a ten- year period (Case Study 1 in Section 4).
Partial valuation assessment can be deployed when, for example, a coastal resource such as a mangrove is under threat of conversion to provide some alternative development opportunity. The direct net benefits (NBC of the conversion), say for housing, would be the direct benefits (value of the housing), BD, minus the direct costs (clearance of site, housing construction etc.), CD, so that:
NBc = Bd - CD > 0
It is often the case that only the measurement and valuation of one or two of the impacts of conversion of natural coastal resource systems is necessary to prove that the development project is uneconomic, provided that the on-going utilisation of the natural system is at a sustainable level.
The total valuation approach is particularly suited to evaluations of protected areas schemes involving restricted or controlled resource use. The analysis would seek to determine whether the total net benefits of the protected area kept in a sustainable ‘natural’ state, NBP, exceeded the direct costs, Cp, of establishing the protected zone and necessary buffer zone, plus the net benefits forgone, NBaf, of alternative uses of the protected area:
NBp > Cp + NBaf
-2 7 -
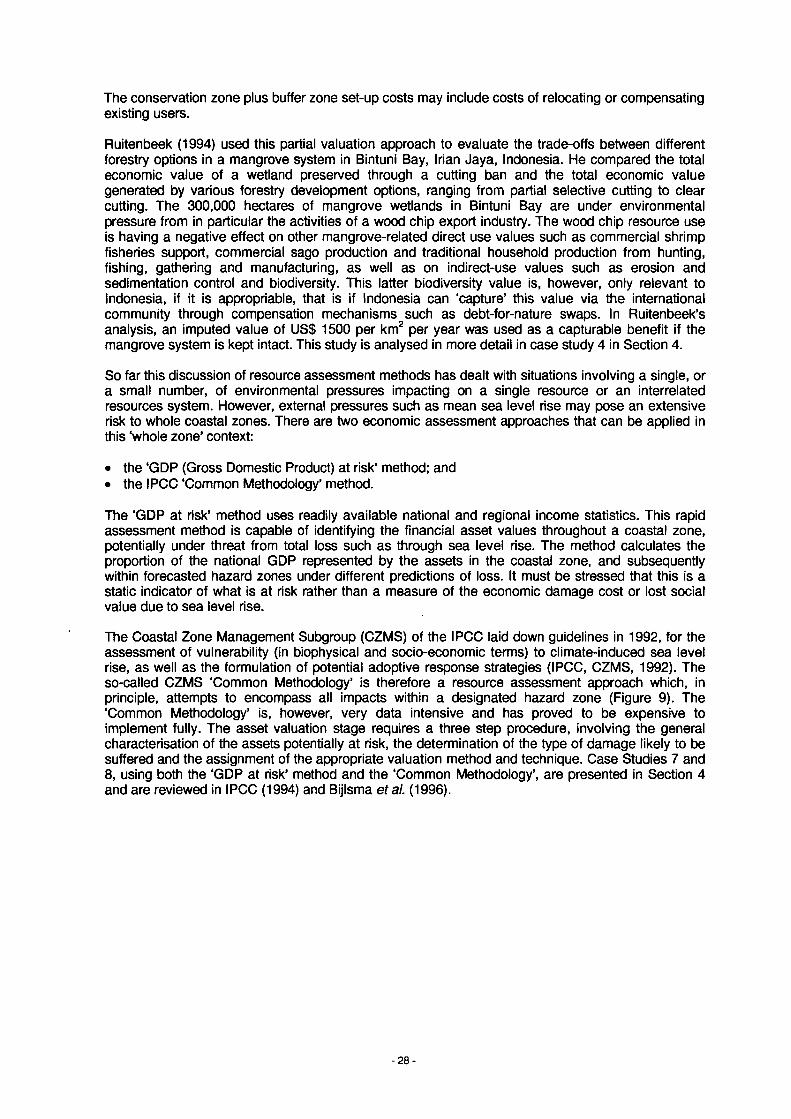
The conservation zone plus buffer zone set-up costs may include costs of relocating or compensating existing users.
Ruitenbeek (1994) used this partial valuation approach to evaluate the trade-offs between different forestry options in a mangrove system in Bintuni Bay, Irian Jaya, Indonesia. He compared the total economic value of a wetland preserved through a cutting ban and the total economic value generated by various forestry development options, ranging from partial selective cutting to clear cutting. The 300,000 hectares of mangrove wetlands in Bintuni Bay are under environmental pressure from in particular the activities of a wood chip export industry. The wood chip resource use is having a negative effect on other mangrove-related direct use values such as commercial shrimp fisheries support, commercial sago production and traditional household production from hunting, fishing, gathering and manufacturing, as well as on indirect-use values such as erosion and sedimentation control and biodiversity. This latter biodiversity value is, however, only relevant to Indonesia, if it is appropriable, that is if Indonesia can ‘capture’ this value via the international community through compensation mechanisms such as debt-for-nature swaps. In Ruitenbeek’s analysis, an imputed value of US$ 1500 per km2 per year was used as a capturable benefit if the mangrove system is kept intact. This study is analysed in more detail in case study 4 in Section 4.
So far this discussion of resource assessment methods has dealt with situations involving a single, or a small number, of environmental pressures impacting on a single resource or an interrelated resources system. However, external pressures such as mean sea level rise may pose an extensive risk to whole coastal zones. There are two economic assessment approaches that can be applied in this ‘whole zone’ context:
• the ‘GDP (Gross Domestic Product) at risk’ method; and• the IPCC ‘Common Methodology’ method.
The ‘GDP at risk’ method uses readily available national and regional income statistics. This rapid assessment method is capable of identifying the financial asset values throughout a coastal zone, potentially under threat from total loss such as through sea level rise. The method calculates the proportion of the national GDP represented by the assets in the coastal zone, and subsequently within forecasted hazard zones under different predictions of loss. It must be stressed that this is a static indicator of what is at risk rather than a measure of the economic damage cost or lost social value due to sea level rise.
The Coastal Zone Management Subgroup (CZMS) of the IPCC laid down guidelines in 1992, for the assessment of vulnerability (in biophysical and socio-economic terms) to climate-induced sea level rise, as well as the formulation of potential adoptive response strategies (IPCC, CZMS, 1992). The so-called CZMS ‘Common Methodology’ is therefore a resource assessment approach which, in principle, attempts to encompass all impacts within a designated hazard zone (Figure 9). The ‘Common Methodology’ is, however, very data intensive and has proved to be expensive to implement fully. The asset valuation stage requires a three step procedure, involving the general characterisation of the assets potentially at risk, the determination of the type of damage likely to be suffered and the assignment of the appropriate valuation method and technique. Case Studies 7 and 8, using both the ‘GDP at risk’ method and the ‘Common Methodology’, are presented in Section 4 and are reviewed in IPCC (1994) and Bijlsma etal. (1996).
- 2 8 -
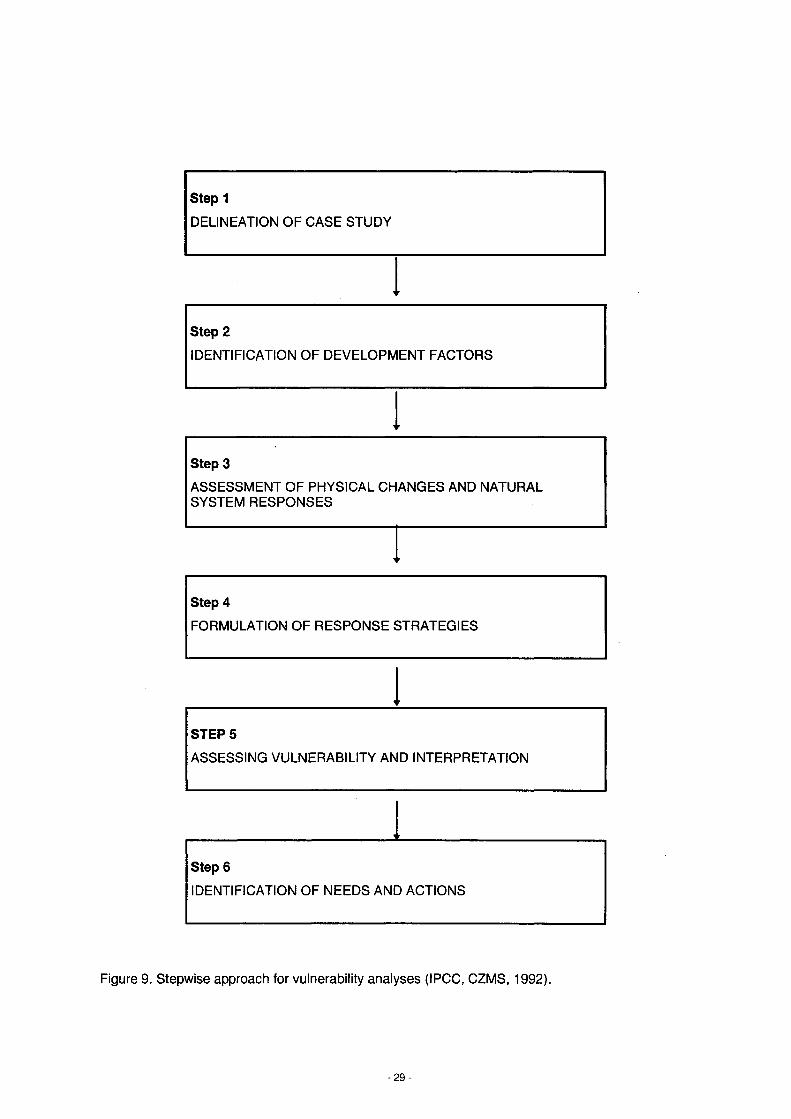
Step 4FORMULATION OF RESPONSE STRATEGIES
STEP 5ASSESSING VULNERABILITY AND INTERPRETATION
Step 2IDENTIFICATION OF DEVELOPMENT FACTORS
Step 1DELINEATION OF CASE STUDY
Step 6IDENTIFICATION OF NEEDS AND ACTIONS
Step 3ASSESSMENT OF PHYSICAL CHANGES AND NATURAL SYSTEM RESPONSES
Figure 9. Stepwise approach for vulnerability analyses (IPCC, CZMS, 1992).
- 29 -
The general approach to resource assessment and evaluation set out above will be conditioned by the following caveats and problems:
• ‘Boundary’ issue: off-site factors can be as or more significant than on-site factors, in which case it may be inefficient to deploy resources on some mitigation or prevention measures within the coastal zone: rather the need for action on a wider scale, up to the international level may be paramount (Adger and Fankhauser, 1993).
• Distribution of costs and benefits within the zone will be important, stakeholder analysis is therefore required in any management process.
• The majority of stakeholder interests will be related to direct and indirect uses and values in the zone and conflicts between individual uses and values.
• The minority of stakeholders will hold existence motivations and valuations which favour strong conservation measures. Occasionally unique, irreplaceable resource losses may generate widespread stakeholder interests.
• The analysis required for ICZM performs an overall resource management auditing role. For example, it forces policy makers to ask relevant questions, relating to sources of finance and human capital resource potential.
• Secondary effects problem. This is exacerbated the higher the level of economic development present in the area under analysis. In the case of economies with a small number of sectors, and given a 10 year time horizon, the need for a regional input-output model to track the significant secondary effects of changes in the coastal zone is much reduced, in these cases simple regional multiplier calculations will probably suffice. But in more diversified and developed economies, secondary effects will be more significant. Nevertheless, large l-O models are expensive and unable to cope sufficiently with dynamic change.
2.5 Framework for ICZM Planning
A sequence of planning steps which can be applied to a given coastal management area is summarised in Figure 10. The steps are:
• setting up the analysis;• identifying present conditions in the zone, including current policy and institutions and trends;• assessing the resource base potential of the zone;• specification of scenarios for change in the zone;• estimation of the ‘within zone’ and ‘outside zone’ demands for goods and services for the different
scenarios;• estimation of the spatial extent and level of activities within the zone stimulated by resource
usages and demands;• assessing the impacts of economic activity on the resource base of the zone, for different
scenarios with no new policy response;• assessing the economic effects of the impacts;• formulation of alternative management strategies for each change scenario;• assessing the effects of each management strategy for each scenario;• evaluating the results of each strategy for each scenario; and• presenting the results to policy makers and implementing ICZM.
This resource assessment guidelines document is particularly relevant for the first nine steps in the planning process shown in Figure 10. The first two steps require an interdisciplinary perspective inthat both natural science and socio-economic data are required. This interface is complicatedbecause of differences in methodology and analysis (data ‘translation’ problems), as well as a lack of data on regional or catchment-wide processes, functions and environmental pressures. Work is urgently required on the integration of generic natural science models, such as those presented in Gordon etal., (1996), at scales from large bays and shorelines up to regional seas and their coastal zones, with socio-economic data and analysis.
-3 0 -
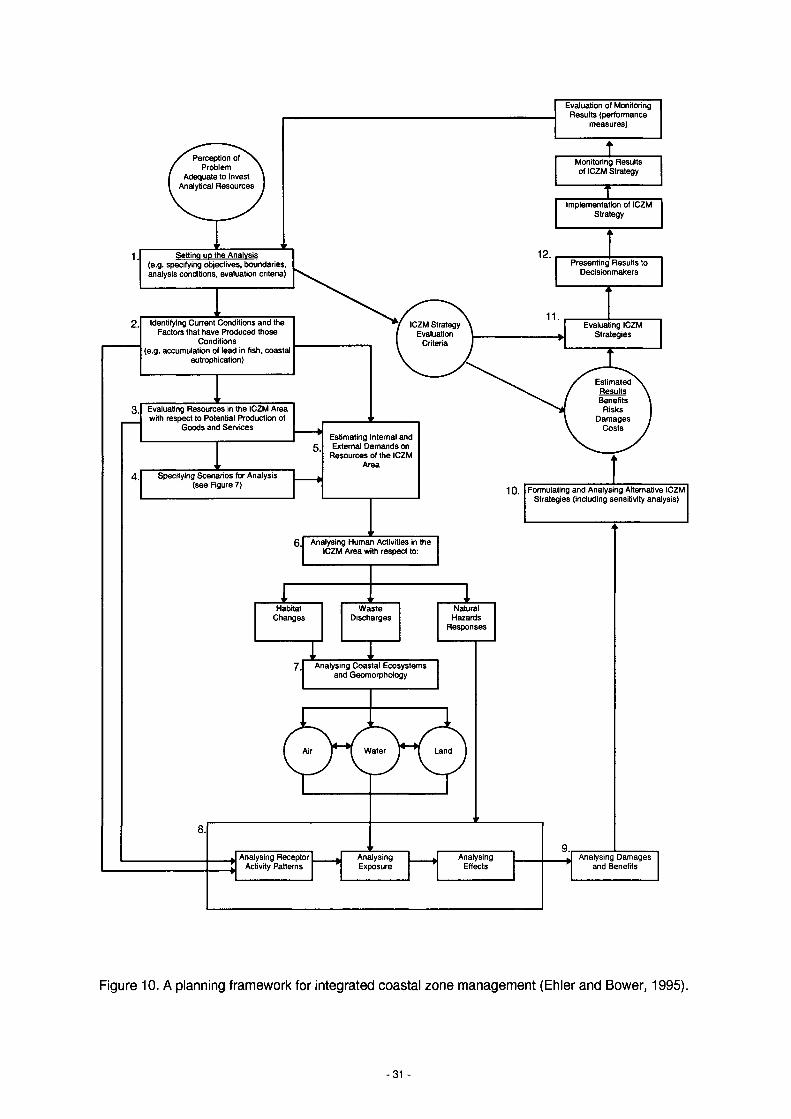
Perception of Problem
Adequate to Invest Analytical Resources
Evaluation of Monitoring Results (performance
measures)
2.
Setting u p the Analysis (e.g. specifying objectives, boundaries, analysis conditions, evaluation criteria)
Identifying Current Conditions and the Factors that have Produced those
Conditions (e.g. accumulation of lead in fish, coastal
eutrophication)
Evaluating Resources in the ICZM Area with respect to Potential Production of
Goods and Services
Monitoring Results of ICZM Strategy
Implementation of ICZM Strategy
Presenting Results to Decisionmakers
ICZM Strategy Evaluation
Criteria
Evaluating ICZM Strategies
EstimatedResultsBenefits
RisksDamages
CostsEstimating Internal and External Demands on
Resources of the ICZM Area
Specifying Scenarios for Analysis (see Figure 7) 10. Formulating and Analysing Alternative ICZM
Strategies (including sensitivity analysis)
6. Analysing Human Activities in the ICZM Area with respect to:
Habitat Waste NaturalChanges Discharges Hazards
Responses
Analysing Coastal Ecosystems and Geomorphology
Water
Analysing Receptor Analysing Analysing Analysing DamagesActivity Patterns Exposure Effects and Benefits
Figure 10. A planning framework for integrated coastal zone management (Ehler and Bower, 1995).
-31 -
Following the P-S-R framework, the available data covering the various environmental factors relevant to a given coastal zone needs to be collected and assessed. The related socio-economic factors need to be identified from available statistical trends and national income accounts sources. These would include:
• population growth rates and spatial distribution;• age trends in the population;• human welfare indices;• housing and construction data and trends;• tourism data and trends;• GDP accounts and forecasts; and• industrial agricultural sectoral analysis and pollution and waste disposal requirements.
The combination of the natural science and socio-economic data should result in a broad-based assessment of the ‘baseline’ conditions in the coastal zone. These will include rate and extent of eutrophication, iand-use changes, shoreline and coastal morphology status and trends, all assuming no change in the prevailing policy and institutional set up.
The resource base of the coastal zone then needs to be assessed in a valuation framework, in order to set up an inventory of the economic-ecological assets present in the zone and potentially at risk from global environmental change. The ‘open system’ nature of coastal zones must be borne in mind and both ‘within zone’ and ‘outside zone’ linkages must be encompassed within the analysis. The valuation methods and techniques are covered in detail in section 3 of this document.
The next stage in the planning process is the specification of ‘state’ changes in the form of future scenarios in the coastal zone, and the consequent evaluation of the effects of changes in the state of the coastal zone resource base. A number of rather fundamental complications have to be faced at this stage of the analytical process. Natural processes and systems have a set of dynamics that change at very different temporal and spatial scales to many socio-economic processes and systems. It is not very meaningful to project socio-economic data much beyond 10 to 20 years into the future, while climate change projections, for example, have been calibrated for 100 years into the future. The evaluation of socio-economic data, in the form of social costs and benefits associated with projects or policy options via cost-benefit analysis, is typically based on an assumption of constant relative prices. The longer the time horizon pver which the data is projected the less tenable is such a cost/price assumption. The evaluation of socio-economic impacts over long periods of time into the future also raises the thorny problem of the discounting procedure and the appropriate rate of discount for the scenario analysis (Section 3).
Socio-economic change scenarios also require the analyst to assess the type of coastal economic system that is present and its linkages to the national and international economic system. The scenarios therefore have to include different (ranges) forecasts for both the national and international economy. Many coastal zones will represent significant proportions of national GNP and will also be dependent on economic activities such as tourism that are themselves highly correlated with the fortunes of the global economy and its growth rate. The World Bank, for example, has predicted in 1991 that industrialised economies will continue to grow in the coming decades but at a slower rate than developing countries in the near future (World Bank, 1991, Global Economic Prospects). For coastal zones with strong links to the international trading system it may be necessary to specify two or more basic change scenarios involving a ‘low growth’ global economy forecast and a ‘high growth’ forecast.
- 3 2 -
Subject to actual data, time, expertise, and financial resources constraints the coastal zone resources assessment procedure requires the specification of a set of conditions which enable a quantitative analysis of alternative resource usage strategies to be undertaken. Some of the main conditions are:
• the questions to be answered, in relation to the agreed-upon objectives;• criteria such as economic efficiency, equity, cost-effectiveness for evaluating resource uses and
strategies, and the relative weights of these criteria;• boundaries for the coastal zone;• base year or period to account for the identification of current base case conditions and scenario;• trend data used to explain status quo situation in the coastal zone;• time horizon over which changes in the coastal zone are to be analysed;• price level base year and discount rate to be used in estimating costs and benefits;• environmental quality indicators to be analysed• categories of activities, and related problems, to be analysed in terms of their resource demands
and pressure on carrying capacity; and• formats to be used to present results.
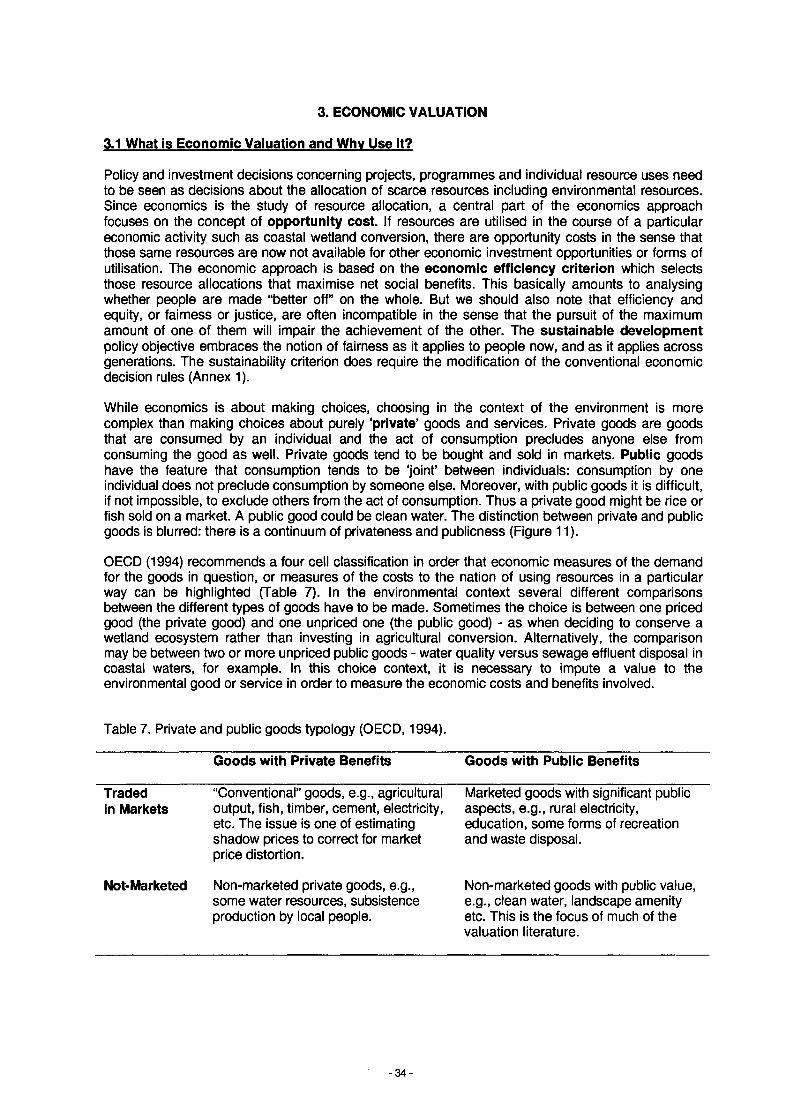
3. ECONOMIC VALUATION
3.1 What is Economic Valuation and Whv Use It?
Policy and investment decisions concerning projects, programmes and individual resource uses need to be seen as decisions about the allocation of scarce resources including environmental resources. Since economics is the study of resource allocation, a central part of the economics approach focuses on the concept of opportunity cost. If resources are utilised in the course of a particular economic activity such as coastal wetland conversion, there are opportunity costs in the sense that those same resources are now not available for other economic investment opportunities or forms of utilisation. The economic approach is based on the economic efficiency criterion which selects those resource allocations that maximise net social benefits. This basically amounts to analysing whether people are made “better off” on the whole. But we should also note that efficiency and equity, or fairness or justice, are often incompatible in the sense that the pursuit of the maximum amount of one of them will impair the achievement of the other. The sustainable development policy objective embraces the notion of fairness as it applies to people now, and as it applies across generations. The sustainability criterion does require the modification of the conventional economic decision rules (Annex 1).
While economics is about making choices, choosing in the context of the environment is more complex than making choices about purely ‘private’ goods and services. Private goods are goods that are consumed by an individual and the act of consumption precludes anyone else from consuming the good as well. Private goods tend to be bought and sold in markets. Public goods have the feature that consumption tends to be ‘joint’ between individuals: consumption by one individual does not preclude consumption by someone else. Moreover, with public goods it is difficult, if not impossible, to exclude others from the act of consumption. Thus a private good might be rice or fish sold on a market. A public good could be clean water. The distinction between private and public goods is blurred: there is a continuum of privateness and publicness (Figure 11).
OECD (1994) recommends a four cell classification in order that economic measures of the demand for the goods in question, or measures of the costs to the nation of using resources in a particular way can be highlighted (Table 7). In the environmental context several different comparisons between the different types of goods have to be made. Sometimes the choice is between one priced good (the private good) and one unpriced one (the public good) - as when deciding to conserve a wetland ecosystem rather than investing in agricultural conversion. Alternatively, the comparison may be between two or more unpriced public goods - water quality versus sewage effluent disposal in coastal waters, for example. In this choice context, it is necessary to impute a value to the environmental good or service in order to measure the economic costs and benefits involved.
Table 7. Private and public goods typology (OECD, 1994).
Goods with Private Benefits Goods with Public Benefits
Traded in Markets
“Conventional” goods, e.g., agricultural output, fish, timber, cement, electricity, etc. The issue is one of estimating shadow prices to correct for market price distortion.
Marketed goods with significant public aspects, e.g., rural electricity, education, some forms of recreation and waste disposal.
Not-Marketed Non-marketed private goods, e.g., some water resources, subsistence production by local people.
Non-marketed goods with public value, e.g., clean water, landscape amenity etc. This is the focus of much of the valuation literature.
-3 4 -
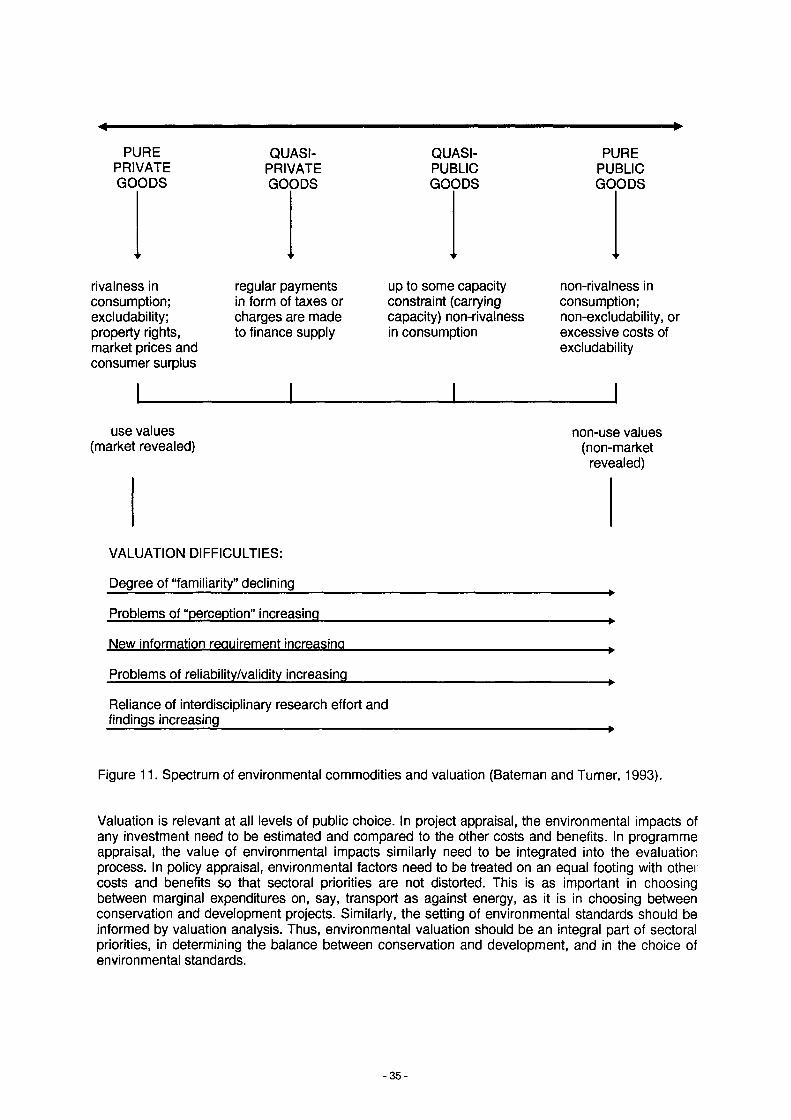
»
PUREPRIVATEGOODS
QUASIPRIVATEGOODS
QUASIPUBLICGOODS
PUREPUBLICGOODS
rivalness In consumption; excludability; property rights, market prices and consumer surplus
regular payments in form of taxes or charges are made to finance supply
up to some capacity constraint (carrying capacity) non-rivalness in consumption
non-rivalness in consumption; non-excludability, or excessive costs of excludability
use values non-use values(market revealed) (non-market
revealed)
VALUATION DIFFICULTIES:
Degree of “familiarity” declining____________
Problems of “perception” increasing_________
New information requirement increasing______
Problems of reliability/validity increasing_____
Reliance of interdisciplinary research effort and findings increasing_______________________
Figure 11. Spectrum of environmental commodities and valuation (Bateman and Turner, 1993).
Valuation is relevant at all levels of public choice. In project appraisal, the environmental impacts of any investment need to be estimated and compared to the other costs and benefits. In programme appraisal, the value of environmental impacts similarly need to be integrated into the evaluation process. In policy appraisal, environmental factors need to be treated on an equal footing with other costs and benefits so that sectoral priorities are not distorted. This is as important in choosing between marginal expenditures on, say, transport as against energy, as it is in choosing between conservation and development projects. Similarly, the setting of environmental standards should be informed by valuation analysis. Thus, environmental valuation should be an integral part of sectoral priorities, in determining the balance between conservation and development, and in the choice of environmental standards.
- 3 5 -
3.2 Market Failures. Government Failures and Property Rights
In the market place Individuals exercise choice by comparing their willingness-to-pay (WTP) with the price of the product. They purchase the good when their WTP exceeds the price, and not otherwise. Imputing values involves finding some measure of WTP for environmental quality. This is the essence of the process of economic valuation. It involves finding a WTP measure in circumstances where markets fail to reveal that information.
3.2.1 Market failures and property rights
This ‘market failure’ is important for the allocation of resources within an economy. If a mangrove is being considered for conversion to agricultural use then not all of the costs of this process will necessarily be reflected in the final choice. This may be the caçe, even where the costs are borne by the farmer or developer considering the conversion: future declines in crop productivity because of saline intrusion or storm damage may be imperfectly reflected in choices made now. Market failure is more pronounced still when the costs are borne by agents other than the farmer such as occur with siltation of estuaries and nearby ports, loss of storm buffer services over a wide zone, or eutrophication of coastal waters. Failure to account for these external on and off site costs gives rise to a misallocation of resources in the economy. In the example given here, this is because conservation and sustainable utilisation of the mangrove may be a more efficient choice than conversion, Table 8. Making choices better informed to avoid this misallocation of resources involves understanding the value of the external costs, and then finding a mechanism for integrating these values back into the original choice process. Valuation may be imperfect, the estimates derived should be viewed as ranges and not as point estimates, but in most cases some valuation is better than none.
Table 8. Mangrove conversion versus conservation of the source (Dixon and Burbridge, 1984).
Goods with Private Benefits Goods with Public BenefitsEconomic value of impacts on marketed goods and services
Usually on-site impacts:Benefits - increased crop production, one-off timber harvest Costs - loss of charcoal and other timber derivatives, loss of.crab harvest.
Usually off-site impacts:Benefits - regional multiplier effect from increased agricultural income Costs - reduced fisheries productivity in nearby coastal waters.
Economic value of impacts on non- marketed goods and services
Usually on-site impacts:Costs - loss of ‘subsidence’ goods supplied by mangrove, loss of nursery areas and feeding grounds for fish and shrimp, loss of biodiversity.___________________
Usually off-site impacts:Costs - increased eutrophication in estuaries and coastal waters, loss of storm buffer capacity
A related issue to that of market failure is that of the attenuation of property rights associated with coastal resources. Property rights refer to specific rights to utilise, control and trade in assets (following Bromley, 1991). These rights are attenuated by various legal and customary restrictions which define limitations on the use or consumption of the good or resource. There is a large range of observed types of property rights, often determined by the intrinsic nature of the resource, and by cultural and social determinants. These range from open access, common property, state property to private property. In some cases, rights to land or marine resources are not allocated, defined or enforced at all. This is the open-access situation, made famous by the polemic treatise on global human population by Hardin (1968), the Tragedy of the Commons. It describes a context in which no individual has the incentive to conserve the resource, as there is no assurance that other individuals will do likewise, with the result that the resource is over-exploited.
The open access resource example, has often been cited to argue for the need either to privatise resources, or to put them under state management. In many cases such resources are incorrectly perceived as lacking management institutions, and may in fact be communally managed (Meyer et al., in press; Bromley, 1989). Indeed, the move towards privatisation of resources globally in the last
-36 -
two decades, has generally ignored the factors which determine the sustainability of resource use: the connectedness of the resource use to external market forces, the regional economy, the institutional objectives of the state agencies potentially involved, and the strength of existing local institutions for management (Sanderson, 1994).
A more common situation in coastal resources is the last factor in the list of factors above. This is where local communal management of resources has evolved to fit with the parameters of the land or marine resource, and the local demands on the resource. Such common managed systems have been documented for fisheries and for land based resources in every continent (for example Ostrom, 1990; chapters in Berkes, 1989; Walters, 1994). Oceanic fishing resources and offshore oil resources, despite their apparent open-access nature, also tend to be ‘governed’, with varying degrees of success, through bi-lateral or multi-lateral agreements between governments, or through customary law such as the UN Convention on the Law of the Sea (Birnie and Boyle, 1992).
Research on property rights traditionally focuses on the implications for income of present property rights, mechanisms of changing property rights to meet specific management goals, and the institutions which govern the allocation of rights. The expanding literature on such issues highlights that both private and communal property rights can lead to undesirable environmental impacts, and that the important issue is the management of the resources. In defining the domain where common property works best, empirical studies have converged on a number of factors: relatively small groups with shared needs and norms, clear boundaries for resource management, stability in the communally managing population, and internalised transactions costs (North, 1990). Distributional preferences may lead a resource to be managed communally, the corollary being that privatisation may have distributional consequences (summarised in Meyer etal., in press).
Not all the factors for successful communal management of coastal resources may be present all the time. For fisheries, for example, Buck (1989) describes a typology of rights and characteristics, which emphasises the difficulties in management by a single institution. Marine fisheries are both renewable and fugitive, with habitats that range from high seas to coastal seas and even to freshwater rivers. This typology is set out in Figure 12 to illustrate the range of issues involved.
SCALE OF USER POOL PROPERTY RIGHT NATURE OF RESOURCE
Traditional (internal control, Non-transferable and Stationary and renewablelittle external control) exclusive
or or orLocalised (external political ■ Non-transferable and non ■ Stationary and noncontrol) T exclusive T renewable
or or orNational (internal political Transferable and exclusive Fugitive and renewablecontrol)
or or orMultinational (little internal Transferable and non Fugitive and non-renewableor external control) exclusive
Figure 12. A typology of common property resources (Buck, 1989).
To clarify the management options, it is necessary to identify the series of rights accruing to different institutions and their governance as exclusive and tradable, the nature of the resource with respect to being fugitive and renewable, and the scale of the user pool (Figure 12). The factors which lead to successful management, for both marine and terrestrial resources, are numerous and demonstrate the interaction of social and economic actions with the biological and biophysical considerations. This section has highlighted that market failures for many environmental goods is pervasive unless their management is internalised through a system of management by groups, state or individuals.
- 3 7 -
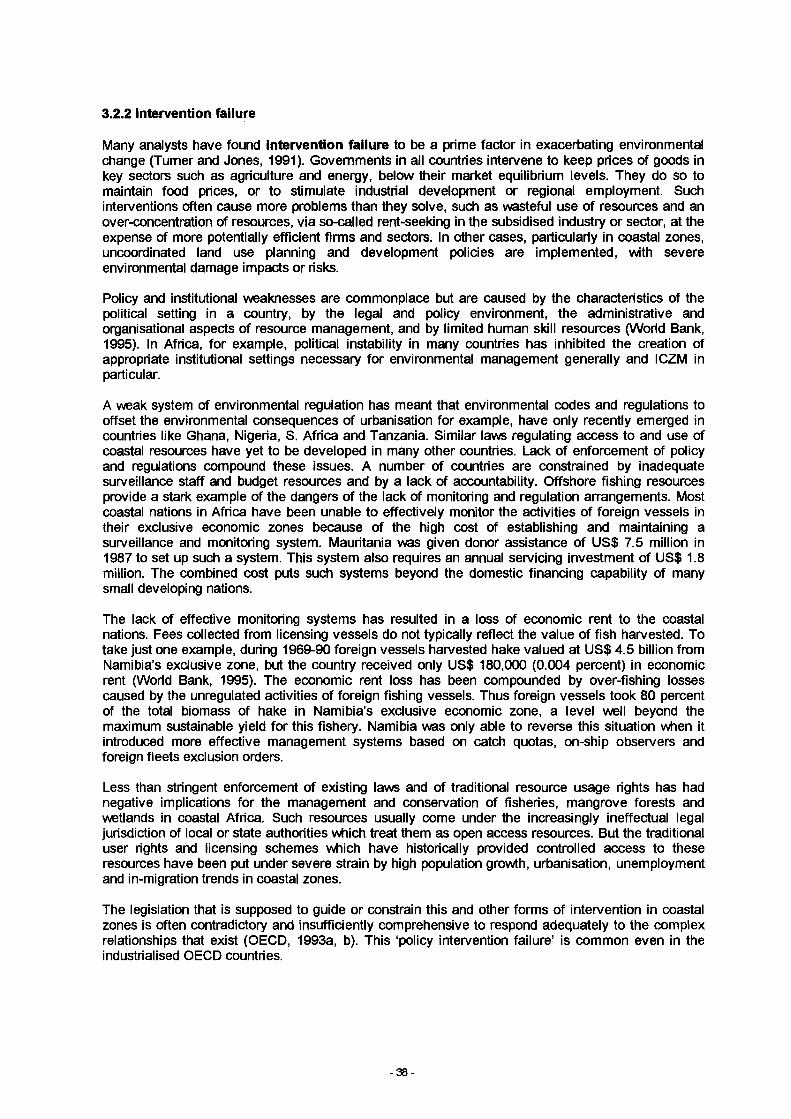
3.2.2 Intervention failure
Many analysts have found intervention failure to be a prime factor in exacerbating environmental change (Turner and Jones, 1991). Governments in all countries intervene to keep prices of goods in key sectors such as agriculture and energy, below their market equilibrium levels. They do so to maintain food prices, or to stimulate industrial development or regional employment. Such interventions often cause more problems than they solve, such as wasteful use of resources and an over-concentration of resources, via so-called rent-seeking in the subsidised industry or sector, at the expense of more potentially efficient firms and sectors. In other cases, particularly in coastal zones, uncoordinated land use planning and development policies are implemented, with severe environmental damage impacts or risks.
Policy and institutional weaknesses are commonplace but are caused by the characteristics of the political setting in a country, by the legal and policy environment, the administrative and organisational aspects of resource management, and by limited human skill resources (World Bank, 1995). In Africa, for example, political instability in many countries has inhibited the creation of appropriate institutional settings necessary for environmental management generally and ICZM in particular.
A weak system of environmental regulation has meant that environmental codes and regulations to offset the environmental consequences of urbanisation for example, have only recently emerged in countries like Ghana, Nigeria, S. Africa and Tanzania. Similar laws regulating access to and use of coastal resources have yet to be developed in many other countries. Lack of enforcement of policy and regulations compound these issues. A number of countries are constrained by inadequate surveillance staff and budget resources and by a lack of accountability. Offshore fishing resources provide a stark example of the dangers of the lack of monitoring and regulation arrangements. Most coastal nations in Africa have been unable to effectively monitor the activities of foreign vessels in their exclusive economic zones because of the high cost of establishing and maintaining a surveillance and monitoring system. Mauritania was given donor assistance of US$ 7.5 million in 1987 to set up such a system. This system also requires an annual servicing investment of US$ 1.8 million. The combined cost puts such systems beyond the domestic financing capability of many small developing nations.
The lack of effective monitoring systems has resulted in a loss of economic rent to the coastal nations. Fees collected from licensing vessels do not typically reflect the value of fish harvested. To take just one example, during 1969-90 foreign vessels harvested hake valued at US$ 4.5 billion from Namibia’s exclusive zone, but the country received only US$ 180,000 (0.004 percent) in economic rent (World Bank, 1995). The economic rent loss has been compounded by over-fishing losses caused by the unregulated activities of foreign fishing vessels. Thus foreign vessels took 80 percent of the total biomass of hake in Namibia’s exclusive economic zone, a level well beyond the maximum sustainable yield for this fishery. Namibia was only able to reverse this situation when it introduced more effective management systems based on catch quotas, on-ship observers and foreign fleets exclusion orders.
Less than stringent enforcement of existing lav\s and of traditional resource usage rights has had negative implications for the management and conservation of fisheries, mangrove forests and wetlands in coastal Africa. Such resources usually come under the increasingly ineffectual legal jurisdiction of local or state authorities which treat them as open access resources. But the traditional user rights and licensing schemes which have historically provided controlled access to these resources have been put under severe strain by high population growth, urbanisation, unemployment and in-migration trends in coastal zones.
The legislation that is supposed to guide or constrain this and other forms of intervention in coastal zones is often contradictory and insufficiently comprehensive to respond adequately to the complex relationships that exist (OECD, 1993a, b). This ‘policy intervention failure’ is common even in the industrialised OECD countries.
- 3 8 -
Because coastal zones provide multiple goods and services, many stakeholders and agencies operate in these zones in furtherance of their own particular interests. The lack of co-ordinated policies and ineffective coastal management policies has merely served to compound land use conflicts among the various interested parties. The results has been increasing levels of resource degradation and loss which an OECD study has catalogued in case studies covering Australia, Izmir Bay, Portugal, South East Tasmania and Turkey and the Aveiro estuary (OECD, 1993b).
Policy conflict is a common outcome of multi-sector, multi-agency and multilevel government involvement in coastal zone management (OECD, 1993a). In the United States, for example, agricultural policy has contributed to the coastal eutrophication process, subsidised flood insurance has encouraged inefficient and potentially hazardous coastal development and redevelopment, and federal tax and resource development policies conflict with wetlands and other environmental resource conservation requirements. Coastal urban communities have displaced wetlands and added to the pollution loading of coastal waters
The plight of coastal zones can therefore be analysed in terms of a framework based on three interrelated ‘failures’ or deficiency phenomena (Turner and Jones, 1991). These ‘failures’, information deficiencies, policy intervention failures and economic market failures, have led to resource damage and losses and have constrained the effectiveness of management policies aimed at mitigating this damage. Unless these failures are properly addressed the current non-sustainable resource usage trends in coastal zones will not be reversed and losses will increase. The global change related threats impose a further set of pressures and impacts that management systems may have to respond to, if they are to avoid exacerbating existing ‘failures’ problems.
3.2.3 Information failure
At the core of the ‘failures’ dilemma is a problem of information, either the complete absence of data or inadequate data. Fundamentally, the interface between natural science research and models and social science research and models needs to be better defined and elaborated (Turner, 1991). There is a great variability in the quantity and quality of environmental data and other information which is available to assess the occurrence and possible impacts of accelerated sea level change and more frequent extreme events on the coastal zone at a regional level. In developing countries particularly it is also the case that sufficient data is not available on the nature and intensity of land use, the prevailing social and cultural conditions and on detailed economic development and coastal infrastructure patterns and levels of investment in threatened zones. There is an urgent need for greater ‘data compatibility’ both among different scientific disciplines and among different national agencies charged with data collection and interpretation.
Scientific uncertainties continue to shroud the scale and significance of potential combined sea level rise and storm event risks at the regional level. Existing knowledge about severe weather climatology and about the nexus between weather and its impacts are inadequate (Ryan, 1993). Some models (Emanuel, 1987) have suggested increased hurricane intensities as a result of higher sea surface temperatures. But in Australia, for example, interannual variations in tropical cyclone activity are dominated by Southern Oscillation (SO) effects (Holland et al., 1988). Uncertainty over SO predictions under climate change scenarios, however, means that cyclone behaviour prediction in the region remains an uncertain art. But the combined accelerated sea level rise and storm surge event is a potentially very significant threat. A im rise in sea level along the northern Australian coast will mean that the possibility of major storm surges from tropical cyclones rises by a factor of 4 at Darwin, and a factor of 13 at some other locations on the same coast. The same set of conditions could also mean that the return periods for major storm surges at some locations along the western Australian coast could fall from tens of thousands to hundreds of years.
Human interactions with extreme events determine whether these phenomena merely pose hazards or lead to major impacts (Burton et al., 1993; Blaikie et al., 1994). Thus a natural hazard is an extreme event that threatens human well-being, while a natural disaster is a natural hazard that overwhelms societal coping capabilities and therefore leads to a significant impact on society (Mitchell and Ericksen, 1992). On average, about 45 fully developed tropical cyclones occur globally each year. Approximately fifteen of these storms approach or cross the coastal zone and represent potential hazards. But only two or three of these inflict substantial losses and are recorded as natural disasters. Annual damages have been estimated at around US$ 1.5 billion, with a death toll of 15,000
- 39 -
or 23,000 lives (Smith, 1992; Bryant, 1991). Social and economic factors are major contributors to disasters. Coastlines that were once relatively free of artificial structures and other managed systems are now festooned with jetties, docks, seawalls and sand groynes.
If one of the results of global mean warming is an increase in cyclone frequency, or a southward shift of the frequency maxima, large sections of the Australian coast, for example, would become more vulnerable because of the urbanisation process that has proceeded without much control. The Insurance Council of Australia reports that insurance costs for ‘major disasters’ since 1967 averaged about AUS$ 50 million, but one event, cyclone Tracy, cost between AUS$ 600 - 700 million (Ryan, 1993). This is related to the landfall of storms on urban areas, rather than to the intensity of the storm.
A lack of co-ordination of the different resource uses and constraining policy regimes, together with inadequate knowledge of the dynamics of the coastal processes and systems has resulted in inadequate overall management of highly pressurised zones. The pressures have been added to and the negative resource impacts compounded by a further set of ‘market failures’.
When resource allocation decisions are made without the guidance of economic prices which reflect true resource scarcity due to the complete absence of prices or heavily distorted prices, they are prone to result in economic and environmental loss or damage. Many of the resources located in coastal zones provide important functions and services which do not carry appropriate price tags. The rapid loss of coastal wetlands is a classic example of this ‘failure’ situation. Even more generally a water imbalance problem has led inexorably to environmental degradation in the form of surface water pollution and groundwater contamination and depletion both inside and outside coastal zones. Taking dissolved oxygen as a proxy for overall water quality, average river quality during the 1980s declined in low-income countries, was static in middle income countries and rose only slightly in high- income countries (World Bank, 1992).
Surface water pollution is the result of the underpricing of the waste assimilative functions of rivers, estuaries and coastal waters and therefore the inappropriate disposal of a variety of household and industrial wastes into the water medium, causing the assimilative capacity to be breached. Groundwater loss, on the other hand, is more the result of compensatory behaviour exhibited by individuals suffering from an underprovision of water services. The proliferation of private wells in northern Jakarta, Indonesia, for example, has lowered the water table to such an extent that saline intrusion now affects a 10 km-wide zone along the cöastal plain. Over-pumping of groundwater has also led to land subsidence and asset damage in Jakarta and Bangkok, Thailand.
Existing regulatory instruments in coastal zone management systems therefore need to be augmented by economic incentive instruments with their ‘pricing’ effects. Some countries are moving in this policy direction with a tax de séjour in some tourist areas, transferable quotas for fish, fines for non-compliance with legislation, and the establishment of resource rentals for the occupation of water space.
3.2.4 Whose values count?
Economic values reflect individuals’ willingness-to-pay for benefits or their willingness-to-pay to avoid costs. Typically, the values that count belong to those actually exercising the choice: the current generation. But, it is a particular feature of environmental costs and benefits that they often accrue to generations yet to come. How are their values to be counted? This is the issue of intergenerational incidence of costs and benefits. Counting only the current generation’s preferences biases the choice against future generations unless there is some built-in mechanism to ensure that current generations choose on behalf of future generations and take their interests into account. This potential bias arises because future generations are not present to have their votes counted. Whether they are present or not, future gains and losses tend to be played down in economic decision making because of the practice of discounting. Discounting is the procedure whereby gains and losses to society are valued less the more distant they are in the future, a procedure designed to reflect the general observation that individuals simply prefer their benefits now and their costs later.
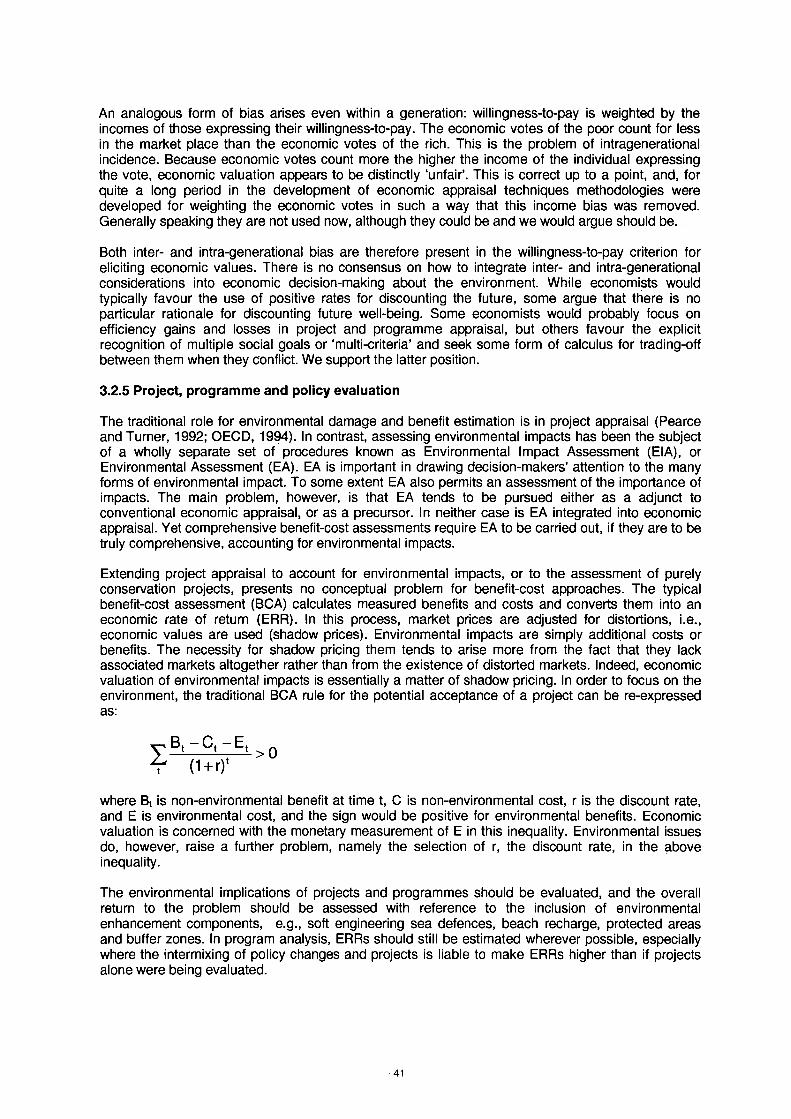
An analogous form of bias arises even within a generation: willingness-to-pay is weighted by the incomes of those expressing their willingness-to-pay. The economic votes of the poor count for less in the market place than the economic votes of the rich. This is the problem of intragenerational incidence. Because economic votes count more the higher the income of the individual expressing the vote, economic valuation appears to be distinctly ‘unfair’. This is correct up to a point, and, for quite a long period in the development of economic appraisal techniques methodologies were developed for weighting the economic votes in such a way that this income bias was removed. Generally speaking they are not used now, although they could be and we would argue should be.
Both inter- and intra-generational bias are therefore present in the willingness-to-pay criterion for eliciting economic values. There is no consensus on how to integrate inter- and intra-generational considerations into economic decision-making about the environment. While economists would typically favour the use of positive rates for discounting the future, some argue that there is no particular rationale for discounting future well-being. Some economists would probably focus on efficiency gains and losses in project and programme appraisal, but others favour the explicit recognition of multiple social goals or ‘multi-criteria’ and seek some form of calculus for trading-off between them when they conflict. We support the latter position.
3.2.5 Project, programme and policy evaluation
The traditional role for environmental damage and benefit estimation is in project appraisal (Pearce and Turner, 1992; OECD, 1994). In contrast, assessing environmental impacts has been the subject of a wholly separate set of procedures known as Environmental Impact Assessment (EIA), or Environmental Assessment (EA). EA is important in drawing decision-makers’ attention to the many forms of environmental impact. To some extent EA also permits an assessment of the importance of impacts. The main problem, however, is that EA tends to be pursued either as a adjunct to conventional economic appraisal, or as a precursor. In neither case is EA integrated into economic appraisal. Yet comprehensive benefit-cost assessments require EA to be carried out, if they are to be truly comprehensive, accounting for environmental impacts.
Extending project appraisal to account for environmental impacts, or to the assessment of purely conservation projects, presents no conceptual problem for benefit-cost approaches. The typical benefit-cost assessment (BCA) calculates measured benefits and costs and converts them into an economic rate of return (ERR). In this process, market prices are adjusted for distortions, i.e., economic values are used (shadow prices). Environmental impacts are simply additional costs or benefits. The necessity for shadow pricing them tends to arise more from the fact that they lack associated markets altogether rather than from the existence of distorted markets. Indeed, economic valuation of environmental impacts is essentially a matter of shadow pricing. In order to focus on the environment, the traditional BCA rule for the potential acceptance of a project can be re-expressed as:
where Bt is non-environmental benefit at time t, C is non-environmental cost, r is the discount rate, and E is environmental cost, and the sign would be positive for environmental benefits. Economic valuation is concerned with the monetary measurement of E in this inequality. Environmental issues do, however, raise a further problem, namely the selection of r, the discount rate, in the above inequality.
The environmental implications of projects and programmes should be evaluated, and the overall return to the problem should be assessed with reference to the inclusion of environmental enhancement components, e.g., soft engineering sea defences, beach recharge, protected areas and buffer zones. In program analysis, ERRs should still be estimated wherever possible, especially where the intermixing of policy changes and projects is liable to make ERRs higher than if projects alone were being evaluated.
-41
Within a programme the issue of choice of technology usually arises. A given development objective may be met by selecting among a range of technological options. The programme objective of treating effluent before discharge to coastal waters, for example, involves selection of processes that meet effluent quality and quantity standards at least cost. Whereas environmental considerations can require that the criterion be modified to become least social cost, i.e., inclusive of the environmental impacts of different treatment technologies (Case Study 2 in Section 4).
The ‘Polluter Pays Principle’ (PPP) requires that those emitting damaging wastes to the environment should bear the costs of avoiding that damage or of containing the damage to within acceptable limits according to national environmental standards. As stated, the PPP does not require that environmental damage be valued in monetary terms, although it could be. Whatever the cost of achieving the national standard, that cost should, in the first instance, be borne by the emitter of waste. That the emitter’s increased costs may then be passed on partly to the consumer is still consistent with the PPP. The costs bome by the emitter and the consumer can be thought of as a form of valuation. Regulatory agencies set standards on behalf of the voting population, and the cost of meeting those standards becomes, effectively, a minimum estimate of what the regulator regards the damage value to be. Nor is it essential for the general PPP to be implemented via taxation or some other form of ‘economic instrument’ such as tradable permit, product charge, and taxes and subsidies. The PPP is consistent with traditional standard setting via ‘command and control’ policies.
None the less, economic instruments have many attractions over command and control policies. If this approach is used then it is fundamental to their use that any charge or tax should be at least proportional to damage done. Valuation therefore becomes important in giving guidance to the setting of such environmental prices.
Policy changes should also be evaluated using the benefit-cost framework with special reference to environmental implications. The costs of implementing the policy can be compared with the benefits obtained from it.
3.2.6 Economic valuation and sustainable development
The need for economic valuation of environmental impacts and of environmental assets arises quite independently of the definition of sustainable development. Simply pursuing efficient policies and investing in efficient projects and programmes requires valuation to be pursued as long as it is credible. At the most general level of intergenerational concern, valuation is still required. If transfers of resources are to be made between generations, with the current generation sacrificing for the future, or future benefits being lost for the sake of present gain, then it is essential to know what is being sacrificed and how much it is that is being surrendered. It is not necessary, therefore, to invoke the philosophy of sustainable development, however it is defined, to justify a focus on economic valuation in a development context.
However, if one or more definitions of sustainable development are to be espoused, the role of economic valuation needs to be investigated. An efficient use of resources need not be a sustainable one. The optimal rate at which an exhaustible resource should be depleted, for example, still requires that the rate of use is positive. In the absence of repeated discoveries of further identical resources, the resource must be exhausted eventually. Every unit of use today is at the cost of a forgone unit tomorrow. Global warming is another example of an activity that impairs the welfare of future generations. ‘Sustainability’ therefore implies something about maintaining the level of human wellbeing so that it might improve but at least never declines more than temporarily. Interpreted this way, sustainable development becomes equivalent to some requirement that well-being does not decline through time. The implication for valuation is now somewhat different to what is implied by consideration of efficiency alone. It now becomes necessary to measure human well-being in order to establish that it does not decline through time, and since environmental assets contribute to wellbeing it is necessary to measure preferences for and against environmental change.
If the focus is on the conditions for achieving sustainable development, then it may be that wholly non-economic indicators will suffice. For example, computations of the carrying capacity of natural environments could act as early warnings of non-survivability. Other physical measures could include assessments of the rate of resource use relative to the rate of resource regeneration and the rate of waste emissions relative to the assimilative capacity of the environment. Therefore, it may be that
- 42 -
some light will be shed on sustainability indicators by non-economic approaches, especially if they can be developed to include other measures of stress and shock to underlying natural resource systems.
The literature on environmental economics tends to suggest that the clues to sustainability lie in the quantity and quality of a nation’s capital stock. Part of the intuition here is that nations are like corporations. No corporation would regard itself as sustainable if it used up its capital resources to fund its sales and profits expansion. As long as capital assets are at least intact, and preferably growing, any profit or income earned can be regarded as ‘sustainable’. On this analogy nations are no different. Sustainable growth and development cannot be achieved if capital assets are declining.
But how is the capital stock to be measured? For some economies heavily dependent on one or two natural resources it may be possible to use a physical indicator of reserves or available stocks. But for the vast majority of them it will be necessary to find a measuring rod for capital. Typically that means money units, i.e., it becomes necessary to value capital, including environmental capital. Valuation and sustainable development are again intricately linked. How important is this link depends in large part on how likely unsustainable development paths are, and, of course, on the value judgement that sustainability ‘matters’.
3.3 Economic Valuation Issues
In order to make choices between competing wants, democratic societies use two fundamental decision making rules. The first, the Majority Voting Rule, does not take into account the strength of a persons’ preferences. A second rule is therefore one where ‘benefits exceed costs’. Economists look at this decision rule in terms of changes in the well-being or welfare of individuals as described by their ‘utility’ or ‘preference satisfaction’. Because human well-being is rather an intangible concept that cannot be directly measured, economists use a transformation of well-being into a more general, single scale numeraire. For a gain in an individual’s well-being, it is proposed that the change be measured by the maximum amount of goods or services - or money income - that they would be willing to give up or forego in order to obtain the change. Alternatively, if the change reduces wellbeing, it would be measured by the amount of money that the individual would require in compensation in order to accept the change.
This ‘economic approach’ involves the monetary valuation of changes in environmental quality. The task of monetary valuation of the environment is made more complex by a number of problems. These include the fact that environmental effects will often have no natural units of measurement, and even where physical indices are available these must be related to individuals’ perceptions. Also, environmental effects do not often directly show up in markets due to their externality and public good characteristics. Finally, the forecasting of environmental effects is complicated by the fact that they involve biochemical and biophysical feedbacks which are scientifically not fully understood.
3.3.1 Total economic value
The monetary measure of a change in an individual’s well-being due to a change in environmental quality is called the Total Economic Value of the change in the environmental quality. It is not environmental quality, per se, that is being measured, but people’s preferences for changes in that quality. Valuation, as such, is anthropocentric, in that it is of preferences held by people, and, the value of something is established by an exchange transaction. The sum of willingness to pay, or total economic value, for all the individuals affected by an action, is given by the area under the demand curve of the good or service that is affected.
Total Economic Value of a resource can be disaggregated into constituent parts consisting of Use Value (UV) and Non-Use Value (NUV). Use values can be:
• direct (DUV), such as where an individual makes actual use of a facility, for example visiting a recreation area to go fishing, and is willing to pay for this use;
• Indirect (IUV), such as where benefits are derived from ecosystem functions; and• option values (OV), which is an individual’s willingness to pay for the option of safeguarding a
facility, such as the already mentioned recreation area, for use at some future date.
- 4 3 -
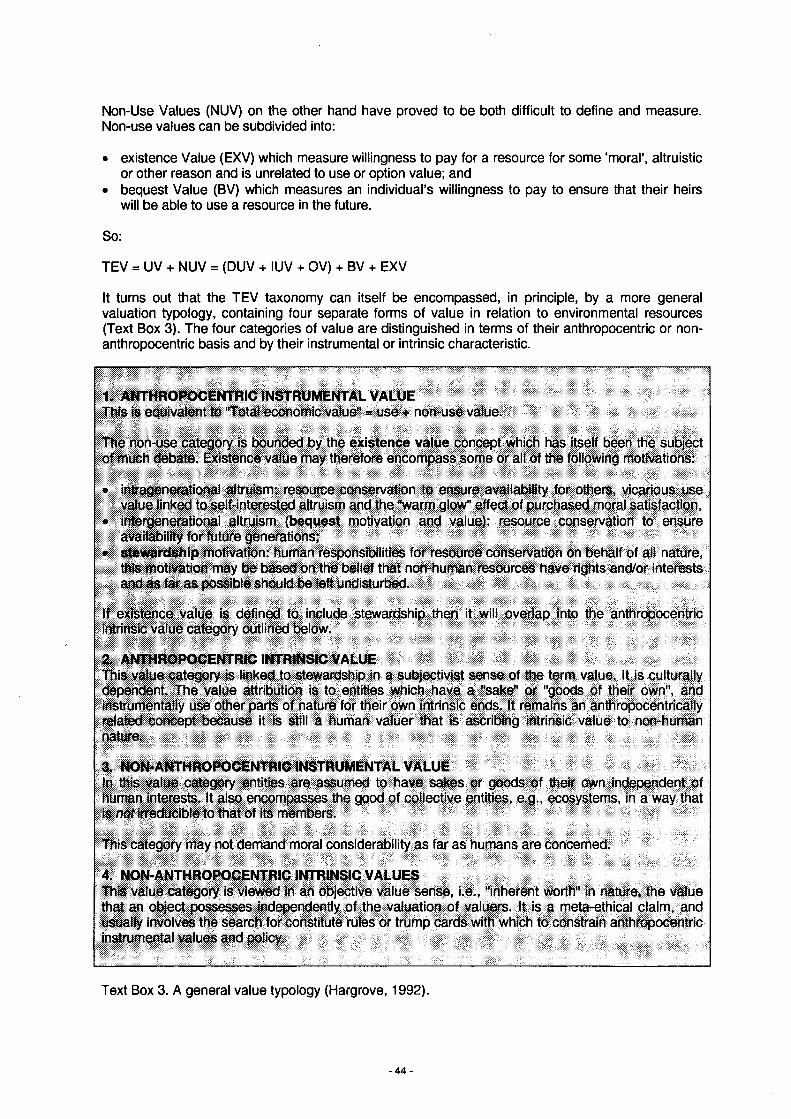
Non-Use Values (NUV) on the other hand have proved to be both difficult to define and measure. Non-use values can be subdivided into:
• existence Value (EXV) which measure willingness to pay for a resource for some ‘moral’, altruistic or other reason and is unrelated to use or option value; and
• bequest Value (BV) which measures an individual’s willingness to pay to ensure that their heirswill be able to use a resource in the future.
So:
TEV = UV + NUV = (DUV + IUV + OV) + BV + EXV
It turns out that the TEV taxonomy can itself be encompassed, in principle, by a more generalvaluation typology, containing four separate forms of value in relation to environmental resources (Text Box 3). The four categories of value are distinguished in terms of their anthropocentric or non- anthropocentric basis and by their instrumental or intrinsic characteristic.
1. ANTHROPOCENTRIC INSTRUMENTAL VALUEThis is equivalent to "Total economic value" » use + non-use value.
Ute non-use category is bounded by the existence value concept which has itself been the subject of much debate. Existence value may therefore encompass some or ali of the following motivations:
• intragenerational altruism: resource conservation to ensure availability for others, vicarious use value linked to self-interested altruism and the "warm glow" effect of purchased moral satisfaction,
• intergenerational altruism (bequest motivation and value): resource conservation to ensure availability for future generations;
• stewardship motivation: human responsibilities for resource conservation on behaif of ail nature, this motivation may be based on the belief that non-human resources have rights and/or interests and as far as possible should be left undisturbed.
If existence value is defined to include stewardship then it will overlap into the anthropocentric intrinsic value category outlined below.
2. ANTHROPOCENTRIC INTRINSIC VALUEThis value category is linked to stewardship in a subjectivist sense of the term value. It is culturally dependent The value attribution is to entities which have a "sake" or “goods of their own", and instrumentaily use other parts of nature for their own intrinsic ends. It remains an anthropocentrically related concept because it is still a human valuer that is ascribing intrinsic value to non-human nature.
3. NON-ANTHRQPOCENTR1C INSTRUMENTAL VALUEIn this value category entities are assumed to have sakes or goods of their own independent of human interests. It also encompasses the good of collective entities, e.g., ecosystems, in a way that is oof irreducible to that of its members.
This category may not demand moral considerability as far as humans are concerned.
4. NON-ANTHROPOCENTRIC INTRINSIC VALUESThis value category is viewed in an objective value sense, i.e., "inherent worth" in nature, the value that an object possesses independently of the valuation of valuers. It is a meta-ethical claim, and usually involves the search for constitute rules or trump cards with which to constrain anthropocentric instrumentai values and policy.
Text Box 3. A general value typology (Hargrove, 1992).
Existence value, as variously defined, overlaps with anthropocentric instrumental value and anthropocentric intrinsic value categories (Text Box 3). As one crosses this philosophical boundary the conventional economic notions of utility and welfare cease to always retain their ‘accepted’ relationship, i.e., if welfare is increased, utility increases. Total environmental value (TV) is not therefore necessarily equivalent to TEV. The extent of the overlap between these value systems depends on the specific worldview one adopts prior to the valuation exercise.
The typology distinguishes between two types of instrumental value and two types of intrinsic value in nature. Both forms of instrumental value are not in themselves controversial, but a substantial debate has been in progress for some time over the meaning and significance of intrinsic value in nature (Turner et ai, 1994; Turner and Pearce, 1993; Pearce, 1994). Instrumental values are relative and usually linked to individuals and their preferences or needs (category 1 in Text Box 3). The economic implication is therefore, that if more biodiversity conservation, for example, is chosen, then the opportunity to satisfy other preferences or needs is foreclosed. So all resource allocation policy decisions incur opportunity costs in terms of foregone alternative options. Thus the instrumental value of biodiversity is not absolute, it is relative and as such can be balanced in a cost-benefit assessment against other ‘good’ things or ‘worthy’ causes that individuals may want to use or support.
Some environmental philosophers (bioethicists) have usually interpreted intrinsic value as “inherent worth” (category 4 in Text Box 3) and as such completely separate from the human-environment valuation relationship. According to this position non-human biota and perhaps even nonsentient things, have moral interests or rights to existence. An extreme version of bioethics would make environmental rights absolute and therefore not open to trade-offs on the basis of a “deep ecology” meta-ethical principle (Rolston, 1988).
It is not, however, necessary to ascribe absolute value to environmental conservation in order to provide more safeguards against biodiversity and other environmental loss than currently exist. Such extra safeguards could be justified in terms of “Q-altruism” motivations (value category 2 in Text Box 3) (Randall, 1991; Randall and Stoll, 1983). Here moral principles recognising the “interests” of nonhuman species and their supporting habitats could be used to buttress a case for extra, but not unlimited, sacrifices incurred to better safeguard biodiversity. The values expressed are still anthropocentric but relate to intrinsic qualities in nature.
3.3.2 Existence value and its measurement
Existence value derives from individuals who feei a benefit from just knowing that a particular species, habitat or ecosystem does exist and will continue to exist somewhere on the planet. Numerous debt-for-nature swaps have been agreed. Table 9 sets out information on actual debt-for- nature swaps and computes the implicit prices. It is not possible to be precise with respect to the implicit prices since the swaps tend to cover not just protected areas but education and training as well. Moreover, each hectare of land does not secure the same degree of ‘protection’ and the same area may be covered by different swaps. The estimates are based on a 10 year horizon in order to compute present values whereas the swaps in practice have variable levels of annual commitment (Pearce, 1993).
A number of writers also seem to agree that existence value can only be ‘directly’ measured by survey methods, such as contingent valuation. Since existence values involve neither personal consumption of derived products nor in situ contact, economists have used a special structure of preferences to model existence value. They have assumed either so-called “weak separability” or “strong separability” between the non-market good that is the subject of existence value and market goods. When preferences take these forms, the non-market good cannot be identified via conventional market demand theory and analysis. Existence value of the non-market good cannot therefore be measured by indirect observation of individual’s behaviour and the only option is direct questioning via surveys.
Larson (1993) has questioned some of this consensus thinking and, in particular, argues that in a number of real world choice situations neither “weak” nor “strong” separability assumptions are very realistic. Instead it is likely, in a number of situations, that changes in the level of the public good will give rise to existence value that is traceable, in principle, from observed changes in behaviour, spending money and time in reading about or protesting in some way about the environmental
- 4 5 -
change such as species or habitat loss or degradation. It remains to be seen whether valuation techniques other than contingent valuation can adequately capture aspects of existence value. Some economists and many non-economists also question whether in practice contingent valuation methods can yield reliable measures of existence value. The methods are both expensive and demanding on researchers if acceptable reliability and validity testing protocols are to be achieved.
Bequest motivations, underpinned by an intergenerational equity concern, would add further support to biodiversity conservation enhancement. According to some analysts, both existence and bequest value could be better conserved by the adoption of the principle of a safe minimum standard, a sufficient area of habitat to be conserved to ensure the continued provision of ecological functions and services, at the ecosystem “landscape” level, unless the social costs of doing so are ‘unacceptably’ high (Perrings and Pearce, 1994). A further principle, the precautionary principle, would, if adopted, ensure the recognition of bequest motivations and value. In essence, this principle states that the opportunity set for future generations can only be assured if the level of biodiversity they inherit is no less than that available to present generations. Some sort of ‘inheritance’ is passed, ‘intact’, across time. This bequest will take the form of a stock of human, physical and natural capital.
In summary, it has been argued that the motivations behind nonuse value are some combination of: individuals perceived benefits: altruism towards friends, relatives or others who may be users (use value), altruism towards future generations of users (bequest value), and altruism toward non-human nature in general (existence value) (Text Box 3). But several questions remain to be fully answered, including:
• what precisely is meant by altruistic motives and behaviour; and• which values are instrumental and which could be intrinsic?
A full picture of the mutually exclusive set of motivations underlying individual preferences for environmental goods is not yet available.
The largely philosophical debate over the need for, and composition of, an adequate environmental ethic has become rather sterile. This is the case because the discussion has focused on instrumental value (category 1 in Text Box 3) versus non-anthropocentric intrinsic value (category 4) in nature,i.e., relative versus absolute valuations. In the real world of pragmatic policy making the instrumental-intrinsic distinction is only usefully maintained if it is interpreted solely in a human centred manner. Thus, a case for environmental conservation should be supported not only on the grounds of the significant amount of human instrumental value that is at stake, but also because this allows society to set resources aside and exempt them from use (Turner, 1993). According to Hargrove (1992) this would reflect “our desire as individuals, as a society, and as a historically evolved culture to value some things noninstrumentally and to set them aside and protect them from exploitation”.
- 46 -
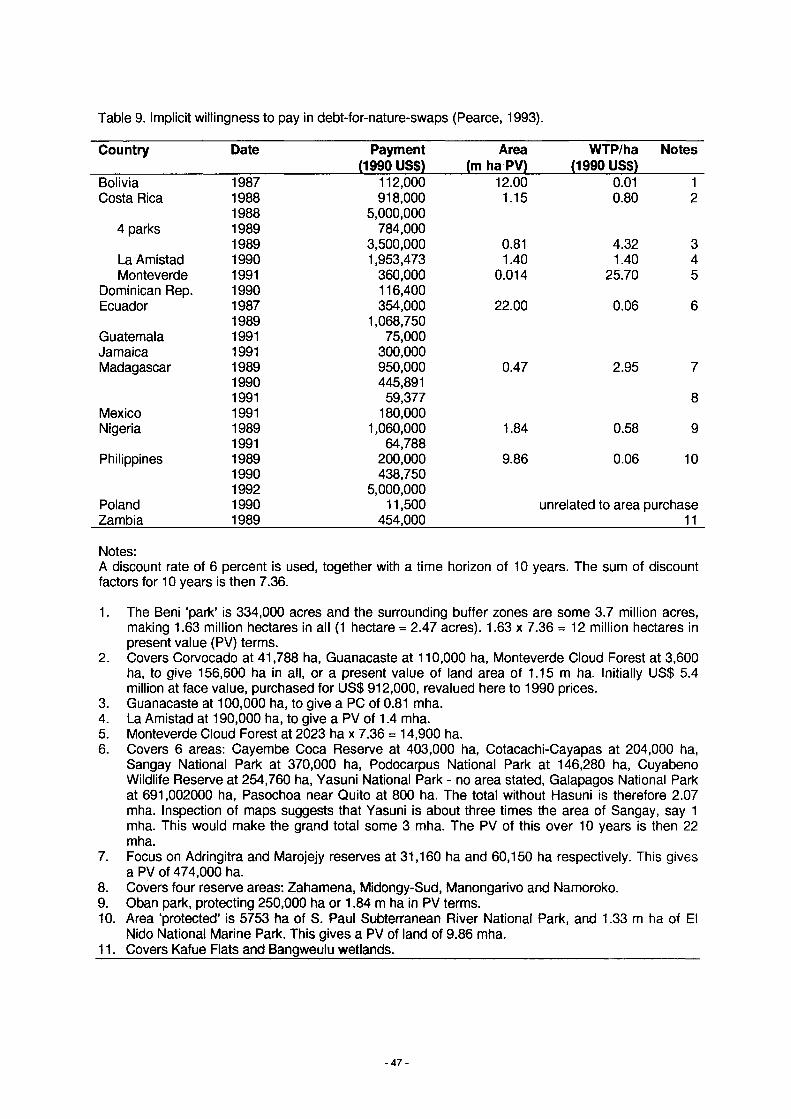
Table 9. Implicit willingness to pay in debt-for-nature-swaps (Pearce, 1993).
Country Date Payment (1990 US$)
Area (m ha PV)
WTP/ha (1990 US$)
Notes
Bolivia 1987 112,000 12.00 0.01 1Costa Rica 1988 918,000 1.15 0.80 2
1988 5,000,0004 parks 1989 784,000
1989 3,500,000 0.81 4.32 3La Amistad 1990 1,953,473 1.40 1.40 4Monteverde 1991 360,000 0.014 25.70 5
Dominican Rep. 1990 116,400Ecuador 1987 354,000 22.00 0.06 6
1989 1,068,750Guatemala 1991 75,000Jamaica 1991 300,000Madagascar 1989 950,000 0.47 2.95 7
1990 445,8911991 59,377 8
Mexico 1991 180,000Nigeria 1989 1,060,000 1.84 0.58 9
1991 64,788Philippines 1989 200,000 9.86 0.06 10
1990 438,7501992 5,000,000
Poland 1990 11,500 unrelated to area purchaseZambia 1989 454,000 11
Notes:A discount rate of 6 percent is used, together with a time horizon of 10 years. The sum of discountfactors for 10 years is then 7.36.
1. The Beni ‘park’ is 334,000 acres and the surrounding buffer zones are some 3.7 million acres, making 1.63 million hectares in all (1 hectare = 2.47 acres). 1.63 x 7.36 = 12 million hectares in present value (PV) terms.
2. Covers Corvocado at 41,788 ha, Guanacaste at 110,000 ha, Monteverde Cloud Forest at 3,600 ha, to give 156,600 ha in all, or a present value of land area of 1.15 m ha. Initially US$ 5.4 million at face value, purchased for US$ 912,000, revalued here to 1990 prices.
3. Guanacaste at 100,000 ha, to give a PC of 0.81 mha.4. La Amistad at 190,000 ha, to give a PV of 1.4 mha.5. Monteverde Cloud Forest at 2023 ha x 7.36 = 14,900 ha.6. Covers 6 areas: Cayembe Coca Reserve at 403,000 ha, Cotacachi-Cayapas at 204,000 ha,
Sangay National Park at 370,000 ha, Podocarpus National Park at 146,280 ha, Cuyabeno Wildlife Reserve at 254,760 ha, Yasuni National Park - no area stated, Galapagos National Park at 691,002000 ha, Pasochoa near Quito at 800 ha. The total without Hasuni is therefore 2.07 mha. Inspection of maps suggests that Yasuni is about three times the area of Sangay, say 1 mha. This would make the grand total some 3 mha. The PV of this over 10 years is then 22 mha.
7. Focus on Adringitra and Marojejy reserves at 31,160 ha and 60,150 ha respectively. This gives a PV of 474,000 ha.
8. Covers four reserve areas: Zahamena, Midongy-Sud, Manongarivo and Namoroko.9. Oban park, protecting 250,000 ha or 1.84 m ha in PV terms.10. Area ‘protected’ is 5753 ha of S. Paul Subterranean River National Park, and 1.33 m ha of El
Nido National Marine Park. This gives a PV of land of 9.86 mha.11. Covers Kafue Flats and Bangweulu wetlands.________________________________________
- 4 7 -
3.3.3 Limits to valuation
When the value of whole environmental systems is considered, the conventional economic valuation may not be sufficient. What is needed is to assess and conserve the structural and functional value of ‘healthy’ evolving ecosystems, despite the formidable uncertainties surrounding likely thresholds for system change. The fundamental life support services provided by a ‘healthy’ ecosystem have a ‘prior1 value in the sense that the continued existence of this system ‘integrity’ determines the flow of all the instrumental and intrinsic values connected to components of the system. A rough approximation of the significance of this ‘primary’ ecosystem value may be indirectly gained by deployment of ‘damage avoidance’, ‘substitute service’ or ‘replacement cost’ methods (Gren et al., 1994; Turner and Pearce, 1993).
Recent advances in the development of ecological economic models and theory all seem to stress the importance of the overall system, as opposed to individual components of that system. This points to another dimension of total environmental value, the value of the system itself. The economy and the environment are now jointly determined systems linked in a process of coevolution, with the scale of economic activity exerting significant environmental pressure. The dynamics of the jointly determined system are characterised by discontinuous change around poorly understood critical threshold values. But under the stress and shock of change, the joint systems exhibit resilience, defined as the ability of the system to maintain its self-organisation while suffering stress and shock. This resilience capacity is however, related more to overall system configuration and stability properties than it is to the stability of individual resources.
The adoption of a systems perspective serves to re-emphasise the obvious but fundamental point that economic systems are underpinned by ecological systems and not vice versa. There is a dynamic interdependency between economy and ecosystem. The properties of biophysical systems are part of the set of constraints which bound economic activity. The constraints set has its own internal dynamics which react to economic activity exploiting environmental assets such as extraction, harvesting, waste disposal and non-consumptive uses. Feedbacks then occur which influence economic and social relationships. The evolution of the economy and the evolution of the constraints set are interdependent, ‘co-evolution’ is thus a crucial concept (Common and Perrings,1992).
Norton and Ulanowicz (1992) advocate a hierarchical approach to natural systems, which assumes that smaller subsystems change according to a faster dynamic than do larger encompassing systems, as a way of conceptualising problems of scale in determining biodiversity policy. For them, the goal of sustaining biological diversity over multiple human generations can only be achieved, if biodiversity policy is operated at the landscape level. The value of individual species, then, is mainly in their contribution to a larger dynamic, and significant financial expenditure may not always be justified to save ecologically marginal species. A central aim of policy should be to protect as many species as possible, but possibly not all.
Ecosystem health, defined as stability and resilience or creativity, is useful in that it helps focus attention on the larger systems in nature and away from the special interests of individuals and groups (Norton and Ulanowicz, 1992). The full range of public and private instrumental and noninstrumental values all depend on protection of the processes that support the health of larger-scale ecological systems. Thus when a wetland, for example, is disturbed or degraded, we need to look at the impacts of the disturbance on the larger level of the landscape. At this level a successful policy will encourage a patchy landscape.
The ‘integrity’ of an ecosystem is more than its capacity to maintain autonomous functioning, i.e., its health, but also relates to the retention of “total diversity, i.e., the species and interrelationships that have survived over time at the landscape level” (Norton, 1992). A number of ecological services and functions can be valued in economic terms, while others cannot because of uncertainty and complexity conditions. Taking wetlands as our example, these systems provide a wide array of functions, services and goods of significant value to society, storm and pollution buffering function, flood alleviation, recreation and aesthetic services, etc. We can therefore conceive of ‘valuing’ a wetland as essentially valuing the characteristics of a system, and we can capture these values in our TEV framework. But since it is the case that the component parts of a system are contingent on the
- 4 8 -
existence and continued proper functioning of the whole, then putting an aggregate value on wetlands and other ecosystems is quite a complicated matter.
Private economic values may not capture the full contribution of component species and processes to the aggregate life-support functions provided by ecosystems (Gren et al., 1994). Furthermore, some ecologists argue that some of the underlying structure and functions of ecological systems which are prior to the ecological production functions, cannot be taken into account in terms of economic values. Total Economic Value will therefore underestimate the true value of ecosystems. The prior value of the ecosystem structure has been called ‘primary value’ and consists of the system characteristics upon which all ecological functions depend (Turner and Pearce, 1993). Their value arises in the sense that they produce functions which have value, secondary value. The secondary functions and values depend on the continued ‘health’, existence, operation, and maintenance of the ecosystem as a whole.
The primary value notion is related to the fact that the system holds everything together, and is thus also referred to as a ‘glue’ value, and as such has, in principle, economic value. Thus the Total Value of the ecosystem exceeds the sum of the values of the individual functions (Turner and Pearce,1993). It can also be argued that a healthy ecosystem contains an ecological redundancy capacity and there is thus an ‘insurance’ value in maintaining the system at some ‘critical’ size in order to combat stress and shocks over time. This argument is related to a so-called quasi-option value which, for example, about the usefulness of ecosystem components, is based on the idea that information will accrue over time and therefore irreversible policy decisions should be avoided as far as practicable. Quasi-option value is, however, not additive to the other components of TEV and is therefore another reason why TV and TEV are not necessarily equivalent.
3.3.4 Conclusions on valuation issues
To summarise the social value of an ecosystem may not be equivalent to the aggregate private totaleconomic value of that same system components, because of the following factors:
• The full complexity and coverage of the underpinning ‘life-support’ functions of healthy evolving ecosystems is currently not precisely known in scientific terms. A number of indirect use values within systems therefore remain to be discovered and valued. A healthy ecosystem also contains a redundancy reserve, a pool of latent keystone species and processes which are required for system maintenance in the face of stress and shock. This is the quasi-option value notion.
• The range of secondary values that can be instrumentally derived from an ecosystem is contingent on the prior existence of such a healthy and evolving system, there is, in a philosophical sense, a ‘prior value’ that could be ascribed to the system itself. Such a value would, however, not be measurable in conventional economic terms and is non-commensurate with the secondary values of the system.
• The continued functioning of a healthy ecosystem is more than the sum of its individual components. There is a sense in which the operating system yields or possesses ‘glue’ value related to the structure and functioning properties of the system which hold everything together.
3.4 Economic Valuation Techniques
This section draws heavily on Turner et al. (1994), and outlines the techniques which attempt to quantify the issues set out above.
Figure 13 illustrates one way in which the various approaches and methods of monetary valuation can be classified, in the context of environmental resources. Two basic approaches are distinguished, those which value a commodity via a demand curve and those which do not and therefore fail to provide ‘true’ valuation information and welfare measures. These latter methods are, however, still useful heuristic tools in any cost-benefit appraisal of projects, policies or courses of action (Turner et al., 1994).
- 4 9 -
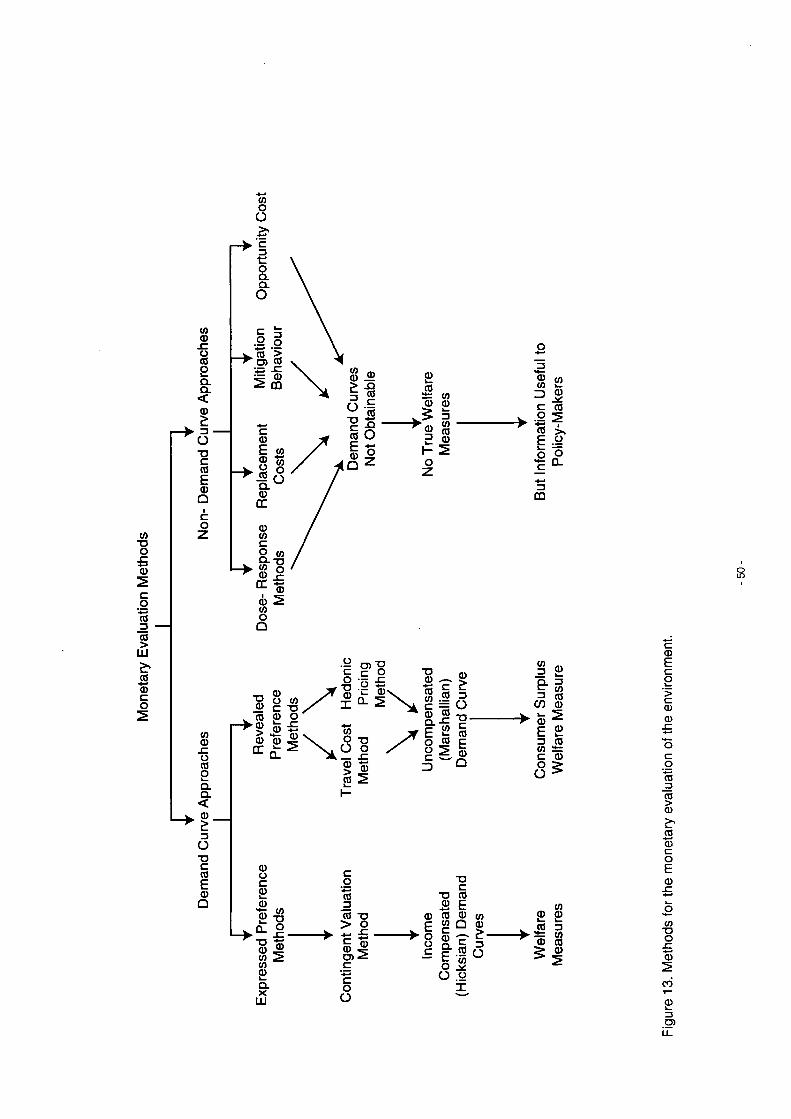
Mon
etar
y Ev
alua
tion
Met
hods
00-CO02Q.Q.<0£► D -O"ÖC05E0 û1cO
0 0
00szo0Oû.Q_<
. 0 _
£DO"DC0E0D
“O00
► 0
O'c0“O01
0 XO 0 /C - o /0 o_r*C 0 i:
0 0 * V O \ ü
0OC20•4—0
T30000i—Û.XLU
0TJO-C ■4—»0
O) “g .E o o■C 0
“D0
■C 0 \
s0>0
0
CO‘■4—»0J30> “OOx:0 * c’-I—'coO
0 S0 .SS c =g. 5E 2 o ®
0£DOT3-C0E0
T3C
T5 0 0 £0 0 0 0
8 g. s iC c .S? oS 0 oO o
I
s £9 -3C/) 0
-► ¡D 20 E £13 0 0 2= C 0
O
0 0 0
- > l î 5 ^ 0 0 ^ a>
Figur
e 13
. Me
thod
s for
the
mon
etar
y ev
aluat
ion
of the
en
viro
nmen
t.
The dose-response approach requires the existence of data linking human, plant or animal physiological response to pollution stress. If, for example, a given level of pollution is associated with a change in output, then it is usually the case that the output can be valued at market or shadow prices. But for situations involving human health, complex questions relating to the value of a human life have to be addressed. Strictly speaking, analysts seek to value the increased risk of illness or death.
The replacement cost technique examines the cost of replacing or restoring a damage asset and uses this cost as a measure of the benefit of restoration, for example, the costs of restoring a damaged beach and sand dune complex. But application of this technique does require careful thought. It is a valid approach in situations where it is possible to argue that the remedial work must take place because of some other constraint. For example, where there is a beach safety and water quality standard that is mandatory, in an estuary or a bay, for example, then the costs of achieving that standard are a proxy for the benefits of reaching the standard.
Another situation where the replacement cost approach is valid would be where there is an overall constraint such as a ‘sustainability constraint’, not to let environmental quality decline. Wetland ecosystems, for example, have been heavily depleted across the globe and are now ‘protected’ by an international convention, the Ramsar Convention. In these circumstances, wetland replacement costs such as restoration elsewhere in a region, wetland relocation, or new wetland creation, might be allowable as a first approximation of the benefits of future wetland conservation, or wetland loss. The so-called shadow project approach relies on such constraints. It argues that the cost of any project designed to restore an environment, because of a sustainability constraint, is then a minimum valuation of the damage done.
Mitigation behaviour, in terms of avertive expenditures, can sometimes be observed in the pollution context. Householders may purchase flood proofing measures to ‘defend’ their homes from storm flooding, as a substitute for a reduction in the flood risk.
In the opportunity cost approach no direct attempt is made to value environmental benefits. Instead, the benefits of the activity causing environmental degradation, such as drainage of a wetland to allow intensive agriculture - are estimated in order to set a benchmark for what the environmental benefits would have to be for the development not to be worthwhile. While this is not a valuation technique, it has proved to be a very useful aid to decision-makers. For example, much of the recent loss of wetlands in Europe due to the operation of the Common Agricultural Policy represents a socially inefficient result because of the heavily subsidised nature of the drainage investments and arable crops that replaced the wetland. Such conversions have now all but ceased as subsidies have been withdrawn or lowered.
There are two basic types of demand curve evaluation. Firstly, demand can be measured by examining individuals’ stated, or expressed, preferences for environmental goods elicited via questionnaires. Secondly, demand can be revealed by examining individuals’ purchase of market priced goods which are necessary in order to enjoy associated environmental goods.
3.4.1 Travel Cost Method
The travel cost method (TCM), which is a revealed preference method, can be used to estimate demand curves for recreation sites and thereby value of those sites. The underlying assumption of the TCM is a simple one, that the incurred costs of visiting a site. On-site questionnaires are used to ask visitors at the gate or car park of the recreational sites where they have travelled from, what are their travel costs and what is their income level. From visitors’ responses, we can estimate their travel costs and relate this to the number of visits per year. Not surprisingly, this relationship generally shows a typical downward sloping demand curve relationship between the cost of a visit and the number of visits taken. People living a considerable distance from a recreational site facing high travel costs make fewer visits per year, while those living near the site, with low travel costs, tend to make more frequent visits.
Of course, other factors than just travel cost can affect how often people visit a site. For example, if we compare two individuals with different incomes, living the same distance from a site and facing identical travel costs we would not be surprised if the richer individual made more visits than the
-51 -
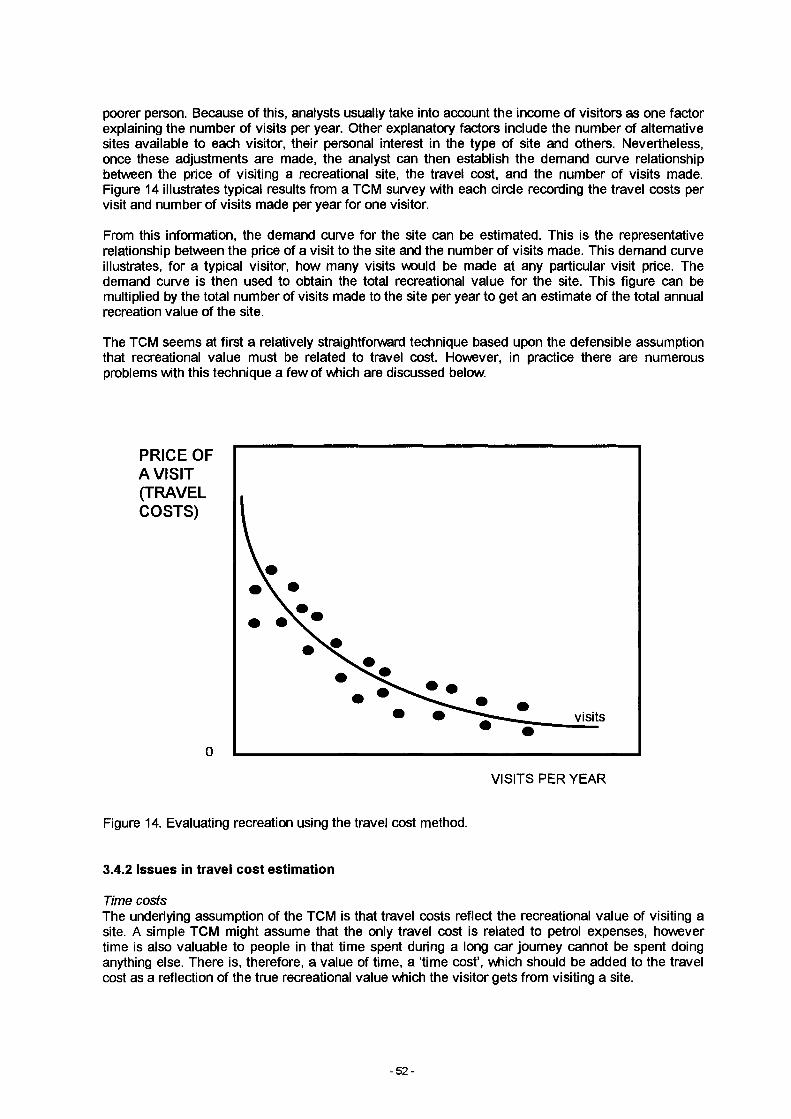
poorer person. Because of this, analysts usually take into account the income of visitors as one factor explaining the number of visits per year. Other explanatory factors include the number of alternative sites available to each visitor, their personal interest in the type of site and others. Nevertheless, once these adjustments are made, the analyst can then establish the demand curve relationship between the price of visiting a recreational site, the travel cost, and the number of visits made. Figure 14 illustrates typical results from a TCM survey with each circle recording the travel costs per visit and number of visits made per year for one visitor.
From this information, the demand curve for the site can be estimated. This is the representative relationship between the price of a visit to the site and the number of visits made. This demand curve illustrates, for a typical visitor, how many visits would be made at any particular visit price. The demand curve is then used to obtain the total recreational value for the site. This figure can be multiplied by the total number of visits made to the site per year to get an estimate of the total annual recreation value of the site.
The TCM seems at first a relatively straightforward technique based upon the defensible assumption that recreational value must be related to travel cost. However, in practice there are numerous problems with this technique a few of which are discussed below.
PRICE OF A VISIT (TRAVEL COSTS)
VISITS PER YEAR
Figure 14. Evaluating recreation using the travel cost method.
3.4.2 Issues in travel cost estimation
Time costsThe underlying assumption of the TCM is that travel costs reflect the recreational value of visiting a site. A simple TCM might assume that the only travel cost is related to petrol expenses, however time is also valuable to people in that time spent during a long car journey cannot be spent doing anything else. There is, therefore, a value of time, a ‘time cost’, which should be added to the travel cost as a reflection of the true recreational value which the visitor gets from visiting a site.
- 5 2 -
Thus, ignoring time costs is generally believed to lead to a significant underestimate of the recreational value which people obtain from visiting a site. However, what is the value of time? Can we put a price on an hour spent in a car? There have been many attempts to estimate a value of time, for example, by comparing the travel time of differing methods of commuting to work with the costs of those differing measures. However, no real consensus has yet been achieved. A further complication is that many people enjoy travelling, for them the journey to a recreational site is not a cost and may even be a benefit. In such cases the time benefit of the journey must be subtracted from travel costs. In this example, travel costs may overestimate the recreational value of sites.
Multiple visit journeysIf an individual visits several sites during a single day’s journey, but is asked to answer a TCM questionnaire at one of them, how should analysts apportion the visitor’s travel costs? During the day the visitor may have incurred high travel costs, however, only a portion of these reflect the recreational site in question. Conventionally analysts have tried to use a percentage of the day’s total travel costs, sometimes asking the visitor to set that percentage. However, the margin for error in this estimate is uncertain.
Substitute sitesOne visitor may travel 20 km to visit a site which they particularly enjoy whereas another who has comparatively little enthusiasm for the site may travel the same distance from another direction simply because there is no other available site near their home. Using the simple TCM approach would yield the result that both visitors held the same recreational value for the site, which is clearly incorrect. Some analysts have tried to allow for this by asking visitors to name alternative sites. Again, this is both statistically complex and open to error.
House purchase decisionIt may well be that those who most value the recreational attributes of various sites will choose to buy houses near those sites. In such cases, they will incur relatively low travel costs visiting the sites they value most highly. Hence travel cost will be a gross underestimate of recreational value. Interestingly, although this problem has been recognised for many years, few analysts have attempted to include this factor in their questionnaires.
Non-paying visitorsTCM studies often omit any visitors who have not incurred travel costs to reach the site such as those who have walked from nearby homes. However, this group may well put a very high value on the site.
In summary then, the TCM is grounded upon a simple and well-founded assumption that travel costs reflect recreational value. It allows us to estimate a demand curve and thereby recreational value. In practice, however, there are a number of application problems which need to be addressed before we can accept monetary evaluations produced by this technique.
3.4.3 Hedonic price method
The hedonic price method (HPM) attempts to evaluate environmental services, the presence of which directly affects certain market prices. In practice, by far the most common application of HPM is to the property market. House prices are affected by many factors: number of rooms, size of garden, to workplace, etc. One such important factor is local environmental quality. If we can control for the non-environmental factors, such as by examining houses with the same number of rooms, similar garden size and similar accessibility, then any remaining difference in house price can be shown to be the result of environmental differences. For example, in a study in Gloucestershire, United Kingdom, the presence of open water near to a house was shown, on average, to be responsible for a 5 percent increase in house price (Garrod and Willis, 1992). However, in general the HPM has been applied to the evaluation of environmental costs rather than benefits. For example, just as the water resource raised the value of local housing, so the noise from an airport may lower local house prices.
- 5 3 -
3.4.4 Issues in Hedonic Price Estimation
While the HPM approach does appear to be reasonably robust, it nevertheless does have some problems.
User unfhendlyEstimating the relationship between house price and environmental quality requires a high degree of statistical skill to separate out the other influences upon house prices such as house size and accessibility.
The property marketThe method relies upon the assumption that individuals have the opportunity to select the combination of house features which they most prefer given the constraints of their income. However, the housing market can often be affected by outside influences, for example, national or local government has a large influence over house prices through changing tax concessions or interests rates. Similarly, if the HPM is carried out over a large area from highly urban to very rural, then there may be a cut-off distance at which those who are employed in cities are unable to move further into the country. It may even be that there are different perceptions of landscape in such rural areas.
In effect, the demand curve for houses with different environmental characteristics may be significantly constrained by the supply curve so that the market does not operate freely. In such cases both the demand for, and supply of, houses will have to be taken into consideration, considerably complicating the analysis.
3.4.5 Contingent Valuation Method
Both the TCM and HPM methods have, in some way, relied upon individual valuations of environmental goods as revealed in their purchase of market priced goods which are associated with the consumption of those environmental goods. The contingent valuation method (CVM) bypasses the need to refer to market prices by asking individuals explicitly to place values upon environmental assets. The CVM is therefore often referred to as an expressed preference method. Although there are variants of the technique, the most commonly applied approach is to interview households either at the site of an environmental asset, or at their homes, and ask them what they are willing to pay (WTP) towards the preservation of that asset. Analysts can then calculate the average WTP of respondents and multiply this by the total number of people who enjoy the environmental site or asset in question to obtain an estimate of the total value which people have for that asset.
3.4.6 Issues in Contingent Valuation Estimation
Compared to the methods previously discussed, the CVM approach may appear comparatively straightforward. However, there are a number of potential problems facing the unwary analyst, a few of the problems are outlined here.
Understanding WTPThe central assumption of the CVM technique is that the WTP sums stated by respondents correspond to their valuation of the assets in question. Critics have questioned the validity of such an assumption claiming that the hypothetical nature of CVM scenarios make individuals’ responses to them poor approximations of true value. However, in a series of experiments where hypothetical WTP questions have been followed up by actual requests for money payments, it was found that the sums which people stated they would be WTP were between 70-90 percent of the amounts they eventually did pay. This indicts that people ‘free-ride’. They tend to understate what they would really pay in an attempt to reduce any subsequent actual payments. However, as the magnitude of this understatement is relatively small this may not be too serious a problem.
- 54 -
Willingness to pay vs. willingness to acceptIn theory the payment question can either be phrased as the conventional ‘What are you willing to pay (WTP) to receive this environmental asset’ or, in the less usual form, ‘What are you willing to accept (WTA) in compensation for giving up this environmental asset?’ When comparisons of the two formats have been carried out, analysts have noticed that WTA very significantly exceeds WTP, a result which critics have claimed invalidates the CVM approach showing response to be expressions of what individuals would like to have happen rather than true valuations.
However, it has also been shown that there are plausible psychological and economic reasons to indicate that individuals feei the cost of a loss, WTA compensation format, more intensely than the benefit of a gain, WTP format. If true, the observed divergence actually supports the validity of the CVM. Respondents will be far less familiar with the notion of receiving compensation for losing something than they will be with the notion of paying for something, a concept we all meet every day. This is likely to cause far greater uncertainty and variability in answers to WTA questions than occurs with WTP questions. Therefore, the former are to be avoided in favour of the latter. This, in turn, has consequences for the applicability of CVM to certain situations. We can obviously ask people their WTP for an environmental gain, such as to set up a new protected area, but in cases of environmental loss, we must ask people their WTP to prevent that loss occurring. An example of the latter is the funding of flood defences to preserve marshland areas from seawater flooding. Nevertheless, it may be that the WTP sum obtained does not reflect what people would consider adequate compensation, their WTA compensation, for losing the environmental asset. Indeed the WTP sum may significantly underestimate the true WTA compensation. This problem is a focus of ongoing research.
Part-Whole BiasCritics of the CVM have noted that if people are first asked their WTP for one part of an environmental asset, such as one lake in an entire system of lakes (Kahneman and Knetsch, 1992), and then asked to value the whole asset, the whole lake system, the amounts stated may be similar. Why is this?
The reason appears to lie in how people commonly allocate their spending. First, they divide their available income up into several broad budget categories such as housing, car, food and recreation, and then subdividing this between the actual items purchased. So for recreation, the first stage is to define the total budget which the individual has available for recreation. This is then subdivided into how much they are willing to spend on each site they wish to visit.
One approach to overcome this problem within CVM is to first ask respondents to work out their overall recreational budget and then ask for their WTP for the environmental asset in question, reminding respondents of their limited recreational budget and that any money they allocate to this asset cannot be spent elsewhere. A second approach is to restrict the use of CVM to the evaluation of broad groups of environmental goods, wholes rather than parts, again reminding respondents of their limited recreational budget constraints. This restriction, if necessary, would considerably constrain the wide-scale application of the CVM and may itself raise further problems regarding respondents’ ability to comprehend such broad amalgams of goods.
Vehicle BiasWhen asking a WTP question analysts must specify a realistic route by which such a payment could be made: the ‘payment vehicle’. However, respondents may alter their WTP statements according to the specific payment vehicle chosen. For example, in a recent experiment regarding WTP for recreation in the Norfolk Broads in Eastern England (Bateman eta!., 1995) WTP via a charitable trust was noticeably lower than WTP via tax. In this case respondents stated that they doubted the ability of charitable funds to protect the environment and, while they did not like paying taxes, they did feei this was more likely to ensure effective environmental protection. It also compelled a wider group of people to contribute than would have if payment had been via charitable donation. Such results clearly tell us probably as much about the payment vehicles chosen as about the value of the asset in question. An obvious solution to such problems is therefore to use whichever payment vehicle is most likely to be used in reality.
- 5 5 -
Starting Point BiasMany CVM studies attempt to prompt respondents by suggesting a starting bid and then increasing or decreasing this bid based upon whether the respondent agreed or refused to pay such a sum. It has been shown, however, that the choice of starting bid affects respondents’ final WTP sum.
3.4.7 Conclusions on Values and Valuation Techniques
This section has discussed the types of environmental value and the methods that can be used to estimate, in monetary terms, the magnitude of such values. The brief survey indicates that economic valuation is a two-part process in which it is necessary to:
• demonstrate and measure the economic value of environmental assets; and• find ways to capture the value - the appropriation process.
The appropriation issue arises mainly from the fact that many of the environmental assets that society generally feei are very valuable, are outside their direct control. Individuals have demonstrated that tropical rain forests, coral reefs and many of the world’s endangered species have existence value, or some intrinsic value. Such values are important but are somewhat remote from the day-to-day practical realities of economic development and the problems of poverty and underemployment in many developing countries. Pragmatically, there seems to be much more scope for the conservation versus development dialogue to be recast in terms of sustainable utilisation of environmental assets, which can be shown to be an economically viable set of options. In these latter strategies, conservation and development become complementary.
3.5 Benefits Transfer
It may not always be necessary to initiate primary research into coastal resource, projects or policy evaluation in order to determine the human welfare effects of various pressures and impacts in the coastal zone. An alternative procedure would be to obtain an estimate of the economic value of the consequences of a similar resource use impact, project or policy that had been felt or implemented in a different location. It could then be assumed, in certain circumstances, that this existing, or adjusted, estimate of economic value could be used as an approximation of the economic value of the proposed project or policy.
Suppose that a development project would result in the destruction of some hectares of coastal wetland, and an analyst wished to estimate the economic value of the environmental losses associated with this proposed project. Rather than attempting to undertake a new study at the site, the analyst could identify previous studies that had estimated the functions of wetlands and their economic value (Table 10 and 11). It could be assumed that the loss of a hectare of wetland at the proposed conversion site would be the same, or similar to, this previous estimate. Such an approach is known as “benefit transfer”.
More formally OECD (1994) lays down that benefit transfer requires three steps:
(1) Identify an existing study where a demand relationship of the following type has been estimated WTP¡ = f (Q¡ - Qo, Pown, ¡i Psub, ¡i Se,)where
WTP¡ = willingness to pay of individual i for a change from an initial environmental quality Q0 to an improved environmental quality Q¡
Pown = price of using the environmental resourcePsub = price of substitute for use of the environmental resourceSe¡ = socio-economic characteristics of individual i.
Determine values for Q¡, P0Wn, Psub and Se at the conversion site.(2) Determine the geographic area over which households will benefit from the change in
environmental quality, known as the “extent of the market”.(3) Substitute the values of the independent variables for the households at the conversion site into
the demand relationship to calculate the benefits to individual i at the conversion site. Aggregate these estimates for all individuals affected in order to obtain the aggregate benefits at the policy site.
-5 6 -
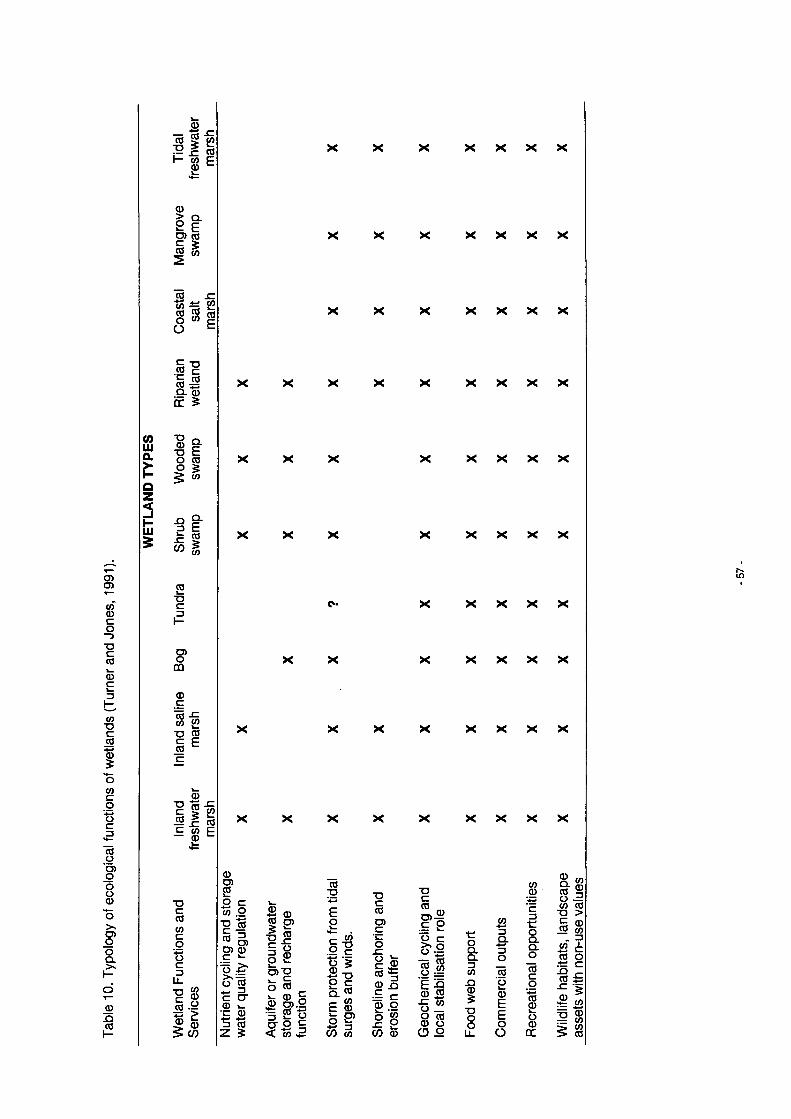
Table
10
. Ty
polo
gy
of ec
olog
ical
fun
ction
s of
wetla
nds
(Tur
ner
and
Jone
s, 19
91).
COUlQ.>-
Ul5
CD -*—»
0 £ ■o ë §S i<D c
CD
I EO ) CO
p
3C/)COOo
szCO
CO m CO £2
.55 cCO = 0 .0 if £
■o Eo COo £
^ CO
5 Es i
CO73c
O)oÛÛ
CDC7ô -CCO CO
7 3 CO
« Ec
CD
E |ô ô « J (5C co E — 0 c
73C00COoc13
LLT 3 CO C ®
1 1i l
X X X X X X X
X X X X X X X
X X X X X X X
X X X X X X X
0O)COo c 0 o-p 0
O) 0 c »-7= >O ,-tio' 0— S-c orO k_c 03 0Z £
S ®0 O)f *o)-p i - 5o ^fc S.O0-0 c < 0 ^
073 73■*“' CE 0o O). C0C 73 Oo C -Co > oc0 73 02Q. C0 0E 00 0V-o P3 o
szCO 0 CO
X X X X X
X X X X X
X X X X X
X X X X X
X X X X X X X
0
73 0 0>-£ =§ 2 O c o -CO S o ~E SCD £5■g «s s(D J2
•coCLCL30
-Q0£73oo
0
3o0E0EEoo
00
c3troQ.Q lo0c:o00k_o0ce
g_0« s°0 0 “O >12 0„ 3 0 <±-0 O .t¿ c
- ° J -0 £
0 0
-57
-
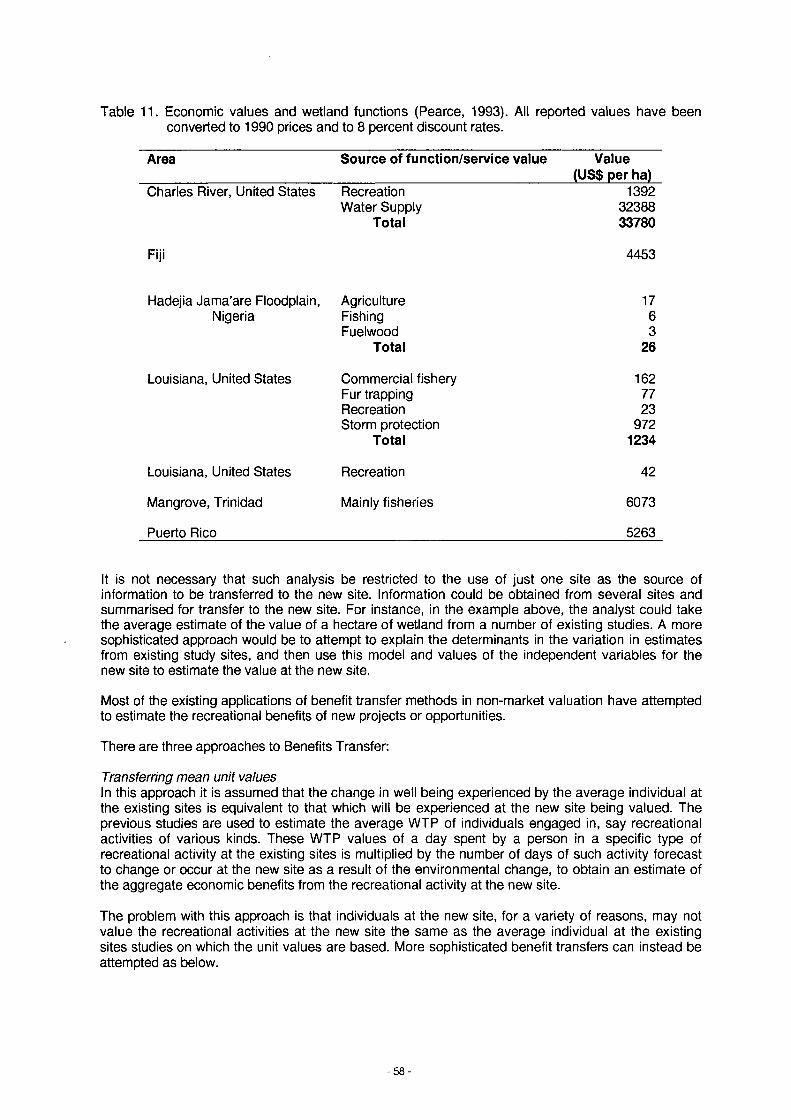
Table 11. Economic values and wetland functions (Pearce, 1993). All reported values have been converted to 1990 prices and to 8 percent discount rates.
Area Source of function/service value Value (US$ per ha)
Charles River, United States Recreation 1392Water Supply 32388
Total 33780
Fiji 4453
Hadejia Jama’are Floodplain, Agriculture 17Nigeria Fishing 6
Fuelwood 3Total 26
Louisiana, United States Commercial fishery 162Fur trapping 77Recreation 23Storm protection 972
Total 1234
Louisiana, United States Recreation 42
Mangrove, Trinidad Mainly fisheries 6073
Puerto Rico 5263
It Is not necessary that such analysis be restricted to the use of just one site as the source of information to be transferred to the new site. Information could be obtained from several sites and summarised for transfer to the new site. For instance, in the example above, the analyst could take the average estimate of the value of a hectare of wetland from a number of existing studies. A more sophisticated approach would be to attempt to explain the determinants in the variation in estimates from existing study sites, and then use this model and values of the independent variables for the new site to estimate the value at the new site.
Most of the existing applications of benefit transfer methods in non-market valuation have attempted to estimate the recreational benefits of new projects or opportunities.
There are three approaches to Benefits Transfer:
Transferring mean unit valuesIn this approach it is assumed that the change in well being experienced by the average individual at the existing sites is equivalent to that which will be experienced at the new site being valued. The previous studies are used to estimate the average WTP of individuals engaged in, say recreational activities of various kinds. These WTP values of a day spent by a person in a specific type of recreational activity at the existing sites is multiplied by the number of days of such activity forecast to change or occur at the new site as a result of the environmental change, to obtain an estimate of the aggregate economic benefits from the recreational activity at the new site.
The problem with this approach is that individuals at the new site, for a variety of reasons, may not value the recreational activities at the new site the same as the average individual at the existing sites studies on which the unit values are based. More sophisticated benefit transfers can instead be attempted as below.
Transferring adjusted unit valuesHere the mean unit values of the existing studies are adjusted before transferring to the new site. The unit values can either be adjusted for any biases that are thought to exist, or they can be adjusted in order to better reflect the conditions at the new site. Potential differences that should be considered between the existing and new site are, differences in socio-economic characteristics of individuals, differences in the environmental change being examined, and differences in the availability of substitute goods and services.
Transferring the demand functionInstead of transferring adjusted or unadjusted unit values, the entire demand function estimated at existing sites could be transferred to the new site. More information is carried over to the new site using this function (OECD, 1994).
There are two main advantages of the benefit transfer approach over the primary approach. Firstly, an estimate of economic benefits can often be obtained more quickly by using this approach then by undertaking primary research at the site under assessment. New valuation studies normally require primary data collection and can take a year or more to complete. Benefit transfer methods potentially offer the hope that estimates of economic value can be obtained in much less time. The second possible advantage is that a benefit transfer study will typically be less expensive to carry out.
We can have most confidence in the reliability of transferred value estimates when:
• the site under assessment is very similar to the sites from which value data has been transferred;• the resource use or policy change or project at the ‘mirror’ site is very similar to that proposed at
the site under assessment;• the valuation procedures used at the ‘donor’ site were analytically sound and carefully conducted;
and• time, financial resources, and personnel available for analysis at the assessment site are not
sufficient to undertake a high-quality study.
The limitations of the benefit transfer approach are that in many areas of likely application, the stock of available literature is limited. Benefit transfer methods can only be used to value the outcomes of projects or policies that have already been implemented elsewhere. They are of little use in estimating the value of innovative or new policies that have not been tried before. The ‘donor1 and assessment sites may differ in ways that render benefit transfer Impossible. For example, there may be unique cultural or religious sites in the assessment area, even though the locations are similar in other respects. Thus the adaptation of values from studies conducted in the United States, for example, to Mexico would have to take into account the major differences with respect to personal income, property rights, land prices, institutions, climate, and other environmental resources.
3.6 Alternative Frameworks for Evaluation
3.6.1 Cost-effectiveness analysis
If the general principles of sustainable economic development are accepted, then the conventional project appraisal system that has been used in the past will require modification. Conventional CBA could be modified to a greater or lesser extent. The notion of the compensating offset or shadow project could be adopted in situations thought to involve significant environmental impacts. The shadow project would represent a substitute asset, where substitution is a technically and financially feasible option, for the threatened environmental asset and its costs would be added into the CBA calculation of the development project.
Alternatively, prior pre-emptive environmental standards could be set in order to constrain conventional CBA. Standards might take any number of forms - ambient environmental quality standards, conservation zoning and nature reserve designations. This usual route for environmental protection reduces CBA to cost-effectiveness analysis, CEA. In CEA, benefits are not measured in money units, but costs are. CEA is used to identify the most cost-effective way of achieving the environmental standard if more than one option is available.
- 5 0 -
What CEA does not tell us is whether the prior pre-emptive environmental standard is itself worthwhile or not. However, if there is a political decision already made, CEA is an important procedure for ensuring the rational use of limited resources. It is important to note, however, that all resource allocation decisions imply a money value. CEA is in effect, a variant of CBA. It comes into use whenever the monetary valuation of benefits is thought to be inappropriate.
3.6.2 Multi-criteria analysis
CEA becomes complex when there are several benefits of policy and each is expressed in its own units of measurement. Moreover, conflict is inherent in policies aimed at an ecologically sustainable economic development. Since the 1970s a suite of evaluation techniques have been developed under the umbrella heading of multi-criteria decision analysis (MCDA). These techniques aim to provide a method for the systematic appraisal of a number of choices in a situation of multiple criteria, combined with conflicting objectives or priorities, where a set of alternative projects or plans need to be evaluated against a set of criteria which affect groups or individuals in different ways.
The increasing popularity of MCDA can be attributed, in part, to the continued existence of intangible and incommensurable environmental effects which remain outside the conventional CBA calculus. It also meets the desire, in modern public decision analysis, to be presented with a spectrum of feasible solutions rather than one ‘forced’ solution.
The basis of the MCDA approach is a set of matrices which combine policy options or alternatives with a range of decision criteria. In all cases, MCDA methods require two types of information in the form of:
• an effect score matrix: the numerical assessment of all relevant impacts of a set of choice alternatives of each of them being measured in its own units; and
• a preference or weight vector: the numerical assessment of the relative priority attached to each of the decision criteria considered in the effect score matrix. A wide spectrum of techniques may then serve to find a relevant answer, depending on the specific nature of the information used and on the scope and content of the evaluation concerned.
The primary purpose of the evaluation technique is to reduce the diverse available information to either a set of single number scores, yielding a single “best” solution, or to produce a complete or partial ranking of alternatives following a series of pairwise comparisons. Nearly all MCDA techniques require the derivation of weights.
Five main groups of multi-criteria techniques can be distinguished:
• aggregate techniques;• lexicographic approaches;• graphical approaches;• consensus-maximising approaches; and• concordance techniques.
Within the aggregation techniques category there are methods such as the Environmental Evaluation System (EES), the Goals-Achievement Matrix (GAM) and the Planning Balance Sheet. These methods all attempt to aggregate scores over a range of criteria to produce the best solution. The Planning Balance Sheet, for example, is seen as an approach bridging the boundary between monetary valuation approaches and multi-criteria methods. It attempts to identify and record details of the distribution of costs and benefits across the various social groups affected, such as producers and consumers. Benefits and costs are annuitised and totalled for each sector to give a single sectoral score. For each sector, the benefits and costs of one plan are then subtracted from those of an alternative plan.
The EES estimates the net environmental impact of a project in terms of a single composite index number score. It is based on a checklist of environmental factors in a set of four environmental categories, ecology, pollution, aesthetics and human interest. Individual parameters, criteria, are weighted, by a panel of exports using a Delphi method, to reflect relative importance. The experts panel also formulates an index of environmental quality by applying value transformation functions to
- 6 0 -
all project impacts. Given the nature of some impacts, a subjective approach to indexing is inevitable in some cases.
In the GAM, impacts are categorised according to a set of explicitly stated community goals and then according to the community groups that are affected. The individual impact is estimated scientifically and measured in whichever unit most closely describes the goal to which it corresponds using the highest measurement scale applicable. Each cell entry is an expression of the degree to which each goal is achieved. An index of “goals-achievemenf is calculated for each alternative action by multiplying the impacts by a set of value weights.
Lexicographic approaches to MCDA assume that the criteria can be ordered from most to least important. The best alternative is that which has the highest score for the most important criterion, or if scores are equivalent, the next most important criterion is considered until just one alternative is identified. The method is appropriate where there is a clear list of criteria priorities or objectives, such as the selection of a toxic waste facility, requiring ‘acceptability’ or ‘tolerable risk’ conditions for hydrogeology or distance from human settlements. The lexicographic approach does not allow tradeoffs between criteria.
Graphical approaches assume that alternatives can be plotted on graphs with reference to bench mark positions, e.g., the ‘best’ scores of any of the alternatives. Each axis of the graph represents a criterion against which each alternative is evaluated and a score identified. Data is standardised and weights are used to reflect criteria relative importance. The method assumes that the data is either in ratio or interval form. It also ignores possible collinearity between criteria.
Consensus-maximising approaches seek to aggregate individual preferences to form group consensus. In its simplest form, the Borda-Kendall method, for example, is the summation of individual rankings of criteria in terms of importance in order to yield an overall index of importance.
Concordance methods assume that the values between criteria are non-compensatory, i.e., that trade-off functions between criteria do not exist. In order to make comparisons between criteria it is assumed that the criteria themselves can be given weights. Comparison is carried out on a pairwise basis between alternatives with respect to each criterion. Ordinal data is required. The outcome is a score for each alternative based on the overall comparative performance of an alternative against the whole range of criteria. This is derived by using a mathematical concordance or discordance index to generate indexes of dominant and non-dominant solutions.
MCDA clearly shows the multiple objectives generally available to decision-makers, and, if the importance weights can be derived, it enables diverse objectives to be integrated. Compared to CBA, then, the fundamental difference lies in the recognition that economic efficiency often is not the sole objective of policy.
3.6.3 Risk-benefit analysis
Many policies involve risky events, damage from storm surge events, health risks from chemicals in the environment and so on. The application of decision rules to such areas has led to the emergency of ‘risk-benefit analysis’. Instead of asking about the costs and benefits of a policy, this analysis considers the costs and benefits of undertaking no action to reduce, say, chemicals in drinking water. The risks of such a policy would be the number of cancers arising from the chemicals. The benefits of ‘no action’ are the avoided resource costs of removing the chemicals. We can therefore compare the risks with benefits to give a ‘risk-benefit analysis’ (RBA). Note that, expressed in this way, RBA is nothing more than CBA but in the context of risk events. In CBA a cost is a foregone benefit and a benefit is a foregone cost. RBA simply takes this essential relationship and declares the cancer deaths to be the cost and the foregone resource costs to be the benefits. To see the formal equivalence of CBA and RBA consider the case of nuclear power generation where the benefit is the value of the electricity produced, and the costs are the resource costs and the hazards to human health from a probabilistic accident and form routine emissions of radioactivity. Once again, this fits the CBA framework, but some of the costs are expressed in probabilistic form.
-61 -
3.6.4 Environmental impact assessment
Environmental Impact Assessment (EIA) evolved in the United States in response to the legislative requirements of the National Environmental Policy Act of 1969. The basic aim was to quantify in nonmonetary terms of all the potentially significant environmental impacts associated with development projects or alternative course of action. This information was seen as additional to the monetised costs and benefits derived from a CBA.
In Europe, EIA has progressed more slowly until the implementation of the European Commission (EC) EIA Directive in the late 1980s.
EIA methods can be divided into two basic categories:
• ad hoc expert opinion gathering, simple checklists, presentational matrices and networks - which encompass only two of the three analytical stages required to fully assess environmental effects. These methods are capable of identifying and measuring potential environmental impacts but do not include any evaluation of the diverse impacts;
• methods like the EES described earlier in this report. The EES includes an evaluation stage as the diverse range of impacts are converted into a standardised and weighted environmental quality index. The end result of the EES is a composite index number score for each alternative project.
EIA and BDE are not substitutes for each other, rather they should be viewed as complements. EIA studies which identify, measure and predict all the significant direct and indirect environmental impacts related to a project, provide the quantified baseline information for any subsequent BDE. EIA studies which include multi-criteria evaluation methods can complement BDE in the sense that they demonstrate the existence of multiple criteria and policy objectives and the sensitivity of analytical results to different weighting procedures.
Table 12 contains a summary of the advantages and limitations of the main evaluation methods, both monetary and non-monetary.
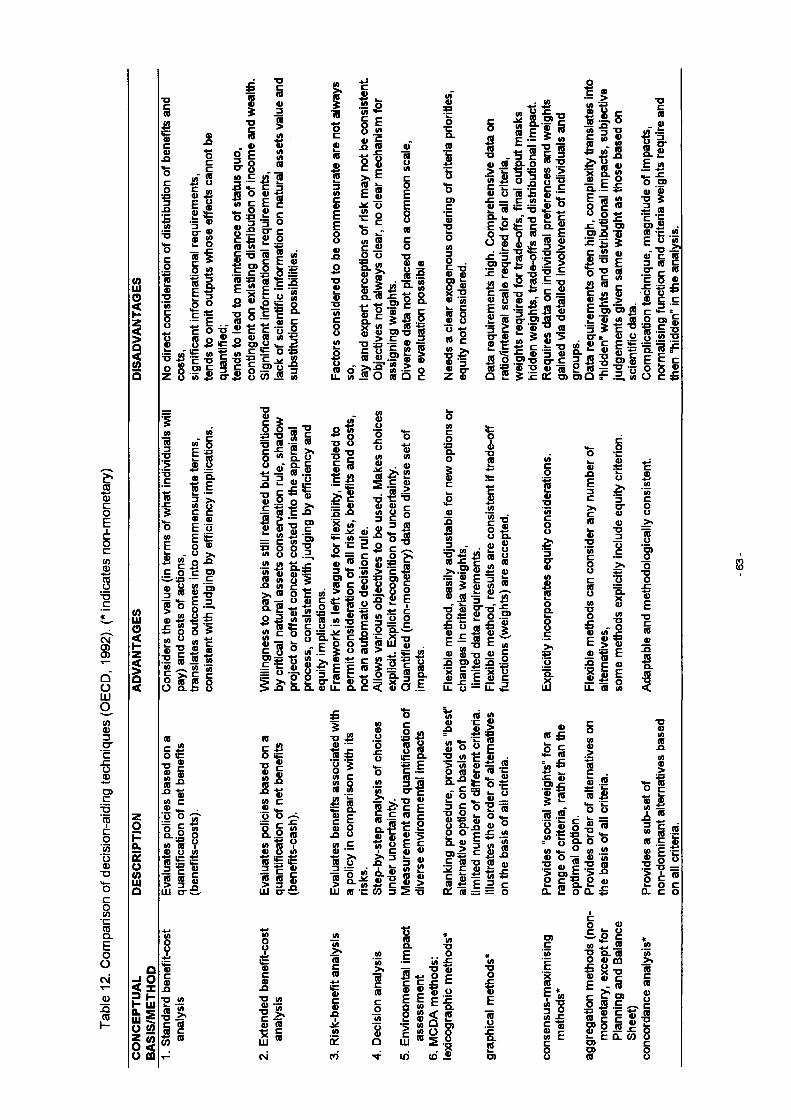
Table
12
. Co
mpa
rison
of
decis
ion-
aidin
g te
chni
ques
(O
ECD,
199
2).
(* in
dicate
s no
n-m
onet
ary)
COUlo<
uiO<
i<
opQ.soCOuiQ
Û
¡ it" uUl € O COZ S o <O CO
o _c gO s
=5 j¡2 o o
Z o
Z 'Ë w1 SS-5o +5S; (I) r <0§>I § 1(I) ¿ (I)(A 4-> U 4->
(A</T § E Iu (04) o
Q_E
¡Á o'
ir - o
c4)_ Oi l
® <0 ~ ** c S èg o c ra^ * i)
'S i -W o £
"OH ¡5 43
3 ' iui ï43 w
^ Î2 w^ E c en co ort î-i Q
(0IIi l¡S í . 1 ° ? D-.° OM« Ÿ0) 0 ( 0 •a ip *iI ? ! ! « «
LU Ö - Ä
(OT3S £■D Z* C (043 gCO 18
■C :£S « cf - 1 «■— > j2i l §
(0 4) O (03 (Q
2 ’® m Cc > jg o2! Í. « -5
D) (0 "O ‘4) "O (0> 4) ^ C "O 4) 3 4) ■o o- c2 ® 75- OC O)
Q. *“ « 0) ?g 1 1 i - £ö> Q F .2 , m
43 o o) (0 *= 4) û ! ^6-2»S 3
o co 43 io 43 O !8 ¡5 c
O (O
tT 42 <2 « -c c
4)= 4) E<0 > E co > £4) (0 =j
a | §
4) a) TJ O) 4) ÿ CS n
m <0
5 1
■° «</> C 4)O OÖ § “5Q..2 CO» 13 VU ' S g « «¿i i - e
I4)C4).QT3 (A« 5 .g i* gLU ro
Csi
(A 4) O O
£ ±i O■»
13 £S
I IO
C0(A
1 ioc(O .E (Ä
13 S*2 q (A> ° “ io
u i i o r
ï . i§ 43 o c^ ^ U 4)
* t g ¡■g E 2o E c. C ë 4>
i? 3 ® ¿ # ¡ ¡ { 1 2i c | lC0 3 ÜÜE -D
>*
^ «i4) 'C=P £8 'S 5^ .2 c> (A 4)2 « ë4) O ^S c O4) ^ ë O g-5o ° E Q. g I 0)£ C C w -O^ E iCO Æ Ioc 75 =
(A
j>loE
5 cdz ®o ■■£¡uii 'S 75 0 'S4) ° £ (A¡8j§¡3 4)
7 a £ 3 c = o
4>* ££ S ^
-I
(A4>>•!“ï■C 4)f lco .S Í o -
I i75 4Bt ak.o o
2 c d *- =8 S .2 f «^ g -S. o OIA u - ® (A W
1 5 ‘(A 4) O ■D ~1
° 75 £ S« c 5 g<r 0).E > "° 2 g-g.2 « Q. E O Q- £
T34)(A
2(A4)>
oo C4-« *“4) 4)(A ±¿
á " •3 g.sCO c 4)IA E ?« I lg ¿ «£ o c
CL C O
(A>»COcCO-*-»?g_Q-i(A
CO
&(Aj*COcCOco(A
‘o4)o
*(A "D
E . 0■— (A £m “O 4>45 +-» o cI I ^ .91 i E -g.2 « < 2 ‘v W ü O)ê s y g
« ¿ ILU
io
*(ATJO-C4)E75o!co.5O)
O)c"(Â
E * (A
* 'S 3 2 (O ££ « fl) r-(o E c o o
co(A
T3OfEg
loUi4)L.D)O)CO
(A"(A
4)
£ 1Q . CO4) CD >tS-o «4) C g
- CO w^ O) gM ? g ¡ I i iE CL CO O
c o o
s
4. CASE STUDIES
In section 2.4 of this report a three-fold assessment/valuation categorisation was laid out:
• impact analysis;• partial valuation; and• total valuation.
The case studies reported below follow this basic typology and are drawn from coastal zone contexts in both developed and developing countries.
The individual case studies are as follows:
Impact analysis case studies:• Bacuit Bay, Palawan Island, Philippines;• Leyte Island, Philippines; and• Caribbean country, coastal sewerage scheme which deals explicitly with risk and
uncertainty complications.
Partial valuation case studies:• Bintuni Bay Mangroves, Indonesia, and Nam Ham Mangroves, Vietnam; and• Tokyo Bay, Japan, which incorporates scenario analysis.
Total valuation case studies:• Marine Park studies: Bonaire and Virgin Islands• GDP at risk studies - East Anglia Coastal Zone, United Kingdom and Bangladesh; and• Common Methodology Studies - East Anglia, United Kingdom and other countries.
4.1 Case Study 1 - Resource Management In Bacuit Bav. Palawan Island. Philippines
Introduction
This case study is an example of environmental impact analysis in the context a specific impact, sedimentation, and the consequent changes downstream in the marine environment of Bacuit Bay, which in turn affect human economic welfare (Hodgson and Dixon, 1988; Goldrick and James, 1994; Aylward and Barbier, 1992).
In 1985 logging operations began in the upland catchment area of Bacuit Bay. These operations resulted in sedimentation and downstream damage to coral reefs and marine fisheries in the Bay. The environmental changes resulted in an economic damage impact affecting both the commercial and artisanal fishing and emergent tourism industries in the area. The logging operations on the other hand, yield a substantial financial revenue stream for a limited period of time.
Scenario Analysis
The environmental and economic analysis undertaken by Hodgson and Dixon (1988) was based on a comparison of two different future scenarios, one in which logging activities are banned in the Bacuit Bay drainage basin (option 1), and the other in which logging is allowed to operate unhindered (option 2). Estimates were made of the gross revenue that the three industries, logging, fishing and tourism, might generate over a period of ten years, beginning in 1985. The analysis was carried out in constant 1986 prices and revenue streams were put on a present value basis via discount rates of 10 percent and 15 percent, reflecting the rates used in the Philippines in both private and public sector evaluation.
The two scenarios, options 1 and 2, result in two different sets of physical and biological change impacts. Any economic assessment has therefore to be preceded by prediction and quantification of the environmental change effects. The method used was to extrapolate the known effects of logging in 1985, ground truthed by field work, over a 10 year time horizon. Under option 2, the continuation of
- 64 -
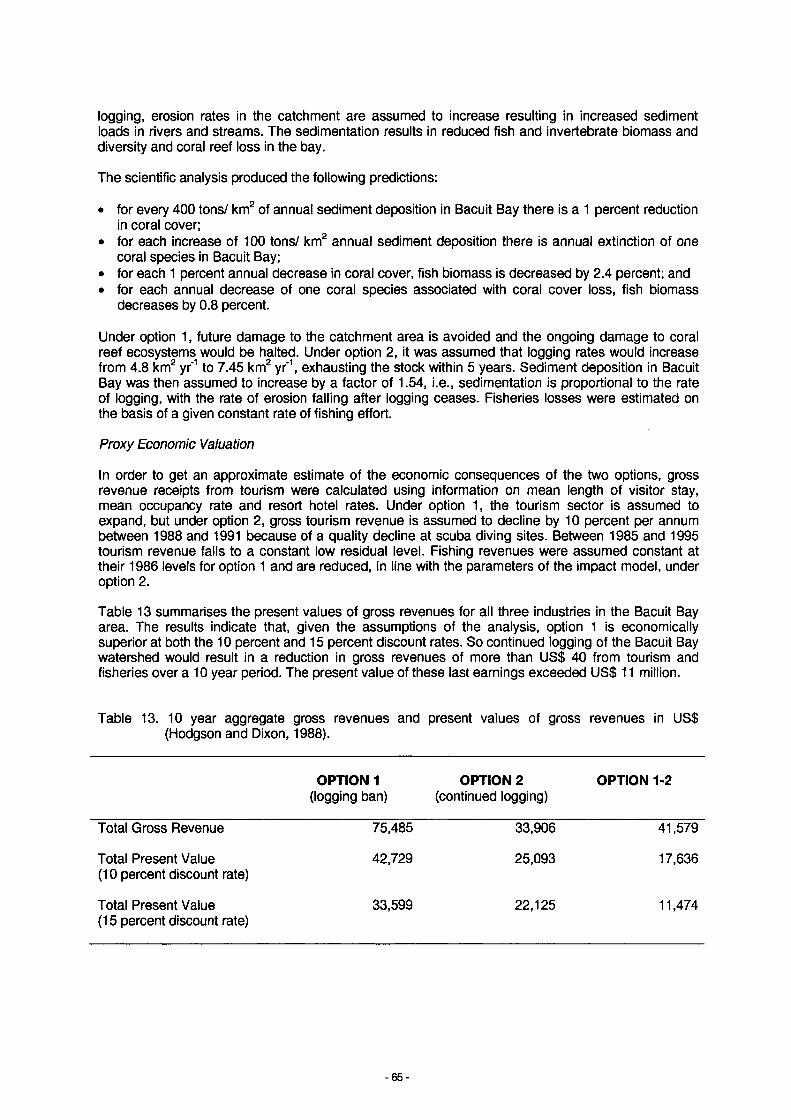
logging, erosion rates in the catchment are assumed to increase resulting in increased sediment loads in rivers and streams. The sedimentation results In reduced fish and invertebrate biomass and diversity and coral reef loss in the bay.
The scientific analysis produced the following predictions:
• for every 400 tons/ km2 of annual sediment deposition in Bacuit Bay there is a 1 percent reduction in coral cover;
• for each increase of 100 tons/ km2 annual sediment deposition there is annual extinction of one coral species in Bacuit Bay;
• for each 1 percent annual decrease in coral cover, fish biomass is decreased by 2.4 percent; and• for each annual decrease of one coral species associated with coral cover loss, fish biomass
decreases by 0.8 percent.
Under option 1, future damage to the catchment area is avoided and the ongoing damage to coral reef ecosystems would be halted. Under option 2, it was assumed that logging rates would increase from 4.8 km2 yr'1 to 7.45 km2 yr'1, exhausting the stock within 5 years. Sediment deposition in Bacuit Bay was then assumed to increase by a factor of 1.54, i.e., sedimentation is proportional to the rate of logging, with the rate of erosion falling after logging ceases. Fisheries losses were estimated on the basis of a given constant rate of fishing effort.
Proxy Economic Valuation
In order to get an approximate estimate of the economic consequences of the two options, gross revenue receipts from tourism were calculated using information on mean length of visitor stay, mean occupancy rate and resort hotel rates. Under option 1, the tourism sector is assumed to expand, but under option 2, gross tourism revenue is assumed to decline by 10 percent per annum between 1988 and 1991 because of a quality decline at scuba diving sites. Between 1985 and 1995 tourism revenue falls to a constant low residual level. Fishing revenues were assumed constant at their 1986 levels for option 1 and are reduced, in line with the parameters of the impact model, under option 2.
Table 13 summarises the present values of gross revenues for all three industries in the Bacuit Bay area. The results indicate that, given the assumptions of the analysis, option 1 is economically superior at both the 10 percent and 15 percent discount rates. So continued logging of the Bacuit Bay watershed would result in a reduction in gross revenues of more than US$ 40 from tourism and fisheries over a 10 year period. The present value of these last earnings exceeded US$ 11 million.
Table 13. 10 year aggregate gross revenues and present values of gross revenues in US$ (Hodgson and Dixon, 1988).
OPTION 1(logging ban)
OPTION 2(continued logging)
OPTION 1-2
Total Gross Revenue 75,485 33,906 41,579
Total Present Value (10 percent discount rate)
42,729 25,093 17,636
Total Present Value (15 percent discount rate)
33,599 22,125 11,474
- 6 5 -
Sensitivity analysis
Various sensitivity tests were also carried out on the main parameters in the model. A reduction of 50 percent in the estimated annual fisheries and tourism revenue losses did not alter the conclusions of the scenario study. The main conclusion also remained unaltered when it was assumed that no increase in tourism took place between 1991-1996, even though a logging ban was in place. But if sedimentation-related losses are halved and no tourist expansion is assumed, the total gross revenue under option 1 remains above that of option 2, but the present value with a discount rate of 15 percent turns in favour of option 2.
Condusions
This was a relatively simple analytical approach which nevertheless seemed to predict quite robust results. Several limitations of the analysis should however be noted. The proxy measure of economic benefit, value, was taken to be gross revenue and not the more correct net revenue, i.e., revenue minus fixed and variable costs. The logging ban option may also have produced non-use value benefits in terms of biodiversity and amenity conservation. It is also likely that a catchment with extensive tree cover would generate higher use values, such as those connected to flood protection services. Finally, an intermediate scenario based on a more sustainable logging regime and associated practices may have generated both some logging revenue and lower environmental damage costs.
4.2 Case Study 2 - Wastewater Disposal. Levte Island. Philippines
Introduction
This analysis explores the cost-effectiveness of various options for disposing of wastewater from a geothermal power plant built on the island of Leyte in the Philippines. It is a constrained form of economic cost-benefit analysis, see sections 2.4 and 3.5.1, because the decision to build the power plant and to tap the local geothermal energy had already been made. The objective of the analysis was therefore to determine which means of wastewater disposal from the plant would protect the environment in the most cost-effective manner, i.e., for least social cost (Dixon and Hufschmidt, 1986; Dixon et al., 1994).
Seven wastewater disposal options were examined in terms of their different monetary cost values and, where practicable, their environmental impacts. For some of the options, the cost of the important environmental impacts in terms of lost marine fishery and rice production were quantified. But other potential impacts such as energy loss, damaged riverine fishery production, human health effects and amenity impacts proved too difficult to quantify and value in monetary terms. The point is that these impacts were none the less real and therefore should not be ignored in the analysis. They should be listed in a qualitative way and presented, alongside the monetary cost-estimates, to decision makers.
The disposal options were as follows:• reinjection of the geothermal fluids from separator stations back into wells within the field. This
option also required a back-up system consisting of thermal ponds and other contingency structures, or in extreme circumstances, direct discharge to the river, after chemical treatment;
• discharge into the local Mahiao River without treatment;• discharge into the Mahiao River after treatment for the removal of arsenic;• discharge into the Bao River without treatment, but after cooling in a pond;• discharge into the Bao River after cooling and treatment for the removal of arsenic;• discharge at sea without treatment through an outfall at Lao Point and via a 22 km pipeline; and• discharge at sea without treatment through an outfall at Biasong Point and via a 32 km pipeline.
Cost and environmental effectiveness analysis: individual options
In this sub-section we take a brief look at the procedures required to assess just three of the options in order to illustrate how the analysis can be conducted.
Reinjection option
The total construction cost for this option was estimated to be 107 million pesos in 1980 prices and the operation and maintenance costs came to 10.4 million pesos. On the basis of a 15 percent discount rate and a 30 year time horizon the present value of total direct costs came to 138.3 million pesos.
Reinjection is potentially a very environmentally effective method of disposal but some uncertainty surrounds the long term impacts on groundwater resources, especially if chemicals are used to reduce reinjection pipe blockages. These environmental costs could not be quantified and valued.
Discharge into the Mahiao River without treatment
The construction of a thermal pond would take one year and cost 7 million pesos and the water supply and purification system necessary to protect human health, would require two years construction time at a cost of 50 million pesos. Operation and maintenance costs were estimated to be 43,300 pesos per annum for the pond and 15 million pesos for the water purification system. The present value of total direct costs was 120.26 million pesos. Because of arsenic and boron contamination of the wastewater, the productivity of 4000 hectares of rice fields would be adversely affected due to the loss of irrigation water. The value of this rice production loss was estimated to be1.47 million pesos per annum (based on local cost and production data for the period 1975-78) (Table 14).
- 67 -
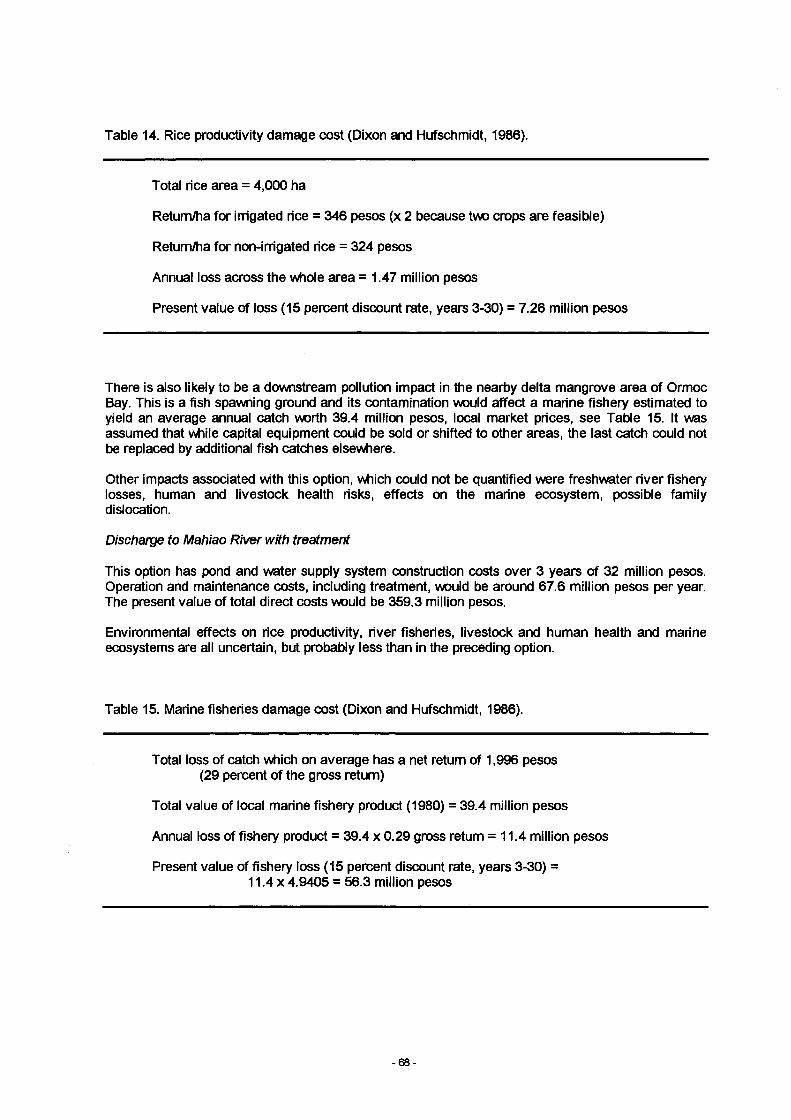
Table 14. Rice productivity damage cost (Dixon and Hufschmidt, 1986).
Total rice area = 4,000 ha
Retum/ha for irrigated rice = 346 pesos (x 2 because two crops are feasible)
Retum/ha for non-inrigated rice = 324 pesos
Annual loss across the vtfiole area = 1.47 million pesos
Present value of loss (15 percent discount rate, years 3-30) = 7.26 million pesos
There is also likely to be a downstream pollution impact in the nearby delta mangrove area of Ormoc Bay. This is a fish spawning ground and its contamination would affect a marine fishery estimated to yield an average annual catch worth 39.4 million pesos, local market prices, see Table 15. It was assumed that while capital equipment could be sold or shifted to other areas, the last catch could not be replaced by additional fish catches elsewhere.
Other impacts associated with this option, which could not be quantified were freshwater river fishery losses, human and livestock health risks, effects on the marine ecosystem, possible family dislocation.
Discharge to Mahiao River with treatment
This option has pond and water supply system construction costs over 3 years of 32 million pesos. Operation and maintenance costs, including treatment, would be around 67.6 million pesos per year. The present value of total direct costs would be 359.3 million pesos.
Environmental effects on rice productivity, river fisheries, livestock and human health and marine ecosystems are all uncertain, but probably less than in the preceding option.
Table 15. Marine fisheries damage cost (Dixon and Hufschmidt, 1986).
Total loss of catch which on average has a net return of 1,996 pesos (29 percent of the gross return)
Total value of local marine fishery product (1980) = 39.4 million pesos
Annual loss of fishery product = 39.4 x 0.29 gross return = 11.4 million pesos
Present value of fishery loss (15 percent discount rate, years 3-30) =11.4 x 4.9405 = 56.3 million pesos
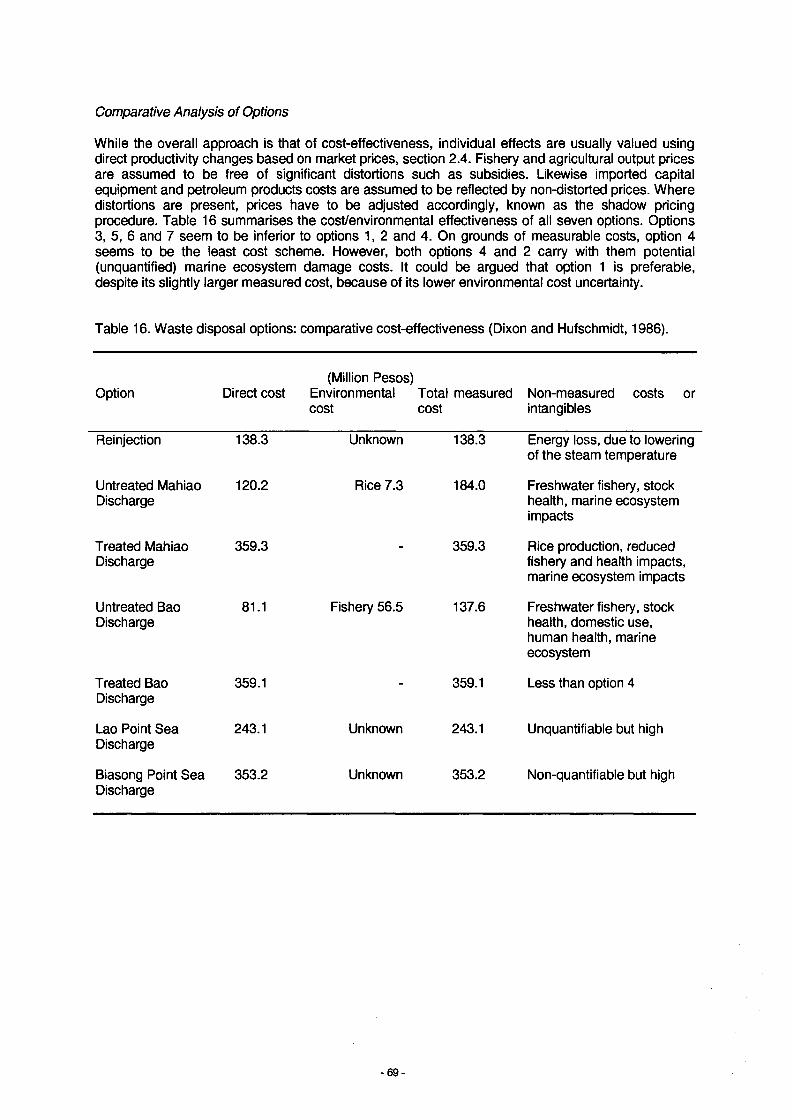
Comparative Analysis of Options
While the overall approach is that of cost-effectiveness, individual effects are usually valued using direct productivity changes based on market prices, section 2.4. Fishery and agricultural output prices are assumed to be free of significant distortions such as subsidies. Likewise imported capital equipment and petroleum products costs are assumed to be reflected by non-dlstorted prices. Where distortions are present, prices have to be adjusted accordingly, known as the shadow pricing procedure. Table 16 summarises the cost/environmental effectiveness of all seven options. Options 3, 5, 6 and 7 seem to be inferior to options 1, 2 and 4. On grounds of measurable costs, option 4 seems to be the least cost scheme. However, both options 4 and 2 carry with them potential (unquantified) marine ecosystem damage costs. It could be argued that option 1 is preferable, despite its slightly larger measured cost, because of its lower environmental cost uncertainty.
Table 16. Waste disposal options: comparative cost-effectiveness (Dixon and Hufschmidt, 1986).
Option Direct cost(Million Pesos)
Environmental cost
Total measured cost
Non-measured costs or intangibles
Reinjection 138.3 Unknown 138.3 Energy loss, due to lowering of the steam temperature
Untreated Mahiao Discharge
120.2 Rice 7.3 184.0 Freshwater fishery, stock health, marine ecosystem impacts
Treated Mahiao Discharge
359.3 “ 359.3 Rice production, reduced fishery and health impacts, marine ecosystem impacts
Untreated Bao Discharge
81.1 Fishery 56.5 137.6 Freshwater fishery, stock health, domestic use, human health, marine ecosystem
Treated Bao Discharge
359.1 - 359.1 Less than option 4
Lao Point Sea Discharge
243.1 Unknown 243.1 Unquantifiable but high
Biasong Point Sea Discharge
353.2 Unknown 353.2 Non-quantifiable but high
4.3 Case Study 3 - Coastal Sewerage Scheme. Caribbean
Introduction
This case study is concerned with a public sewerage project designed to run parallel to a densely populated beach area on a Caribbean island whose economy is significantly dependent on foreign exchange revenue from tourism. It has been chosen because it incorporates a contingent valuation study and tries to deal explicitly with risk and uncertainty complications (Darling et ai, 1993; OECD, 1995).
The existing private sewerage arrangements were judged to be largely satisfactory by individual citizens, but the public authorities were concerned about potential environmental and health risks if a central collection and treatment facility was not built to cater for future needs. The possible environmental risks from the seepage of sewerage into coastal waters included, damage to fringing reefs and related fishing activity and beach erosion protection function, together with human health concerns for bathers and beach users. It was therefore decided to conduct a contingent valuation study into the possible benefits, willingness to pay (WTP) estimates, of a public sewerage scheme (Sections 3.4.5 and 3.4.6).
Contingent valuation study (CV)
The sample survey covered 277 households that would be able to connect up to the sewerage system and 433 households for whom connection was not feasible, but nevertheless might gain benefits in the form of a higher quality beach recreation. The total population of these two areas was 3,268 and 53,041 households respectively.
The questionnaire used varied in its detail between these two sub-samples, but contained a description of the good being valued, including illustrations of a before and after situation. It also included questions which elicited the respondent’s willingness to pay for the sewerage service. Households able to connect up were asked: would you be WTP US$ 15 more on your water bill each quarter to have public sewerage, or, would you prefer to pay what you are now paying and go without the public sewerage system? Households outside the scheme’s coverage were asked their WTP only for the environmental benefits of the scheme. The valuation questions were asked in a dichotomous, yes/no, format and the specific dollar amounts that a respondent was asked about were assigned to the questionnaires on a random basis. Finally, questions about the respondent’s characteristics, preferences, and uses of the good were valued.
This type of social survey based valuation method is well known to pose complex problems and the results will be affected by the questionnaire form, wording, question ordering and contextual information provided. The concepts and questions were therefore pre-tested by focus groups and a pilot survey.
The use of a dichotomous choice question format precludes the direct determination of a mean WTP figure, benefit estimate. An econometric model has to be constructed to relate the probability of a “yes” response to the amount of payment and household characteristics, plus exogenous variables like beach usage, or non-usage, age, sewerage charge rate, etc. Depending on which variables proved to be significant, it was then possible to obtain mean values for the sample’s WTP. The results of this survey were US$ 178 and US$ 11 per year for households inside and outside of the scheme’s coverage respectively.
On the positive side, the issue - sewerage and pollution risk - was reasonably well understood by the respondents and concerned a use value, as opposed to the more diffuse non-use value component of total economic value, within their direct experience. A realistic mode of payment was proposed and a dichotomous choice payment format was adopted. A number of bias problems such as strategic bias, free riding, payment vehicle bias, and others were therefore probably minimised. On the other hand, the CV question did not specify when the water would become unswimable. The survey also failed to ask about people’s current perception of the beach and coastal waters environmental quality, and the information given referred rather vaguely to potential reef damage and potential tourism decline. Finally, part-whole bias was not explicitly countered through a reminder
- 7 0 -
to respondents about their budget constraint and the other public goods which their money could be spent on.
Dealing with risk and uncertainty
As a result, In particular, of the degree of uncertainty surrounding the environmental impacts of sewerage disposal, with and without the public scheme, it was decided to use a range of values for both scheme costs and benefits, with probability distributions for each.
Scheme construction and operating cost estimates proved to be relatively straightforward. Engineering estimates plus contingency allowance were used. The estimates had an 80 percent confidence interval defined by a range 15 percent above and 15 percent below the central, estimate. Scheme benefits were taken to be:
• the WTP (contingent valuation) of households for the disposal and environmental benefits;• fisheries benefits;• coastal erosion benefits; and• tourism benefits.
The contingent valuation benefits were handled using a normal distribution that assumed an 80 percent confidence interval plus or minus 40 percent of the central value. This wide range reflected the uncertainties surrounding this valuation method and its possible bias problems.
Fisheries benefits were modelled on the basis of two expert opinion-based future scenarios. In the first, the sewerage scheme is not built and fishery yield declines to zero over a 10 year horizon. In the second, the project is built and yields increase to 1980 levels over 10 years. A uniform distribution 50 percent around the central estimate was used for these benefit numbers, i.e., any estimate within the range is equally likely.
Coastal erosion benefits stemming from cleaner coastal water and therefore reef enhancement were taken to be reflected in avoided beach replacement/recharge costs. The range of benefits was from no difference, to a reduction in the need for nourishment, from a 1 in 5 year cost to a 1 in 20 year cost. These costs were annualised, and assigned a uniform probability distribution within the range.
Tourism benefits were subject to great uncertainty because of the lack of scientific information about water quality and health risks. Scenarios were constructed based on the growing probability that critical levels, based on United States Environmental Protection Agency standards, would be exceeded at a given point in the future, provoking a health damage cost problem. Tourism was then assumed to respond. Without a real or perceived health problem, it was assumed that visitor days would grow by between 0.2 percent and 2 percent per annum. With a health problem, visitation was estimated to decline by between zero and 50 percent. Declines of >20 percent were assigned a 15 percent probability and declines of <20 percent were given an 85 percent rating. The economic value of this decline in net foreign exchange value terms was estimated to be US$ 30-40 million per annum.
Rates of return resulting from the schemes ranged from 0.8 percent to 26.8 percent, with a best estimate of 8.2 percent. The expected Net Present Value, i.e., scheme discounted costs minus discounted benefits, was US$ 11.7 million. The range of uncertainty had the following bounds: if the scheme was implemented the maximum possible loss was US$ 45 million, equivalent to the capital cost of the scheme, and if the scheme was not implemented there was a small risk of a loss of US$ 127 million.
-71 -
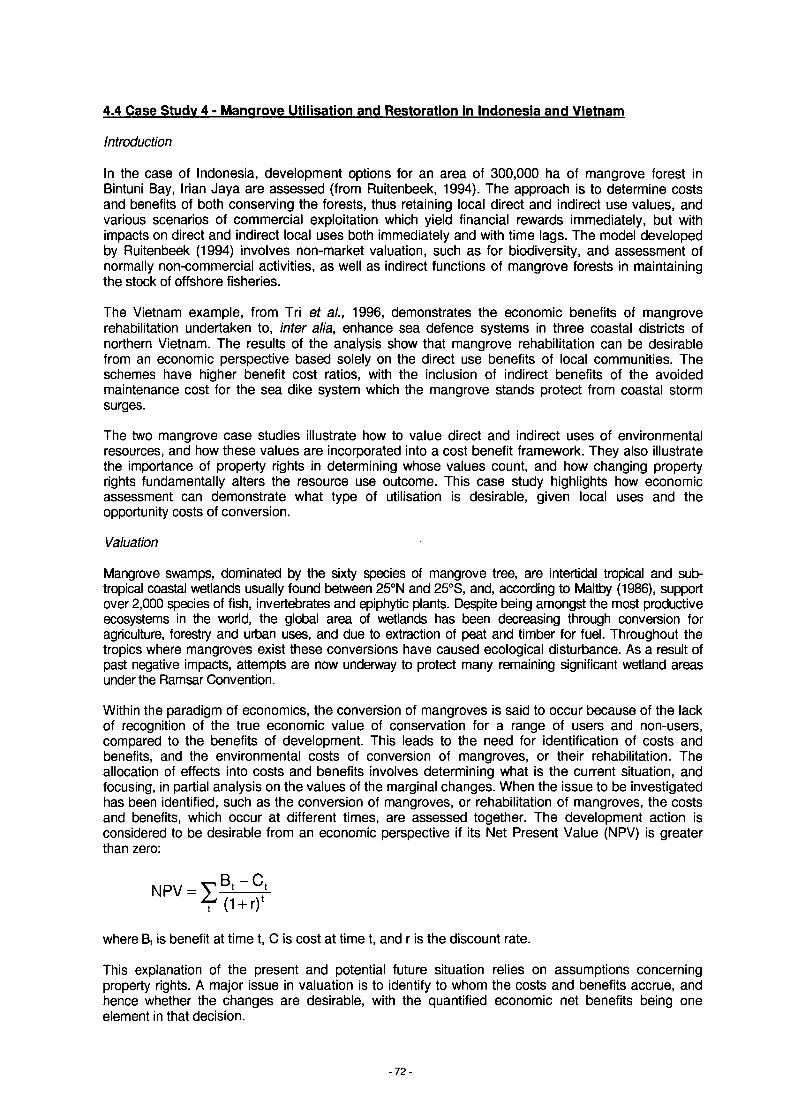
4.4 Case Study 4 - Mangrove Utilisation and Restoration in Indonesia and Vietnam
Introduction
In the case of Indonesia, development options for an area of 300,000 ha of mangrove forest in Bintuni Bay, Irian Jaya are assessed (from Ruitenbeek, 1994). The approach is to determine costs and benefits of both conserving the forests, thus retaining local direct and indirect use values, and various scenarios of commercial exploitation which yield financial rewards immediately, but with impacts on direct and indirect local uses both immediately and with time lags. The model developed by Ruitenbeek (1994) involves non-market valuation, such as for biodiversity, and assessment of normally non-commercial activities, as well as indirect functions of mangrove forests in maintaining the stock of offshore fisheries.
The Vietnam example, from Tri et al., 1996, demonstrates the economic benefits of mangrove rehabilitation undertaken to, inter alia, enhance sea defence systems in three coastal districts of northern Vietnam. The results of the analysis show that mangrove rehabilitation can be desirable from an economic perspective based solely on the direct use benefits of local communities. The schemes have higher benefit cost ratios, with the inclusion of indirect benefits of the avoided maintenance cost for the sea dike system which the mangrove stands protect from coastal storm surges.
The two mangrove case studies illustrate how to value direct and indirect uses of environmental resources, and how these values are incorporated into a cost benefit framework. They also illustrate the importance of property rights in determining whose values count, and how changing property rights fundamentally alters the resource use outcome. This case study highlights how economic assessment can demonstrate what type of utilisation is desirable, given local uses and the opportunity costs of conversion.
Mangrove swamps, dominated by the sixty species of mangrove tree, are intertidal tropical and subtropical coastal wetlands usually found between 25°N and 25°S, and, according to Maltby (1986), support over 2,000 species of fish, invertebrates and epiphytic plants. Despite being amongst the most productive ecosystems in the world, the global area of wetlands has been decreasing through conversion for agriculture, forestry and urban uses, and due to extraction of peat and timber for fuel. Throughout the tropics where mangroves exist these conversions have caused ecological disturbance. As a result of past negative impacts, attempts are now underway to protect many remaining significant wetland areas under the Ramsar Convention.
Within the paradigm of economics, the conversion of mangroves is said to occur because of the lack of recognition of the true economic value of conservation for a range of users and non-users, compared to the benefits of development. This leads to the need for identification of costs and benefits, and the environmental costs of conversion of mangroves, or their rehabilitation. The allocation of effects into costs and benefits involves determining what is the current situation, and focusing, in partial analysis on the values of the marginal changes. When the issue to be investigated has been identified, such as the conversion of mangroves, or rehabilitation of mangroves, the costs and benefits, which occur at different times, are assessed together. The development action is considered to be desirable from an economic perspective if its Net Present Value (NPV) is greater than zero:
where B, is benefit at time t, C is cost at time t, and r is the discount rate.
This explanation of the present and potential future situation relies on assumptions concerning property rights. A major issue in valuation is to identify to whom the costs and benefits accrue, and hence whether the changes are desirable, with the quantified economic net benefits being one element in that decision.
Valuation
- 7 2 -
Mangrove conservation in Indonesia
For Birrtuni Bay, Ruitenbeek (1994) estimates that the benefits of conservation stem from traditional noncommercial uses, from selective mangrove logging and from the indirect function of the mangroves in maintaining the commercial fishery associated vuth the stock of fish that utilise the mangrove for spawning. These activities support a local community of approximately 3000 households. The costs of conservation considered in the analysis is the opportunity foregone to log the mangrove forests for commercial timber of high value, a storage which would bring about immediate economic benefit. However, the results show that conservation benefits outweigh development foregone, under most scenarios and assumptions of valuation.
Since many of the goods and services, referred to as ‘Local use’ in Table 17 are not traded in markets, a household survey of 100 households revealed the implicit value of these goods in terms of their contribution to total household production. Biodiversity is valued in the study by estimating the potential benefit which Indonesia might be able to obtain from the international community in exchange for maintaining its biodiversity base. Examples of debt-for-nature swaps, one mechanism by which this value could be realised, are described in Section 3. Such a ‘value’ however, is hypothetical and is often dependent on the perceived threat to the ecosystem or species. Thus an ecosystem can apparently have greater value, not because of its scarcity, but because of its threatened loss.
Table 17. Parameters and valuation assumptions in valuing mangrove conversion, Bintuni Bay, Indonesia (Ruitenbeek, 1994). (Note: US$ 1 = Rp 2000.)
Impact or asset valued
Method and assumptions for valuation
Temporal linkages and scenarios
Total estimated maximum value
BENEFITS Direct benefits based on household survey and market prices.
Local use Hunting, gathering and manufacturing, estimates from survey.
Directly linked to area.
Local uses + sago value of Rp 20 billion per year.
Sago Market value Rp 300 per kg. Directly linked to area.
Fish Market value Rp 12,500 per kg.
Linked to area remaining with time lags.
Extension of commercial fisheries brings maximum of Rp 70 billion per year.
Erosion control Local agricultural production value Rp 1.9 million per ha.
Linked to area remaining with time lags.
Biodiversity Based on estimates of capturable revenue for biodiversity conservation from external sources.
Linked to area remaining with time lags.
COSTSTimber Market scenarios:
Chipwood prices Rp 80,000 per m3.
Scenarios from ban on logging, 25% -80% logging, clear cut within 20 years.
Maximum of Rp 40 billion per year.
- 73 -
The basis for the valuation of the losses of value, i.e., the benefits of conservation in Table 17, is the loss of productive assets. The value of a resource, as revealed by markets, is the change in expenditures on marketed goods and services due to a change in the supply of an environmental resource. To get to these changes in productivity, it is necessary to know the relationship between changes in the resource and the income derived from them. Ruitenbeek models these changes through two parameters: an impact intensity parameter (a) and an impact delay parameter (x), with the relationship between them being:
(Productivityt / Productivity^ = (Mangrove Areat.t / Mangrove Areat=0)a
Where the impact intensity, a, is 1, the change in productivity is proportional to the change in area, where a is greater than 1, impact on biodiversity value, for example, is greater than the proportional change In area. For the time lag parameter, the change in productivity as a result of change in area of mangrove can be delayed. Ruitenbeek (1994) shows the sensitivity of results, for example, for fisheries, for delays of 0, 5 and 10 years. This models the delay in the reproductive cycle of various species, and in their maturity to viable economic resources.
Mangrove Rehabilitation in Vietnam
A similar partial valuation has been undertaken for restoring mangrove forests, in areas where they probably previously existed in coastal northern Vietnam (Tri et al., 1996). Despite the trends in global loss of mangrove area, in many parts of the world, local initiatives by local Institutions are reversing the trend of wetland loss by undertaking wetland restoration or rehabilitation. Natural wetland restoration activities are undertaken for diverse reasons, such as for wastewater and storm water treatment (Kent,1994), utilising the nutrient cycling functions of wetlands, or for local resource use. Critical issues in promoting the adoption of such schemes, and hence their ultimate sustainability, include:
• the timing of the costs and benefits and the sensitivity of the economic appraisal of rehabilitation to discount rates;
• the benefits of reduction in maintenance of sea dikes, where mangroves are planted in front of existing sea defences; and
• the limit of the benefits of rehabilitation compared to conservation of existing wetlands.
This case study documents the economic rationale behind the mangrove rehabilitation in three coastal districts of Nam Ha in northern Vietnam. In these areas mangrove rehabilitation is subsidised by international development agencies through income generating projects (Hong and San, 1993), based largely on an assumed benefit to local communities. The desirability of wetland restoration is quantified using data on costs and benefits of some quantifiable functions and services. The source of the data and the delineation of costs and benefits is shown in Table 18. The direct benefits of rehabilitation include the value of the timber, as it becomes available through the first rotation of the mangrove stands, the other locally used products within the stands, including shellfish, and crabs, and honey from bee-keeping.
The major indirect benefit, and the principal reason for planting the stands, is in the role of stands in protecting the extensive sea-dike systems present along much of the low-lying deltaic coast of northern Vietnam. This indirect benefit is estimated through a model where the major parameters determining the value of the protection, valued at replacement cost through work days saved, are the width and age of the stand, and the local hydrological features. The deterministic model is calibrated for the area, and gives plausible results for regular maintenance costs. However, a further set of models would need to be developed to examine the impact of global change, such as change in the incidence of severe storms, or of mean sea level rise, for the area.
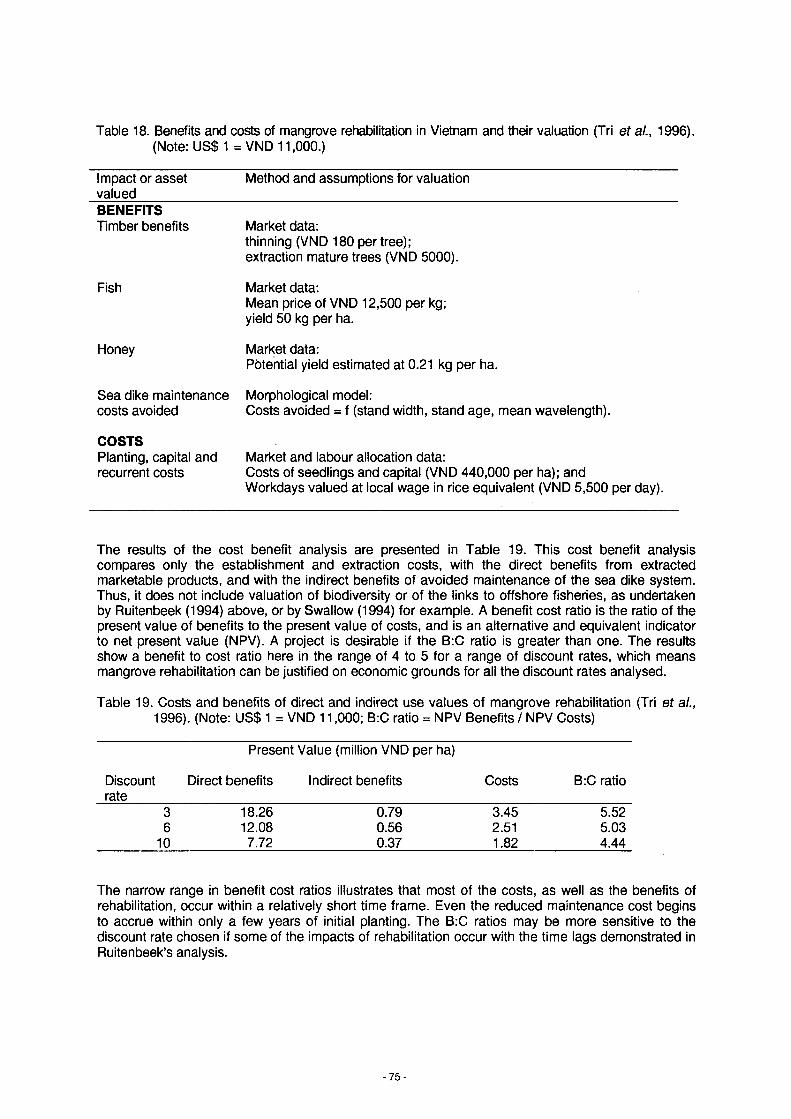
Table 18. Benefits and costs of mangrove rehabilitation in Vietnam and their valuation (Tri et al., 1996). (Note: US$1 =VND 11,000.)
Impact or asset valued
Method and assumptions for valuation
BENEFITSTimber benefits Market data:
thinning (VND 180 per tree); extraction mature trees (VND 5000).
Fish Market data:Mean price of VND 12,500 per kg; yield 50 kg per ha.
Honey Market data:Potential yield estimated at 0.21 kg per ha.
Sea dike maintenance Morphological model:costs avoided Costs avoided = f (stand width, stand age, mean wavelength).
COSTSPlanting, capital and Market and labour allocation data:recurrent costs Costs of seedlings and capital (VND 440,000 per ha); and
Workdays valued at local wage in rice equivalent (VND 5,500 per day).
The results of the cost benefit analysis are presented in Table 19. This cost benefit analysis compares only the establishment and extraction costs, with the direct benefits from extracted marketable products, and with the indirect benefits of avoided maintenance of the sea dike system. Thus, it does not include valuation of biodiversity or of the links to offshore fisheries, as undertaken by Ruitenbeek (1994) above, or by Swallow (1994) for example. A benefit cost ratio is the ratio of the present value of benefits to the present value of costs, and is an alternative and equivalent indicator to net present value (NPV). A project is desirable if the B:C ratio is greater than one. The results show a benefit to cost ratio here in the range of 4 to 5 for a range of discount rates, which means mangrove rehabilitation can be justified on economic grounds for all the discount rates analysed.
Table 19. Costs and benefits of direct and indirect use values of mangrove rehabilitation (Tri et al., 1996). (Note: US$ 1 = VND 11,000; B:C ratio = NPV Benefits / NPV Costs)
Discountrate
Present Value (million VND per ha)
Direct benefits Indirect benefits Costs B:C ratio
3 18.26 0.79 3.45 5.526 12.08 0.56 2.51 5.03
10 7.72 0.37 1.82 4.44
The narrow range in benefit cost ratios illustrates that most of the costs, as well as the benefits of rehabilitation, occur within a relatively short time frame. Even the reduced maintenance cost begins to accrue within only a few years of initial planting. The B:C ratios may be more sensitive to the discount rate chosen if some of the impacts of rehabilitation occur with the time lags demonstrated in Ruitenbeek’s analysis.
-7 5 -
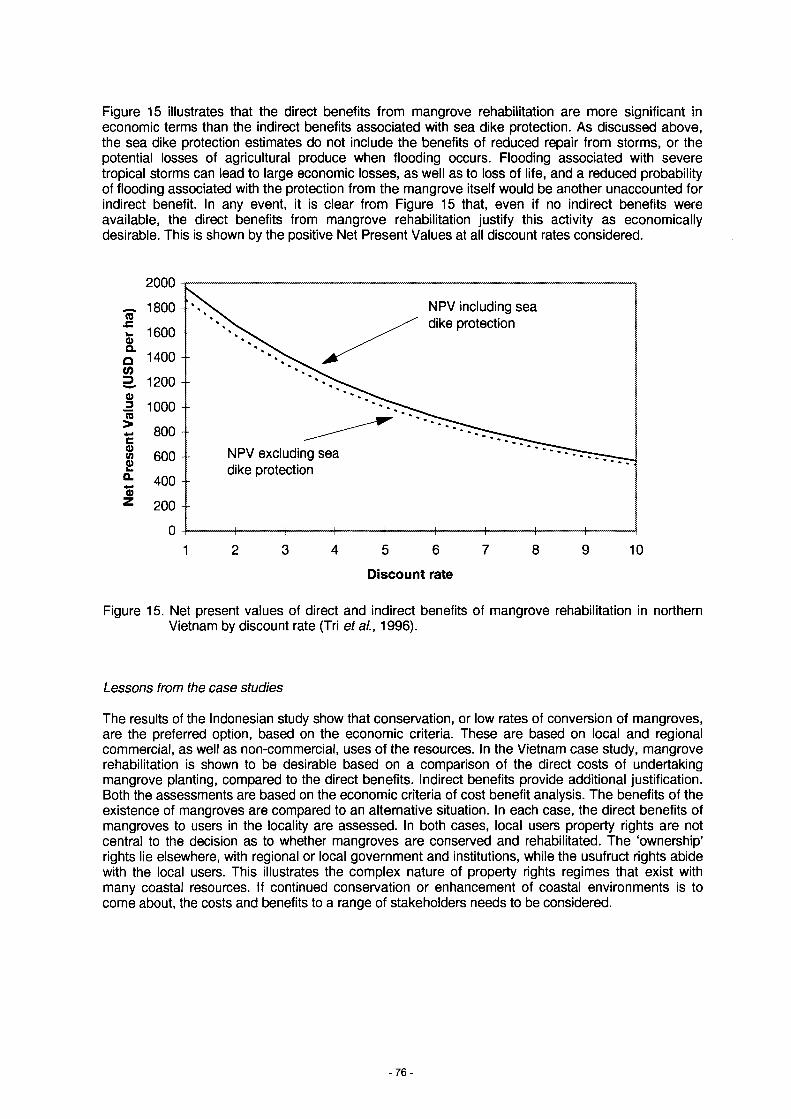
Figure 15 illustrates that the direct benefits from mangrove rehabilitation are more significant in economic terms than the indirect benefits associated with sea dike protection. As discussed above, the sea dike protection estimates do not include the benefits of reduced repair from storms, or the potential losses of agricultural produce when flooding occurs. Flooding associated with severe tropical storms can lead to large economic losses, as well as to loss of life, and a reduced probability of flooding associated with the protection from the mangrove itself would be another unaccounted for indirect benefit. In any event, it is clear from Figure 15 that, even if no indirect benefits were available, the direct benefits from mangrove rehabilitation justify this activity as economically desirable. This is shown by the positive Net Present Values at all discount rates considered.
NPV including sea dike protection
~ 1800 (0w 1600 0)Û 1400 (O2 . 1200Ü 1000 <0
> 8004- *C(D0)£
NPV excluding sea dike protection
600
400
Discount rate
Figure 15. Net present values of direct and indirect benefits of mangrove rehabilitation in northern Vietnam by discount rate (Tri eta!., 1996).
Lessons from the case studies
The results of the Indonesian study show that conservation, or low rates of conversion of mangroves, are the preferred option, based on the economic criteria. These are based on local and regional commercial, as well as non-commercial, uses of the resources. In the Vietnam case study, mangrove rehabilitation is shown to be desirable based on a comparison of the direct costs of undertaking mangrove planting, compared to the direct benefits. Indirect benefits provide additional justification. Both the assessments are based on the economic criteria of cost benefit analysis. The benefits of the existence of mangroves are compared to an alternative situation. In each case, the direct benefits of mangroves to users in the locality are assessed. In both cases, local users property rights are not central to the decision as to whether mangroves are conserved and rehabilitated. The ‘ownership’ rights lie elsewhere, with regional or local government and institutions, while the usufruct rights abide with the local users. This illustrates the complex nature of property rights regimes that exist with many coastal resources. If continued conservation or enhancement of coastal environments is to come about, the costs and benefits to a range of stakeholders needs to be considered.
- 7 6 -
4.5 Case Study 5 - Tokvo Bav. Japan
Introduction
Tokyo Bay is located approximately at the centre of the Japan archipelago, \Mth its mouth opening to the Pacific Ocean. Over the period 1945-1980s environmental pressures have intensified in and around the Bay region (Bovver and Takao, 1993). By the end of the 1980s the Bay was subject to multiple and conflicting resource usage demands, waste disposal, both industrial and solid waste, land reclamation for port and industrial activities, marine transport, commercial fishing and recreation.
This case study is based on an analysis which sought to determine what mix of uses, and therefore outputs, from Tokyo Bay would yield maximum net social benefits to Japanese society. The analysis requires that the costs and benefits of each mix be estimated. Scenario analysis was utilised, covering environmental change over the period 1980-2000. Alternative futures, mixes of outputs, reflecting both different economic-demographic projections and governmental actions were formulated and analysed. The output mixes were based on estimates of the various demands for uses of Tokyo Bay.
Analyses were made at two points in time, 1980 (the base year) and 2000, with all benefits and costs expressed in terms of the 1980 price level.
Net benefits criterion
The only decision criterion used in the evaluation was net benefits. In the ‘real world’ other criteria would also be of importance to policy makers, such as the distribution of costs and benefits, legal feasibility, etc. A set of cases was defined, in order to explore the implications of alternative mixes of uses in terms of set benefits to society. A case was defined as a combination of values of scenario variables, S, and policy variables, P, and where relevant, related assumptions. S variables were population and industrial activity in the Tokyo Bay region. P variables were government actions which directly affected the utilisation of Tokyo Bay, e.g., waste disposal regulations, and recreational site provision.
Environmental change scenarios
Three scenarios were defined, each one based on a combination of the level of population and the level of industrial activity. These scenarios were characterised as:
S-0 = no charge from base year 1980;S-1 = moderate growth in both population and industrial activity;S-2 = rapid growth in both population and industrial activity.
The policy variables chosen involved three different liquid waste disposal policies based on waste disposal volumes entering the Bay (LW-0, LW-1, and LW-2). These different policies then produce, via a water quality model, different quality effluent in terms of chemical oxygen demand and dissolved inorganic nitrogen in Bay waters. Future work on linking such analyses directly with the LOICZ biogeochemical modelling techniques for budgeting the fluxes of nutrients in coastal waters may provide a useful way to establish the linkages between the environmental and resource assessment activities of LOICZ (Gordon et al. 1996).
The model revealed that substantial reductions in load were required before any significant Improvement in ambient water quality is achieved. The varying Bay water quality status in turn influence the type and extent of water-based recreation activity.
The study assumed that the demands for various types of water-oriented recreational activities would increase substantially over the period of the analysis, as a function of increased leisure time and increased per capita income. However, satisfying those demands depends on maintaining ambient water quality and providing access to recreational facilities. Possible governmental actions to respond to that demand involve conversion of old-fashioned and economically obsolete port facilities from marine transport use to recreation use and the development of specific recreational facilities
- 77 -
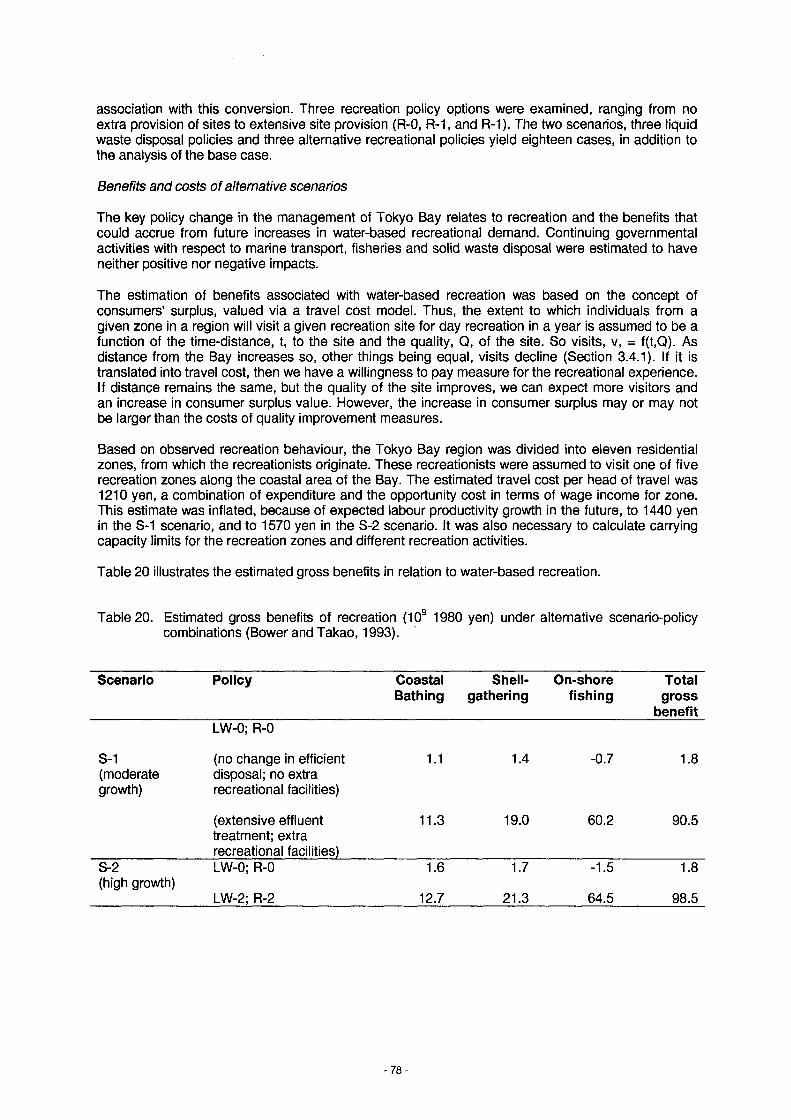
association with this conversion. Three recreation policy options were examined, ranging from no extra provision of sites to extensive site provision (R-0, R-1, and R-1). The two scenarios, three liquid waste disposal policies and three alternative recreational policies yield eighteen cases, in addition to the analysis of the base case.
Benefits and costs of alternative scenarios
The key policy change in the management of Tokyo Bay relates to recreation and the benefits that could accrue from future increases in water-based recreational demand. Continuing governmental activities with respect to marine transport, fisheries and solid waste disposal were estimated to have neither positive nor negative impacts.
The estimation of benefits associated with water-based recreation was based on the concept of consumers’ surplus, valued via a travel cost model. Thus, the extent to which individuals from a given zone in a region will visit a given recreation site for day recreation in a year is assumed to be a function of the time-distance, t, to the site and the quality, Q, of the site. So visits, v, = f(t,Q). As distance from the Bay increases so, other things being equal, visits decline (Section 3.4.1). If it is translated into travel cost, then we have a willingness to pay measure for the recreational experience. If distance remains the same, but the quality of the site improves, we can expect more visitors and an increase in consumer surplus value. However, the increase in consumer surplus may or may not be larger than the costs of quality improvement measures.
Based on observed recreation behaviour, the Tokyo Bay region was divided into eleven residential zones, from which the recreationists originate. These recreationists were assumed to visit one of five recreation zones along the coastal area of the Bay. The estimated travel cost per head of travel was 1210 yen, a combination of expenditure and the opportunity cost in terms of wage income for zone. This estimate was inflated, because of expected labour productivity growth in the future, to 1440 yen in the S-1 scenario, and to 1570 yen in the S-2 scenario. It was also necessary to calculate carrying capacity limits for the recreation zones and different recreation activities.
Table 20 illustrates the estimated gross benefits in relation to water-based recreation.
Table 20. Estimated gross benefits of recreation (109 1980 yen) under alternative scenario-policy combinations (Bower and Takao, 1993).
Scenario Policy CoastalBathing
Shell-gathering
On-shorefishing
Totalgross
benefitLW-0; R-0
S-1(moderategrowth)
(no change in efficient disposal; no extra recreational facilities)
1.1 1.4 -0.7 1.8
(extensive effluent treatment; extra recreational facilities)
11.3 19.0 60.2 90.5
S-2(high growth)
LW-0; R-0 1.6 1.7 -1.5 1.8
LW-2; R-2 12.7 21.3 64.5 98.5
-7 8 -
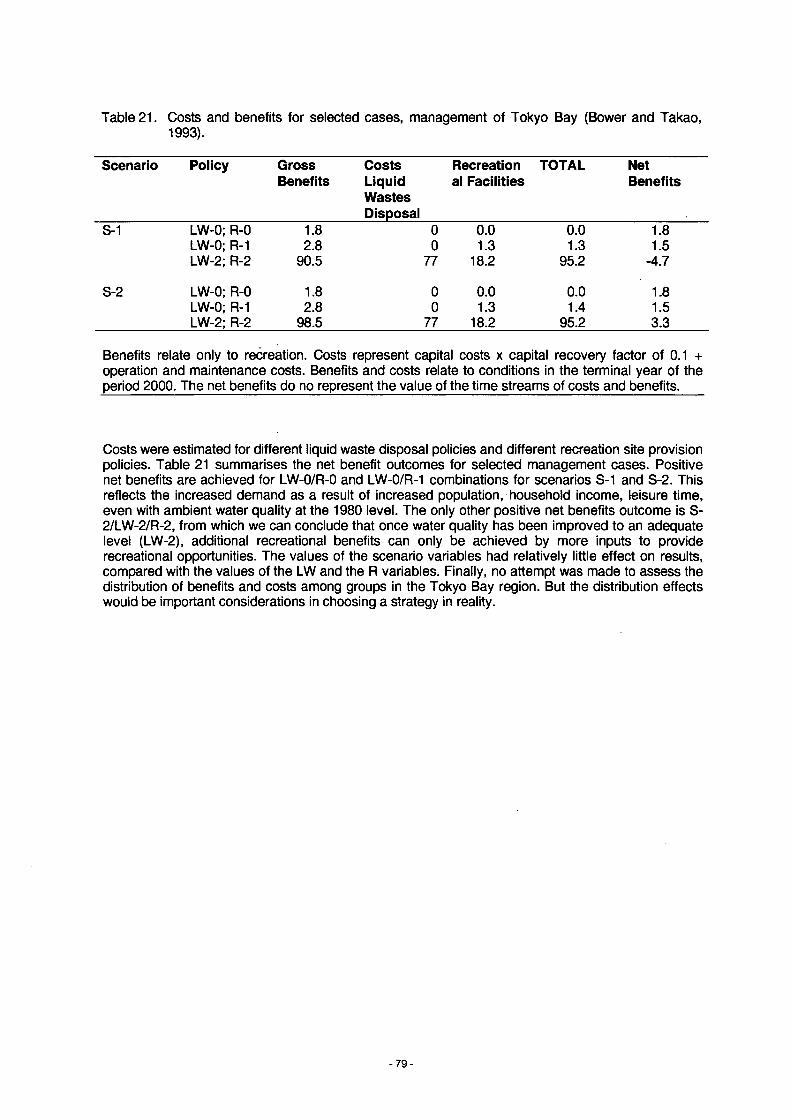
Table 21. Costs and benefits for selected cases, management of Tokyo Bay (Bower and Takao, 1993).
Scenario Policy GrossBenefits
CostsLiquidWastesDisposal
Recreation al Facilities
TOTAL NetBenefits
S-1 LW-0; R-0 1.8 0 0.0 0.0 1.8LW-0; R-1 2.8 0 1.3 1.3 1.5LW-2; R-2 90.5 77 18.2 95.2 -4.7
S-2 LW-0; R-0 1.8 0 0.0 0.0 1.8LW-0; R-1 2.8 0 1.3 1.4 1.5LW-2; R-2 98.5 77 18.2 95.2 3.3
Benefits relate only to recreation. Costs represent capital costs x capital recovery factor of 0.1 + operation and maintenance costs. Benefits and costs relate to conditions in the terminal year of the period 2000. The net benefits do no represent the value of the time streams of costs and benefits.
Costs were estimated for different liquid waste disposal policies and different recreation site provision policies. Table 21 summarises the net benefit outcomes for selected management cases. Positive net benefits are achieved for LW-O/R-O and LW-0/R-1 combinations for scenarios S-1 and S-2. This reflects the increased demand as a result of increased population, household income, leisure time, even with ambient water quality at the 1980 level. The only other positive net benefits outcome is S- 2/LW-2/R-2, from which we can conclude that once water quality has been improved to an adequate level (LW-2), additional recreational benefits can only be achieved by more inputs to provide recreational opportunities. The values of the scenario variables had relatively little effect on results, compared with the values of the LW and the R variables. Finally, no attempt was made to assess the distribution of benefits and costs among groups in the Tokyo Bay region. But the distribution effects would be important considerations in choosing a strategy in reality.
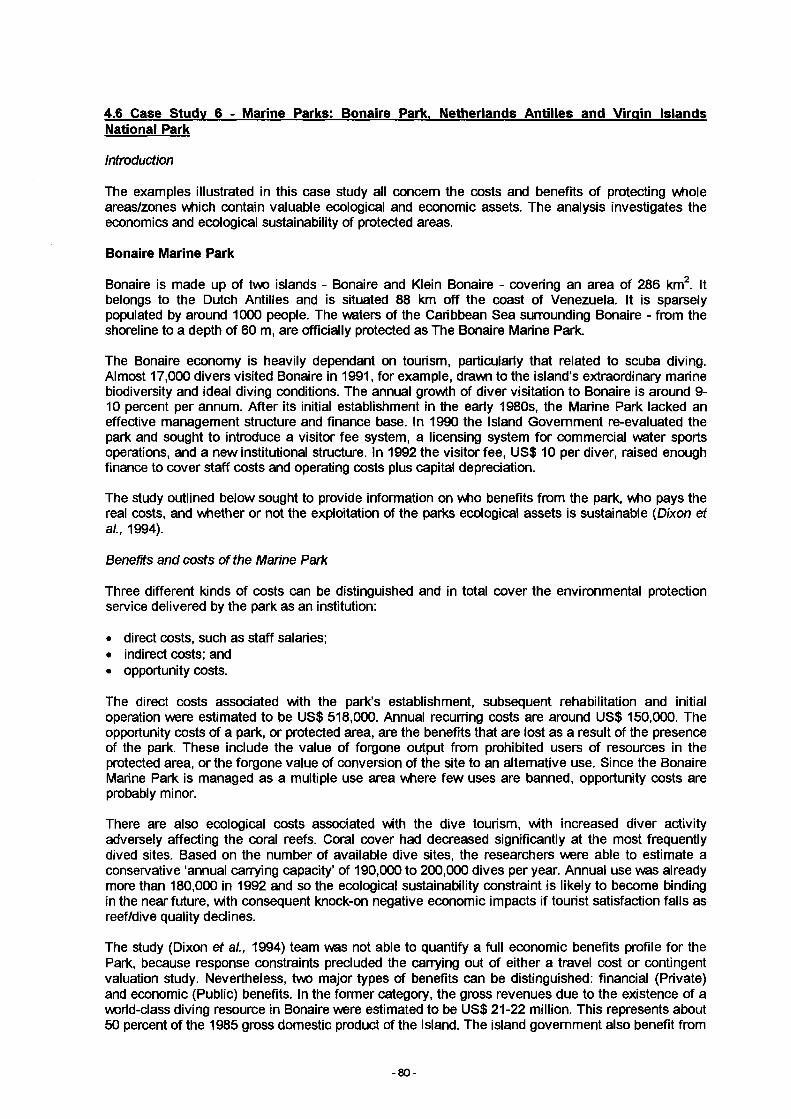
4.6 Case Study 6 - Marine Parks: Bonaire Park. Netherlands Antilles and Virgin islands National Park
Introduction
The examples illustrated in this case study all concern the costs and benefits of protecting whole areas/zones which contain valuable ecological and economic assets. The analysis investigates the economics and ecological sustainability of protected areas.
Bonaire Marine Park
Bonaire is made up of two islands - Bonaire and Klein Bonaire - covering an area of 286 km2. It belongs to the Dutch Antilles and is situated 88 km off the coast of Venezuela. It is sparsely populated by around 1000 people. The waters of the Caribbean Sea surrounding Bonaire - from the shoreline to a depth of 60 m, are officially protected as The Bonaire Marine Park.
The Bonaire economy is heavily dependant on tourism, particularly that related to scuba diving. Almost 17,000 divers visited Bonaire in 1991, for example, drawn to the island’s extraordinary marine biodiversity and ideal diving conditions. The annual growth of diver visitation to Bonaire is around 9- 10 percent per annum. After its initial establishment in the early 1980s, the Marine Park lacked an effective management structure and finance base. In 1990 the Island Government re-evaluated the park and sought to introduce a visitor fee system, a licensing system for commercial water sports operations, and a new institutional structure. In 1992 the visitor fee, US$ 10 per diver, raised enough finance to cover staff costs and operating costs plus capital depreciation.
The study outlined below sought to provide information on who benefits from the park, who pays the real costs, and whether or not the exploitation of the parks ecological assets is sustainable (Dixon et al., 1994).
Benefits and costs of the Marine Park
Three different kinds of costs can be distinguished and in total cover the environmental protection service delivered by the park as an institution:
• direct costs, such as staff salaries;• indirect costs; and• opportunity costs.
The direct costs associated with the park’s establishment, subsequent rehabilitation and initial operation were estimated to be US$ 518,000. Annual recurring costs are around US$ 150,000. The opportunity costs of a park, or protected area, are the benefits that are lost as a result of the presence of the park. These include the value of forgone output from prohibited users of resources in the protected area, or the forgone value of conversion of the site to an alternative use. Since the Bonaire Marine Park is managed as a multiple use area where few uses are banned, opportunity costs are probably minor.
There are also ecological costs associated with the dive tourism, with increased diver activity adversely affecting the coral reefs. Coral cover had decreased significantly at the most frequently dived sites. Based on the number of available dive sites, the researchers were able to estimate a conservative ‘annual carrying capacity’ of 190,000 to 200,000 dives per year. Annual use was already more than 180,000 in 1992 and so the ecological sustainability constraint is likely to become binding in the near future, with consequent knock-on negative economic impacts if tourist satisfaction falls as reef/dive quality declines.
The study (Dixon et al., 1994) team was not able to quantify a full economic benefits profile for the Park, because response constraints precluded the carrying out of either a travel cost or contingent valuation study. Nevertheless, two major types of benefits can be distinguished: financial (Private) and economic (Public) benefits. In the former category, the gross revenues due to the existence of a world-class diving resource in Bonaire were estimated to be US$ 21-22 million. This represents about 50 percent of the 1985 gross domestic product of the Island. The island government also benefit from
- 80 -
the Park through the collection of taxes. Table 22 lists the main revenues and costs associated with the Park. It is also important to note that because of the domination of offshore tourism packages, only a small portion of gross revenues generated by dive tourism effectively remains in Bonaire.
A survey undertaken in late 1991 also indicated that some consumer surplus value was also present in the dive tourism market. A survey of divers indicated that 92 percent of them agreed that the US$ 10/diver/year fee was reasonable. Some 80 percent of the sample agreed to pay US$ 20, 48 percent as much as US$ 30 and 16 percent up to US$ 50. There is therefore an average willingness to pay value of US$ 27.4. This value could only practically be captured by a perfectly discriminating price setter and charging each visiting diver their entire WTP for park use. Since this is not practical, the admission fee captures only part of the WTP value. The difference between what people are willing to pay and what they actually pay is known as consumer surplus. This value is of course not observed in market-transactions and, in the case of Bonaire, is not captured by dive operators or hotels. However, it is an important economic value, which on the basis of 1992 dive visitation and fee rates, amounts, in total, to US$ 512,000 per year, of which consumer surplus is US$ 325,000.
Table 22. Bonaire Marine Park: Revenues and costs (1991 US$) (Dixon et al., 1994).
REVENUES US$ (Millions)
Direct RevenueDiver fees (1992) 0.19
Indirect Revenues (gross) 10.4HotelsDiver operation (sales) 4.8Support services 4.7Local air transport 3.3
Subtotal 23.2
COSTS
Costs of ProtectionDirect costs 0.52Indirect costs ?Opportunity costs ?
Conclusions
The Park provides a good example of an area where biodiversity conservation and economic development have until recently been mutually reinforcing. The exploitation of the marine ecology has seemed to yield sustainable income for the island’s economy. But continued close monitoring of the health of the reefs as a function of the number of divers is vital. An approximate carrying capacity has been established and should not be breached either in terms of total dives or in effluent disposal practices. It may also be possible to reduce the ecological stress imposed on the reef system by each dive through improved management. Measures such as dive site rotation, better spacing of divers and regulation of underwater photography would help to distribute the stress burden more evenly across the ecosystem. Finally, changes in the type and style of tourism would help to retain more of the current gross tourism revenues, with current visitation rates, within the Bonaire domestic economy.
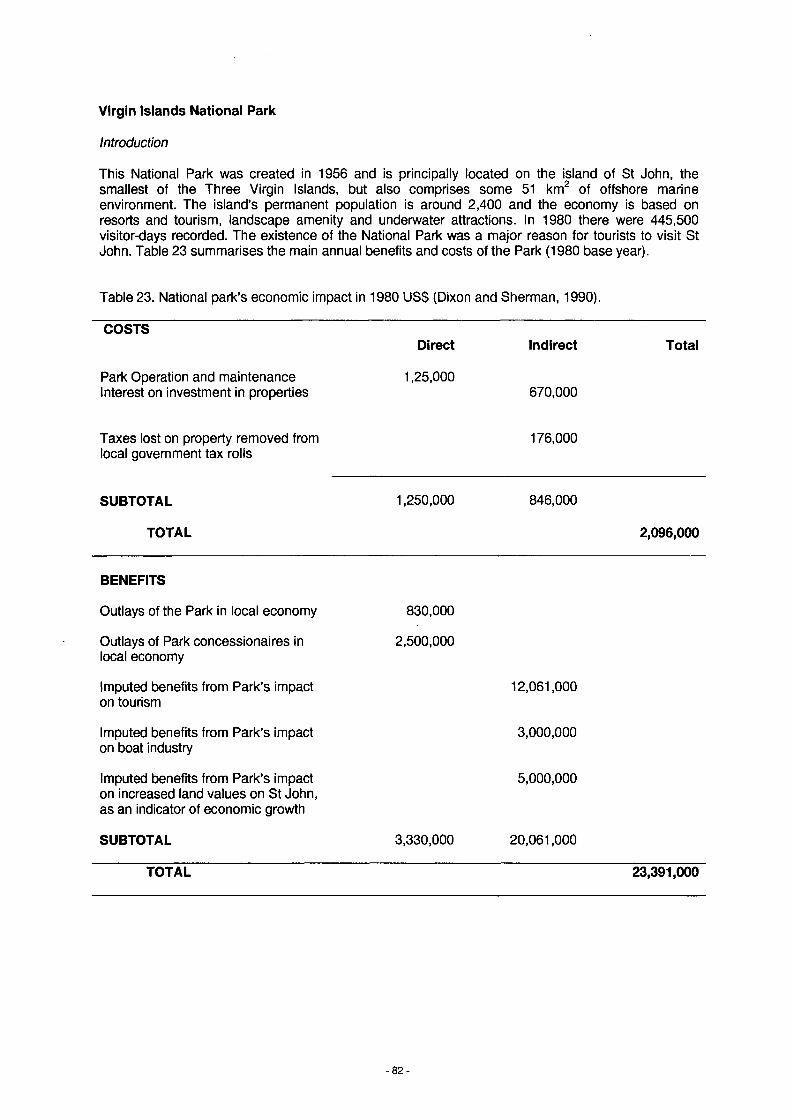
Virgin Islands National Park
Introduction
This National Park was created in 1956 and is principally located on the island of St John, the smallest of the Three Virgin Islands, but also comprises some 51 km2 of offshore marine environment. The island’s permanent population is around 2,400 and the economy is based on resorts and tourism, landscape amenity and underwater attractions. In 1980 there were 445,500 visitor-days recorded. The existence of the National Park was a major reason for tourists to visit St John. Table 23 summarises the main annual benefits and costs of the Park (1980 base year).
Table 23. National park’s economic impact in 1980 US$ (Dixon and Sherman, 1990).
COSTSDirect Indirect Total
Park Operation and maintenance 1,25,000Interest on investment in properties 670,000
Taxes lost on property removed from 176,000local government tax rolls
SUBTOTAL 1,250,000 846,000
TOTAL 2,096,000
BENEFITS
Outlays of the Park in local economy 830,000
Outlays of Park concessionaires in 2,500,000local economy
Imputed benefits from Park’s impact on tourism
Imputed benefits from Park’s impact on boat industry
Imputed benefits from Park’s impact on increased land values on St John, as an indicator of economic growth
SUBTOTAL 3,330,000
12,061,000
3.000.000
5.000.000
20,061,000
TOTAL 23,391,000
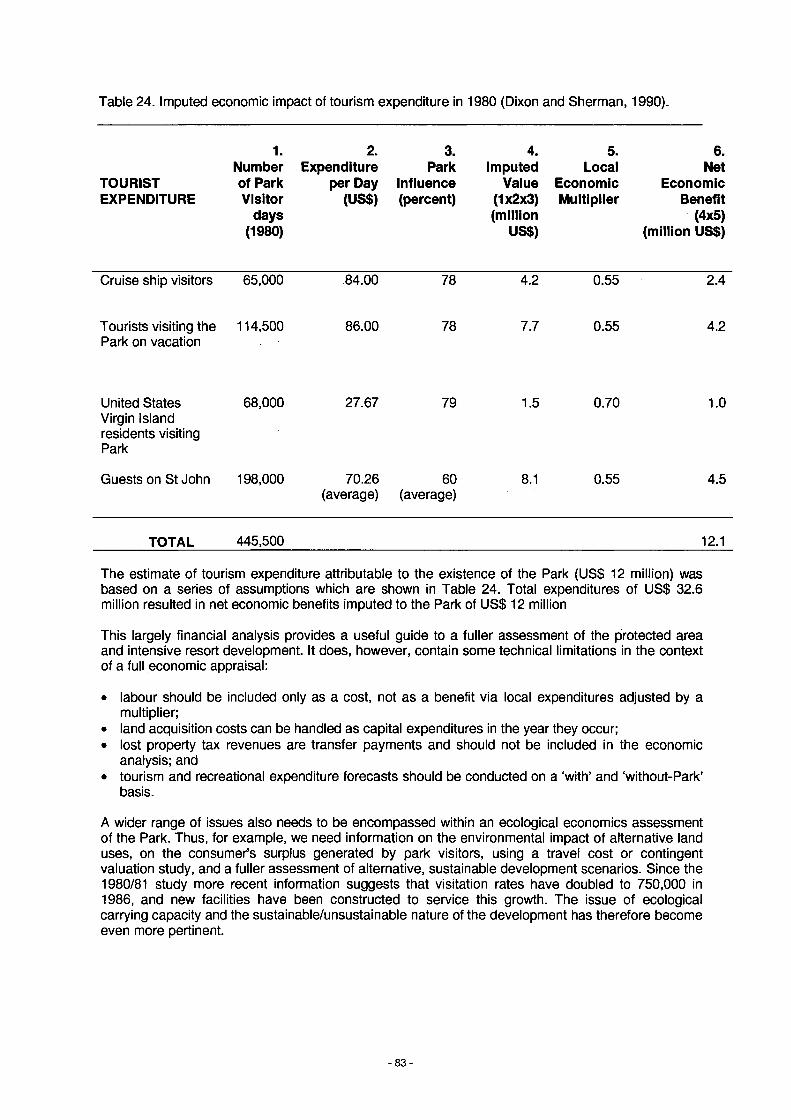
Table 24. Imputed economic Impact of tourism expenditure in 1980 (Dixon and Sherman, 1990).
TOURISTEXPENDITURE
1.Number of Park Visitor
days (1980)
2.Expenditure
per Day (US$)
3.Park
Influence(percent)
4.Imputed
Value(1x2x3)(million
US$)
5.Local
EconomicMultiplier
6. Net
Economic Benefit
(4x5) (million US$)
Cruise ship visitors 65,000 84.00 78 4.2 0.55 2.4
Tourists visiting the Park on vacation
114,500 86.00 78 7.7 0.55 4.2
United States Virgin Island residents visiting Park
68,000 27.67 79 1.5 0.70 1.0
Guests on St John 198,000 70.26(average)
60(average)
8.1 0.55 4.5
TOTAL 445,500 12.1
The estimate of tourism expenditure attributable to the existence of the Park (US$ 12 million) was based on a series of assumptions which are shown in Table 24. Total expenditures of US$ 32.6 million resulted in net economic benefits imputed to the Park of US$ 12 million
This largely financial analysis provides a useful guide to a fuller assessment of the protected area and intensive resort development. It does, however, contain some technical limitations in the context of a full economic appraisal:
• labour should be included only as a cost, not as a benefit via local expenditures adjusted by a multiplier;
• land acquisition costs can be handled as capital expenditures in the year they occur;• lost property tax revenues are transfer payments and should not be included in the economic
analysis; and• tourism and recreational expenditure forecasts should be conducted on a ‘with’ and ‘without-Park’
basis.
A wider range of issues also needs to be encompassed within an ecological economics assessment of the Park. Thus, for example, we need information on the environmental impact of alternative land uses, on the consumer’s surplus generated by park visitors, using a travel cost or contingent valuation study, and a fuller assessment of alternative, sustainable development scenarios. Since the 1980/81 study more recent information suggests that visitation rates have doubled to 750,000 in 1986, and new facilities have been constructed to service this growth. The issue of ecological carrying capacity and the sustainable/unsustainable nature of the development has therefore become even more pertinent.
- 8 3 -
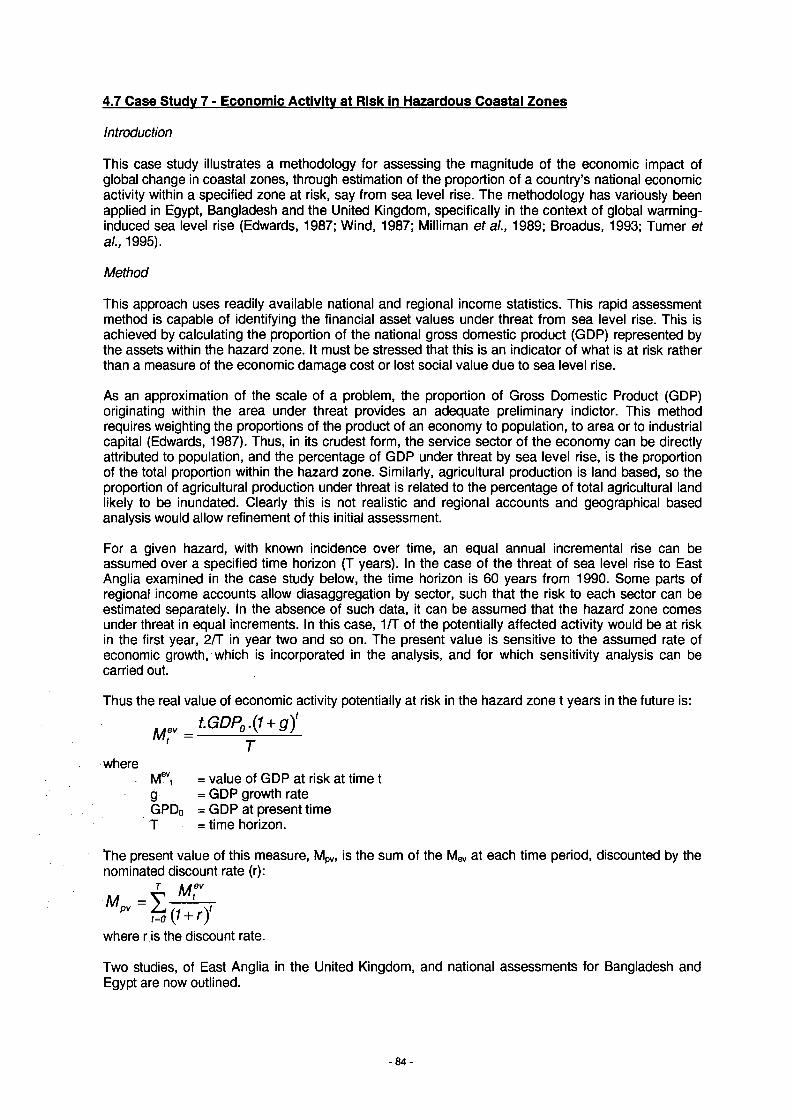
4.7 Case Study 7 - Economic Activity at Risk in Hazardous Coastal Zones
Introduction
This case study illustrates a methodology for assessing the magnitude of the economic impact of global change in coastal zones, through estimation of the proportion of a country’s national economic activity within a specified zone at risk, say from sea level rise. The methodology has variously been applied in Egypt, Bangladesh and the United Kingdom, specifically in the context of global warming- induced sea level rise (Edwards, 1987; Wind, 1987; Milliman et al., 1989; Broadus, 1993; Turner et ai, 1995).
This approach uses readily available national and regional income statistics. This rapid assessment method is capable of identifying the financial asset values under threat from sea level rise. This is achieved by calculating the proportion of the national gross domestic product (GDP) represented by the assets within the hazard zone. It must be stressed that this is an indicator of what is at risk rather than a measure of the economic damage cost or lost social value due to sea level rise.
As an approximation of the scale of a problem, the proportion of Gross Domestic Product (GDP) originating within the area under threat provides an adequate preliminary indictor. This method requires weighting the proportions of the product of an economy to population, to area or to industrial capital (Edwards, 1987). Thus, in its crudest form, the service sector of the economy can be directly attributed to population, and the percentage of GDP under threat by sea level rise, is the proportion of the total proportion within the hazard zone. Similarly, agricultural production is land based, so the proportion of agricultural production under threat is related to the percentage of total agricultural land likely to be inundated. Clearly this is not realistic and regional accounts and geographical based analysis would allow refinement of this initial assessment.
For a given hazard, with known incidence over time, an equal annual incremental rise can be assumed over a specified time horizon (T years). In the case of the threat of sea level rise to East Anglia examined in the case study below, the time horizon is 60 years from 1990. Some parts of regional income accounts allow diasaggregation by sector, such that the risk to each sector can be estimated separately. In the absence of such data, it can be assumed that the hazard zone comes under threat in equal increments. In this case, 1/T of the potentially affected activity would be at risk in the first year, 2/T in year two and so on. The present value is sensitive to the assumed rate of economic growth, which is incorporated in the analysis, and for which sensitivity analysis can be carried out.
Thus the real value of economic activity potentially at risk in the hazard zone t years in the future is:
whereM^t = value of GDP at risk at time tg = GDP growth rateGPD0 = GDP at present timeT = time horizon.
The present value of this measure, Mpv, is the sum of the at each time period, discounted by the nominated discount rate (r):
Method
, f„ t.GDP0.(1 + g )'IVIt - T
where r is the discount rate.
Two studies, of East Anglia in the United Kingdom, and national assessments for Bangladesh and Egypt are now outlined.
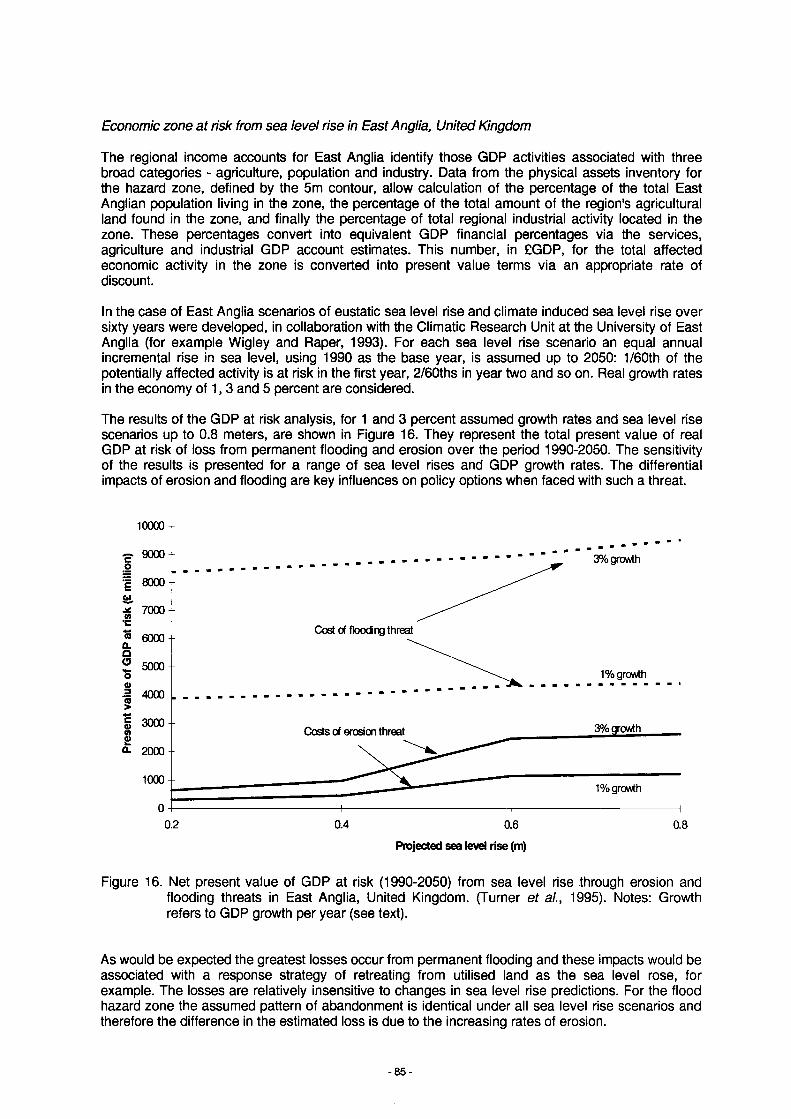
Economic zone at risk from sea level rise in East Anglia, United Kingdom
The regional income accounts for East Anglia identify those GDP activities associated with three broad categories - agriculture, population and industry. Data from the physical assets inventory for the hazard zone, defined by the 5m contour, allow calculation of the percentage of the total East Anglian population living in the zone, the percentage of the total amount of the region's agricultural land found in the zone, and finally the percentage of total regional industrial activity located in the zone. These percentages convert into equivalent GDP financial percentages via the services, agriculture and industrial GDP account estimates. This number, in £GDP, for the total affected economic activity in the zone is converted into present value terms via an appropriate rate of discount.
In the case of East Anglia scenarios of eustatic sea level rise and climate induced sea level rise over sixty years were developed, in collaboration with the Climatic Research Unit at the University of East Anglia (for example Wigley and Raper, 1993). For each sea level rise scenario an equal annual incremental rise in sea level, using 1990 as the base year, is assumed up to 2050: 1/60th of the potentially affected activity is at risk in the first year, 2/60ths in year two and so on. Real growth rates in the economy of 1,3 and 5 percent are considered.
The results of the GDP at risk analysis, for 1 and 3 percent assumed growth rates and sea level rise scenarios up to 0.8 meters, are shown in Figure 16. They represent the total present value of real GDP at risk of loss from permanent flooding and erosion over the period 1990-2050. The sensitivity of the results is presented for a range of sea level rises and GDP growth rates. The differential impacts of erosion and flooding are key influences on policy options when faced with such a threat.
10000 t
ç 9000 -01 8000 - &
7000-
3% growth
co•ECost of flooding threat* 6000- Q.a
° 5000 -O<D■i 4000 i SS 3000 -
1% growth
3% growthCosts of erosion threat
2000-
1000-1% growth
0.40.2 0.6 0.8Projected sea level rise (m)
Figure 16. Net present value of GDP at risk (1990-2050) from sea level rise through erosion and flooding threats in East Anglia, United Kingdom. (Turner et al., 1995). Notes: Growth refers to GDP growth per year (see text).
As would be expected the greatest losses occur from permanent flooding and these impacts would be associated with a response strategy of retreating from utilised land as the sea level rose, for example. The losses are relatively insensitive to changes in sea level rise predictions. For the flood hazard zone the assumed pattern of abandonment is identical under all sea level rise scenarios and therefore the difference in the estimated loss is due to the increasing rates of erosion.
- 8 5 -
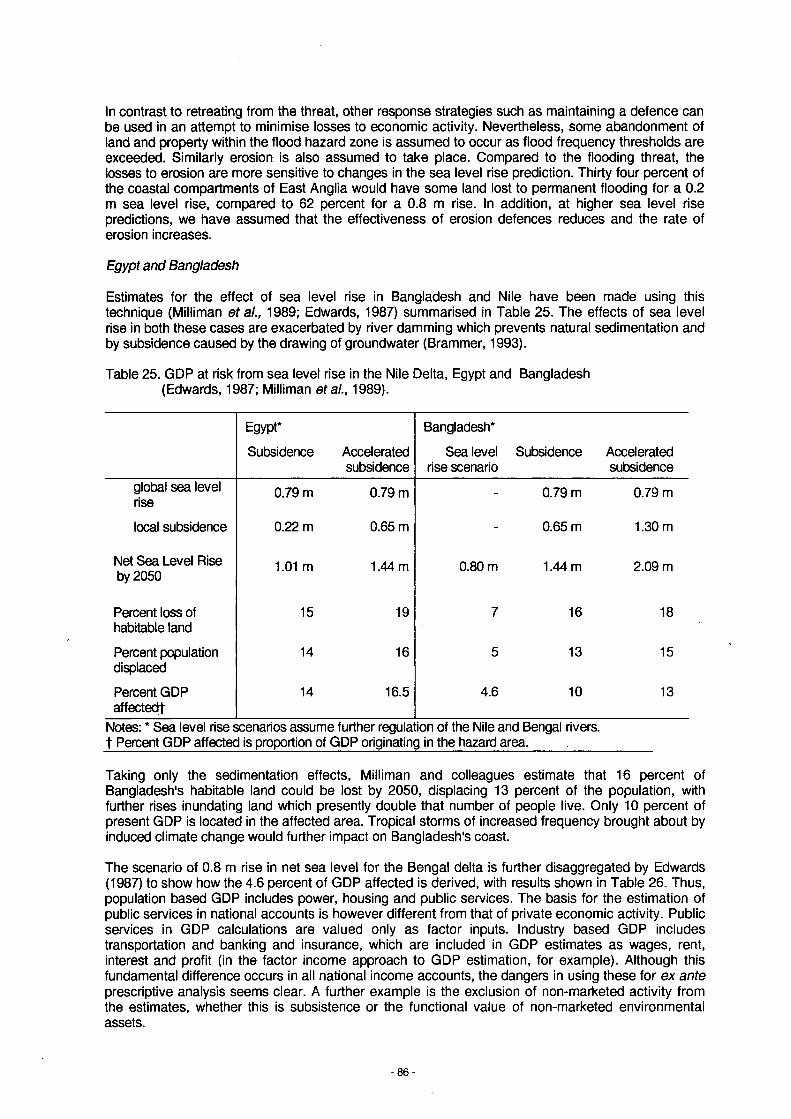
In contrast to retreating from the threat, other response strategies such as maintaining a defence can be used in an attempt to minimise losses to economic activity. Nevertheless, some abandonment of land and property within the flood hazard zone is assumed to occur as flood frequency thresholds are exceeded. Similarly erosion is also assumed to take place. Compared to the flooding threat, the losses to erosion are more sensitive to changes in the sea level rise prediction. Thirty four percent of the coastal compartments of East Anglia would have some land lost to permanent flooding for a 0.2 m sea level rise, compared to 62 percent for a 0.8 m rise. In addition, at higher sea level rise predictions, we have assumed that the effectiveness of erosion defences reduces and the rate of erosion increases.
Egypt and Bangladesh
Estimates for the effect of sea level rise in Bangladesh and Nile have been made using this technique (Milliman et al., 1989; Edwards, 1987) summarised in Table 25. The effects of sea level rise in both these cases are exacerbated by river damming which prevents natural sedimentation and by subsidence caused by the drawing of groundwater (Brammer, 1993).
Table 25. GDP at risk from sea level rise in the Nile Delta, Egypt and Bangladesh (Edwards, 1987; Milliman eta!., 1989).
Egypt*
Subsidence Acceleratedsubsidence
Bangladesh*
Sea level rise scenario
Subsidence Acceleratedsubsidence
global sea level rise
0.79 m 0.79 m - 0.79 m 0.79 m
local subsidence 0.22 m 0.65 m - 0.65 m 1.30 m
Net Sea Level Rise by 2050
1.01 m 1.44 m 0.80 m 1.44 m 2.09 m
Percent loss of habitable land
15 19 7 16 18
Percent population displaced
Percent GDP affectedt
14
14
16
16.5
5
4.6
13
10
15
13
Notes: * Sea level rise scenarios assume further regulation of the Nile and Bengal rivers. t Percent GDP affected is proportion of GDP originating in the hazard area. .
Taking only the sedimentation effects, Milliman and colleagues estimate that 16 percent of Bangladesh's habitable land could be lost by 2050, displacing 13 percent of the population, with further rises inundating land which presently double that number of people live. Only 10 percent of present GDP is located in the affected area. Tropical storms of increased frequency brought about by induced climate change would further impact on Bangladesh's coast.
The scenario of 0.8 m rise in net sea level for the Bengal delta is further disaggregated by Edwards (1987) to show how the 4.6 percent of GDP affected is derived, with results shown in Table 26. Thus, population based GDP includes power, housing and public services. The basis for the estimation of public services in national accounts is however different from that of private economic activity. Public services in GDP calculations are valued only as factor inputs. Industry based GDP includes transportation and banking and insurance, which are included in GDP estimates as wages, rent, interest and profit (in the factor income approach to GDP estimation, for example). Although this fundamental difference occurs in all national income accounts, the dangers in using these for ex ante prescriptive analysis seems clear. A further example is the exclusion of non-marketed activity from the estimates, whether this is subsistence or the functional value of non-marketed environmental assets.
Table 26. GDP affected by projected 0.8 m sea level rise by 2050 in the Bengal Delta (Edwards, 1987).
GDP 1988 GDP affected Percent of total(US$ Billion) (percentage)_______________
Area based GDP (agriculture) 7.74 0.54 7.0
Population based GDP 2.92 0.15 5.0
Industry based GDP 5.82 0.06 1.0
Overall 16.48 0.75 4.6
Limitations of the approach
Major drawbacks which may limit the usefulness of this technique concern adaptive behaviour to hazards in coastal zones and the interpretation of the measured national accounts. Firstly, accounting for the proportion of GNP in the hazard zone is a mechanical approach which does not take into account mitigation strategies or adaptive responses, such as gradual population migration or changes in economic activities, future economic or population growth. Thus, the GDP at risk method gives only a static and ‘relative magnitude’ indicator for particular threats in coastal zones. It generally can only be undertaken at national or regional (within a country) level, which reflect the income data collection and availability.
Secondly, national accounts, the base from which the estimates are made, have long been argued to be inaccurate indicators of national welfare because of the significance of non-marketed activity in the economy. Such activities as environmental assets, subsistence agriculture and non-formal sector activities are excluded from traditional measures of economic activity. They may be significant in coastal zones. Selective anomalies regarding environmental assets, such as the pricing decline of non-renewable resources and certain renewables, are currently being revised in the UN System of National Accounts (for example, Lutz, 1993). But the functional, and other benefits, of non-marketed environmental assets do not fit easily into an accounting system.
Additionally, an accounting measure will not identify strategies to deal with the object of analysis, sea level rise in this case, rather it may give a ‘precautionary indicator’ of a critical environmental and resource problem, and is complementary to other techniques.
- 8 7 -
4.8 Case Study 8 - Usina the Common Methodology to Global Change Impacts in Coastal Zones
Approach
The Coastal Zone Management Subgroup of Intergovernmental Panel on Climate Change (IPCC) has developed guidelines for the assessment of vulnerability of coastal zones, primarily in biophysical terms, to climate-induced sea level rise. The guidelines include the formulation of potential adaptive response strategies (IPCC, 1994). The methodology and approach are discussed in Section 2. The analysis in this case study broadly applies the CZMS 'Common Methodology', adapting it as an economic approach outlined in this report, to the 'vulnerable' coastal zones of East Anglia in the United Kingdom. This is the same area where the GDP at risk method of assessing hazards has been utilised (Case Study 8 above and Turner etal., 1995). The scenarios for the cost- benefit approach are the same as those discussed in Case Study 7 namely sea level changes of up to 0.8 m by 2050.
IPCC's CZMS recommends the assessment of three broad types of policy responses:
• Retreat - the abandonment of the land and structures in vulnerable areas and resettlement of population. This option can also include managed retreat linked to specific measures aimed at restoring or creating desirable habitat, landscape or amenity features;
• Accommodation - continued occupancy and use of vulnerable areas; and• Protection - continued full defence of vulnerable areas, especially population centres, economic
activities and natural resources.
Application to the East Anglian Coast
The physical vulnerability of the East Anglian coastline results from large areas of low lying land, both immediately adjacent to the shoreline and inland, and stretches of soft erosive cliffs. Coastal defences, mainly hard engineering structures, built largely after the very destructive 1953 North Sea storm surge flood, and river flood embankment defences play a crucial role in the maintenance of the current shoreline, levels of economic activity and environmental resources in the immediate hinterland.
The case study methodology contains the following sequential stages:
• development of regional scenarios of accelerated sea level rise;• development of analysis linking accelerated sea level rise with zone-specific physical hazards:
flooding, inundation and erosion;• sub-division of the hazard zone into separate spatial units, based on flooding and erosion risk;• collection of asset data for the hazard zone, in order to establish an inventory of natural and man-
made capital assets;• quantification and evaluation of the in-place sea defence and coastal protection system in the
hazard zone;• definition of accelerated sea level rise response options and an assessment of their impact on
coastal hazards and assets in the zone; and• economic valuation of the costs and benefits of the various response options, including the do-
nothing option.
The flood hazard zone is defined as all coastal areas below 5m above ordnance datum. A survey reveals the numbers and location of properties, total population, area and type of agricultural land, transport infrastructure, number of waste sites and nature conservation sites, together with historical sites, landscape resources and recreation resources. The East Anglian hazard zone has at its heart an internationally important wetland known as Broadland. This multiple-use area is recognised as providing a wide range of functional and structural values (Gren etal., 1994).
- 88 -
The impact of accelerated sea level rise on the hazard zone depends greatly on how the coastline is managed. In line with the Common Methodology categories, three different stylised management approaches representing a range of possible responses to sea level rise are therefore considered: retreat, accommodate and protect. These responses are defined in terms of the extent and effectiveness of defences that they represented. Feasible changes in flood return periods and coastal erosion rates by 2050 are incorporated within these scenarios.
The economic approach to assessing which of the strategies is most desirable for the overall coasts and for each section of the coast, involves the quantification of costs and benefits. In this case, it is restricted to a consideration of the two 'active' management response options, accommodation and protect. The cost benefit analysis is 'partial' because it only considers the economic benefit of protection to properties, agriculture and the indirect value of recreation and amenity in Broadland.
The economic cost-benefit decision is to accept that response strategy maximises the present value of net benefit of each option. The benefits of protection and accommodation are the impacts avoided, taking the accommodate option as the baseline scenario. These benefits therefore include the marginal value of the agricultural output, the other economic activity, and the amenity value of Broadland ‘saved’ through active management. The costs of the active strategies include hard and soft engineering defence maintenance, replacement cost of defences, cost of repairing beaches in defence, necessary beach nourishment
In the context of valuation of the amenity of Broadland protected, a contingent valuation study (CVM) has been completed which estimated the monetary value, willingness of pay, of conserving Broadland via a protection strategy designed to mitigate the increasing risk of saline flooding (Bateman et al., 1995). The CVM therefore assesses the value of conserving the recreation and amenity values provided by Broadland. The accommodation scenario is translated into a pictorial display in order to enable survey respondents to judge for themselves the relative merits of the current wetland asset structure and the changed environment that would result if frequent flooding was to occur. Survey respondents are asked for their WTP to conserve Broadland in its present condition. All the results refer to user values and range from £67 per household per annum to £140 per household per year. The total use-value recreation and amenity value of Broadland is therefore estimated to be within the range of £5m-£15.5m per annum depending on the visitation rate data chosen. The lower bound estimate of £5m is used in the cost-benefit analysis.
The total benefits of adopting either the maintain strategies defences or the improve defences response strategies is given by the size of the damage costs and losses avoided: the difference between the damage costs and losses incurred in an abandon defences, do-nothing, situation and those incurred in either of the two 'defend' responses. The net benefits of each response strategy can be computed by subtracting the capital and maintenance defence system costs from the value of total benefits (damage costs avoided).
The results of the cost benefit analysis are summarised in Table 27. The present value of flood and erosion defence costs for each response strategy are the accumulated cost of defence over the period 1990-2050, discounted at 6 percent. There are no defence costs associated with the Retreat response strategy: the ‘retreat’ option considered involves a complete abandonment of the coastal zone. For the two remaining proactive response strategies the costs shown combine both flood and erosion defence costs. Of these two cost components the erosion is less significant, accounting for around 20 percent to 30 percent of the total defence cost.
Although in the Accommodation response strategy it is assumed that the physical scale of the defences remains the same, there is still a gradual increase in defence costs with increasing values of sea level rise, due to an increased frequency of flooding events and consequent defence repair costs. In the case of the Protection response strategy, defence costs rise gradually, reflecting the need for progressively higher defences and increased volumes of beach nourishment required to counter sea level rise and enhanced erosion. The highest sea level rise projection, 0.80 m, produces a significant increase in costs due to expensive engineering methods.
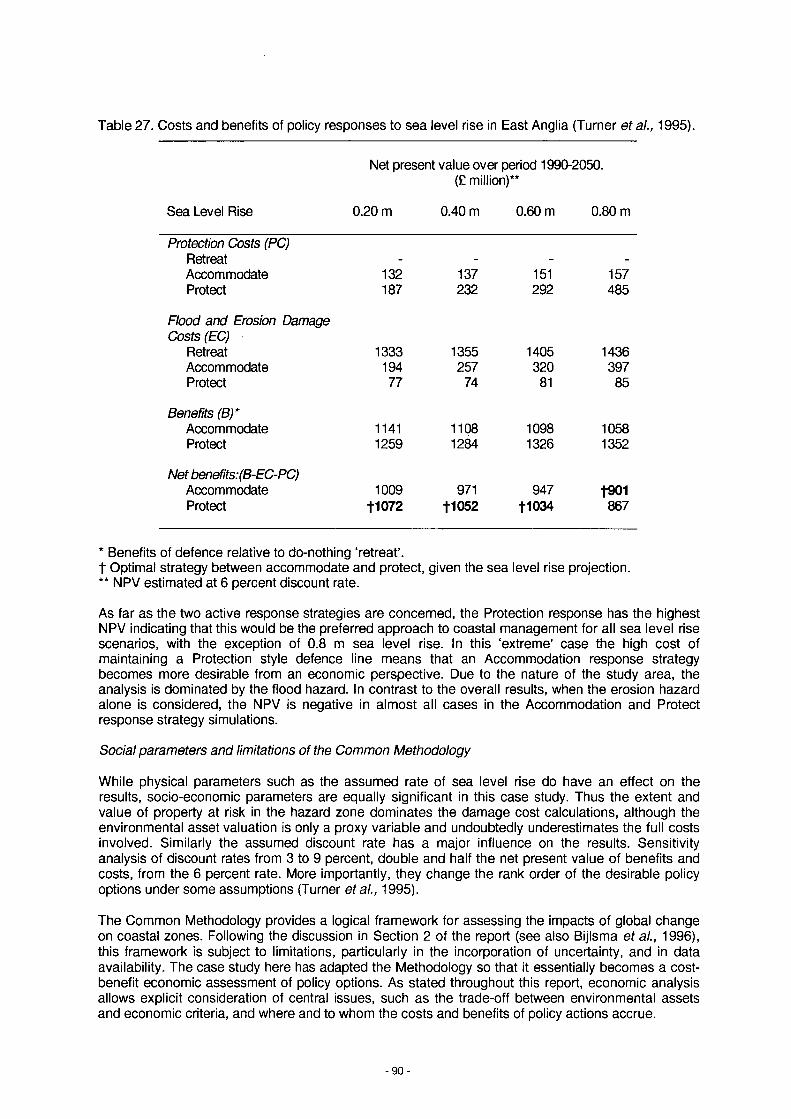
Table 27. Costs and benefits of policy responses to sea level rise in East Anglia (Turner et al., 1995).
Net present value over period 1990-2050.(£ million)**
Sea Level Rise 0.20 m 0.40 m 0.60 m 0.80 m
Protection Costs (PC)Retreat - - - -
Accommodate 132 137 151 157Protect 187 232 292 485
Flood and Erosion Damage Costs (EC)
Retreat 1333 1355 1405 1436Accommodate 194 257 320 397Protect 77 74 81 85
Benefits (B)*Accommodate 1141 1108 1098 1058Protect 1259 1284 1326 1352
Net benefits: (B-EC-PC)Accommodate 1009 971 947 t901Protect f1072 t1052 f1034 867
* Benefits of defence relative to do-nothing ‘retreat’.t Optimal strategy between accommodate and protect, given the sea level rise projection.** NPV estimated at 6 percent discount rate.
As far as the two active response strategies are concerned, the Protection response has the highest NPV indicating that this would be the preferred approach to coastal management for all sea level rise scenarios, with the exception of 0.8 m sea level rise. In this ‘extreme’ case the high cost of maintaining a Protection style defence line means that an Accommodation response strategy becomes more desirable from an economic perspective. Due to the nature of the study area, the analysis is dominated by the flood hazard. In contrast to the overall results, when the erosion hazard alone is considered, the NPV is negative in almost all cases in the Accommodation and Protect response strategy simulations.
Social parameters and limitations of the Common Methodology
While physical parameters such as the assumed rate of sea level rise do have an effect on the results, socio-economic parameters are equally significant in this case study. Thus the extent and value of property at risk in the hazard zone dominates the damage cost calculations, although the environmental asset valuation is only a proxy variable and undoubtedly underestimates the full costs involved. Similarly the assumed discount rate has a major influence on the results. Sensitivity analysis of discount rates from 3 to 9 percent, double and half the net present value of benefits and costs, from the 6 percent rate. More importantly, they change the rank order of the desirable policy options under some assumptions (Turner etal., 1995).
The Common Methodology provides a logical framework for assessing the impacts of global change on coastal zones. Following the discussion in Section 2 of the report (see also Bijlsma et al., 1996), this framework is subject to limitations, particularly in the incorporation of uncertainty, and in data availability. The case study here has adapted the Methodology so that it essentially becomes a cost- benefit economic assessment of policy options. As stated throughout this report, economic analysis allows explicit consideration of central issues, such as the trade-off between environmental assets and economic criteria, and where and to whom the costs and benefits of policy actions accrue.
- 90 -
5.0 REFERENCES
Adger, W.N. and Fankhauser, S. 1993. Economie analysis of the greenhouse effect: optimal abatement level and strategies for mitigation. International Journal of Environment and Pollution. 3:104-119.
Asian Development Bank. 1990. Environmental Risk Assessment: Dealing with Uncertainty in Environmental Impact Assessment. Environment Paper No. 7, ADB: Manila.
Aylward, B.A. and E.B. Barbier. 1992. Valuing Environmental Functions in Developing Countries, Biodiversity and Conservation. 1:34-50.
Barbier, E.B. 1989. The Economic Value of Ecosystems: Tropical Wetlands. LEEC Gatekeeper Series 89-02, London Environmental Economics Centre, London.
Barbier, E.B. 1993. Sustainable use of wetlands valuing tropical wetland benefits: economic methodologies and applications. The Geographical Journal. 159:22-32.
Barbier, E.B. 1994. Valuing environmental functions: tropical wetlands. Land Economics .70:155-173.
Bateman, I.J., I.H. Langford, R.K. Turner, K.G. Willis and G.D. Garrod. 1995. Elicitation and truncation effects in contingent valuation studies. Ecological Economics. 12:161-179.
Bateman, I.J. and R.K. Turner. 1993. Valuation of the environment: the contingent valuation method. In Turner, R.K. (ed.) Sustainable Environmental Economics and Management. Belhaven, London, pp 120-191.
Berkes, F. (ed.) 1989. Common Property Resources: Ecology and Community-based Sustainable Development. Belhaven, London.
Berz, G. 1991. Natural disasters in 1991: claims burdens reading new records, Schadenspiegel (Munich) 1:14-17.
Bijlsma, L., C.N. Ehler, R.J.T. Klein, S.M. Kulshrestha, R.F. McLean, N. Mimura, R.J. Nicholls, L.A. Nurse, H. Perez Nieto, E.Z. Takhiv, R.K. Turner, R.A. Warrick and others. 1996. Coastal zones and small islands. In R.T. Watson, and M.C. Zinyowera (eds.) Climate Change 1995: Impacts, Adaptations and Mitigation of Climate Change. Cambridge University Press, Cambridge.
Birnie, P.W. and A.E. Boyle. 1992. International Law and the Environment. Clarendon, Oxford.
Brammer, H. 1993. Geographical complexities of detailed impacts assessment for the Ganges- Brahmaputra-Meghna delta of Bangladesh. In R.A. Warrick, E.M. Barrow and T.M.L. Wigley (eds.) Climate and Sea Level Change: Observations, Projections and Implications. Cambridge University Press, Cambridge, pp 246-262.
Bromley, D.W. 1989. Property relations and economic development: the other land reform. World Development. 17:867-877.
Bromley, D.W. 1991. Environment and Economy: Property Rights and Public Policy. Blackwell, Oxford.
Buck, S.J. 1989. Multi-jurisdictional resources: testing a typology for problem structuring. In F. Berkes (ed.) Common Property Resources: Ecology and Community-based Sustainable Development. Belhaven, London, pp 127-147.
Blaikie, P., T. Cannon, I. Davis and B. Wisner. 1994. At Risk: Natural Hazards, People's Vulnerability and Disasters. Routledge, London.
Bower, B.T. and K. Takao (eds) 1993. Who speaks for Tokyo Bay?, AA Balkema, Rotterdam.
- 91 -
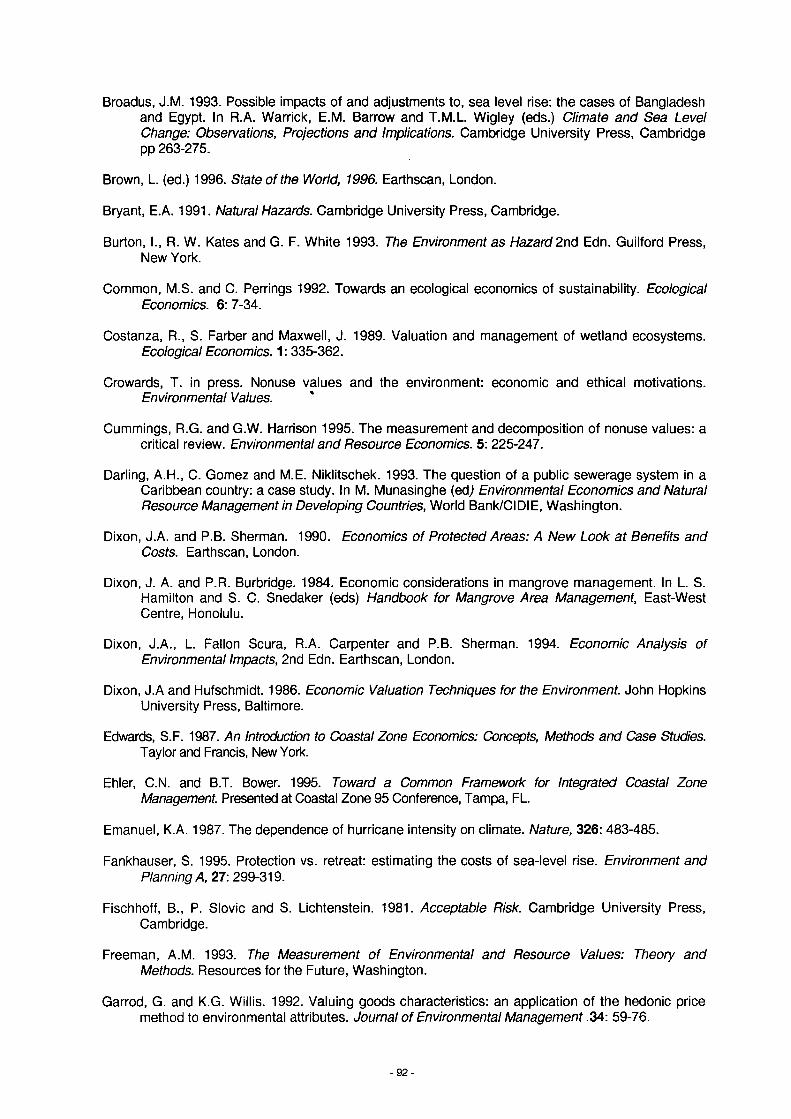
Broadus, Ü.M. 1993. Possible impacts of and adjustments to, sea level rise: the cases of Bangladesh and Egypt. In R.A. Warrick, E.M. Barrow and T.M.L. Wigley (eds.) Climate and Sea Level Change: Observations, Projections and Implications. Cambridge University Press, Cambridge pp 263-275.
Brown, L. (ed.) 1996. State of the World, 1996. Earthscan, London.
Bryant, E.A. 1991. Natural Hazards. Cambridge University Press, Cambridge.
Burton, I., R. W. Kates and G. F. White 1993. The Environment as Hazard 2nd Edn. Guilford Press, New York.
Common, M.S. and C. Perrings 1992. Towards an ecological economics of sustainability. Ecological Economics. 6: 7-34.
Costanza, R., S. Färber and Maxwell, J. 1989. Valuation and management of wetland ecosystems. Ecological Economics. 1:335-362.
Crowards, T. in press. Nonuse values and the environment: economic and ethical motivations. Environmental Values. '
Cummings, R.G. and G.W. Harrison 1995. The measurement and decomposition of nonuse values: a critical review. Environmental and Resource Economics. 5:225-247.
Darling, A.H., C. Gomez and M.E. Niklitschek. 1993. The question of a public sewerage system in a Caribbean country: a case study. In M. Munasinghe (edj Environmental Economics and Natural Resource Management in Developing Countries, World Bank/Cl DIE, Washington.
Dixon, J.A. and P.B. Sherman. 1990. Economics of Protected Areas: A New Look at Benefits and Costs. Earthscan, London.
Dixon, J. A. and P.R. Burbridge. 1984. Economic considerations in mangrove management. In L. S. Hamilton and S. C. Snedaker (eds) Handbook for Mangrove Area Management, East-West Centre, Honolulu.
Dixon, J.A., L. Fallon Scura, R.A. Carpenter and P.B. Sherman. 1994. Economic Analysis of Environmental Impacts, 2nd Edn. Earthscan, London.
Dixon, J.A and Hufschmidt. 1986. Economic Valuation Techniques for the Environment. John Hopkins University Press, Baltimore.
Edwards, S.F. 1987. An Introduction to Coastal Zone Economics: Concepts, Methods and Case Studies. Taylor and Francis, New York.
Ehler, C.N. and B.T. Bower. 1995. Toward a Common Framework for Integrated Coastal Zone Management. Presented at Coastal Zone 95 Conference, Tampa, FL.
Emanuel, K.A. 1987. The dependence of hurricane intensity on climate. Nature, 326: 483-485.
Fankhauser, S. 1995. Protection vs. retreat: estimating the costs of sea-level rise. Environment and Planning A, 27: 299-319.
Fischhoff, B., P. Slovic and S. Lichtenstein. 1981. Acceptable Risk. Cambridge University Press, Cambridge.
Freeman, A.M. 1993. The Measurement of Environmental and Resource Values: Theory and Methods. Resources for the Future, Washington.
Garrod, G. and K.G. Willis. 1992. Valuing goods characteristics: an application of the hedonic price method to environmental attributes. Journal of Environmental Management .34: 59-76.
- 92 -

Goldrick, G. and D. James. 1994. The Palawan Regional Development Plan. In D. James, The Application of Economic Techniques in Environmental Impact Assessment. Kluwer, Dodrecht. pp 217-246.
Gordon, D.C. Jr., P.R. Boudreau, K.H. Mann, J.-E. Ong, W.L. Silvert, S.V. Smith, G. Wattayakorn, F. Wulff And T. Yanagi. 1995. Loicz Biogeochemical Modelling Guidelines. Loicz/R&S/95-5, vi +96 pp. Loicz, Texel, The Netherlands.
Gren, l.-M., C. Folke, R.K. Turner and I. Bateman. 1994. Primary and secondary values of wetland ecosystems. Environmental and Resource Economics. 4:55-74.
de Groot, R. 1992. Functions of Nature: Evaluation of Nature in Environmental Planning, Management and Decision Making. Wolters-Noordhoff, Groningen.
Hardin, G. 1968. The tragedy of the commons. Science. 162:1243-1248.
Hargrove. 1992. Weak anthropocentric intrinsic value. The Monist. 75:183-207.
Hodgson, G. and J.A.Dixon. 1988. Logging Versus Fisheries and Tourism in Palawan: An Environmental and Economic Analysis. EAPI Occasional Paper No 7 East-West Centre, Honolulu.
Holligan, P.M and H. de Boois (eds). 1993. Land-Ocean Interactions in the Coastal Zone (LOICZ) Science Plan. IGBP Report No. 25, 50 p.
Holland, G., J. McBridge and N. Nicholls. 1988. Australian regional tropical cyclones and the greenhouse effect. In Pearman G. (ed.) Greenhouse Planning for Climate Change. CSIRO: Canberra, pp. 438-55.
Hong, P.N. and H.T. San. 1993. Mangroves of Vietnam. IUCN: Bangkok.
Howarth, R.B. 1995. Sustainability Under Uncertainty. Land Economics. 71:417-27.
Intergovernmental Panel on Climate Change CZMS. 1992. Global Climate Change and the Rising Challenge of the Sea. Response Strategies Working Group, IPCC: Geneva.
Intergovernmental Panel on Climate Change CZMS. 1994. Preparing to Meet the Coastal Challenges of the 21 st Century: World Coast Conference 1993, Conference Report. IPCC: Geneva.
Janssen, R. 1991. Multiobjective Decision Support for Environmental Problems. Free University, Amsterdam.
Kahneman, D. and J.L. Knetsch. 1992. Valuing public goods: the purchase of moral satisfaction. Journal of environmental Economics and Management. 22:57-70.
Keeney, R. and H. Raiffa. 1976. Decisions with Multiple Objectives, Preferences and Value Tradeoffs. Wiley, New York.
Kent, D.M. (ed.) 1994. Applied Wetlands Science and Technology. Lewis, Boca Raton, Florida.
Larson, D.M. 1993. On measuring existence values. Land Economics. 69:377-388.
Lave, L.B. and E.H. Males. 1989. At risk: the framework for regulating toxic substances, Environmental Science and Technology. 23:386-91.
Little, I. and J. Mirlees. 1969. Manual of Industrial Project Analysis in Developing Countries. 2 Vols., OECD, Paris.
- 93 -
LOICZ. 1995. LOICZ Typology: Preliminary Version. LOICZ Reports and Studies No.3. LOICZ: Texel, Netherlands.
Lutz, E. 1993. Toward Improved Accounting for the Environment. World Bank, Washington DC.
Maltby, E. 1986. Waterlogged Wealth: Why Waste the World's Wet Places. Earthscan, London.
McAllister, D.M. 1980. Evaluation in Environmental Planning. MIT Press, Cambridge, Mass.
Meadows, D.H., J. Randers and W. Beerens. 1972. Limits to Growth. Earth Island, London.
Meyer, W.B., W.N. Adger, K. Brown, D. Graetz, P. Gleick and J.F. Richards, in press. Land and water use. In S. Rayner and C. Cooper (eds.) Human Choice and Climate Change.
Milliman, J.D., J.M. Broadus and F. Gable. 1989. Environmental and economic implications of rising sea level and subsiding deltas: the Nile and Bengal examples. Ambio. 18:340-345.
Mintzberg, H., D. Raisinghani and A. Theoret. 1976. The structure of unstructured decision processes, Administrative Science Quarterly. 21:246-275.
Mitchell, J.K. and N. J. Ericksen. 1992. Effects of climate change on weather-related disasters. In I. M. Mintzer, (ed.) Confronting Climate Change: Risks, Implications and Responses. Cambridge University Press, Cambridge, pp. 141-151.
Munasinghe, M. 1993. Environmental Economics and Sustainable Development, World Bank Environment Paper No. 3, The World Bank, Washington.
Nijkamp, P. 1989. Multi-criteria analysis: a decision support system for sustainable environmental management. In F. Archibugi and P. Nijkamp (eds.) Economy and Ecology: Towards Sustainable Development. Kluwer: Dordrecht.
North, D.C. 1990. Institutions, Institutional Change and Economic Performance. Cambridge University Press, Cambridge.
Norton, B.G. 1992. Sustainability, human welfare and ecosystem health. Environmental Values. 1: 97- 111.
Norton, B.G. and R.E. Ulanowicz 1992. Scale and biodiversity policy: a hierarchical approach. Ambio. 21:244-249.
Nunn, P.D., A.D. Ravuvu, W. Aalbersberg, N. Mimura and K. Yamada 1994. Assessment of Vulnerability and Resilience to Sea-Level Rise and Climatic Change. Case Study: Yasawa Islands, Fiji. Environment Agency Japan, Overseas Environment Cooperation Centre, Japan.
OECD. 1991. Responding to Climate Change: Selected Economic Issues. OECD, Paris.
OECD. 1992. Benefit Estimation and Enivironmental Decision Making. OECD, Paris.
OECD. 1993a. Coastal Zone Management: Integrated Policie., OECD, Paris.
OECD. 1993b. Coastal Zone Management: Selected Case Studies. OECD, Paris.
OECD. 1994. Project and Policy Appraisal: Integrating Economics and Environment. OECD, Paris.
OECD. 1995. The Economic Appraisal of Environmental Projects and Policies: A Practical Guide. OECD, Paris.
Ostrom, E. 1990. Governing the Commons. Cambridge University Press, Cambridge.
Penning-Rowsell, E., C.H. Green, P.M. Thompson, A.M. Coker, S.M. Tunstall, C. Richards and D.J. Parker. 1992. The Economics of Coastal Management: A Manual of Benefit Assessment Techniques. Belhaven, London.
Pernetta, J.C. and J.D. Milliman. (eds.). 1995. Land-Ocean Interactions in the Coastal Zone Implementation Plan. IGBP Report No. 33, Stockholm Sweden, 215 p.
Paulson, D.D. 1993. Hurricane hazard in Western Samoa. Geographical Review. 83,43-53.
Pearce, D.W. 1994. The great environmental values debate. Environment and Planning A. 26:1329- 1338.
Pearce, D.W. 1993. Economic Values and the Natural World. Earthscan: London.
Pearce, D.W. and R.K.Turner. 1992 Benefits Estimates and Environmental Decision-Making. OECD: Paris.
Pearce, D.W. and R.K.Turner. 1990. Economics of Natural Resources and the Environment. Harvester Wheatsheaf, Hemel Hempstead.
Perrings, C. and D.W. Pearce. 1994. Threshold effects and incentives for the conservation of biodiversity. Environmental and Resource Economics. 4:13-28.
Platteau, J.P. 1991. Traditional systems of social security and hunger insurance: past achievements and modern challenges. In E. Ahmad, J. Drèze, J. Hills and A. Sen (eds.) Social Security in Developing Countries. Clarendon, Oxford, pp 112-170.
Randall, A. 1991 Total and nonuse values. In J. Braden and C. Kolstad (eds.) Measuring Demand for Environmental Quality. Elsevier, New York.
Randall, A. and Stoll. 1983. Existence value in a total valuation framework. In R.D. Rowe and L.G. Chestnut (eds.) Managing Air Quality and Scenic resources at National Parks and Wilderness Areas. Westview Press, Boulder, Co.
Resource Assessment Commission. 1993. Coastal Zone Inquiry: Final Report. RAC: Canberra, Australia.
Rolston, H. 1988. Environmental Ethics. Temple University Press, Philadelphia.
Ruitenbeek, H.J. 1994. Modelling economy-ecology linkages in mangroves: economic evidence for promoting conservation in Bintuni Bay, Indonesia. Ecological Economics. 10:233-247.
Ryan, C.J. 1993. Costs and benefits of tropical cyclones, severe thunderstorms and bushfires in Australia. Climatic Change. 25:353-367.
Sanderson, S. 1994. Political-economic institutions. In Meyer, W.B. and Turner, B.L. (eds.) Changes in Land Use and Land Cover: A Global Perspective. Cambridge University Press, Cambridge pp 329-355.
Smith, K. 1992. Environmental Hazards: Assessing Risk and Reducing Disaster. Routledge, London.
Swallow, S. K. 1994. Renewable and non-renewable resource theory applied to coastal agriculture, forest, wetland and fishery linkages. Marine Resource Economics. 9:291-310.
Swift, J. 1993. Understanding and preventing famine and famine mortality. IDS Bulletin. 24(4): 1-16.
Tri, N.H., W.N. Adger and P.M. Kelly. 1996. Issues in the Economic Valuation of Mangrove Restoration in Vietnam. Mangrove Ecosystem Research Centre, Hanoi, and CSERGE, University of East Anglia, Norwich.
- 95 -
Turner, B.L., R.E. Kasperson, W.B. Meyer, K.M. Dow, D. Golding, J.X. Kasperson, R.C. Mitchell and S.J. Ratick. 1990. Two types of global environmental change: definitional and spatial-scale issues in their human dimensions. Global Environmental Change. 1:14-22.
Turner, R.K., S. Subak and W.N. Adger. in press. Pressures, trends and impacts in coastal zones: interactions between socio-economic and natural systems. Environmental Management.
Turner, R.K., W.N. Adger and P. Doktor. 1995a. Assessing the economic costs of sea level rise. Environment and Planning A. 27:1777-1796.
Turner, R.K., C. Perrings and C. Folke. 1995b. Ecological Economics: Paradigm or Perspective. GEC Working Paper 95-17, CSERGE: University of East Anglia, Norwich.
Turner, R.K., D. Pearce and I. Bateman. 1994. Environmental Economics: An Elementary Introduction. Harvester Wheatsheaf, Hemel Hempstead.
Turner, R.K. 1993. Sustainability: principles and practice. In Turner, R. K. (ed.) Sustainable Environmental Economics and Management. Belhaven, London, pp 3-36.
Turner, R.K. and D.W. Pearce. 1993. Sustainable economic development: economic and ethical principles. In Barbier, E. B. (ed.) Economics and Ecology: New Frontiers and Sustainable Development. Chapman and Haii, London, pp 177-198.
Turner, R.K. 1991. Economics and wetland management. Ambio. 20:59-63.
Turner, R.K. and T. Jones, (eds.) 1991. Wetlands, Market and Intervention Failures: Four Case Studies. Earthscan, London.
Turner, R.K. (ed) 1993. Sustainable Environmental Economics and Management, Chi, Belhaven Press, London.
Turner, R.K. 1988. Wetland conservation: economics and ethics. In D. Collard, D.W. Pearce and D. Ulph (eds.) Economics, Growth and Sustainable Environments. Macmillan, London, pp 121-159.
Walters, J.S. 1994. Coastal common property regimes in Southeast Asia. In E.M. Borgese, N. Ginsburg and J.R. Morgan (eds.) Ocean Yearbook 11. University of Chicago Press, Chicago pp 304-327.
Watts, M. 1983. On the poverty of theory: natural hazards research in context. In Hewitt, K. (ed) Interpretations of Calamity. Allen and Unwin, Boston, pp 231-262.
Wigley, T.M.L. and S.C.B. Raper. 1993. Global mean temperature and sea level projections under the IPCC emissions scenarios. In R.A. Warrick, E.M. Barrow and T.M.L. Wigley (eds.) Climate and Sea Level Change: Observations, Projections and Implications. Cambridge University Press, Cambridge, pp 401-404.
Wind, H.G. 1987. Impact of Sea Level Rise on Society. A.A. Balkema, Rotterdam.
Winpenny, J.T. 1991. Values for the Environment: A Guide to Economic Appraisal. HMSO, London.
World Bank. 1991. Global Economic Prospects. The World Bank, Washington.
World Bank. 1995. Africa: a Framework for ICZM, Land, Water and Natural Habitats Division, The World Bank, Washington.
World Commission on Environment and Development. 1987. Our Common Future. Oxford University Press, Oxford.
- 96 -
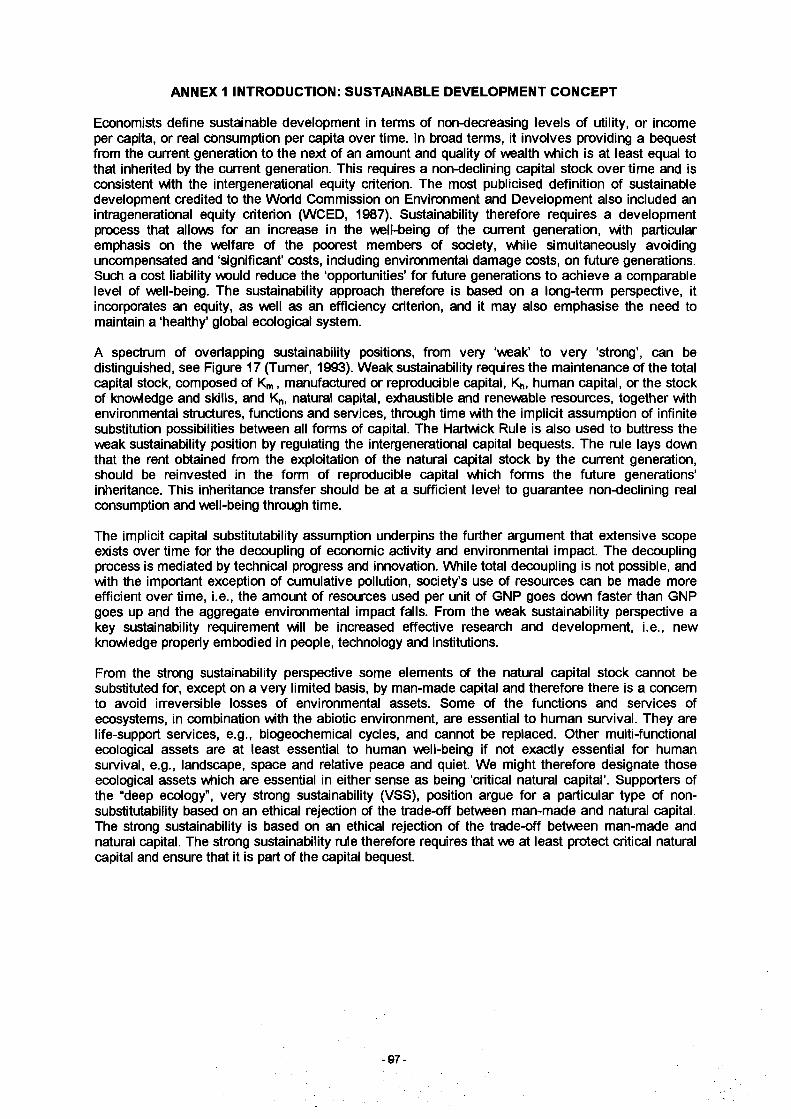
ANNEX 1 INTRODUCTION: SUSTAINABLE DEVELOPMENT CONCEPT
Economists define sustainable development in terms of non-decreasing levels of utility, or income per capita, or real consumption per capita over time. In broad terms, it involves providing a bequest from the current generation to the next of an amount and quality of wealth which is at least equal to that inherited by the current generation. This requires a non-declining capital stock over time and is consistent with the intergenerational equity criterion. The most publicised definition of sustainable development credited to the World Commission on Environment and Development also included an intragenerational equity criterion (WCED, 1987). Sustainability therefore requires a development process that allows for an increase in the well-being of the current generation, with particular emphasis on the welfare of the poorest members of society, while simultaneously avoiding uncompensated and ‘significant’ costs, including environmental damage costs, on future generations. Such a cost liability would reduce the ‘opportunities' for future generations to achieve a comparable level of well-being. The sustainability approach therefore is based on a long-term perspective, it incorporates an equity, as well as an efficiency criterion, and it may also emphasise the need to maintain a ‘healthy’ global ecological system.
A spectrum of overlapping sustainability positions, from very ‘weak’ to very ‘strong’, can be distinguished, see Figure 17 (Turner, 1993). Weak sustainability requires the maintenance of the total capital stock, composed of Km, manufactured or reproducible capital, Kh. human capital, or the stock of knowledge and skills, and Kn, natural capital, exhaustible and renewable resources, together with environmental structures, functions and services, through time with the implicit assumption of infinite substitution possibilities between all forms of capital. The Hartwick Rule is also used to buttress the weak sustainability position by regulating the intergenerational capital bequests. The rule lays down that the rent obtained from the exploitation of the natural capital stock by the current generation, should be reinvested in the form of reproducible capital which forms the future generations' inheritance. This inheritance transfer should be at a sufficient level to guarantee non-declining real consumption and well-being through time.
The implicit capital substitutability assumption underpins the further argument that extensive scope exists over time for the decoupling of economic activity and environmental impact. The decoupling process is mediated by technical progress and innovation. While total decoupling is not possible, and with the important exception of cumulative pollution, society’s use of resources can be made more efficient over time, i.e., the amount of resources used per unit of GNP goes down faster than GNP goes up and the aggregate environmental impact falls. From the weak sustainability perspective a key sustainability requirement will be increased effective research and development, i.e., new knowledge properly embodied in people, technology and institutions.
From the strong sustainability perspective some elements of the natural capital stock cannot be substituted for, except on a very limited basis, by man-made capital and therefore there is a concern to avoid irreversible losses of environmental assets. Some of the functions and services of ecosystems, in combination with the abiotic environment, are essential to human survival. They are life-support services, e.g., biogeochemical cycles, and cannot be replaced. Other multi-functional ecological assets are at least essential to human well-being if not exactly essential for human survival, e.g., landscape, space and relative peace and quiet. We might therefore designate those ecological assets which are essential in either sense as being ‘critical natural capital’. Supporters of the “deep ecology”, very strong sustainability (VSS), position argue for a particular type of nonsubstitutability based on an ethical rejection of the trade-off between man-made and natural capital. The strong sustainability is based on an ethical rejection of the trade-off between man-made and natural capital. The strong sustainability rule therefore requires that we at least protect critical natural capital and ensure that it is part of the capital bequest.
SSA SS
SM SM
A
0 ■4—»C'coV_COc o o■O c CO
— .CO«
0
ocoo
0o!q
O)b_c 00 3o001
0>
o O,k_.c '0-4—»Cc "k.01
■4-*C
coc
030>0 0>
k_3
0 0,E Ck_o C
0C0-4—»
CO0k.CD-4—>c■OcCO
g>'k-cCOE3
coc
CO"k_0
o>%
e rCD«.
■DcCO>»ocCD'oît=CD
COCD
ECD-4—*co> îco > o ^ g a»® CDCD C * >O T3 CD C Q _ COECDQ -COECDto> sco
T3>S
c r00 c -o'•*-*cok_0c02 >0
0 _3
>0
•*—>C 0 E3¿3 C 0 — C — O *
0_30>O'coc
0
0>
C0ooQ .O
C0
C0ooCLO
C0
C0E13
£C
C0ooQ .O
0iCoc
o0_30>
0E00 •> s 0 O
. o 0 0
"O0i0 .O)0k_O)O)0
0k_130C
00
_30>
.0 , "O Coo00T3C0
0E
000 ■4—»
C'2 0 C O o0 ’ =
n'0k̂0>0
Q .0O"0
0C
0O
O
T3C0 .
C‘0■e0oc:3O)c:o
-Co0Ok_CLCL00"Ok_ 0 "O C * 0 0
E3Ec'Ea00
CO‘k.0'k_o> ï -oc0
’o
0
EO)TD0v_0CL0OE o . c
• o «o00O‘00001O0c
0E30COo0003"O'>"dc
0CoÇO
00_30>0OC0k_00k_CL"Oc0E“003*o>
"occ0‘i—0
o cg -siCO0_30>■D
► CD. 0 0
-Q !0JX.k.0E
0_30>
C0E3k_■4—»0C «
C0ooCLO
C0
00_30>0 -4—> 0 >
CL0OCOo0_30>
Eocoo00-4—»O
00
S2 Sí?o CO a . 0 c o
C3)
S 00 O3 10 O r= 00 -4->•5 . ?s «0
!û0
JQ0
0 = ^ 2
3 g g S
■S S '-S ?Cl) 0 ÇO O5 3
> © o ©» ï « H
CO 11 II f f t
£ « c o c o> 5 co > Figu
re
17
. S
pect
rum
of
ov
erla
ppin
g su
sta
ina
bilit
y p
osi
tion
s.
The combination of the risk of irreversible environmental losses and a high degree of uncertainty surrounding past rates and future trends in resource degradation and loss, as well as the full structural and functional value of ecosystems (Gren et al., 1994), leads strong sustainability advocates to adopt the precautionary principle. Conservation of natural capital and the application of a safe-minimum standards approach are therefore important components of a strong sustainability strategy. This message is that environmental degradation and loss of natural resources represent one of the main ways in which today’s generation is creating uncompensated future costs. Hence restoration and conservation of natural resources and the environment is crucial to achieving sustainable development.
A number of sustainability rules, which fall some way short of a blueprint, for the sustainable utilisation of the natural capital stock can be outlined:
• market and policy intervention failures related to resource pricing and property rights should be corrected;
• the regenerative capacity of renewable natural capital should be maintained, i.e., harvesting rates should not exceed regeneration rates; and cumulative pollution which could threaten waste assimilation capacities and life-support systems should be wherever feasible avoided;
• Technological changes should be steered via an indicative planning system such that switches from non-renewable natural capital to renewable natural capital are fostered; and efficiency- increasing technical progress should dominate throughput-increasing technology;
• Resources should, wherever possible, be exploited, but at a rate equal to the creation of substitutes (including recycling); and
• The overall scale of economic activity must be limited so that it remains within the carrying capacity of the remaining natural capital. Given the uncertainties present, a precautionary approach should be adopted with a built-in safety margin.
Figure 18 summarises some of the measures and enabling policy instruments that would be involved in any application of a very weak sustainability (VWS) through to a very strong sustainability (VSS) strategy (Turner, 1993).
- 99 -
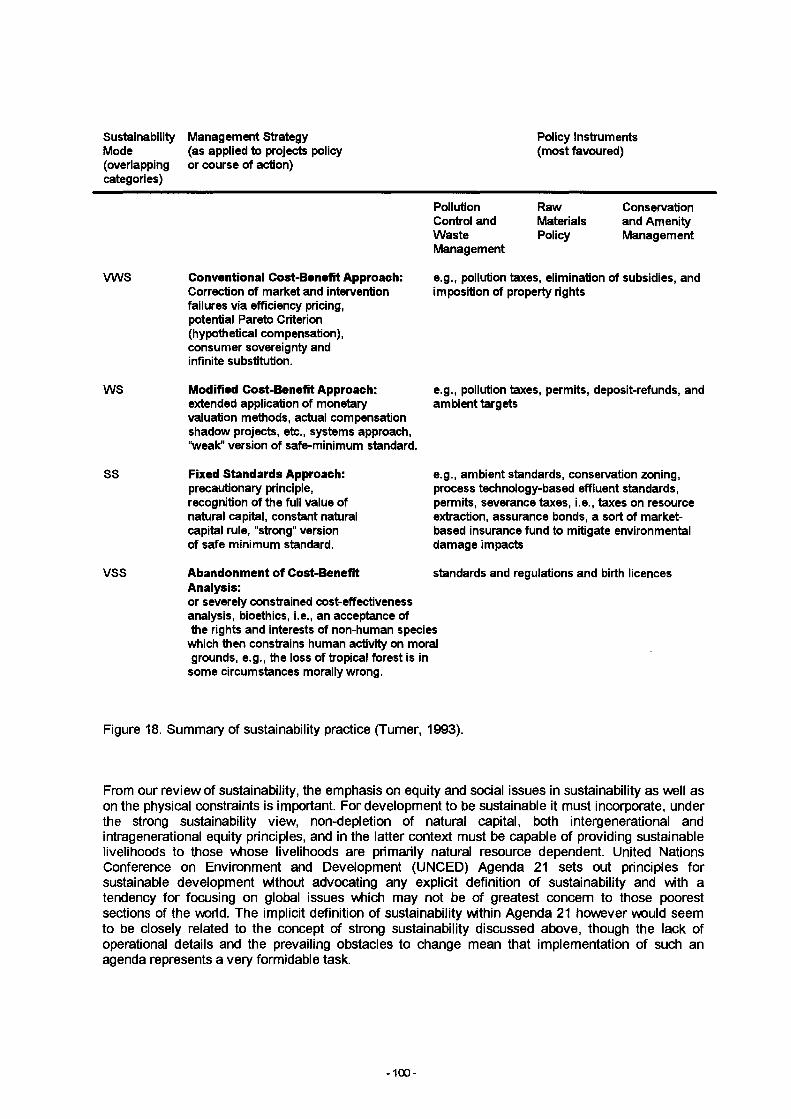
SustainabilityMode(overlappingcategories)
Management Strategy (as applied to projects policy or course of action)
Policy Instruments (most favoured)
VWS Conventional Cost-Benefit Approach:Correction of market and intervention failures via efficiency pricing, potential Pareto Criterion (hypothetical compensation), consumer sovereignty and infinite substitution.
Pollution Control and WasteManagement
RawMaterialsPolicy
Conservation and Amenity Management
e.g., pollution taxes, elimination of subsidies, and imposition of property rights
WS Modified Cost-Benefit Approach:extended application of monetary valuation methods, actual compensation shadow projects, etc., systems approach, “weak” version of safe-minimum standard.
e.g., pollution taxes, permits, deposit-refunds, and ambient targets
SS
VSS
Fixed Standards Approach:precautionary principle, recognition of the full value of natural capital, constant natural capital rule, “strong” version of safe minimum standard.
e.g., ambient standards, conservation zoning, process technology-based effluent standards, permits, severance taxes, i.e., taxes on resource extraction, assurance bonds, a sort of market- based insurance fund to mitigate environmental damage impacts
Abandonment of Cost-Benefit Analysis:or severely constrained cost-effectiveness analysis, bioethics, i.e., an acceptance of the rights and interests of non-human species
which then constrains human activity on moral grounds, e.g., the loss of tropical forest is in
some circumstances morally wrong.
standards and regulations and birth licences
Figure 18. Summary of sustainability practice (Turner, 1993).
From our review of sustainability, the emphasis on equity and social issues in sustainability as well as on the physical constraints is important. For development to be sustainable it must incorporate, under the strong sustainability view, non-depletion of natural capital, both intergenerational and intragenerational equity principles, and in the latter context must be capable of providing sustainable livelihoods to those whose livelihoods are primarily natural resource dependent. United Nations Conference on Environment and Development (UNCED) Agenda 21 sets out principles for sustainable development without advocating any explicit definition of sustainability and with a tendency for focusing on global issues which may not be of greatest concern to those poorest sections of the world. The implicit definition of sustainability within Agenda 21 however would seem to be closely related to the concept of strong sustainability discussed above, though the lack of operational details and the prevailing obstacles to change mean that implementation of such an agenda represents a very formidable task.
- 100 -
ANNEX 2 LIST OF ACRONYMS
AUS$ Australian dollarB:C Benefit to Cost RationBCA Benefit-Cost AssessmentBV Bequest ValueCBA Cost Benefit AnalysisCEA Cost Effectiveness AnalysisCSERGE Centre for Social and Economic Research on the Global EnvironmentCV Contingent ValuationCVM Contingent Valuation MethodCZM Coastal Zone ManagementCZMS Coastal Zone Management Subgroup of the IPCCDUV Direct Use of ValueEA Environmental AssessmentEC European CommissionEES Environmental Evaluation SystemEIA Environmental Impact AssessmentERR Economic Rate of ReturnESRC Economic Social Research Council of the United KingdomEXV Existence ValueFAO Food and Agriculture Organisation of the United NationsGAM Goals-Achievement MatrixGDP Gross Domestic ProductGEC Global Environmental ChangeGIS Geographic Information SystemGNP Gross National ProductHPM Hedonic Price MethodICZM Integrated Coastal Zone ManagementIGBP International Geosphere-Biosphere ProgrammeIOC Indirect Opportunity Cost ApproachIPCC Intergovernmental Panel on Climate ChangeIS Indirect Substitute ApproachIUV Indirect Use ValueLOICZ Land-Ocean Interactions in the Coastal ZoneMC DA Multi-Criteria Decision AnalysisNGO Non-Governmental OrganisationNPV Net Present ValueNUV Non-Use ValueOECD Organisation for Economic Cooperation and DevelopmentOV Option ValuePC Protection CostsP-S-R Pressure-State-ResponsePP Precautionary PrinciplePPP Polluter Pays PrinciplePV Present ValueRBA Risk Benefit AnalysisSS Strong SustainabilityTCM Travel Cost MethodTEV Total Economic ValueTV Total Environmental ValueUS$ United States DollarUV Use ValueVWS Very Weak SustainabilityVSS Very Strong SustainabilityUNCED United Nations Conference on Environment and DevelopmentWCC World Coastal Conference 1993WCED World Commission on Environment and DevelopmentWS Weak SustainabilityWTA Willingness To AcceptWTP Willingness To Pay
-101 -