d. vasanth kumar 1,* lean tool implementation in the
TRANSCRIPT
19Kumar DV, Mohan GM, Mohanasundaram KM. Lean Tool Implementation in the Garment Industry.FIBRES & TEXTILES in Eastern Europe 2019; 27, 2(134): 19-23. DOI: 10.5604/01.3001.0012.9982
implementation is essential to adapt it in similar garment industries to identify improvements in small and middle scale industries.
The garment sector production process is always a short life cycle with a number of sub-processes [6]. The fast change in the fashion and customer-focused market creates the values in apparel manufactur-ing [7]. The garment industry is exposed to an inconsistent supply of raw materials in the production process. Resource allo-cation is a major process in any organisa-tion, which requires continuous analysis of internal and external factors due to the inherent complexity [8]. Lean manufac-turing focuses on waste reduction and productivity improvement through var-ious lean tools, value stream mapping, line balancing and work standardisation [9]. The combination of various lean tools, such as 5S, line balancing, stand-ardised work and value stream mapping, results in productivity improvement in both labour intensivity and equipment flexibility [10]. Successful implemen-tation of the lean manufacturing tool in small and medium scale industries leads to increases in the workforce, machines and methods of the manufacturing pro-cess [11]. Value stream mapping is a key performance indicator that measures the performance of a manufacturing process [12]. Lean manufacturing, which reduces the flow quality duration, increases the operating speed and improves delivery performances [13]. Line balancing is a tool which enhances productivity and improves the efficiency of the produc-tion process, while Poka-Yoke is one of the lean manufacturing tools which can eliminate waste by pool proofing [14].
An ideal workstation can be effectively utilised by using line balancing without an uninterrupted flow in the process [15]. An empirical study in the garment indus-try gave a more in-depth validation of the ideas proposed [16]. Lean manufacturing tools can enhance productivity by a re-duction in the lead time of the process through eliminating non-value added activities [17]. Productivity is an impor-tant parameter for any manufacturing in-dustry, comprising value added activities and non-value added activities [18]. 5S is a basic lean manufacturing tool which provides a pathway for other lean tools to implement in any organisation [19].
Lean Tool Implementation in the Garment IndustryDOI: 10.5604/01.3001.0012.9982
AbstractGarment Manufacturing is one of the oldest in the world, compromising a high number of critical operations. The main issues in the garment industry are the lead time, production rate, very poor line balancing and fabric wastes. Productivity improvement is carried out by implementing the various lean tools in the industry, such as 5S, Value Stream Mapping (VSM) and line balancing in the sewing section. After the implementation of lean tools in the garment industry, the outcomes observed are a reduction in work-in-progress inventory, increases in the production process and increased line efficiency. Similarly the before and after implementation of 5S, which shows space utilisation in the sewing section, is increased. In this research, an implementation study was conducted in only one organisation. Hence the results extracted by the conduct of this implementation study are achievable and adaptable in similar organisations.
Key words: lean tools, value stream mapping, 5S, line balancing.
D. Vasanth Kumar1,*, G. Madhan Mohan2,
K.M. Mohanasundaram3
1 Dr N.G.P Institute of Technology, Department of Mechanical Engineering,
Coimbatore, India* e-mail: [email protected]
2 P.S.G College of Technology, Department of Production Engineering,
Coimbatore, India3 SVS College of Engineering,
Coimbatore, India
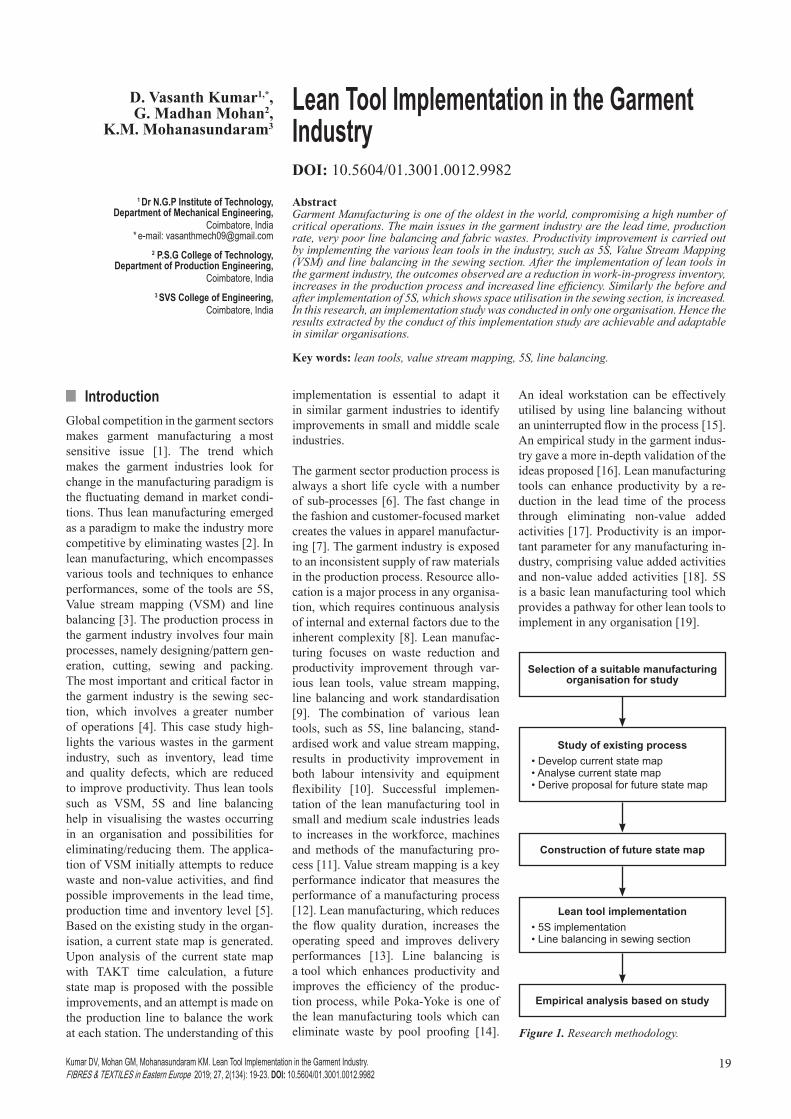
IntroductionGlobal competition in the garment sectors makes garment manufacturing a most sensitive issue [1]. The trend which makes the garment industries look for change in the manufacturing paradigm is the fluctuating demand in market condi-tions. Thus lean manufacturing emerged as a paradigm to make the industry more competitive by eliminating wastes [2]. In lean manufacturing, which encompasses various tools and techniques to enhance performances, some of the tools are 5S, Value stream mapping (VSM) and line balancing [3]. The production process in the garment industry involves four main processes, namely designing/pattern gen-eration, cutting, sewing and packing. The most important and critical factor in the garment industry is the sewing sec-tion, which involves a greater number of operations [4]. This case study high-lights the various wastes in the garment industry, such as inventory, lead time and quality defects, which are reduced to improve productivity. Thus lean tools such as VSM, 5S and line balancing help in visualising the wastes occurring in an organisation and possibilities for eliminating/reducing them. The applica-tion of VSM initially attempts to reduce waste and non-value activities, and find possible improvements in the lead time, production time and inventory level [5]. Based on the existing study in the organ-isation, a current state map is generated. Upon analysis of the current state map with TAKT time calculation, a future state map is proposed with the possible improvements, and an attempt is made on the production line to balance the work at each station. The understanding of this
Study of existing process• Develop current state map • Analyse current state map • Derive proposal for future state map
Selection of a suitable manufacturing organisation for study
Construction of future state map
Lean tool implementation • 5S implementation• Line balancing in sewing section
Empirical analysis based on study
Figure 1. Research methodology.
FIBRES & TEXTILES in Eastern Europe 2019, Vol. 27, 2(134)20
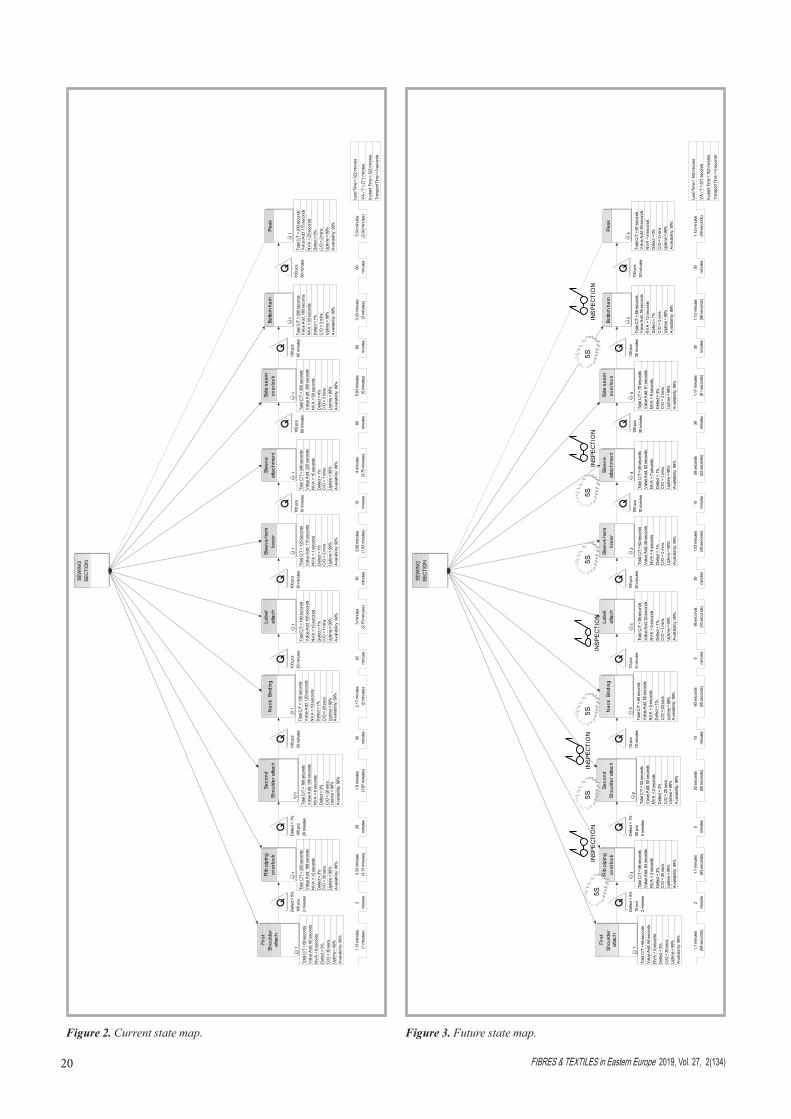
Figure 2. Current state map. Figure 3. Future state map.
Cur
rent
sta
te.ig
x
SEW
ING
SE
CTI
ON
1.13
min
utes
(1
min
utes
)2
min
utes
3.33
min
utes
(3
.13
min
utes
)20
min
utes
1.8
min
utes
(1
.67
min
utes
)30
min
utes
2.17
min
utes
(2
min
utes
)20
min
utes
3 m
inut
es
(2.7
5 m
inut
es)
30 m
inut
es2.
08 m
inut
es
(1.8
3 m
inut
es)
10 m
inut
es4
min
utes
(3
.75
min
utes
)60
min
utes
5.83
min
utes
(5
min
utes
)60
min
utes
3.33
min
utes
(3
min
utes
)60
min
utes
3.33
min
utes
(2
.92
min
utes
)
Lead
Tim
e =
322
min
utes
VA
/ T
= 27
.1 m
inut
es
In-p
lant
Tim
e =
322
min
utes
Tran
spor
t Tim
e =
0 se
cond
s
Firs
t Sh
ould
er
atta
ch
Tota
l C/T
= 6
8 se
cond
sV
alue
Add
: 60
seco
nds
NV
A =
8 s
econ
dsD
efec
t = 3
%C
/O =
30
secs
.U
ptim
e =
99%
Ava
ilabi
lity:
99%
1
Rib
pip
ing
over
lock
Tota
l C/T
= 2
00 s
econ
dsV
alue
Add
: 188
sec
onds
NV
A =
12
seco
nds
Def
ect =
3%
C/O
= 2
0 se
cs.
Upt
ime
= 99
%A
vaila
bilit
y: 9
9%
1D
efec
t = 5
%10
0 pc
s2
min
utes
Seco
nd
Shou
lder
atta
ch
Tota
l C/T
= 1
08 s
econ
dsV
alue
Add
: 100
sec
onds
NV
A =
8 s
econ
dsD
efec
t = 3
%C
/O =
20
secs
.U
ptim
e =
99%
Ava
ilabi
lity:
99%
1D
efec
t = 1
%10
0 pc
s20
min
utes
100
pcs
30 m
inut
es
Nec
k B
indi
ng
Tota
l C/T
= 1
30 s
econ
dsV
alue
Add
: 120
sec
onds
NV
A =
10
seco
nds
Def
ect =
1%
C/O
= 2
0 se
cs.
Upt
ime
= 99
%A
vaila
bilit
y: 9
9%
1
Labe
l at
tach
Tota
l C/T
= 1
80 s
econ
dsV
alue
Add
: 165
sec
onds
NV
A =
15
seco
nds
Def
ect =
1%
C/O
= 1
min
s.U
ptim
e =
99%
Ava
ilabi
lity:
99%
110
0 pc
s20
min
utes
Slee
ve h
em
low
er
Tota
l C/T
= 1
25 s
econ
dsV
alue
Add
: 110
sec
onds
NV
A =
1 s
econ
dsD
efec
t = 1
%C
/O =
2 m
ins.
Upt
ime
= 99
%A
vaila
bilit
y: 9
9%
110
0 pc
s30
min
utes
Slee
ve
atta
chm
ent
Tota
l C/T
= 2
40 s
econ
dsV
alue
Add
: 225
sec
onds
NV
A =
15
seco
nds
Def
ect =
1%
C/O
= 1
min
s.U
ptim
e =
99%
Ava
ilabi
lity:
99%
110
0 pc
s10
min
utes
Side
sea
m
over
lock
Tota
l C/T
= 3
50 s
econ
dsV
alue
Add
: 300
sec
onds
NV
A =
50
seco
nds
Def
ect =
4%
C/O
= 3
min
s.U
ptim
e =
99%
Ava
ilabi
lity:
99%
110
0 pc
s60
min
utes
Botto
m h
em
Tota
l C/T
= 2
00 s
econ
dsV
alue
Add
: 180
sec
onds
NV
A =
20
seco
nds
Def
ect =
1%
C/O
= 3
min
s.U
ptim
e =
99%
Ava
ilabi
lity:
99%
1
Peak
Tota
l C/T
= 2
00 s
econ
dsV
alue
Add
: 175
sec
onds
NV
A =
25
seco
nds
Def
ect =
0%
C/O
= 2
min
s.U
ptim
e =
99%
Ava
ilabi
lity:
99%
110
0 pc
s60
min
utes
100
pcs
60 m
inut
es
Futu
re st
ate.
igx
SEW
ING
SE
CTI
ON
1.1
min
utes
(6
4 se
cond
s)2
min
utes
1.1
min
utes
(6
3 se
cond
s)5
min
utes
52 s
econ
ds
(50
seco
nds)
10 m
inut
es60
sec
onds
(5
5 se
cond
s)5
min
utes
58 s
econ
ds
(53
seco
nds)
30 m
inut
es1.
03 m
inut
es
(58
seco
nds)
10 m
inut
es59
sec
onds
(5
2 se
cond
s)30
min
utes
1.17
min
utes
(6
1 se
cond
s)30
min
utes
1.13
min
utes
(5
6 se
cond
s)30
min
utes
1.12
min
utes
(5
9 se
cond
s)
Lead
Tim
e =
162
min
utes
VA
/ T
= 57
1 se
cond
s
In-p
lant
Tim
e =
162
min
utes
Tran
spor
t Tim
e =
0 se
cond
s
Firs
t Sh
ould
er
atta
ch
Tota
l C/T
= 6
6 se
cond
sV
alue
Add
: 64
seco
nds
NV
A =
2 s
econ
dsD
efec
t = 3
%C
/O =
30
secs
.U
ptim
e =
99%
Ava
ilabi
lity:
99%
1
Rib
pip
ing
over
lock
Tota
l C/T
= 6
6 se
cond
sV
alue
Add
: 63
seco
nds
NV
A =
3 s
econ
dsD
efec
t = 3
%C
/O =
20
secs
.U
ptim
e =
99%
Ava
ilabi
lity:
99%
3D
efec
t = 5
%10
pcs
2 m
inut
es
Seco
nd
Shou
lder
atta
ch
Tota
l C/T
= 5
2 se
cond
sV
alue
Add
: 50
seco
nds
NV
A =
2 s
econ
dsD
efec
t = 3
%C
/O =
20
secs
.U
ptim
e =
99%
Ava
ilabi
lity:
99%
2D
efec
t = 1
%50
pcs
5 m
inut
es
10 p
cs10
min
utes
Nec
k B
indi
ng
Tota
l C/T
= 6
0 se
cond
sV
alue
Add
: 55
seco
nds
NV
A =
5 s
econ
dsD
efec
t = 1
%C
/O =
20
secs
.U
ptim
e =
99%
Ava
ilabi
lity:
99%
2
Labe
l at
tach
Tota
l C/T
= 5
8 se
cond
sV
alue
Add
: 53
seco
nds
NV
A =
5 s
econ
dsD
efec
t = 1
%C
/O =
1 m
ins.
Upt
ime
= 99
%A
vaila
bilit
y: 9
9%
310
pcs
5 m
inut
es
Slee
ve h
em
low
er
Tota
l C/T
= 6
2 se
cond
sV
alue
Add
: 58
seco
nds
NV
A =
4 s
econ
dsD
efec
t = 1
%C
/O =
2 m
ins.
Upt
ime
= 99
%A
vaila
bilit
y: 9
9%
210
0 pc
s30
min
utes
Slee
ve
atta
chm
ent
Tota
l C/T
= 5
9 se
cond
sV
alue
Add
: 52
seco
nds
NV
A =
7 s
econ
dsD
efec
t = 1
%C
/O =
1 m
ins.
Upt
ime
= 99
%A
vaila
bilit
y: 9
9%
410
0 pc
s10
min
utes
Side
sea
m
over
lock
Tota
l C/T
= 7
0 se
cond
sV
alue
Add
: 61
seco
nds
NV
A =
9 s
econ
dsD
efec
t = 4
%C
/O =
3 m
ins.
Upt
ime
= 99
%A
vaila
bilit
y: 9
9%
510
0 pc
s30
min
utes
Botto
m h
em
Tota
l C/T
= 6
8 se
cond
sV
alue
Add
: 56
seco
nds
NV
A =
12
seco
nds
Def
ect =
1%
C/O
= 3
min
s.U
ptim
e =
99%
Ava
ilabi
lity:
99%
3
Peak
Tota
l C/T
= 6
7 se
cond
sV
alue
Add
: 59
seco
nds
NV
A =
8 s
econ
dsD
efec
t = 0
%C
/O =
2 m
ins.
Upt
ime
= 99
%A
vaila
bilit
y: 9
9%
310
0 pc
s30
min
utes
100
pcs
30 m
inut
es
5S5S
5SIN
SPEC
TIO
N5S
5SIN
SPEC
TIO
NIN
SPEC
TIO
NIN
SPEC
TIO
NIN
SPEC
TIO
N5S

21FIBRES & TEXTILES in Eastern Europe 2019, Vol. 27, 2(134)
Research methodologyThe methodology followed during this research project is shown in Figure 1. Summarising a review of suitable organ-isations for implementing the various lean tools was undertaken to carry out the study. After identifying the organisa-tion, the existing products and processes preformed in the organisation for man-ufacturing the products were classified. A current state map was developed for formulated and further improvements in lean tool implementation, discussed with the executives of the organisation to develop a future state map. After the development of the future state map, lean tools such as 5S and line balancing were implemented in the organisation. Finally empirical analysis was carried out with the executives of the company on lean tool implementation.
About the organisationA study on lean implementation using VSM was carried out at the ABC gar-ment factory located in Tiruppur, India. It is an ISO certified organisation man-ufacturing products for men, ladies and children. The company manufactures normal styles, trendy styles, night-wears and value-added styles, with accessories made even at their customers’ choice. The ABC garment factory was started in the year 1999 with 10 employees. Pres-ently it employs 300 personnel, including management, with an annual turnover of about four crores Indian national ru-pees (INR). Some of the potential export countries include European ones: Italy, Germany, Switzerland, Hungary and Portugal.
Selection of the productAll the dates concerning the product were studied in terms of production vol-ume, demand, inventory and operations performed. A baby girl’s tee was select-ed as the product for study. Raw materi-als were supplied by an external vendor and a manufacturing process for pattern making, sewing, thread trimming and pressing, quality checks and packing was made to complete this product cycle.
Current state mapA current state map is developed for the kid’s tee as shown in Figure 2. Orders are received from the customer regularly on a monthly basis of around 8500 piec-es. This information is shared with the supervisor for the allocation of personnel
and resources. An average of sixteen pro-cesses are carried out in completing the kid’s tees. The main processes include marking and cutting, sewing, inspec-tion, finishing and packing. The sewing section is taken for analysis, in which more critical processes are carried out. The change over time between the pro-cess is 10 minutes. The organisation works on three shifts every day (each shift of an eight-hour duration with a thirty minute lunch break). The bundle system of manufacturing currently I pro-gress is followed in the garment factory with a batch size of two hundred pieces.
The available production time is calcu-lated as follows:
Available time = Total production time – Planned down time
Available time = (60 × 8 × 3) – (30 × 3) = 1350 Minutes
Uptime = Actual operating time/Availa-ble time
= (Available time – Changeover time) × 100%/Available time
= (1350 – 10) × 100/1350 = 99.2%
Available working time per dayTakt time = Custome demond rate per day
=
1350 340
= 238 sec
The value added time for the current process is 27 minutes for all the process in the sewing section. The process dura-tion of the product of the daily demand is 322 minutes, and the idle time for the process is 1000 minutes.
Future state mapThe future state map preparation is initi-ated with the aid of the current state map. The gaps and possible improvements are identified from the current state map to propose a future state map. The differ-ence made in the existing production cy-cle time is 30 minutes, which is reduced to 10 minutes, which is proposed in the future state map, as shown in Figure 3. The existing inventory is reduced to 302 minutes in the future state from the current state of 352 minutes. The lead time for completing the process is re-duced to 252 minutes from the current state of 322 minutes in the future state proposed. 5S introduced is at every stage of the operations in the organisation. Stage inspection is introduced, which eliminates the final inspection, and con-sequently the rejection of the product at the final stage is reduced.
Results and discussionValue stream mappingSeveral improvements are identified based on the current state map for the future state map for implementation. Significant changes are developed in the future state, such as a reduction in the production time, non- value added time and inventory time, as shown in Table 1. The change-over-time benefits the organ-isation in shifting to a new product fam-ily and helps in the delivery schedule. The value added time gives an excess of 18 hrs to the process.
A comparison of cycle time modifica-tions is shown in Figure 4. Based on the possible potentials identified during the analysis of the current state map, few ma-
Table 1. Reduction in each category.
Time for operations
Production cycle time, sec
Non-value added time, sec Inventory, min
Current state
Future state
Current state
Future state
Current state
Future state
One side shoulder attach 68 66 8 2 2 2
Rib piping overlock 200 66 12 3 20 5
Second shoulder attach 108 52 8 2 30 10
Neck binding 130 60 10 5 20 5
Neck binding finish (label) 180 58 15 5 30 30
Sleeve hem lower 125 62 15 4 10 10
Sleeve attachment 240 59 15 7 60 60
Side seem overlock 350 70 50 9 60 60
Bottom hem (full length) 200 68 20 12 60 60
Peak (in sleeve and rib) 200 67 25 8 60 60
Total time 1801 628 178 57 352 302
Percentage reduction, % 34.86 32.07 14.02

FIBRES & TEXTILES in Eastern Europe 2019, Vol. 27, 2(134)22
jor changes are proposed and implement-ed to observe the changes made during the lean implementation. As a result, the production process at the inventory level is reduced by 14.02%, which is achieved by regularising proper communications among the employees and the pull sys-tem and implementing 5S in the cutting and sewing sections. The production pro-cess is modified from a progressive bun-dle system to a unit production system.
5S toolThe 5S tool helps everyone by making the opportunity to learn a culture of de-veloping and maintaining a clean and organised working environment. 5S is implemented in the sewing section and cutting section in the garment factory as a model, since it is one of the most critical work areas. The complications in the cutting and sewing section are space utilisation, semi-finished fabric around the sewing machine, unneeded stock between workers, excess invento-ry on the floor, improper flow of need-ed equipment and no floor layout. This is refined by removing excess inventory and introducing a floor layout, as shown in Figure 4.
Sort: All useless items are sorted and eliminated from the sewing section for
smooth flow. In addition to that. the semi-finished fabric is sorted and an or-der number is given in the cutting section to ensure proper fabric identification in the temporary storage, created based on the processing time and sequences of the operations performed in the factory, which results in more space availability.
Shine: Dust, dirt, waste fabrics and oth-er wastes are removed. Temporary stor-age tables and floors have been cleaned according to the time schedule. All ma-chines, tools and work areas are cleaned by the employee at the end of the shift time.
Order: All items are placed and arranged in an appropriate place after sorting and cleaning. The items are arranged in such a way that they are based on the degree of usage in the production process. Semi-fin-ished fabric is arranged in an ‘L’ shaped layout, which enables the smooth flow of materials. To ensure safety in the factory, work surface borders, floor borders for walkways, workways and storage location have been introduced in the section.
Line balancingLine balancing is the one of the important factors to make production flow smooth-er as compared to the normal flow. Rank
Positional Weight (RPA) techniques are used for balancing the line in the sewing section. The preference relationship be-tween each task and the specific order in which the tasks are performed is calcu-lated. After the cycle time (C) is calcu-lated, the theoretical minimum number of workstations is determined in order to satisfy the workstation cycle time:
Cycle time C = Total available period/ Total output required
= 1350/ 350 = 3.85 min/ tees
Number of workstations required, N = = Sum of task time/Cycle time = 26.9/ 3.85 = 6.97 ≈ 7 Stations
Theoretical efficiency of the line TE = = Sum of task time/(Number of sta-
tions × cycle time ) = 26.9/(7 × 3.85) = 99.81%
Actual efficiency of the line TA = = Sum of task time/(Number of sta-
tions × cycle time ) = 26.9 /(8 × 3.85) = 87.33 %
Balancing loss BL = 99.81 – 87.33 = 12.48%
Production target PT at 65% efficiency = = (7 labours × 1350 min/day)/26.9 = 352 tees/day.
Total labour productivity in sewing sec-tion = 352 / 21 = 17 tees/labour/day
Balancing in the line is made by chang-ing the traditional layout to a balanced
Table 2. Line balancing outcomes.
Productivity variable Before line balancing After line balancingLabours per production line 8 Labours/line 7 Labours/line
Production target 44 tees/day/labour 41 tees/day/labourProduction capacity 350/day 352/day
Balancing loss 18% 12.48%
and sewing sections. The production process is modified from a progressive bundle system to a unit
production system.
5S
The 5S tool helps everyone by making the opportunity to learn a culture of developing and
maintaining a clean and organised working environment. 5S is implemented in the sewing section and
cutting section in the garment factory as a model, since it is one of the most critical work areas . The
complications in the cutting and sewing section are space utilisation, semi-finished fabric around the
sewing machine, unneeded stock between workers, excess inventory on the floor, improper flow of
needed equipment. and no floor layout. This is refined by removing excess inventory and introducing
a floor layout, as shown in Figure 4.
Figure 4 – 5S Implementation
Sort : All useless items are sorted and eliminated from the sewing section for smooth flow. In addition
to that. the semi-finished fabric is sorted and an order number is given in the cutting section to ensure
proper fabric identification in the temporary storage, created based on the processing time and
sequences of the operations performed in the factory, which results in more space availability.
Shine : Dust, dirt, waste fabrics and other wastes are removed. Temporary storage tables and floors
have been cleaned according to the time schedule. All machines, tools and work areas are cleaned
by the employee at the end of the shift time.
Order : All items are placed and arranged in an appropriate place after sorting and cleaning. The
items are arranged in such a way that they are based on the degree of usage in the production
process. Semi-finished fabric is arranged in an ‘L’ shaped layout, which enables the smooth flow of
materials. To ensure safety in the factory, work surface borders, floor borders for walkways,
workways and storage location have been introduced in the section.
Line balancing
Figure 4. 5S Implementation.

23FIBRES & TEXTILES in Eastern Europe 2019, Vol. 27, 2(134)
layout model, which demonstrates the amount of improvement considered in the process, as shown in Table 2.
ConclusionsThe lean tool is a potential means of eliminating wastes in an organisation, and recommended for identifying pos-sible improvements in an organisation. During the implementation of lean tools in the garment industry, many potentials have been identified with the analysis of the current state map. These possible im-provements are mapped with the future state map proposed. 5S and line balanc-ing in a garment factory are implement-ed in the sewing and cutting section as a pilot run, which shows a considerable improvement in the factory. Based on the outcomes achieved in this implementa-tion, the following results are obtained:
n A significant achievement is a 34% reduction in the production cycle time, a 14% reduction in the inventory time, and a 32% decrease in the non-value time.
n 5S implementation in cutting and sewing enables better utilisation of re-sources in an effective manner.
n The efficiency of the line is increased by 12.5%, so that human resources can be well utilised.
n The production system has been mod-ified from a progressive bundle sys-tem to a unit production system.
Lean tools have been employed to iden-tify waste, but it is well-known that tool implementation is limited to a single product family. Further research can be extended to implementing lean tools to the rest of the product families in an organisation. Other lean tools can be im-
plemented which will provide even better improvements for an organisation.
References 1. Goh A. Evolution of industrial poli-
cy-making in support of innovation: The case of Singapore. Int. J. Innov. Learn. 2006; 3, 1: 110-125.
2. Mcdonald T, Van Aken E M. International Journal of Applications: A Leading Jour-nal of Supply Chain Utilising Simulation to Enhance Value Stream Mapping: A Manufacturing Case Application. Int. J. Logist. Res. Appl. 2002; 5, 2: 213-232.
3. Forno A J D, Pereira F A, Forcellini F A, Kipper L M. Value stream mapping: A study about the problems and challeng-es found in the literature from the past 15 years about application of Lean tools. Int. J. Adv. Manuf. Technol. 2014; 72, 5-8, 779-790.
4. Akçagün E, Dal V, Yilmaz A. Using Value Stream Mapping At Apparel Industry: a Case Study, no. April, 2015.
5. Bhamu J, Sangwan K S. Lean manufac-turing: Literature review and research issues. Int. J. Oper. Prod. Manag. 2014; 34, 7: 876-940.
6. Grandys E. Production Cycle Model for Short Life Cycle Models. FIBRES & TEXTILES in Eastern Europe 2010, 18, 1(78): 8-12.
7. Kaczorowska-Spychalska D. Shaping consumer behaviour in the fashion in-dustry by interactive communication forms. FIBRES & TEXTILES in Eastern Europe 2018; 26, 4(130): 13-19. DOI: 10.5604/01.3001.0012.1307.
8. Zimon D, Domingues P. Proposal of a concept for improving the sustainable management of supply chains in the textile industry. FIBRES & TEXTILES in Eastern Europe 2018; 26, 2(128): 8-12. DOI: 10.5604/01.3001.0011.5732.
9. Nallusamy S. Enhancement of Produc-tivity and Efficiency of CNC Machines in a Small Scale Industry Using Total Pro-ductive Maintenance. Int. J. Eng. Res. Africa 2016; 25, August: 119-126.
10. Karabay G. et al. Combining lean tools application in kaizen: a field study on the printing industry. FIBRES & TEXTILES in Eastern Europe 2018; 26, 1(127): 8-12.
11. Shah D, Patel P. Productivity Improve-ment by Implementing Lean Manufac-turing Tools In Manufacturing Industry 2018; 3-7.
12. Karabay G, Kurumer G. Managing Through Strategic Performance Man-agement in Apparel Companies. FI-BRES & TEXTILES in Eastern Europe 2012; 20, 4(93): 13-19.
13. Dal V, Akçagün E, Yilmaz A. Using Lean Manufacturing Techniques to Improve Production Efficiency in the Ready Wear Industry and a Case Study. FIBRES & TEXTILES in Eastern Europe 2013; 21, 4(100): 16-22.
14. Suhaimi M F M, Salleh N A M. A case study on the improvement of productivi-ty and efficiency of a quality control line for a cutting tool manufacturer. Journal of Mechanical Engineering 2018; 5(Spe-cialissue1), 222-239.
15. Azizoğlu M, İmat S. Workload smoothing in simple assembly line balancing. Com-put. Oper. Res. 2018; 89: 51-57.
16. Stojanović D, Bašić A. Extended supply chain and small and medium retail en-terprises in Serbian garment industry. FIBRES & TEXTILES in Eastern Europe 2013; 21, 3(99): 13-17.
17. Nallusamy S. Productivity enhance-ment in a small scale manufacturing unit through proposed line balancing and cellular layout. Int. J. Performability Eng. 2016; 12, 6: 523-534.
18. Saravanan V, Nallusamy S, George A. Efficiency Enhancement in a Medium Scale Gearbox Manufacturing Company through Different Lean Tools - A Case Study. Int. J. Eng. Res. Africa 2018; 34: 128-138.
19. Seddik KM. Studying the implementa-tion of 5S system in egyptian garment enterprise. Int. J. Ind. Manuf. Eng. 2017; 11, 7: 1989-1992.
Received 27.11.2017 Reviewed 06.11.2018