d2–d3 expansion segments of the lsu gene of plant-parasiti
TRANSCRIPT

Molecular Phylogenetics and Evolution 43 (2007) 881–890www.elsevier.com/locate/ympev
Application of the secondary structure model of rRNA for phylogeny: D2–D3 expansion segments of the LSU gene of plant-parasitic
nematodes from the family Hoplolaimidae Filipjev, 1934
Sergei A. Subbotin a,g,¤, Dieter Sturhan b, Nicola Vovlas c, Pablo Castillo d, James Tanyi Tambe e, Maurice Moens f, James G. Baldwin a
a Department of Nematology, University of California, Riverside, CA 92521, USAb c/o Institut für Nematologie und Wirbeltierkunde, BBA, 48161 Münster, Germanyc Istituto per la Protezione delle Piante, Sezione di Bari, C.N.R., 70126 Bari, Italy
d Instituto de Agricultura Sostenible, Consejo Superior de Investigaciones CientiWcas, Apdo 4084, 14080 Cordoba, Spaine Via Gasparri 5, 62100 Macerata, Italy
f CLO-Department for Crop Protection, 9820 Merelbeke, Belgiumg Institute of Parasitology, Russian Academy of Sciences, Leninskii Prospect 33, 117071 Moscow, Russia
Received 19 May 2006; revised 25 September 2006; accepted 26 September 2006Available online 7 October 2006
Abstract
Knowledge of rRNA structure is increasingly important to assist phylogenetic analysis through reconstructing optimal alignment, uti-lizing molecule features as an additional source of data and reWning appropriate models of evolution of the molecule. We describe a pro-cedure of optimization for alignment and a new coding method for nucleotide sequence data using secondary structure models of the D2and D3 expansion fragments of the LSU-rRNA gene reconstructed for Wfteen nematode species of the agriculturally important anddiverse family Hoplolaimidae, order Tylenchida. Using secondary structure information we converted the original sequence data intotwenty-eight symbol codes and submitted the transformed data to maximum parsimony analysis. We also applied the original sequencedata set for Bayesian inference. This used the doublet model with sixteen states of nucleotide doublets for the stem region and the stan-dard model of DNA substitution with four nucleotide states for loops and bulges. By this approach, we demonstrate that using structuralinformation for phylogenetic analyses led to trees with lower resolved relationships between clades and likely eliminated some artefactualsupport for misinterpreted relationships, such as paraphyly of Helicotylenchus or Rotylenchus. This study as well as future phylogeneticanalyses is herein supported by the development of an on-line database, NEMrRNA, for rRNA molecules in a structural format for nem-atodes. We also have developed a new computer program, RNAstat, for calculation of nucleotide statistics designed and proposed forphylogenetic studies.© 2006 Elsevier Inc. All rights reserved.
Keywords: Character coding; Bayesian inference; D2–D3 expansion segments; Structural database; Helicotylenchus; Maximum parsimony; Rotylenchus;rRNA; Secondary structure model; Variability map
1. Introduction
Phylogenetic studies using rRNA often ignore that thismolecule is transcribed from genes performing complexsecondary and tertiary structures mediated by base pairing
* Corresponding author.E-mail address: [email protected] (S.A. Subbotin).
1055-7903/$ - see front matter © 2006 Elsevier Inc. All rights reserved.doi:10.1016/j.ympev.2006.09.019
between, sometimes distant, regions of the molecule. Ribo-somal RNA forms helical structures where two regions ofthe sequences are complementary. Pairing within a helixinvolves canonical base pairs, that is, Watson–Crick basepairs and G–U wobble pairs (Wuyts et al., 2001). Knowl-edge of RNA secondary structure is becoming increasinglyimportant in assisting phylogenetic analysis through threemain approaches. First, secondary structure is used to

882 S.A. Subbotin et al. / Molecular Phylogenetics and Evolution 43 (2007) 881–890
identify homologous positions for sets of nucleotides andsequence regions, which are otherwise diYcult to determineusing multiple alignment algorithms (Kjer, 1995). Second,secondary structure can be used as an additional source ofdata incorporating both structural and morphometricparameters of rRNA molecules (Aleshin et al., 1998; Bil-loud et al., 2000; He et al., 2005). Third, secondary structureis used for selecting increasingly appropriate models of evo-lution. It has been shown in many studies that the mode ofevolution within helical regions of rRNA is via compensa-tory or semi-compensatory mutations, and thus, the evolu-tion of bases in structurally related positions is highlydependent. Yet, most substitution models used in phyloge-netic studies treat changes along nucleotide sequences asindependent. The probability method of Bayesian phylog-eny (Hudelot et al., 2003) and approaches consideringempirical substitution rates for unpaired and paired basesmatrices (Smith et al., 2004) have been recently applied tomodeling sequence and structure of rRNA molecules. Sev-eral likelihood-based studies have already shown the supe-riority of considering base pair correlation in RNA stemsover methods assuming independent evolution of nucleo-tides (Muse, 1995; Savill et al., 2001; Telford et al., 2005).Recently, this approach was applied to phylogenetic analy-ses of 18S rRNA of insects (Kjer, 2004) and Bilateria (Tel-ford et al., 2005) using the Markov Chain Monte CarloBayesian search procedure toward resolving problems ofincongruence among phylogenies yielded by other methods.Thus, knowledge of secondary structure allows applying amore sophisticated model, and consequently generating apicture of relationships argued to be more realistic. Withincreasing realization of the importance of secondary struc-ture for accurate sequence alignment and phylogeneticanalysis, the need for secondary structure models of rRNAfor diverse taxonomic groups is becoming more pressing.Such models can best be developed and tested within amonophyletic group of tractable size and for which thereare plausible hypotheses of relationships and outgroupsincluding those based on classical morphological studies.
Nematodes, putatively with more than one million spe-cies, are of particular interest in molecular phylogeneticswith special challenges including apparent rapid rates ofevolution, and conserved or convergent morphology thatconfounds understanding evolution (Baldwin et al., 1999). Inthe face of these diYculties, SSU based phylogenies usinglimited representatives have identiWed major clades (Hol-terman et al., 2006), but considering the scope of the phylum,complex models such as considering secondary structure ofrRNA are best developed and Wrst applied within more dis-crete monophyletic groups within Nematoda. The familyHoplolaimidae (order Tylenchida), with more than 400 spe-cies, is particularly promising for developing such methodsbecause as cosmopolitan plant parasites their taxonomy isbetter understood than most groups, and they are widelyregarded as monophyletic. Furthermore, reWning their phy-logeny is particularly relevant to understanding the evolu-tion of pathways for pathogenesis because they are
demonstratably the outgroup for worldwide one of the mostagriculturally important groups of pests, the cyst nematodes,Heteroderidae (Baldwin, 1992; Baldwin et al., 2004; Subbo-tin et al., 2006). By contrast to sedentary Heteroderinae,adults of Hoplolaimidae are vermiform (0.5–2 mm long)migratory ecto- or semi-endo-parasites of roots. As patho-gens on crops, many including Helicotylenchus multicinctus,Rotylenchus robustus, Rotylenchus uniformis, and Scutello-nema brachyurus result in signiWcant economic loss (Castilloand Vovlas, 2005; Siddiqi, 2000). On the basis of morpholog-ical diversity Hoplolaimidae currently is comprised of threesubfamilies (Aphasmatylenchinae, Hoplolaiminae, andRotylenchoidinae) and 11 genera (Siddiqi, 2000). Compara-tive morphology has been the basis to postulate evolution-ary transformation of hoplolaimids (Geraert, 1990), but aphylogenetic analysis based on morphological characters orDNA markers has not been attempted.
The D2 and D3 expansion segments of the 28S rRNA areoften sequenced in studies of nematode phylogenetics due tothe availability of conserved primers amplifying DNA frommany taxa, and the presence of phylogenetically informativesites. Thus, there has been a growing shift from 18S rRNAtoward including the D2 and D3 segments for analyzing rela-tionships including higher taxonomic levels; examplesinclude studies among orders of the phylum Nematoda (Lit-vaitis et al., 2000), within the order Tylenchida (Subbotinet al., 2006), suborder Criconematina (Tylenchida) (Subbotinet al., 2005), and Cephalobina (Nadler et al., 2006) as well aswithin genera of several orders: Pratylenchus (Al-Bannaet al., 1997; Duncan et al., 1999), Acrobeloides (De Ley et al.,1999), Steinernema (Stock et al., 2001), Meloidogyne (Castilloet al., 2003; Tenente et al., 2004), Longidorus (Rubtsova et al.,2001; He et al., 2005). The D2-D3 expansion segments arealso considered as promising loci for DNA barcoding ofnematodes (De Ley et al., 2005).
Herein, we reconstruct and examine the secondary struc-ture of the D2 and D3 expansion segments of LSU rRNAto improve an automatic alignment; also we use secondarystructure information for construction of phylogenetic treesof hoplolaimids. We present a variability map of D2 andD3 expansion fragments superimposed on the putative sec-ondary structure. We propose a new coding method forunpaired and paired bases of secondary structure similar tothose used by Smith et al. (2004), but herein convertingsequence alignment into a 28 symbol code. Original andconverted sequence data are analyzed by maximum parsi-mony and Bayesian inference considering a complex modelof evolution for Hoplolaimidae with outgroup representa-tives from suborder Hoplolaimina.
2. Materials and methods
2.1. Nematode populations, DNA extraction, PCR, and sequencing
Original data including 28 DNA sequences were collectedfrom 22 nematode samples belonging to 11 nominal and four

S.A. Subbotin et al. / Molecular Phylogenetics and Evolution 43 (2007) 881–890 883
unidentiWed species. Representatives of the Hoplolaimidaeoutgroup were selected based on Subbotin et al. (2006) dataas Radopholus sp. (family Pratylenchidae) and Meloidoderaalni (family Heteroderidae) (Table 1). Three to Wfteen nema-tode specimens of each sample were transferred to an Eppen-dorf tube containing 16�l ddH2O, 2�l 10£ PCR buVer and2�l proteinase K (600�g/ml) (Promega, Benelux, The Neth-erlands) and crushed during 2min with a microhomogeniser,Vibro Mixer (Zürich, Switzerland). The tubes were incubatedat 65 °C (1 h) and then at 95 °C (15 min). Detailed protocolsfor PCR, cloning and automated sequencing were asdescribed by Subbotin et al. (2005). The forward D2A (5�-CAAGTACCGTGAGGGAAAGTTG-3�) and reverse D3B(5�-TCGGAAGGAACCAGCTACTA-3�) primers wereused for ampliWcation and sequencing of the fragment of the28S rRNA gene. The sequences reported here have beendeposited in the GenBank database under the accessionnumbers given in Table 1. Voucher specimens are stored innematode collections of Istituto per la Protezione dellePiante, Italy, Institut für Nematologie und Wirbeltierkunde,Germany and Instituto de Agricultura Sostenible, Spain.
2.2. Secondary structure prediction and sequence alignment
Secondary structure was predicted separately for eachmolecular segment and for each sequence. For structuralmodeling, we Wrst reconstructed consensus structure forgeneral model of hoplolaimids and then proceeded to opti-mization of an individual model for each taxon. This proce-dure included several steps: (i) each individual sequencewas submitted to the Mfold software program Version 3(http://www.bioinfo.rpi.edu/~zukerm/) (Zuker, 1989) to pre-dict structure using the energy minimization approach; (ii)consensus structure for each helix for a general model wasdesigned considering all optimal and suboptimal foldingsobtained from all sequences; (iii) general model of D2 orD3 segments was manually reconstructed assembling helixstructures; (iv) complete secondary structure for eachsequence was manually reconstructed using a generalmodel and comparative sequence analysis. Structures werevisualized using RnaViz (De Rijk et al., 2003) and Pseudo-Viewer 3 (Han et al., 2002) and drawn using vector graphseditor Adobe Illustrator® v10. Variability of sites for the
Table 1List of nematode species and populations used in the study
a For purposes of clarity and consistency, taxonomic categories referred to in this work are those of Siddiqi (2000).
Genusa and species Locality GenBank Accession No. Collector and/or identiWer
Subfamily Rotylenchoidinae Whitehead, 1958Helicotylenchus Steiner, 1945
H. multicinctus (Cobb, 1893) Golden, 1956 Sudan DQ328745, DQ328746 G. A.A. Elbadri, S.A. SubbotinH. pseudorobustus (Steiner,1914) Golden, 1956, type “A” Germany, Münster DQ328751 D. SturhanH. pseudorobustus, type “B” China, Beijing DQ328747, DQ328749 D. Peng, D. SturhanH. pseudorobustus, type “B” California, Fresno USA DQ328748 S.A. SubbotinH. pseudorobustus, type “B” Italy DQ328750 N. VovlasH. vulgaris Yuen, 1964 Italy, Ancona DQ328759- DQ328761 J. Tanyi Tambe, S.A. SubbotinH. digonicus Perry, Darling & Thorne, 1959 Italy DQ328758 N. VovlasHelicotylenchus sp. 1 Russia, Moscow region DQ328734 V.N. ChizhovHelicotylenchus sp. 2 Russia, Moscow region DQ328755 S.A. SubbotinHelicotylenchus sp. 3 Belgium, Ghent DQ328754 J. Tanyi Tambe
Rotylenchus Filipjev, 1936R. uniformis (Thorne, 1949) Loof & Oostenbrink, 1958 Belgium, Ghent DQ328738 J. Tanyi Tambe, D. SturhanR. uniformis Belgium, Poppel DQ328739, DQ328740 J. Tanyi Tambe, D. SturhanR. uniformis Belgium, Bruges DQ328735, DQ328736 J. Tanyi Tambe, D. SturhanR. uniformis The Netherlands, Elst DQ328737 J. Tanyi Tambe, D. SturhanR. goodeyi Loof & Oostenbrink, 1958 Spain, Cádiz DQ328756 P. CastilloR. laurentinus Scognamiglio & Talame, 1973 Italy DQ328757 N. VovlasR. eximius Siddiqi,1964 Spain, Huelva DQ328741 P. CastilloRotylenchus sp.1 Italy, Trentino DQ328743 N. VovlasRotylenchus sp.1 Russia, Moscow region DQ328742 S.A. Subbotin
Subfamily Hoplolaiminae Filipjev, 1934Scutellonema Andrassy, 1958
S. brachyurus (Steiner, 1938) Andrassy, 1958 Italy DQ328753 N. Vovlas
Hoplolaimus Daday, 1905H. seinhorsti (Luc, 1958) Shamsi,1979 Israel DQ328752 N. Vovlas
Peltamigratus Sher, 1964P. perscitus Doucet, 1980 Spain, Cádiz DQ328744 P. Castillo
Outgroup taxaRadopholus sp. Viet Nam DQ328712 Subbotin et al. (2006)Meloidodera alni Turkina & Chizhov, 1986 Belgium DQ328706 Subbotin et al. (2006)

884 S.A. Subbotin et al. / Molecular Phylogenetics and Evolution 43 (2007) 881–890
LSU segments was calculated using maximum parsimonywith PAUP¤ 4b4a (SwoVord, 2003). Gaps were coded as theWfth characters. The number of changes were mapped onthe consensus structural model.
The thirty-one sequences of ingroup and outgroup taxawere aligned using ClustalX1.64 (Chenna et al., 2003) withdefault parameters for gap opening and gap extension. Onesequence for each species was included for alignment andsubmitted for phylogenetic analysis. Secondary structuralsequence alignment was created using several steps: (i) heli-ces were manually aligned using a graph editor by insertionof gaps in one or both strands; (ii) these gaps were alsomanually inserted into automatic alignment using sequenceeditor GenDoc 2.5 (Nicholas et al., 1997); (iii) eachsequence was converted in dot-bracket format and correct-ness of insertion/deletion position for each sequence wasveriWed by visually checking each secondary structuremodel with PseudoViewer 3. Statistics for nucleotide com-position in stems and loops, nucleotide pairings, calculationof a consensus sequence, new sequence coding and convert-ing individual sequences into dot-bracket RNA structureformat were made using our new program, RNAstat (http://www.nemamex.ucr.edu/rna/stat). D2 and D3 sequenceinformation on secondary structure, in dot-bracket struc-ture, was formated for all species studied here and was thendeposited in the new on-line database NEMrRNA (http://www.nemamex.ucr.edu/rna).
2.3. Phylogenetic analysis of molecular data and sequence coding
Sequence data were analyzed using maximum parsi-mony (MP), and Bayesian inference (BI). Unweighted andweighted MP analyses were performed with PAUP¤ 4b4a.Heuristic search settings included: 10 replicates of randomtaxon addition, tree bisection-reconnection branch swap-ping, multiple trees retained, no sleepest descent, and accel-
erated transformation. Dataset from original sequencealignment was submitted for weighted MP analysis, inwhich transversion were weighted twice as much as transi-tion. Datasets from both the original and convertedsequence alignment were submitted by unweighted parsi-mony. Original sequences were converted to treat stem andloop regions uniformly. We converted unpaired and pairedbases of secondary structure into a 28 symbol code, desig-nating one symbol for each of the four unpaired bases andone symbol for each of the 16 bp combinations. We alsoassigned eight additional numerical symbols to unpairedbases appearing in stems; this approach is similar to that ofSmith et al. (2004) in which a 20-letter symbol code wasproposed. The code used herein is presented in Fig. 1 withan example showing conversion of the RNA sequence gen-erated by our RNAstat program. Robustness of the cladeswas assessed using the MP bootstrap analysis yielding abootstrap percentage (BP) for each node estimated from1000 replicates.
Bayesian inference analysis (BI) of the dataset was con-ducted using MrBayes 3.0 (Huelsenbeck and Ronquist,2001) with two approaches. For the Wrst analysis, a general-time-reversible (GTR) model of nucleotide substitution wasused; this included a proportion of invariable sites (I) and agamma distribution (G) of among-site-rate heterogeneitywith six rate categories. This model was estimated by AkaikeInformation Criterion with ModelTest as the best-Wt to thepresent dataset (Posada and Crandall, 1998). The secondanalysis was conducted for the secondary structure align-ment under the complex model. This included the doubletmodel with 16 states of nucleotide doublets for the stemregion. It also included the standard model of DNA substi-tution with four nucleotide states for loops and bulges and agamma distribution (G) of among-site-rate heterogeneitywith six rate categories (Ronquist and Huelsenbeck, 2005).All Bayesian analyses were initiated with random startingtrees and were run with four chains for 1.0£106 generations.
Fig. 1. Code for RNA secondary structure and an example of conversion of RNA sequence using RNAstat program.

S.A. Subbotin et al. / Molecular Phylogenetics and Evolution 43 (2007) 881–890 885
The Markov chains were sampled at intervals of 100 genera-tions. Two runs were performed for each analysis. The log-likelihood values of the sample points stabilized afterapproximately 103 generations. After discarding burn-insamples and evaluating convergence, the remaining sampleswere retained for further analysis. The topologies were usedto generate a 50% majority rule consensus tree. Posteriorprobabilities (PP) are given on appropriate clades.
3. Results
3.1. Sequence variability and secondary structure of the D2 and D3 expansion segments
Length of the whole D2–D3 expansion segments, includ-ing junction sequences between these two segments, variedfrom 555 bp (S. brachyurus) to 566 bp (R. goodeyi andR. laurentinus). Percentage sequence divergences rangedfrom 0 to 17.8% among ingroup species, to 21.1% among allspecies. SigniWcant intraspeciWc variation was detected forH. pseudorobustus. Sequences of the D2–D3 segment forH. pseudorobustus from China, USA and Italy were identi-cal, whereas they diVered by 14 substitutions (2.5%) fromthose of H. pseudorobustus from Germany; such sequencevariation might indicate sibling species within this putativeextant species. We tentatively designate these divergentpopulations of H. pseudorobustus as type ‘A’ and type ‘B’,respectively. DiVerences in sequences among populationsand clones of R. uniformis were estimated as only in fournucleotides (0.7%). Three sequenced clones of H. vulgarisdiVered by Wve nucleotides (0.9%) and two clones of H.muticinctus diVered by six nucleotides (1.1%). R. goodeyiand R. laurentinus showed identical sequences.
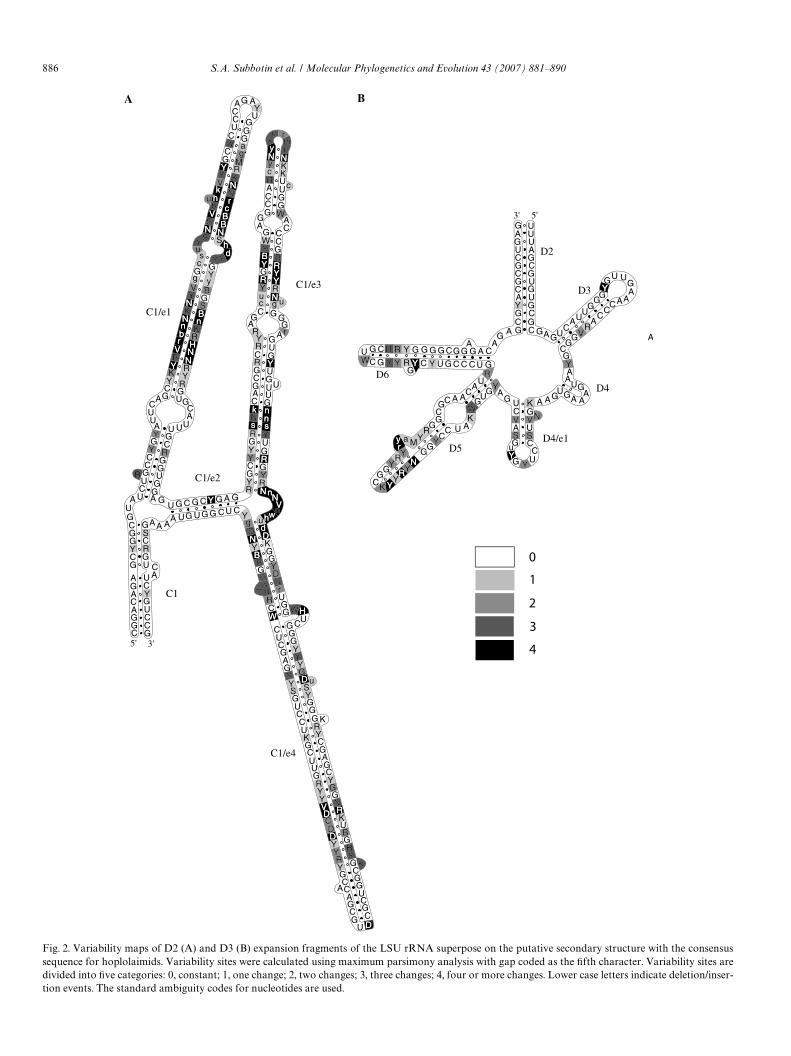
Predicted consensus secondary structures of D2 and D3expansion fragments of the LSU rRNA with mappingnucleotide changes for hoplolaimids are shown in Fig. 2. Alargely similar folding pattern was observed for all exam-ined hoplolaimids and outgroup species; homologyincludes folding of the D2 domain into several helicesC1–C1/e4 and the D3 includes folds D2–D6 as named byWuyts et al. (2001). For hoplolaimids the D2 and D3 aver-age base composition was as follows: AD 14.8%,UD 21.9%, CD 26.2%, and GD37.0%; in stems averagebase pairs were as follows: CG/GCD29.0/22.7%, GU/UGD12.6/10.1% and AU/UAD 7.3/8.4%. Several non-canonical base pairs: CU/UC, GA/AG, AA and UU andunpaired nucleotides were also encountered in most vari-able sites of D2 segments (Figs. 2 and 3).
Variability of the nucleotide sites mapped in the shape ofthe model is shown in Fig. 2. Several variable areas can bedistinguished in D2 and D3 segments; the helix C1/e1 of theD2 segment contained sites with the highest rate of substi-tution and insertion/deletion events. Most variable regionswere on stems rather than on loops, except for a bulgebetween C1/e3 and C1/e4. Almost 50% of the base pairs inthe stem regions, as revealed from the analysis of the con-sensus structure (Fig. 2), were constant with dominance of
GC/CG in 62.5%, and AU/UA and GU/UG in 17.3% and20.2%, respectively. In most cases nucleotides of base pairsof both strands have approached identical or nearly identi-cal rates of change as expected from the compensatorynature of mutations. There was a strong bias in mutationrates for one of the nucleotides in pairs. More than 70% ofbase pairs with a constant position for one strand and avariable position for the other occurred for constant Gmainly paired with U, C or A, or as GY or GM pairs in theconsensus structure (Fig. 2).
Use of the secondary structure information for eachsequence allowed reconstruction of an optimal alignmentwith a relatively precise estimation of homology of nucleo-tide positions. Using graph editor we were able to alignhelices introducing insertions in both strands of the RNAmolecule (Fig. 3).
3.2. Phylogenetic relationships within Hoplolaimidae
After converting original sequence data to a symbolcode, the total number of characters decreased by 1.56times, whereas the number of informative charactersdecreased by 1.43 times. A single tree obtained from ouroriginal and converted data sets using maximum parsi-mony had a similar topology, diVering only by the positionof Peltamigratus, which clustered with Hoplolaimus in atree obtained from the converted data (Fig. 4). Comparisonof these MP results revealed a reduction in the BP valuesfor several clades in the parsimonious tree generated fromthe converted dataset, but not for Decay index. The inXu-ence of a complex model of RNA evolution, consideringpaired nucleotides in stems and unpaired in loops, for treetopology under BI was more evident than for those underMP. BI under the complex, structure-informed modelresulted in a consensus tree with unsolved polytomy forseveral main hoplolaimid clades, in contrast to treesobtained under the GTR model (Fig. 5). Paraphyly of Heli-cotylenchus and Rotylenchus, observed in the majority ruleconsensus tree under the GTR model (Fig. 5A), was notevident under the complex model (Fig. 5B). Notably, underMP (Fig. 4B) using converted data and BI (Fig. 5B) withthe complex model, Scutellonema clustered with the cladeof H. pseudorobustus and H. multicinctus, suggesting para-phyly of Hoplolaiminae.
4. Discussion
4.1. Universal structure of D2 and D3 segments for nematodes
The secondary structure model for the taxa used in thisstudy is a good Wt for a universal model of the D2 and D3fragments of LSU rRNA (Michot and Bachellerie, 1987;Wuyts et al., 2001; Gillespie et al., 2005) for eukaryoticorganisms. The structural model has the same helix num-bers and similar conserved features, indicating a strongevolutionary functional constraint in the structural pattern
886 S.A. Subbotin et al. / Molecular Phylogenetics and Evolution 43 (2007) 881–890
tion events. The standard ambiguity codes for nucleotides are used.
Fig. 2. Variability maps of D2 (A) and D3 (B) expansion fragments of the LSU rRNA superpose on the putative secondary structure with the consensussequence for hoplolaimids. Variability sites were calculated using maximum parsimony analysis with gap coded as the Wfth character. Variability sites aredivided into Wve categories: 0, constant; 1, one change; 2, two changes; 3, three changes; 4, four or more changes. Lower case letters indicate deletion/inser-

S.A. Subbotin et al. / Molecular Phylogenetics and Evolution 43 (2007) 881–890 887
of this part of the rRNA molecule. Only one structuralcomponent of our model diVers from some previouslydescribed models for some other nematodes. The C1/4ehelix in Caenorhabditis elegans (Michot and Bachellerie,1987) and Labiostrongylus bipapillosus (Chilton et al., 2003)was reported as drastically truncated and composing 14–8nucleotides, whereas in longidorids (He et al., 2005), crico-nematids (Subbotin et al., 2005) and hoplolaimids (present
study) this helix is signiWcantly longer and contains morethan 100 nucleotides.
One of the main problems with utilizing secondary struc-ture is rather low accuracy for its prediction from sequencedata. Although several approaches for reconstruction ofsecondary structure have been proposed (Knudsen andHein, 1999), the most eYcient algorithm of folding is basedon the energy minimization approach considering many
Fig. 3. Putative aligned structures for C1/e1 helices of the D2 segment for hoplolaimid and outgroup species. Nucleotides in which substitutions haveoccurred are indicated in gray ovals, as are insertions/deletions.
CCUCUGGGCAUCUG
ACC
UU
GGG
ACGACGC
CUC
CA
G AUU
GG
AGUGUUGU
UUU
G U
CCGU
UGGGUGCUGCGUGGU
Radopholus sp.
GCCGUGGGCCGUCUG
GCG
UCAGGG
AUGCCGCUCUC
CA
G AUU
GGGA
CGGUGG
CCUG
U
CUGC
UGGGCGGUCCGUGGU
R. eximius
GGUCGGCG
UCAGGG
C
CUCGCUCUC
CA
G ACU
GGGAGCGUGUG
CCUUG
CACU
GUCGGCC
UCUGGCCUGUA
UUC
AGCCGUGCGC
U AUGCACAUGGU G
CAU
UUGCAGGU
GGA
P. perscitus
G AUU
GGGA
CUUUGG
CUUAA
CCGCUCGGGA
GCUUGUGGUG
CAU
UUGCAGGU
UGU
M. alni
UCUUACCUGUAU
UCA G
CCUUGGGC
UUUCGGGCG
CUAGG
UCGUUGCUCUC
CA
CCGUGGACUCGGUG
GCG
UCAGGG
UU
GCCGCUC G
A
CGGUG
CUCUG
CU
CUGC
UGCUGGGUUUGUGGU
UC
CAG A
UU
GG
R. goodeyi
GCCGCCG
CGCGUCG
G
G
CCCCGGUUUGCCGCACUC
GGA
AGGUGG
CUGGGC
UGC
UGGCGUGUCGGUGGU
CG
AG A
UU
H. pseudorobustus
GCCUUGGAGCAUCUG
GCG
UU
GUGG
UGUUGCUCUC
CA
G A UU
GGGA
CAGCA
UUGC U
UCU
GC
UGGGUGAACCGUGGU
H. seinhorsti
GCUGUGCGCUCGUCA
GC
UU
CGGCY
GAYCGC
CUC
CA
G AUU
GGG
GCGGCC
AGCCGU
U
UGC
UGGCGGGCUUGCAGU
S. brachyurus
GCCGCUCG
UUGUCG
GCC
CACCG
UUGCUGCACUC
CAG A
UU
GGGA
AGGCGG
CGUGG
G
CGC
UGGCUG
CGUGUGGU
H. multicinctus
GCCGUGCGCUCGCCG
GCG
UCAGAG
AUGCCGCUCUC
CA
G AUU
GGGA
CGGUG
C
CUG
UCU
GC
UGGUGGGUGUGUGGU
Rotylenchus sp.1
GCCGCGC
CCCGCUG
GCG
UCAGGG
AUGCCGCUCUC
CAG A
UU
GGGA
CGGUGG
CCUGA
CUGC
CGGUGGGUUUGUGGU G
CCGCGA
CCCGCUG
GCG
UCAGGG
AUGCCGCUCUC
CA
G AUU
GGGA
CGGUGG
UCUGA
CUGCUCGGCGGGUUUGUGGU
Helicotylenchus sp. 2
G GGCAU
UUGCGGGU
GGAU
CUAGCCCGUA
UUC
A GCAU
UUGCGGGU
GGAU
CUAGCCUGCAU
UC
A GCAUUU
G CAGGU
GGAU
CUGGCCUGCAU
UC
AG
CAU
UUG CAGGU
GGA
GCA
UUU
G CAGGU
GGA
GCAU
UUG CAGGU
GGA
GCAU
UUG CAGGU
GGA
GCAU
UUG CAGGU
GGA
GCAU
UUG CAGGU
GGA
GCAU
UUG CGGGU
GGAU
CUGGCCUGCA
UUC
A
UCUGGCCUGUA
UUC
A
UCUGGCCUGCAU
UC
A
UCUGGCCUGCAU
UC
A
UCUGGCCUGCAU
UC
A
UCUGGCCCGCAU
UC
A
UCUGGCCUGUAU
UC
A
Helicotylenchus sp.1
GCCGUGC
CCCGCUG
GCG
UCAGGG
AUGCCGCUCUC
CA
G AUU
GGGA
CGGUGG
UCUGU
CUGC
CGGCGGGUUUGUGGU
H. vulgaris
GCAUUU
G CAGGU
GGAU
CUGGCCUGCAU
UC
AGCCGCGC
CCCGCUG
GCG
UCAGGG
AUGCCGCUCUC
CA
G AUU
GGGA
CGGUGG
UCUGA
CUGCUCGGUGGGUUCGUGGU
H. digonicus
GCAUUU
G CAGGU
GGAU
CUGGCCUGCAU
UC
A
Fig. 4. A single maximum unweighted parsimony tree obtained from original (A) and converted (B) sequence alignments (Tree statistics: (A) Treelength D 569, parsimony informative characters D 148, CI excluding uninformative characters D 0.5066, HI excluding uninformative characters D 0.4934.(B) Tree length D 504, parsimony informative characters D 103, CI excluding uninformative characters D 0.6034, HI excluding uninformativecharacters D 0.3966). Bootstrap values more than 50% obtained for unweighted and weighted parsimony analyses are given for appropriate clades. Decayindex less than six are given for unweighted parsimony tree in brackets.

888 S.A. Subbotin et al. / Molecular Phylogenetics and Evolution 43 (2007) 881–890
thermodynamic parameters. This algorithm does not con-sider functional constraints of the RNA molecule and oftenshows a low percentage of prediction accuracy for largemolecules. Comparative sequence analyses with mapping ofcompensatory mutations across a large taxonomic samplecan serve as an eYcient guide to determine structural com-ponents for most ambiguous regions. However, this workrequires careful manual estimation of each position whichcannot be always objective. In the present study we appliedsuch a stepwise approach for reconstruction of this part ofthe molecule combining an energy minimization approachfor separate prediction of helix structures and comparativesequence analyses for reconstruction of consensus struc-ture. Future experimental research and more comprehen-sive analyses will allow optimizing proposed models.
Several ways of measuring the variability site of rRNAmolecules have been proposed and applied (Van de Peeret al., 1996). This study is the Wrst to present the variabilitymap for D2 and D3 segments of the LSU for nematodes asdeWned by maximum parsimony analysis. It has an advan-tage over other methods, because it allows considering inser-tion/deletion events for calculation. Detailed informationabout the variability and conservation of the rRNA mole-cule is important for understanding fundamental questionsof evolution of the main component of ribosomes as well asapplications of molecular diagnostics and phylogeny. Spe-ciWcally, this information is useful for recognizing taxon-spe-ciWc sequence signatures and designing diagnostic probes. Inthe case of phylogenetic studies this information is impor-tant for construction of precise alignments and selection ofthe most sophisticated and appropriate evolution model.
4.2. rRNA structural database
The rapidly growing body of rRNA sequence data pro-vides a resource from which biologists can infer evolution-
ary histories of organisms. Today many phylogenetic andcomparative biology studies use rRNA sequence dataobtained from public databases. Increasing recognition ofthe value of secondary structure models of RNA moleculesfor alignment and phylogenetic procedures raises the prob-lem of broad access to such structural information for awide range of taxa (Wuyts et al., 2004; Schultz et al., 2006).To overcome this problem we developed a specialized data-base NEMrRNA (http://www.nemamex.ucr.edu/rna) forstoring rRNA structural information for nematodes. Thepresent version of the database, which is maintained by ourresearch group, contains information on secondary struc-tures of the D2, D3 of the 28 rRNA and the ITS2 rRNA.Sequences in the database can be obtained via the queryinterface searching for species name, genus name, or Gen-Bank accession number.
4.3. New method of sequence coding and its application for phylogenetic study
Although knowledge of the secondary structure allowsapplying more sophisticated models of nucleotide substi-tution by BI and theoretically gives a more realistic pic-ture of relationships, it is nevertheless useful to comparesuch Wndings with simpler approaches including parsi-mony. A new coding method for nucleotide base pairdeveloped here, is similar to that of Smith et al. (2004).However, it diVers by a 28 symbol code (versus a 20 lettersymbol code) including eight numerical symbols forunpaired bases appearing in each strand, and speciWcallyin the most variable sites of molecule. This new method ofcoding secondary structure allows application of the max-imum parsimony method for analysis of secondary struc-ture and thus, comparison of trees derived from MP andBI analyses using similar data sets. As anticipated, the MPand BI trees obtained using converted data and a complex
Fig. 5. The 50% majority rule consensus trees from Bayesian analysis generated with (A) the GTR+I+G model and (B) the complex model: 4 £ 4 modelfor loops and 16 doublets model for stems of the secondary structure.

S.A. Subbotin et al. / Molecular Phylogenetics and Evolution 43 (2007) 881–890 889
model that considers paired nucleotides in stems andunpaired in loops, respectively, showed reduced statisticalsupport compared to traditional models. This loss of reso-lution is predicted by consideration of a reduced numberof independently evolving characters.
4.4. Phylogenetic reconstruction of hoplolaimid evolution
Application of the secondary structure model of rRNAfor phylogenetic analyses of hoplolaimids led to trees withlower resolved relationships between clades and likelyeliminated some artefactual support for misinterpretedrelationships, such as paraphyly of Helicotylenchus orRotylenchus. Paraphyly of these taxa derived from themodels considering secondary structure are less evidentand the results are more consistent with traditional mor-phologically-based views of an evolutionary frameworkincluding these genera.
Geraert (1990) pointed out that genera united in thesubfamily Hoplolaiminae could have divergent phyloge-netic origins. These nematodes share large scutellum-likephasmids (a pair of complex sensory organs), which inScutellonema are located near the anus as in Rotylencho-idinae whereas in other genera scutella are more anteri-orly positioned as pre- or postvulval. Geraert (1990) alsospeculated that the subfamily may reXect a morphologicaltransformation series of small and pore-like phasmids asin Rotylenchoidinae and some Scutellonema species, toprogressive enlargement and more anterior placement asexpressed in Peltamigratus and Aorolaimus. Geraert fur-ther speculated that evolution of Hoplolaimus could haveinvolved overall body enlargement from a Peltamigratus-like ancestor. This speculation is supported by treesobtained using secondary structure information; in theMP tree Hoplolaimus and Peltamigratus clusteredtogether. The position of Scutellonema clustered withHelicotylenchus in these trees, suggests that the relativelyposterior position of phasmids is more informative ofphylogenetic relationships, than is the size of phasmids.This observation further suggests convergent origin ofenlarged phasmids. Although it suggests possible poly-phyly of the Hoplolaiminae within Hoplolaimidae, insome trees derived from a larger data set for Tylenchidathe genera of Hoplolaiminae clustered together (Subbotinet al., 2006), and thus the matter remains unresolvedpending further investigation.
Species groupings for Helicotylenchus and Rotylenchusraise additional important hypotheses for future testing.Surprisingly, molecular analysis revealed almost identicalsequences for R. goodeyi and R. laurentinus suggesting thatthey are very closely related or co-speciWc. This groupingclearly contradicts morphological diVerences with respectto numbers of lip annuli, cuticular patterns, stylet length,position of the dorsal gland oriWce and vulva position(Castillo and Vovlas, 2005). Although our data might indi-cate that some classical characters, such as longitudinalstriations, are not phylogenetically informative in this con-
text, these hypotheses must be further tested includingmolecular analysis of multiple geographically divergentpopulations of these species.
The present study strongly supports a unique sharedlineage of H. pseudorobustus and H. multicinctus and this isstrengthened by additional phylogenetic analyses includingseveral populations of both species (Amiri, personal com.).Nevertheless these species are described as having signiW-cantly diVerent morphologies with respect to tail shape, sty-let knob morphology and morphometrics of the body andstylet. Such unexpected clustering of morphologicallydivergent species raises interesting questions of incongru-ence including relative rates of morphological and molecu-lar evolution in hoplolaimids.
Although, incorporating secondary structure informa-tion allows improved estimates of phylogeny, relationshipsamong several main hoplolaimid clades remain poorlyresolved. Greater phylogenetic resolution will requiresequencing additional taxa, rRNA fragments and genes.The present study of the D2 and D3 expansion regions ofthe 28S rRNA gene thus provides initial insight towardresolving phylogenetic relationships among hoplolaimids,while still pointing to key areas for further testing. Toobtain a more robust perspective, it is necessary to analyzea larger number of species including some rare genera, forwhich the phylogenetic position remains controversial. Fur-thermore, more intensive sampling of hoplolaimids fromdiVerent regions should be implemented, thereby wouldimprove our knowledge about patterns of hoplolaimid rela-tionships among species.
The present work uses hoplolaimids as a model toemphasize the importance of establishing the rRNA sec-ondary structure model for phylogenetic studies in nema-todes; the result is sequence alignment with greaterconWdence and selection of increasingly appropriate modelsof evolution. This approach can be easily generalized toadditional groups of nematodes as the proposed structureprovides guidelines for aligning new sequences from relatedtaxa and for selecting evolution models for reconstructionof deeper-level nematode phylogenies.
Acknowledgment
The authors acknowledge support from the US NationalScience Foundation Grant DEB 0228692, USDA Grant2005-00903, and Grant RFBR 04-04-48051.
References
Al-Banna, L., Williamson, V., Gardner, S.L., 1997. Phylogenetic analysis ofnematodes of the genus Pratylenchus using nuclear 26S rDNA. Mol.Phylogenet. Evol. 7, 94–102.
Aleshin, V.V., Kedrova, O.S., Milyutina, I.A., Vladychenskaya, N.S., Pet-rov, N.B., 1998. Secondary structure of some elements of 18S rRNAsuggests that strongylid and a part of rhabditid nematodes are mono-phyletic. FEBS Lett. 429, 4–8.
Baldwin, J.G., 1992. Evolution of cyst and non-cyst-forming Heteroderi-nae. Annu. Rev. Phytopathol. 30, 271–290.

890 S.A. Subbotin et al. / Molecular Phylogenetics and Evolution 43 (2007) 881–890
Baldwin, J.G., Nadler, S.A., Freckman, D.W., 1999. Nematodes—pervad-ing the earth and linking all life. In: Raven, P.H., Williams, T. (Eds.),Proceedings of the Second National Forum on Biodiversity, Natureand Human Society: The Quest for a Sustainable World, NationalAcademy Press, pp. 176–191.
Baldwin, J.G., Nadler, S.A., Adams, B.J., 2004. Evolution of plant parasit-ism among nematodes. Annu. Rev. Phytopathol. 42, 83–105.
Billoud, B., Guerrucci, M.A., Masselot, M., Deutsch, J.S., 2000. Cirripedephylogeny using a novel approach: molecular morphometrics. Mol.Biol. Evol. 17, 1435–1445.
Castillo, P., Vovlas, N., 2005. Bionomics and IdentiWcation of the GenusRotylenchus (Nematoda: Hoplolaimidae). Brill Academic Publishers,Leiden, Netherlands. pp. 377.
Castillo, P., Vovlas, N., Subbotin, S., Troccoli, A., 2003. A new root-knotnematode: Meloidogyne baetica n. sp. (Nematoda: Heteroderidae) par-asitizing wild olive in Southern Spain. Phytopathology 93, 1093–1102.
Chenna, R., Sugawara, H., Koike, T., Lopez, R., Gibson, T.J., Higgins,D.G., Thompson, J.D., 2003. Multiple sequence alignment with theClustal series of programs. Nucleic Acids Res. 31, 3497–3500.
Chilton, N.B., Huby-Chilton, F., Gasser, R.B., 2003. First complete largesubunit ribosomal RNA sequence and secondary structure for a para-sitic nematode: phylogenetic and diagnostic implications. Mol. Cell.Probes 17, 33–39.
De Ley, P., De Ley, I.T., Morris, K., Abebe, E., Mundo-Ocampo, M.,Yoder, M., Heras, J., Waumann, D., Rocha-Olivares, A., Jay Burr,A.H., Baldwin, J.G., Thomas, W.K., 2005. An integrated approach tofast and informative morphological vouchering of nematodes forapplications in molecular barcoding. J. Philos. Trans. R. Soc. Lond, B;Biol. Sci. 360 (1462), 1945–1958.
De Ley, P., Felix, M.A., Frisse, L.M., Nadler, S.A., Sternberg, P.W.,Thomas, W.K., 1999. Molecular and morphological characterisation oftwo reproductively isolated species with mirror-image anatomy (Nem-atoda: Cephalobidae). Nematology 2, 591–612.
De Rijk, P., Wuyts, J., De Wachter, R., 2003. RnaViz2: an improved repre-sentation of RNA secondary structure. Bioinformatics 19, 299–300.
Duncan, L.W., Inserra, R.N., Thomas, W.K., Dunn, D., Mustika, I., Frisse,L.M., Menders, M.I., Morris, K., Kaplan, D.T., 1999. Molecular andmorphological analysis of isolates of Pratylenchus coVeae and closelyrelated species. Nematropica 29, 61–80.
Geraert, E., 1990. Evolution in hoplolaims (Nematoda: Tylenchida).Nematologica 36, 199–204.
Gillespie, J.J., Munro, J.B., Heraty, J.M., Yoder, M.J., Owen, A.K., Carmi-chael, A.E., 2005. A secondary structural model of the 28S rRNAexpansion segments D2 and D3 for chalcidoid wasps (Hymenoptera:Chalcidoidea). Mol. Biol. Evol. 22, 1593–1608.
Han, K., Lee, Y., Kim, W., 2002. PseudoViewer: automatic visualization ofRNA pseudoknots. Bioinformatics 18 (Suppl. 1), S321–S328.
He, Y., Subbotin, S.A., Rubtsova, T.V., Lamberti, F., Brown, D.J.F.,Moens, M., 2005. A molecular phylogenetic approach to Longidoridae(Nematoda: Dorylaimida). Nematology 7, 111–112.
Holterman, M., van der WurV, A., van den Elsen, S., van Megen, H., Bon-gers, T., Holovachov, O., Bakker, J., Helder, J., 2006. Phylum-wideanalysis of SSU rDNA reveals deep phylogenetic relationships amongnematodes and accelerated evolution towards crown clades. Mol. Biol.Evol. 23, 1792–1800.
Hudelot, C., Gowri-Shankar, V., Jow, H., Rattray, M., Higgs, P.G., 2003.RNA-based phylogenetic methods: application to mammalian mito-chondrial RNA sequences. Mol. Phylogenet. Evol. 28, 241–252.
Huelsenbeck, J.P., Ronquist, F., 2001. MrBAYES: Bayesian inference ofphylogenetic trees. Bioinformatics 17, 754–755.
Kjer, K.M., 1995. Use of rRNA secondary structure in phylogenetic stud-ies to identify homologous positions: an example of alignment anddata presentation from the frogs. Mol. Phylogenet. Evol. 13, 314–330.
Kjer, K.M., 2004. Aligned 18S and insect phylogeny. Syst. Biol. 53,506–514.
Knudsen, B., Hein, J., 1999. RNA secondary structure prediction usingstochastic contex-free grammars and evolution history. Bioinformatics15, 446–454.
Litvaitis, M.K., Bates, J.W., Hope, W.D., Moens, T., 2000. Inferring a clas-siWcation of the Adenophorea (Nematoda) from nucleotide sequencesof the D3 expansion segment (26/28S rDNA). Can. J. Zool. 78,911–922.
Michot, B., Bachellerie, J.P., 1987. Comparisons of large subunit rRNAsrevealed some eukaryote-speciWc elements of secondary structure.Biochemie 69, 11–23.
Muse, S.V., 1995. Evolutionary analysis of DNA sequences subject to con-straints on secondary structure. Genetics 139, 1429–1439.
Nadler, S.A., De Ley, P., Mundo-Ocampo, M., Smythe, A.B., Stock, S.P.,Bumbarger, D., Adams, B.J., De Ley, I.T., Holovachov, O., Baldwin,J.G., 2006. Phylogeny of Cephalobina (Nematoda): Molecular evidencefor recurrent evolution of probolae and incongruence with traditionalclassiWcations. Mol. Phylogenet. Evol. 40, 696–711.
Nicholas, K.B., Nicholas Jr., H.B., DeerWeld II, D.W., 1997. GeneDoc:Analysis and visualization of genetic variation. EMBNEW News 4, 14.
Posada, D., Crandall, K.A., 1998. Modeltest: testing the model of DNAsubstitution. Bioinformatics 14, 917–918.
Ronquist, F., Huelsenbeck, J.P., 2005. Bayesian analysis of molecular evo-lution using MrBayes. In: Nielsen, R. (Ed.), Statistical Methods inMolecular Evolution. Springer, New York.
Rubtsova, T.V., Subbotin, S.A., Brown, D.J.F., Moens, M., 2001. Descrip-tion of Longidorus sturhani sp. n. (Nematoda: Longidoridae) andmolecular characterisation of several longidorid species from WesternEurope. Russ. J. Nematol. 9, 127–136.
Savill, N.J., Hoyle, D.C., Higgs, P.G., 2001. RNA sequences evolution withsecondary structure constrains: comparison of substitution rate modelusing maximum-likelihood methods. Genetics 157, 399–411.
Schultz, J., Müller, T., Achtziger, M., Seibel, P.N., Dandekar, T., Wolf, M.,2006. The internal transcribed spacer 2 database—a web server for (notonly) low level phylogenetic analyses. Nucleic Acids Res. 34,W704–W707.
Siddiqi, M.R., 2000. Tylenchida: Parasites of Plants and Insects. CABIPublishing, Wallingford, UK. pp. 833.
Smith, A.D., Lui, T.W.H., Tillier, E.R.M., 2004. Empirical models for sub-stitution in ribosomal RNA. Mol. Biol. Evol. 21, 419–427.
Stock, S.P., Campbell, J.F., Nadler, S.A., 2001. Phylogeny of SteinernemaTravassos, 1927 (Cephalobina: Steinernematidae) inferred from ribo-somal DNA sequences and morphological characters. J. Parasitol. 87,877–889.
Subbotin, S.A., Sturhan, D., Chizhov, V.N., Vovlas, N., Baldwin, J.G.,2006. Phylogenetic analysis of Tylenchida Thorne, 1949 as inferredfrom D2 and D3 expansion fragments of the 28S rRNA genesequences. Nematology 8, 455–474.
Subbotin, S.A., Vovlas, N., Crozzoli, R., Sturhan, D., Lamberti, F., Moens,M., Baldwin, J.G., 2005. Phylogeny of Criconematina Siddiqi, 1980(Nematoda: Tylenchida) based on morphology and D2–D3 expansionsegments of the 28S-rRNA gene sequences with application of a sec-ondary structure model. Nematology 7, 927–944.
SwoVord, D.L., 2003.PAUP¤: Phylogenetic analysis using parsimony (¤and other methods), version 4.0b 10 Sinauer Associates, Sunderland,Massachusetts.
Telford, M.J., Wise, M.J., Gowri-Shankar, V., 2005. Consideration of RNAsecondary structure improves likelihood-based estimates of phylogeny:example from Bilateria. Mol. Biol. Evol. 22, 1129–1136.
Tenente, G.C.M., De Ley, P., De Ley, I.T., Karssen, G., VanXeteren, J.R.,2004. Sequence analysis of the D2/D3 region of the large subunitrRNA from diVerent Meloidogyne isolates. Nematropica 34, 1–12.
Van de Peer, Y., Chapelle, S., De Wachter, R., 1996. A quantitative map ofnucleotide substitution rates in bacterial rRNA. Nucleic Acids Res. 24,3381–3391.
Wuyts, J., Perriere, G., Van de Peer, Y., 2004. The European ribosomalRNA database. Nucleic Acids Res. 32, D101–D103.
Wuyts, J., Van de Peer, Y., De Wachter, R., 2001. Distribution of substitu-tion rates and location of insertion sites in the tertiary structure ofribosomal RNA. Nucleic Acids Res. 29, 5017–5028.
Zuker, M., 1989. On Wnding all suboptimal folding of an RNA molecule.Science 244, 48–54.