daily digestible protein and energy requirements for growth and
TRANSCRIPT

DAILY DIGESTIBLE PROTEIN AND ENERGY REQUIREMENTS FOR
GROWTH AND MAINTENANCE OF SUB-ADULT PACIFIC WHITE SHRIMP
(LITOPENAEUS VANNAMEI)
A Dissertation
by
ANTHONY JOSEPH SICCARDI III
Submitted to the Office of Graduate Studies of Texas A&M University
in partial fulfillment of the requirements for the degree of
DOCTOR OF PHILOSOPHY
August 2006
Major Subject: Nutrition

DAILY DIGESTIBLE PROTEIN AND ENERGY REQUIREMENTS FOR
GROWTH AND MAINTENANCE OF SUB-ADULT PACIFIC WHITE SHRIMP
(LITOPENAEUS VANNAMEI)
A Dissertation
by
ANTHONY JOSEPH SICCARDI III
Submitted to the Office of Graduate Studies of Texas A&M University
in partial fulfillment of the requirements for the degree of
DOCTOR OF PHILOSOPHY
Approved by:
Co-Chairs of Committee, Addison L. Lawrence Delbert M. Gatlin III Committee Members, William H. Neill Christopher A. Bailey Joe M. Fox Chair, Intercollegiate Faculty of Nutrition, Nancy D. Turner
August 2006
Major Subject: Nutrition
iii
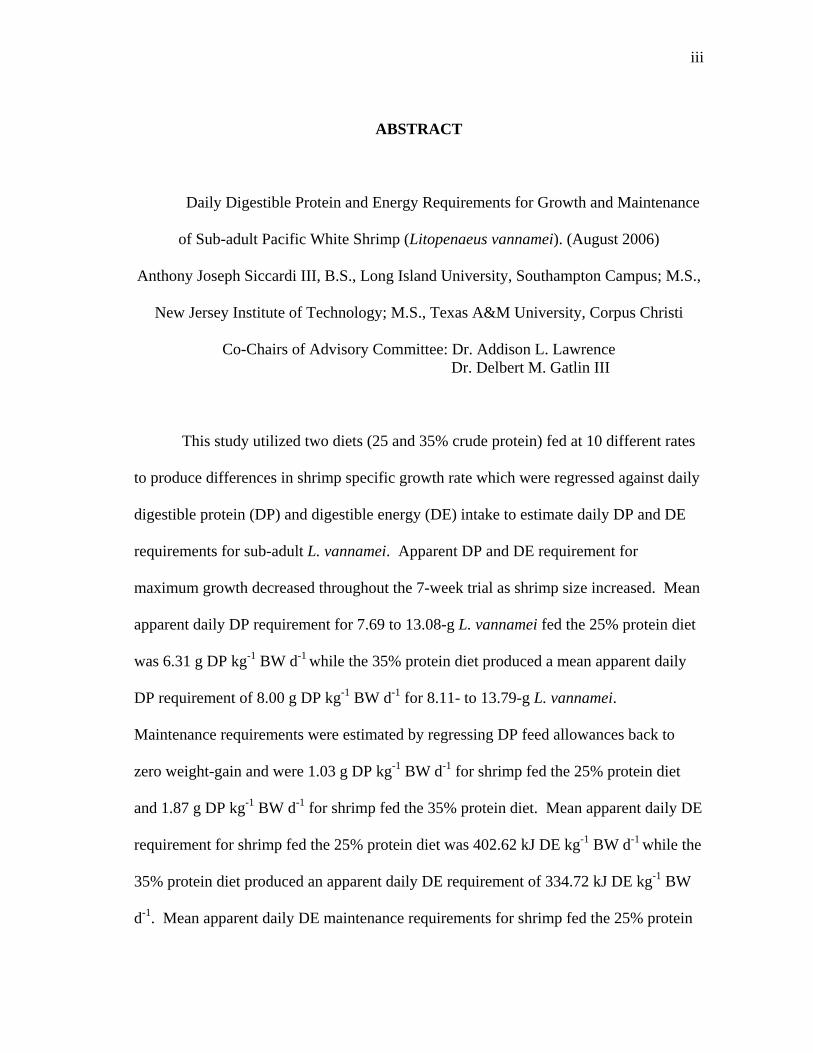
ABSTRACT
Daily Digestible Protein and Energy Requirements for Growth and Maintenance
of Sub-adult Pacific White Shrimp (Litopenaeus vannamei). (August 2006)
Anthony Joseph Siccardi III, B.S., Long Island University, Southampton Campus; M.S.,
New Jersey Institute of Technology; M.S., Texas A&M University, Corpus Christi
Co-Chairs of Advisory Committee: Dr. Addison L. Lawrence Dr. Delbert M. Gatlin III
This study utilized two diets (25 and 35% crude protein) fed at 10 different rates
to produce differences in shrimp specific growth rate which were regressed against daily
digestible protein (DP) and digestible energy (DE) intake to estimate daily DP and DE
requirements for sub-adult L. vannamei. Apparent DP and DE requirement for
maximum growth decreased throughout the 7-week trial as shrimp size increased. Mean
apparent daily DP requirement for 7.69 to 13.08-g L. vannamei fed the 25% protein diet
was 6.31 g DP kg-1 BW d-1 while the 35% protein diet produced a mean apparent daily
DP requirement of 8.00 g DP kg-1 BW d-1 for 8.11- to 13.79-g L. vannamei.
Maintenance requirements were estimated by regressing DP feed allowances back to
zero weight-gain and were 1.03 g DP kg-1 BW d-1 for shrimp fed the 25% protein diet
and 1.87 g DP kg-1 BW d-1 for shrimp fed the 35% protein diet. Mean apparent daily DE
requirement for shrimp fed the 25% protein diet was 402.62 kJ DE kg-1 BW d-1 while the
35% protein diet produced an apparent daily DE requirement of 334.72 kJ DE kg-1 BW
d-1. Mean apparent daily DE maintenance requirements for shrimp fed the 25% protein

iv
diet was 66.23 kJ DE kg-1 BW d-1 while the requirement was 78.82 kJ DE kg-1 BW d-1
for shrimp fed the 35% protein diet. Daily DP and DE requirements were also
determined by regressing whole-body protein or energy change against daily DP and DE
intake and were similar to those values obtained by regressing change in body weight
against daily DP and DE intake. Another component of this project involved evaluating
32 different feedstuffs for dry matter, protein and energy digestibility coefficients. Fish
meal apparent crude protein digestibility coefficients as a group were higher than all
other ingredient classifications except purified ingredients. Protein in 48% soybean
meal and 90% isolated soybean protein were significantly more digestible than protein
found in fish, animal and marine meals tested. This data will improve the quality and
reduce the cost of commercial shrimp feeds.

v
DEDICATION
To my parents
for their unconditional
support throughout my education

vi
ACKNOWLEDGMENTS
I would like to express my deepest appreciation to my co-advisors: Dr. Addison
Lawrence for his guidance, generous support, and help in nurturing my professional
aspirations and Dr. Delbert Gatlin for his guidance, patience and critical reviews. Their
generous contribution of time and knowledge helped make this endeavor possible.
Special appreciation is extended to the members of my committee: Dr. William
Neill who provided countless thought provoking comments, Dr. Joe Fox for his advice,
assistance and critical reviews and Dr. Bailey who introduced me to the concepts and
research methods in the field of poultry science.
Special thanks are extended to Dr. Frank Castille, Jeff Barry, Woodie Lawson,
Warren Jones, Patty Beasley, Larry Lesher, William Bray and Scott Walker for their
advice and assistance managing the experimental systems.
Special thanks are also extended to Tom Zeigler and the other members of
Zeigler Brothers for providing the dietary ingredients and in vitro analysis.

vii
TABLE OF CONTENTS
Page
ABSTRACT .............................................................................................................. iii
DEDICATION .......................................................................................................... v
ACKNOWLEDGMENTS......................................................................................... vi
TABLE OF CONTENTS .......................................................................................... vii
LIST OF TABLES .................................................................................................... ix
LIST OF FIGURES................................................................................................... xii
CHAPTER
I INTRODUCTION............................................................................. 1
Economic and environmental benefit of properly formulated feeds.................................................................... 1 Estimated protein and energy requirements of L. vannamei . 2 Factorial-design, apparent-requirement trials........................ 4 Factors affecting growth response......................................... 6 Digestion in Litopenaeus vannamei ...................................... 11 Brief overview of digestibility terminology.......................... 12 Factors affecting apparent digestibility in crustaceans.......... 12 Brief evaluation of in vivo and in vitro digestibility methods ................................................................................. 14 Current in vivo methods utilized to determine apparent digestibility coefficients ........................................................ 16 Current status of in vivo apparent digestibility coefficients for L. vannamei ..................................................................... 17 Importance of apparent digestibility in least-cost formulations and the environment......................................... 18 Objectives.............................................................................. 19

viii
CHAPTER Page
II DIGESTIBLE PROTEIN AND ENERGY REQUIREMENTS FOR GROWTH AND MAINTENANCE OF SUB-ADULT PACIFIC WHITE SHRIMP Litopenaeus vannamei......................... 20
Introduction ........................................................................... 20 Materials and methods .......................................................... 23 Results ................................................................................... 34 Discussion ............................................................................. 56
III APPARENT DRY MATTER, PROTEIN AND ENERGY DIGESTIBILITY OF INGREDIENTS FOR PACIFIC WHITE SHRIMP Litopenaeus vannamei DIETS........................................... 74
Introduction ........................................................................... 74 Materials and methods .......................................................... 76 Results ................................................................................... 82 Discussion ............................................................................. 91
IV SUMMARY AND CONCLUSIONS ............................................... 104
Summary ............................................................................... 104 Conclusions ........................................................................... 111
REFERENCES.......................................................................................................... 113 APPENDIX A COMPOSITION OF THE MINERAL-VITAMIN PREMIX................................................................................ 122 APPENDIX B COMPOSITION OF THE VITAMIN-MINERAL PREMIX................................................................................ 123 APPENDIX C ADDITIONAL PROTEIN/ENERGY CALCULATIONS FROM CHAPTER II............................................................. 124 VITA ......................................................................................................................... 128

ix
LIST OF TABLES
TABLE Page
1. Composition of the thirteen preliminary diets.............................................. 26
2. Composition of the 25% crude protein, 15.89 kJ g-1 diet............................. 30
3. Composition of the 35% crude protein, 15.48 kJ g-1 diet............................. 31
4. Feed rates in grams of feed per shrimp per day and per week ..................... 33
5. Effect of starvation on absolute body composition of four different size classes of L. vannamei.................................................................................. 36
6. Effect of starvation on body composition (wet-weight basis) of four different size classes of L. vannamei............................................................ 37
7. Effect of starvation on body composition (dry-matter basis) of four different size classes of L. vannamei............................................................ 38 8. Response of L. vannamei fed preliminary diets ........................................... 40
9. Energy and protein conversion efficiencies of L. vannamei fed
incremental levels of a 25% crude protein, 15.89 kJ g-1 diet ....................... 44
10. Energy and protein conversion efficiencies of L. vannamei fed incremental levels of a 35% crude protein, 15.48 kJ g-1 diet ....................... 45
11. Growth and survival estimates of L. vannamei fed incremental levels of a 35% crude protein, 15.48 kJ g-1 diet over 49 days ................................ 46 12. Growth and survival estimates of L. vannamei fed incremental levels of a 25% crude protein, 15.89 kJ g-1 diet over 49 days ................................ 47 13. Weekly apparent protein requirements (g DP shrimp-1 day-1) for
maximum growth and maintenance of L. vannamei fed a 25% crude protein, 15.89 kJ g-1 diet obtained by regressing weight gain onto provided protein (g-DP protein shrimp-1 day-1)............................................ 48
14. Body composition of L. vannamei fed incremental levels of a 25% crude protein, 15.89 kJ g-1 diet over 49 days ......................................................... 50
x
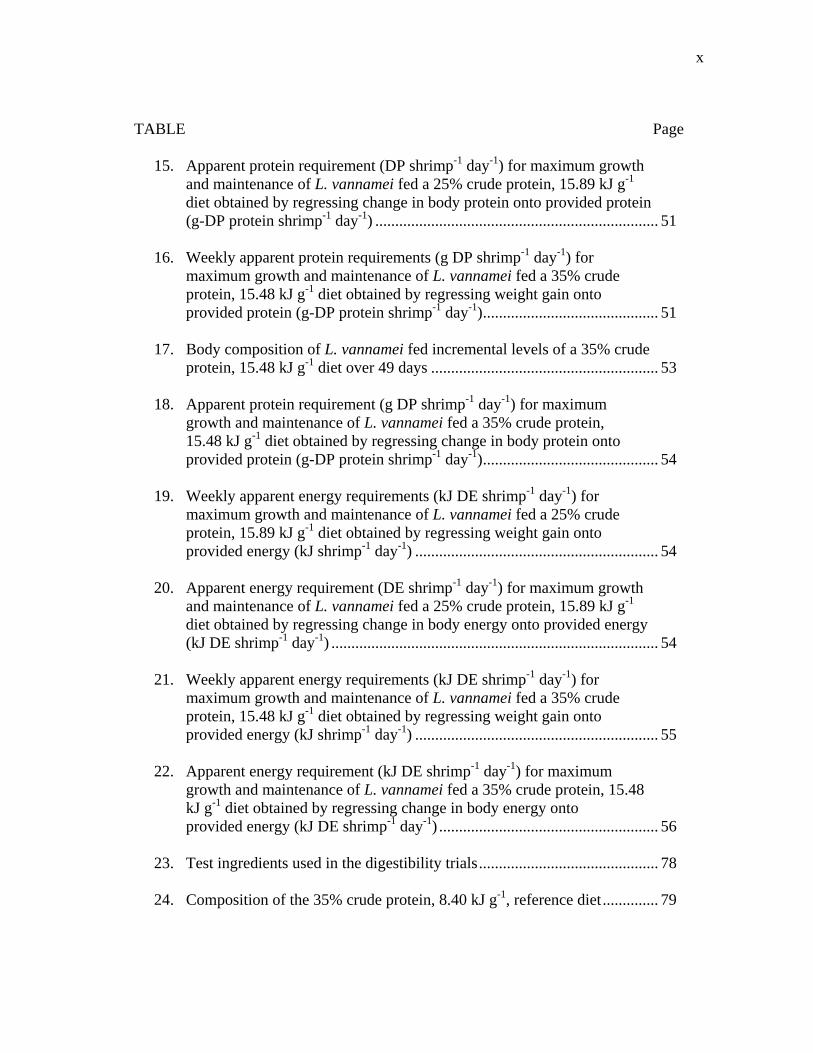
TABLE Page
15. Apparent protein requirement (DP shrimp-1 day-1) for maximum growth and maintenance of L. vannamei fed a 25% crude protein, 15.89 kJ g-1 diet obtained by regressing change in body protein onto provided protein (g-DP protein shrimp-1 day-1) ....................................................................... 51 16. Weekly apparent protein requirements (g DP shrimp-1 day-1) for maximum growth and maintenance of L. vannamei fed a 35% crude protein, 15.48 kJ g-1 diet obtained by regressing weight gain onto provided protein (g-DP protein shrimp-1 day-1)............................................ 51 17. Body composition of L. vannamei fed incremental levels of a 35% crude protein, 15.48 kJ g-1 diet over 49 days ......................................................... 53 18. Apparent protein requirement (g DP shrimp-1 day-1) for maximum growth and maintenance of L. vannamei fed a 35% crude protein, 15.48 kJ g-1 diet obtained by regressing change in body protein onto provided protein (g-DP protein shrimp-1 day-1)............................................ 54
19. Weekly apparent energy requirements (kJ DE shrimp-1 day-1) for maximum growth and maintenance of L. vannamei fed a 25% crude protein, 15.89 kJ g-1 diet obtained by regressing weight gain onto provided energy (kJ shrimp-1 day-1) ............................................................. 54
20. Apparent energy requirement (DE shrimp-1 day-1) for maximum growth and maintenance of L. vannamei fed a 25% crude protein, 15.89 kJ g-1 diet obtained by regressing change in body energy onto provided energy (kJ DE shrimp-1 day-1) .................................................................................. 54 21. Weekly apparent energy requirements (kJ DE shrimp-1 day-1) for maximum growth and maintenance of L. vannamei fed a 35% crude protein, 15.48 kJ g-1 diet obtained by regressing weight gain onto provided energy (kJ shrimp-1 day-1) ............................................................. 55 22. Apparent energy requirement (kJ DE shrimp-1 day-1) for maximum growth and maintenance of L. vannamei fed a 35% crude protein, 15.48 kJ g-1 diet obtained by regressing change in body energy onto provided energy (kJ DE shrimp-1 day-1) ....................................................... 56 23. Test ingredients used in the digestibility trials............................................. 78
24. Composition of the 35% crude protein, 8.40 kJ g-1, reference diet.............. 79

xi
TABLE Page
25. Effect of mean weight on in vivo digestibility in L. vannamei fed a 35% standard reference diet ......................................................................... 83 26. Percent ash, dry matter protein content (DMPC), apparent dry matter digestibility (ADMD) and apparent crude protein digestibility (ACPD) of ingredients consumed by L. vannamei ...................................... 84 27. Percent ash, dry matter energy content (DMEC), apparent dry matter digestibility (ADMD) and apparent energy digestibility (AED) of ingredients consumed by L. vannamei ......................................................... 86 28. A comparison of in vivo and pepsin digestibility in L. vannamei ................ 90

xii
LIST OF FIGURES
FIGURE Page
1. Weight gain (g) vs. daily feed rate (g feed/shrimp) for Litopenaeus vannamei fed a 25% protein, 15.48 kJ g-1 diet ............................................. 42
2. Weight gain (g) vs. daily feed rate (g feed/shrimp) for Litopenaeus vannamei fed a 35% protein, 15.48 kJ g-1 diet ............................................. 43

1
CHAPTER I
INTRODUCTION
Economic and environmental benefit of properly formulated feeds
The gradual erosion in shrimp prices has forced US shrimp farmers to reduce
production costs to remain economically solvent. Cost reduction may be realized by
increasing stocking densities in ponds and raceways to intensive or even super intensive
levels. Such intensification places the nutritional burden on supplemented feed as
opposed to natural productivity. To sustain optimum growth these feeds must contain
the proper balance of energy, protein, minerals and vitamins while preserving the cost
efficiencies realized through intensification. US shrimp farmers therefore rely on feed
formulators to reduce feed costs, which currently account for the majority of production
costs (Akiyama et al., 1992), while maintaining optimal shrimp growth. Feed
formulators in turn look to researchers to provide them with optimal nutrient levels to
meet their challenges. Of particular interest is protein which accounts for the majority of
shrimp feed content and expense (Shiau et al., 1992; Cordova-Murueta and Garcia-
Carreno, 2002). Dietary optimization of protein may lead to a reduction in feed costs,
helping to reduce production expenditures and increase profits. A concomitant benefit
_______________ This dissertation follows the style and format of the journal Aquaculture.

2
of protein optimization may be realized by reducing feeds’ significant contribution of
enriching nutrients in aquaculture effluent. Aquaculture effluent can produce negative
environmental impacts (Boyd and Clay, 1998) and has forced US farmers to meet
acceptable pollutant levels in discharge which in some ways has slowed expansion of the
industry (Lawrence et al., 2001). Velasco et al. (1999) demonstrated the correlation
between dietary protein and the accumulation of inorganic nitrogen in culture water.
They also observed that diets which maximize protein utilization for growth as opposed
to energy needs may lead to the reduction of nitrogenous compounds in aquaculture
effluent. If shrimp farming is to remain one of the fastest growing segments of US
aquaculture these dietary issues must be properly addressed.
Estimated protein and energy requirements of L. vannamei
Dietary protein requirements have been estimated by feeding trials in which
graded levels of protein are fed to apparent satiation or in excess, to determine growth
response (typically, weight gain) under controlled or observed environmental conditions.
Results have suggested protein requirements of juvenile L. vannamei range from an as-
fed dietary inclusion level of 15%, with a energy to protein (E:P) ratio of 119.58 kJ g-1
protein (Aranyakananda, 1995), to approximately 30% of diet, with a dietary E:P ratio of
41.86 kJ g-1 protein (Cousin et al., 1991), to greater than 36% of diet (Smith et al., 1985)
and even greater than 40% of diet (Colvin and Brand, 1977). These variations are not
surprising considering that protein requirements can vary with age, size, physiological

3
status, growth rate and dietary characteristics such as E:P ratio (Colvin and Brand, 1977;
Bhaskar and Ali, 1984; Akiyama, 1991; Guillaume, 1997; Pedrazzoli et al., 1998).
Despite the suggestion of Andrews et al. (1972) that one of the most important
requirements for formulating a suitable diet for shrimp was to determine the balance
between dietary energy and protein, few such studies have addressed this issue for L.
vannamei (Dokken, 1987; Aranyakananda, 1995; Rosas et al., 2001b; Cuzon et al.,
2004). In one of the most comprehensive studies to date, Rosas et al. (2001b)
determined the optimal (E:P) ratio for L. vannamei was 28 kJ g-1 (33-44% protein and 6-
23% carbohydrate) for juvenile shrimp weighing less than 1 gram and 28-38 kJ g-1 (33-
44% protein and 6-23% carbohydrate) for those shrimp greater than 1 gram. This study,
however, did not quantify daily protein requirement for maintenance and/or maximum
weight gain as the feeds were provided in excess. Cuzon et al. (2004) determined an
optimal E:P ratio of 42 kJ DE g-1 for 7-8 g L. vannamei by feeding diets with constant
protein, constant energy or constant P/E ratio and suggested maximum growth for a
biomass of 100 g shrimp could be achieved by feeding a daily intake of 1.2 g DP and
140 kJ digestible energy (DE). Although daily protein and energy requirements were
determined it is unclear if these results were obtained through studies involving
incremental feed rates or estimated from ad-libitum feeding trials as experimental
methods were not provided. Feeding method is important as in some cases, feed intake
by shrimp could potentially be increased to negate the effect of a low protein diet and
lead to substantial variation in dietary E:P requirement (Kureshy and Davis, 2002).
4
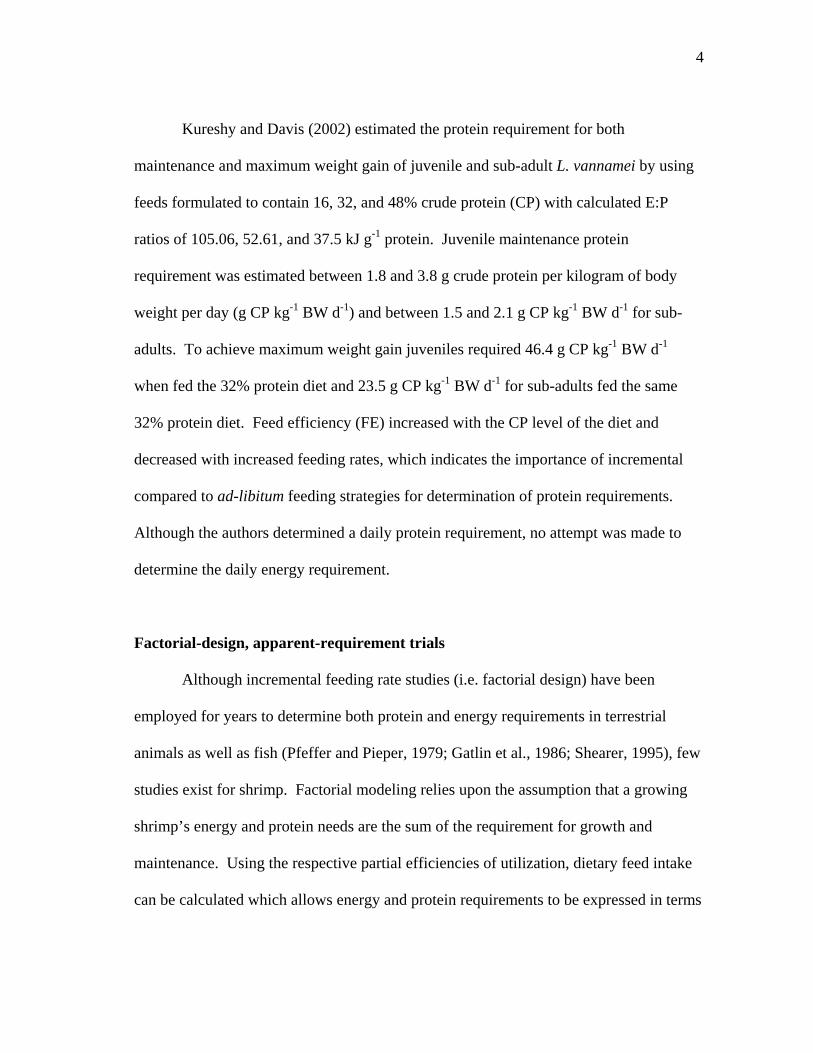
Kureshy and Davis (2002) estimated the protein requirement for both
maintenance and maximum weight gain of juvenile and sub-adult L. vannamei by using
feeds formulated to contain 16, 32, and 48% crude protein (CP) with calculated E:P
ratios of 105.06, 52.61, and 37.5 kJ g-1 protein. Juvenile maintenance protein
requirement was estimated between 1.8 and 3.8 g crude protein per kilogram of body
weight per day (g CP kg-1 BW d-1) and between 1.5 and 2.1 g CP kg-1 BW d-1 for sub-
adults. To achieve maximum weight gain juveniles required 46.4 g CP kg-1 BW d-1
when fed the 32% protein diet and 23.5 g CP kg-1 BW d-1 for sub-adults fed the same
32% protein diet. Feed efficiency (FE) increased with the CP level of the diet and
decreased with increased feeding rates, which indicates the importance of incremental
compared to ad-libitum feeding strategies for determination of protein requirements.
Although the authors determined a daily protein requirement, no attempt was made to
determine the daily energy requirement.
Factorial-design, apparent-requirement trials
Although incremental feeding rate studies (i.e. factorial design) have been
employed for years to determine both protein and energy requirements in terrestrial
animals as well as fish (Pfeffer and Pieper, 1979; Gatlin et al., 1986; Shearer, 1995), few
studies exist for shrimp. Factorial modeling relies upon the assumption that a growing
shrimp’s energy and protein needs are the sum of the requirement for growth and
maintenance. Using the respective partial efficiencies of utilization, dietary feed intake
can be calculated which allows energy and protein requirements to be expressed in terms

5
of absolute daily feed intake per unit weight and weight gain as opposed to being
expressed as a percentage of the diet. Another advantage to this method is it allows for
the determination of allometric equations to estimate energy requirements below and at
maintenance; energy requirements above maintenance; protein requirements below and
at maintenance; and protein requirements above maintenance.
A simple factorial model to determine a dietary requirement can be written as: R
= M*BWb + G*growth, where R = requirement, M = dietary energy or protein utilization
efficiency for maintenance, BWb = metabolic body weight (with weight typically
measured in grams), G = dietary energy or protein utilization efficiency for growth, and
growth is the rate of growth in grams per day. This model can be rewritten to determine
dietary feed intake as follows: I = G + M + E, where I = ingested energy or protein, G =
growth, M = metabolizable energy or protein and E = endogenous loss (Brett and
Groves, 1979). Growth requirement (G) is determined through the composition of body
mass added during growth, endogenous loss (E) is measured by calculating the body-
stores decline during starvation, while digestible energy values are commonly used in
place of metabolizable energy values due to the difficulty required in obtaining them
(Pfeffer and Pieper 1979; NRC, 1980; Lovell 1989). This model allows for the
determination of an energy budget at a point in time or for any phase of the life cycle
which provides greater insight than results commonly obtained from growth trials.
6
Factors affecting growth response
Abiotic factors
Since the majority of nutrient-requirement studies involve measuring a growth
response, particular attention must be taken to control abiotic factors (i.e. dissolved
oxygen, salinity, temperature, etc.) which can affect energetic requirements. Dissolved
oxygen (DO) is a limiting factor which reduces growth through its effect on metabolism.
While L. vannamei appears to be able to withstand lower DO concentrations than P.
japonicus (Egusa, 1961), P. monodon (Liao and Chen, 1994), P. setiferus and P. schmitti
(Rosas et al. 1997); they still must be maintained at DO concentrations above 2 mg L-1 to
avoid significant reductions in growth (Seidman and Lawrence, 1985).
Temperature is also a modifier of energy flow and has a significant effect on
feeding rate, growth and an organism’s overall activity (Wyban et al., 1995; Ponce-
Palafox et al., 1997). Feeding rate and growth are positively correlated to increases in
temperature between 23 and 30oC; however, the effect is less pronounced as shrimp
weight increases (Wyban et al., 1995). Optimum temperature for L. vannamei growth
appears to decrease as shrimp size increases, producing an optimum temperature >30oC
for small shrimp (3.9 g), 30oC for medium shrimp (10.8 g) and 27oC for large shrimp (>
16 g) suggesting the importance of uniform stocking weight and predetermined
experimental growth ranges (Wyban et al., 1995). Experimental temperature should also
be standardized among various nutrient-requirement studies, as differences in growth
responses mediated by temperature effects are complicated and can’t be explained by a
simple linear model (Wyban et al., 1995).

7
While growth rates are typically more affected by temperature than salinity, the
interaction of these two abiotic variables can have a significant effect on L. vannamei
growth (Ponce-Palafox et al., 1997). Salinity had a significant effect on growth when
temperatures were high (35oC) but had a minimal effect on growth between 25-45‰
(test range 20-50‰) provided temperatures were maintained within L. vannamei’s
optimum range (Ponce-Palafox et al., 1997). Salinity effect on L. vannamei growth was
more pronounced when tested over a larger range (5-49‰), producing significantly
greater final weights at 5 and 15‰ (Bray et al., 1994). The actual mechanism producing
the growth effect (i.e. salinity effect on metabolism) was investigated by Rosas at al.
(2001a) by examining the interaction of salinity and dietary carbohydrates as well as the
interaction between salinity, dietary carbohydrates and dietary protein. Metabolic
efficiency was modulated through salinity effect on both dietary protein and dietary
carbohydrate metabolism as Rosas et al. (2001a) observed maximum growth for shrimp
fed a low carbohydrate (1%), high protein (50%) diet maintained at a salinity of 15‰
but depressed growth when maintained at a salinity of 40‰. This suggests the
importance of appropriate dietary P/E ratios.
Inorganic compounds
The level of inorganic nutrients in shrimp systems is greatly influenced by
stocking density, feed consumption, and feed and water quality management practices
(Velasco et al., 1998). These inorganic compounds need to be maintained at acceptable
levels as ammonia (Shilo and Rimon 1982) nitrite (Solbe 1978) and sulfide (Ram et al.,
1981) build-up in shrimp culture systems have been shown to reduce growth and

8
survival. These inorganic nutrients also can reduce feeding response (Ram et al., 1981;
Shilo and Rimon 1982) and increase the incidence of disease. To assure these
compounds do not interfere with the experiment, ammonia-N should be maintained
below 2.37 mg L-1 (0.09 mg L-1 for NH sub(3)-N) (Chen and Lin 1991), nitrite levels
below 2.04 mg L-1 (Chen and Lin 1991), nitrate below 25 mg L-1 (Chen and Lei 1990)
and sulfide should be as close to undetectable as possible. Controlling these factors will
assure differences in growth can be attributed to dietary effects and allow for the proper
nutrient determination.
Experimental design
Experimental design also can contribute to differences in growth rates which can
have an effect on apparent requirements. Dokken (1987) reported L. vannamei fed four
times per day had faster growth rates than those fed the same ration size two times per
day. Lawrence et al. (unpublished results) determined feed utilization increased when
ingestion rate, feeding frequency and daily ration size increased, suggesting differences
in nutrient requirements may be achieved depending on how feed is presented to juvenile
L. vannamei. Arayankanada (1995) also suggested feeding frequency could affect
nutrient requirements and concluded the low (15%) dietary protein requirement obtained
could be attributed to higher feeding frequency (15 feedings per day). This is not
surprising since Beseres et al. (2005) observed gut passage times of less than one hour in
shrimp.

9
Dietary energy considerations
Carbohydrates and lipids are commonly added to diets as energy sources in an
attempt to spare the use of protein for energy. Although not dietarily essential,
carbohydrates are typically added as they are the most economical source of dietary
energy. Simple carbohydrates such as glucose are poorly utilized by shrimp (Andrews et
al., 1972; Deshimaru and Yone, 1978; Alava and Pascual, 1987) and may even reduce
survival rates (Shiau and Peng, 1992) necessitating the addition of more complex
carbohydrates such as starch. Lipids also may be utilized as an energy source as they
provide a concentrated source of energy as well as essential fatty acids but can have an
adverse effect on growth when supplemented at high dietary levels (Dokken, 1987).
Dokken (1987) reported weight loss in L. vannamei fed high (13.8-18.8%) dietary lipid
levels and suggested the optimum range was between 5 to 10% of the diet.
Dietary energy levels also have been shown to affect the determination of protein
requirements (Sedgwick, 1979; Shiau and Chou, 1991). Optimum growth for P.
merguiensis was achieved feeding either a diet with 42% protein and 18.4 kJ g-1 or 36%
protein and 12.1 kJ g-1 (Sedgwick, 1979). Similar results were determined for P.
monodon fed a 40% protein 16.3 kJ g-1 diet (Shiau et al., 1991) and a 36% protein 13.8
kJ g-1 diet (Shiau and Chou, 1991). Dietary energy levels may also affect feed
consumption. Davis and Arnold (1993) reported an inverse relationship between
digestibility coefficients and consumption which suggests consumption could be energy-
related. If this is correct, diets high in energy may limit consumption, reducing the
amount of protein, minerals, vitamins, etc. consumed which may lead to reduced growth.

10
Conversely, increased consumption of diets which are low in energy will increase
vitamin and mineral intake which may adversely affect growth if the nutrient is toxic
when ingested in higher levels per day.
Dietary protein considerations
Cruz-Ricque et al. (1987) showed squid protein fraction significantly improved
the growth rate of L. vannamei even at supplementation levels as low as 1.5%. Since all
diets were well balanced and included all known nutrients they concluded squid protein
fraction contains an unknown growth factor and should be included in all dietary
formulations. Cordova-Murueta and Garcia-Carreno 2002 determined L. vannamei fed
diets containing either 3% fish or krill hydrolysate grew significantly better than shrimp
fed 9 or 15% of the same protein hydrolysate and concluded protein supplements must
meet specific requirements to be properly assimilated from the diet. Growth effects
were also witnessed when only 2% fish meal was exchanged for the same amount of
krill meal despite the fact krill meal protein is usually less digestible and has a lower
amino acid contribution than fish meal (Lopez et al., 1998). The authors suggested this
growth effect may be attributed to krill’s ability to increase feed attractibility, increase
feed consumption and/or it may contain unknown growth factors.
Ingestion and attractability
Ingestion rates and attractibility add another level of complexity for studies
involving nutrient requirements as both have been shown to affect growth (Lawrence
and Castille, 1993; Smith et al., 2005) but are subjective in measurement (Cam et al.,
1995; Smith et al., 2005). Differences in growth of L. vannamei fed diets with identical

11
nutritional values supplemented with either fish, krill or Artemia meals was partially
explained by differences in consumption rates (Lawrence and Castille, 1993) while
Smith et al. (2005) showed P. monodon exhibited significantly greater preference for
and grew 20% faster on feeds which contained crustacean or krill meal. From these
studies it is apparent even small dietary adjustments can have significant effects on
growth which suggests the importance of proper dietary formulation or the use of a
standard reference protein when determining nutrient requirements. Although protein
and energy requirements are crucial for developing a true least-cost least-polluting diet,
they must be combined with accurate digestible protein and energy data for ingredients
commonly used in the aquaculture industry.
Digestion in Litopenaeus vannamei
The gut in L. vannamei is basically a simple tube which runs the length of the
body from the mouth to the anus at the end of the last somite. Enzyme secretion is
limited to the midgut which is comprised of a large number of simple, fragile tubules.
Dietary proteins are digested by proteinases such as trypsins and chymotrypins (Lan and
Pan, 1993; Chevalier and Wormhoudt, 1998), lipids by lipase and esterase activity while
alpha-amylase and alpha-glucosidase are secreted to digest carbohydrates (Chevalier and
Wormhoudt, 1998) under slightly-basic (pH ~8) conditions (Garcia-Carreno et al.,
1997). Once digested, nutrients are absorbed in the midgut and fecal formation and
defecation takes place in the hindgut. This digestive scheme allows L. vannamei to be
12
highly effective at digesting protein (Akiyama et al., 1989; Aquacop, 1989) even though
it lacks pepsin and an acidic stomach.
Brief overview of digestibility terminology
Feed digestibility is a term used to describe only the portion of feed which is
absorbed by the organism. The portion of protein and energy lost by the gut during
ingestion and digestion are subtracted from the calculation and are commonly referred to
as metabolic fecal nitrogen losses (MFN) and metabolic fecal energy (MFE) losses.
Since it is difficult to determine these losses with any degree of accuracy using empirical
methods (Lee and Lawrence 1997) most nutritionists determine apparent digestibility.
While apparent digestibility also describes the proportion of absorbed feed, it does not
subtract losses associated with MFN and MFE as it is based on the difference between
the amount of feed ingested and the amount of feces. Although not a true measurement
of digestibility, apparent digestibility still provides an accurate estimate of the
ingredients or feeds digestibility especially when one considers that MFN has been
shown to have only a minor influence on fecal protein analysis (Forster and Gabbott,
1971; Colvin 1976).
Factors affecting apparent digestibility in crustaceans
Studies have been undertaken to determine the effect of species (Lee, 1970;
Akiyama, 1988; Lemos et al., 2000), age (Smith et al., 1985), environmental factors
(Coelho 1984; Seidman and Lawrence 1985) stressors (Cordova-Murueta et al., 2004)

13
and diet (Cordova-Murueta and Garcia-Carreno, 2002) on apparent digestibility. Lemos
et al., (2000) showed clear differences in proteinase patterns between adult
Farfantepenaeus californiensis, F. paulensis, L. schmitti and L. vannamei and suggested
protein digestion may be species-specific. Lee (1970) reported minor differences in
apparent dry matter digestibility (ADMD) for Penaeus monodon, P. japonicus, P.
semisulcatus, and Metapenaeus monoceros while Akiyama (1988) found differences in
apparent lipid and apparent carbohydrate digestibility in L. vannamei, P. monodon and
P. japonicus fed a soybean-meal-based diet. These data suggest there are differences in
digestibility among even closely related crustacean species and strengthen the argument
for comprehensive digestibility studies for each species under consideration.
Smith et al. (1985) reported protein digestibility for small L. vannamei (average
weight 4g) was strongly correlated with dietary protein level; however, no correlation
existed for the 9.8 and 20.8 g shrimp. The authors also determined there was no
correlation between any size class and either lipid or total diet digestibility. Coelho
(1984) determined salinity had a minimal effect on digestibility provided the test diets
had a protein content greater then 20% while Seidman and Lawrence (1985) showed
feed digestibility in L. vannamei was not affected even when shrimp were exposed to
dissolved oxygen concentrations of 1 mg L-1. Cordova-Murueta et al (2004) exposed L.
vannamei to alimentary stress by shifting from a 45% to a 35% protein feed and by
physically manipulating the shrimp during weighing. Decreased trypsin and
chymotrypsin activity in feces and mid-gut gland was observed in both treatments, with
a greater effect being attributed to physical manipulation. For these reasons it appears

14
digestibility trials should be performed under “normal” environmental conditions using
>8g L. vannamei which have been acclimated to the test diets and culture system.
Effects of dietary composition on digestion have been verified by Cordova-
Murueta and Garcia-Carreno (2002), who determined both in vitro and in vivo
digestibility were affected by not only the source of the protein supplement but also by
the quantity in the diet. Akiyama et al (1989) suggested digestibility diets should be
formulated entirely of the feedstuff being evaluated to eliminate any associative effects
of the constituents of the diet however; he suggested the lower apparent dry matter
digestibility values obtained in his study may be related to using nutritionally incomplete
diets. Other authors have suggested reference diets should be used as production diets
rarely are composed of a single ingredient (Davis and Arnold, 1993). No matter which
method is chosen, differences can be expected as neither experimental design requires
test diets which have a constant protein quantity. While ingredient digestibility values
can provide valuable information for a feed formulator, one must take into account all
factors which can affect its measurement and remember it is an apparent not a true
digestibility value.
Brief evaluation of in vivo and in vitro digestibility methods
Lee and Lawrence (1997) suggested in vitro assays should be utilized by
crustacean nutritionists based on preliminary evidence which showed in vitro assays
produced the same general pattern of apparent digestibility as those previously reported
in in vivo studies. Since this recommendation many studies have focused on comparing
15
in vivo and in vitro digestibility methods as in vitro methods are fast, cost effective and
use only small amounts of raw materials (Ezquerra et al., 1997; Ezquerra et al., 1998;
Lemos et al., 2000; Cordova-Murueta and Garcia-Carreno, 2002). Traditionally in vitro
methods have relied on chemical analysis such as Kjeldahl analysis and determination of
amino acid composition (Anderson et al., 1993). Since these methods involve the use of
harsher chemical reactions than naturally occur in the digestive process, they typically
release more nutrients than are available to the animal which produces inaccurate results
(Anderson et al., 1993). A better method has been proposed by Ezquerra et al. (1997)
who obtained strong correlations between in vitro and in vivo digestibility using a pH-
stat assay. Unfortunately, this correlation was only valid when protein was compared
according to their origin (i.e. animal or plant) as samples containing both animal and
plant proteins yielded only an approximate estimate of protein digestibility based on in
vivo estimates (Ezquerra et al., 1997). While Ezquerra et al. (1998) also determined the
pH-drop method showed a significant correlation to in vivo digestibility, the correlation
was low and the method is constrained by the same limitations described for the pH-stat
assay. In vitro assays are also hindered by their inability to determine digestibility for
any nutrient besides protein. Apparent dry matter, lipid, and energy digestibility values
have been heavily utilized by the poultry industry to formulate least-cost
environmentally sound diets and this information should also be valuable to crustacean
nutritionists. While in vitro methods have improved greatly since 1997, it still appears
they are not able to replace in vivo apparent digestibility trials, especially when one
wishes to determine more than apparent protein digestibility.

16
Current in vivo methods utilized to determine apparent digestibility coefficients
To determine the apparent digestibility of nutrients (i.e. protein and energy)
researchers typically utilize an in vivo digestibility method. Digestibility studies
involving L. vannamei have utilized the indirect chromic oxide method (Akiyama et al.,
1989; Davis and Arnold, 1993; Davis and Arnold, 1995; Davis et al., 2002), the indirect
ytterbium acetate method (Smith and Tabrett, 2004), the indirect titanium dioxide
method (Smith and Tabrett, 2004) as well as the gravimetric method (Smith and Tabrett,
2004). Although good results can be achieved using the gravimetric method (Smith and
Tabrett, 2004) its use has been curtailed due to the labor involved in the full recovery of
the uneaten food and feces. Of the indirect markers chromic oxide is the most widely
used for studies involving L. vannamei (Smith et al., 1985, Akiyama et al., 1989, Davis
and Arnold, 1993; Davis and Arnold, 1995; Davis et al., 2002). To produce valid results
the method relies upon the following assumptions: 1) the marker must pass through the
gut at the same rate as the feed, 2) the marker must not be lost from the feces or
absorbed from the gut of the shrimp, 3) the marker must be completely physiologically
inert, and 4) the ratio of nutrient to marker in the feed is the same as that ingested by the
shrimp. While studies have questioned the validity of the chromic oxide method for
lobster Homarus sp. (Bordner et al., 1983; Leavitt 1985), freshwater crayfish
Procambarus clarkii (Brown et al., 1986) and caridean shrimp Pandalus serratus,
Palaemon platyceros (Forster and Gabbot, 1971), it appears the assumptions are valid
for studies involving penaeid shrimp (Smith and Tabrett, 2004). Deering et al. (1996)
showed that chromic oxide, acid insoluble ash and ytterbium acetate produced

17
equivalent apparent protein digestibility values. This data suggests chromic oxide is as
physiologically inert as acid insoluble ash and is a valid inert marker for digestibility
studies. Akiyama et al (1989) reported chromic oxide levels were homogeneous in L.
vannamei feces and achieved a low standard deviation between replicates which
suggested the reproducibility of the indirect chromic oxide method. Smith and Tabrett
(2004) determined that a maximum of 3.4%, but possibly less than 1% of chromic oxide
was absorbed by the shrimp which would have a maximum underestimating effect of
only 0.2% on apparent CP digestibility assuming the feed had an apparent dry matter
digestibility of 80%. This absorption is most likely much lower as the authors attribute
most of the absorption to radioactivity which adhered to the shrimp during feeding. The
validity of chromic oxide as a marker was further strengthened by Fenucci et al. (1982)
who determined there was no significant leaching or bacterial degradation loss of
protein, carbohydrate or chromic oxide from feed and feces during six hours of
submersion. These studies provide compelling evidence that chromic oxide is inert,
passes uniformly through the gut, is minimally absorbed and is not significantly lost
from feed and feces which suggest chromic oxide may be used with accuracy for
apparent digestibility studies involving penaeid shrimp.
Current status of in vivo apparent digestibility coefficients for L. vannamei
Protein digestibility has been determined for many commonly used ingredients
included in L. vannamei diets and have been tested both singly (Akiyama 1988;
Akiyama et al., 1989; Fox et al., 1995) and mixed with a reference diet (Davis and

18
Arnold, 1993; Davis and Arnold, 1995). Energy digestibility values for ingredients
utilized in L. vannamei diets, however, are sparse (Davis and Arnold, 1993; Davis and
Arnold, 1995). To date the only published energy digestibility values for ingredients
used in L. vannamei diets are for steam-cracked corn, corn flour, milo, Nutribinder™,
rice flour, whole wheat and wheat starch (Davis and Arnold, 1993; Davis and Arnold,
1995). Utilization of currently available data will not allow for the formulation of a
least-polluting diet based on DE values and in some cases DP values.
Importance of apparent digestibility in least-cost formulations and the environment
The Pacific white shrimp, L. vannamei, is one of the most commonly cultured
shrimp worldwide. While efficient culture techniques have reduced the cost of L.
vannamei culture additional savings may be realized by optimizing feed formulations as
feed is a major part of production costs (Akiyama et al., 1992 and Sarac et al., 1993).
Today’s feed formulations are based upon data derived from studies which measured
growth parameters for cultured L. vannamei. Diets are formulated to be “least cost” by
adjusting protein sources while maintaining gross protein requirements which have been
shown to produce optimal growth. Formulations which rely solely on gross dietary
composition, as opposed to digestible composition, can produce a feed which is over-
formulated increasing both costs and pollutant levels as protein is the most expensive
component in feeds (Cordova-Murueta and Garcia-Carreno, 2002; Shiau, 1992) and can
lead to the accumulation of inorganic nitrogen in culture water (Velasco et al 1999).
While Lee and Lawrence (1997) suggested in 1997 that environmental regulations may

19
have a greater role in digestibility research than economical considerations few studies
have focused on digestibility for either reason (Cuzon et al., 2004)
One only needs to look at the poultry industry to realize that a more cost
efficient, and environmentally sound, feed can be formulated based on the digestibility
(i.e. nutrient availability) of ingredients utilized in the diet. This formulation method
allows ingredients to be selected to meet both the nutritional as well as economical
requirements of the least-cost diet under consideration. Knowledge of digestibility
coefficients of ingredients also allows for an added measure of quality assurance as
digestibility of ingredients can vary considerable depending upon their overall freshness
and previous treatment (Garcia-Carreno, 1998).
Objectives
The objectives of the current study were:
1) Simultaneously determine apparent daily DP and DE requirements for sub-adult
L. vannammei under laboratory conditions.
2) Estimate the apparent DP and DE requirements for maintenance of four size
classes (approximately 5.5, 7.5, 15.5 and 18.5 g) of L. vannamei by utilizing the
comparative slaughter technique.
3) Determine apparent dry matter, protein and energy digestibility for ingredients
used in formulating L. vannamei diets.

20
CHAPTER II
DIGESTIBLE PROTEIN AND ENERGY REQUIREMENTS FOR GROWTH
AND MAINTENANCE OF SUB-ADULT PACIFIC WHITE SHRIMP
Litopenaeus vannamei
Introduction
Although shrimp farming remains one of the fastest growing segments of US
aquaculture, worth an estimated 6 billion US dollars (USD) per year, its growth in the
US also has been associated with negative environmental impacts (Boyd and Clay,
1998). These environmental impacts have forced US farmers to meet acceptable
pollutant levels in discharge which in some ways has slowed expansion of the industry
(Lawrence et al., 2001). Feeds can contribute a significant amount of enriching nutrients
in effluent that could necessitate the formulation of “environmentally friendly” or “least
polluting” feeds to help meet environmental standards. Velasco et al. (1999)
demonstrated the correlation between dietary protein and the accumulation of inorganic
nitrogen in culture water. They also observed that diets which maximize protein
utilization for growth as opposed to energy needs may lead to the reduction of
nitrogenous compounds in aquaculture effluent.
Protein levels in feed also must be optimized to reduce production costs as protein
accounts for the majority of feed content and expense (Shiau et al., 1992; Cordova-
Murueta, 2002) and feed costs currently account for the majority of production costs

21
(Akiyama et al., 1992). Shrimp farmers also have begun to increase stocking densities in
ponds and raceways to intensive or even super intensive levels to deal with the reduction
in shrimp prices. Such intensification places the nutritional burden on supplemented
feed as opposed to natural productivity and forces nutritionists to formulate feeds to
contain the proper balance of energy, protein, minerals and vitamins while preserving
the cost efficiencies realized through intensification. Feed formulators in turn look to
researchers to provide them with optimal nutrient levels to meet these challenges.
Dietary protein requirements have been estimated by feeding trials in which graded
levels of protein are fed to apparent satiation or in excess, to determine growth response
(typically, weight gain) under controlled or observed environmental conditions. Results
have suggested protein requirements of juvenile L. vannamei range from an as-fed
dietary inclusion level of 15%, with a energy to protein (E:P) ratio of 119.58 kJ g-1
protein (Aranyakananda, 1995), to approximately 30% of diet, with a dietary E:P ratio of
41.86 kJ g-1 protein (Cousin et al., 1991), to greater than 36% of diet (Smith et al., 1985)
and even greater than 40% of diet (Colvin and Brand, 1977). These variations are not
surprising considering that protein requirements can vary with age, size, physiological
status, growth rate and dietary characteristics such as E:P ratio (Colvin and Brand, 1977;
Bhaskar and Ali, 1984; Akiyama, 1991; Guillaume, 1997; Pedrazzoli et al., 1998) and
protein sources. Differences also may arise as these studies utilized an ad-libitum
feeding method which could allow shrimp to increase their feed intake to negate the
effect of a low protein diet and lead to substantial variation in dietary E:P requirement
(Kureshy and Davis, 2002). Kureshy and Davis (2002) estimated the protein

22
requirement for both maintenance and maximum weight gain of juvenile and sub-adult
L. vannamei by using feeds formulated to contain 16, 32, and 48% crude protein (CP)
with calculated E:P ratios of 105.06, 52.61, and 37.25 kJ g-1 protein. Juvenile
maintenance protein requirement was estimated between 1.8 and 3.8 g dietary protein
per kg of body weight per day (g CP kg-1 BW d-1) and between 1.5 and 2.1 g CP kg-1
BW d-1 for sub-adults. To achieve maximum weight gain juveniles required 46.4 g CP
kg-1 BW d-1 when fed the 32% protein diet and 23.5 g CP kg-1 BW d-1 for sub-adults fed
the same 32% protein diet. Feed efficiency (FE) increased with the CP level of the diet
and decreased with increased feeding rates. This indicates the importance of incremental
compared to ad-libitum feeding strategies for determination of protein requirements.
Although the authors determined a daily protein requirement, no attempt was made to
determine the daily energy requirement.
Although incremental feeding rate studies (i.e. factorial design) have been used to
determine both protein and energy requirements for years in terrestrial animals as well as
fish (Pfeffer and Pieper, 1979; Gatlin et al., 1986; Shearer, 1995), few studies exist for
shrimp. Factorial modeling relies upon the assumption a growing shrimp’s energy and
protein need is the sum of the requirement for growth and maintenance. Using the
respective partial efficiencies of utilization dietary feed intake can be calculated which
allows energy and protein requirements to be expressed in terms of absolute daily feed
intake per unit weight and weight gain as opposed to being expressed as a percentage of
the diet. The objective of this study was to simultaneously determine apparent daily

23
digestible protein and digestible energy requirements of sub-adult L. vannamei under
laboratory conditions.
Materials and methods Starvation trial Source of shrimp
Specific-pathogen-free L. vannamei postlarvae from four different maturation
cycles were obtained from The Oceanic Institute (Kailua-Kona, HI) and stocked
outdoors into 2.44-m diameter fiberglass tanks. Postlarvae were fed a commercial
postlarval feed (Rangen 45/10; Rangen Inc., Buhl, ID) four times daily. Postlarvae were
moved indoors 1 week prior to stocking to allow acclimation to laboratory conditions
(30.1 ± 0.5oC, 32.2 ± 0.4‰) and to achieve proper weight (mean ± s.d., g) for stocking
(5.51 ± 0.33, 7.19 ± 0.32, 14.10 ± 0.59, 16.59 ± 1.02).
Experimental system and design
The experimental system for this study consisted of 400 tanks (19-L volume,
bottom surface area 0.09 m2) connected to a semi-closed (8% new water daily)
recirculating seawater system. Seawater was pumped through a sand filter, biological
filter, 50-µm cartridge filter, heat exchanger and ultraviolet disinfection unit to achieve a
recirculating rate of 0.6 L min-1 tank-1 (1,440% exchange tank-1 day-1). A light:dark
photoperiod of 12:12 h was provided by supplemental compact fluorescent lighting. At
the start of the experiment 100 shrimp from each size class were blotted dry, weighed
and stocked individually into each tank. Shrimp were monitored daily for molting
24
activity as well as to assess mortality. Temperature, salinity and dissolved oxygen (DO)
were monitored daily using a YSI 85® Meter (YSI Inc., Yellow Springs, OH).
Ammonia-nitrogen, NO2-N, NO3-N, and pH were monitored weekly using methods
adapted from those of Spotte (1979a,b) and Solarzano (1969), Spotte (1979a,b) and
Mullen and Riley (1955), Spotte (1979a,b) and Strickland and Parsons (1972), and a
Brinkman Metrohm® pH meter, respectively.
Sample collection and analyses
Ten shrimp from each size class were removed on a weekly basis, enumerated,
blotted dry and individually weighed. Shrimp were then individually wrapped, labeled
and frozen (-84oC) until subsequent body composition analysis. Prior to compositional
analysis shrimp were individually lyophilized, finely ground with a coffee grinder
(Hamilton Beach/Proctor Silex, Inc., Racine, WI) to pass through a 20-mesh screen and
analyzed for percent dry matter (AOAC, 1990). Protein (AOAC Method 990.3; FP-528
Nitrogen/Protein Determinator; Leco Corporation, St. Joseph, MI), energy (model 1241
adiabatic bomb calorimeter; Parr Instrument Co., Moline, IL) and ash (AOAC, 1990)
were then determined for each lyophilized sample and reported on a dry-matter basis.
Immediately prior to stocking, a representative sample of 10 shrimp per size class was
individually processed as described above to determine initial body composition.
Statistical analysis
Allometric equations for the four different shrimp size classes were obtained by
applying linear regression analysis to logarithmic transformations of the data to obtain
allometric functions for ash, energy, moisture and protein. Energy and protein losses per
25
day per shrimp were calculated for each weight class and plotted against the weights of
the shrimp which was taken as the geometric mean between the initial and final weights
after 28 days of starvation. Allometric equations were then developed to predict the
daily loss of energy (kJ shrimp-1 day-1) and protein (g shrimp-1 day-1).
Preliminary evaluation of experimental diets
Experimental diets
Thirteen semi-purified diets were manufactured (cold extrusion via Hobart
mixer) at the Texas Agriculture Experimental Station (TAES) Shrimp Mariculture
Project (Port Aransas, TX). Ingredient compositions of the semi-purified basal diets are
shown in Table 1. All ingredients except alginate and sodium metaphosphate were
mixed in a food mixer (Model A-200, Hobart Corporation, Troy, OH) for 40 min. In a
separate bowl, alginate and sodium metaphosphate were added to deionized water (400
ml kg-1) and mixed using a hand mixer (Sunbeam Products Inc., Milford, MA) for
approximately 45 seconds. This mixture was then added to the dry ingredients and
mixed an additional minute to achieve a mash consistency appropriate for extrusion.
Extrusion was accomplished using a meat chopper attachment (Model A-200, Hobart
Corporation, Troy, OH) fitted with a 3-mm die. Moist feed strands were dried on wire
racks in a forced air oven at 35 oC to a moisture content of 8-10%. Dry feed strands
were ground using a mortar and pestle to provide a particle size ranging from 2-4 mm
and stored at 4 oC until used.

26Table 1. Composition of the thirteen preliminary diets.
Diet ID 100 101 102 103 104 105 106 107 108 109 110 111 112
Ingredient
Inclusion level (g kg-1) Alginate5 20.0 20.0 20.0 20.0 20.0 20.0 20.0 20.0 20.0 20.0 20.0 20.0 20.0
Calcium Carbonate2 14.6 14.6 14.6 14.6 14.6 14.6 14.6 14.6 14.6 14.6 14.6 13.0 12.3 Cellulose4 20.0 53.6 13.8 13.8 93.7 53.6 53.6 13.8 13.8 53.6 13.8 53.6 13.8
Cholesterol2 2.0 2.0 2.0 2.0 2.0 2.0 2.0 2.0 2.0 2.0 2.0 2.0 2.0 Diatomaceous Earth4 33.8 74.5 33.8 33.8 33.8 33.8
Dicalcium Phosphorus2 65.6 65.6 65.6 65.6 65.6 65.6 65.6 65.6 65.6 65.6 65.6 22.8 24.6 Fish Meal6 150.0 136.1 136.1 136.1 136.1 150.0 136.1 136.1 136.1 136.1 136.1 136.1 136.1
Isolated Soy1 79.4 111.1 111.1 79.4 111.1 111.1 111.1 KCL3 18.5 18.5 18.5 18.5 18.5 18.5 18.5 18.5 18.5 18.5 18.5 18.5 18.5 Krill1 105.0 90.7 90.7 90.7 90.7 105.0 90.7 90.7 90.7 90.7 90.7 90.7 90.7
Methionine2 0.4 1.4 0.4 0.4 0.4 0.4 Mineral-Vitamin
Premix1 2.7 2.7 2.7 2.7 2.7 2.7 2.7 2.7 2.7 1.8 1.8 2.7 2.7
MgO3 17.3 17.3 17.3 17.3 17.3 17.3 11.6 11.6 17.3 17.3 17.3 17.3 17.3 Phospholipid1 42.0 42.0 42.0 42.0 42.0 42.0 42.0 42.0 42.0 42.0 42.0 42.0 42.0
Sodium Metaphosphate5
10.0 10.0 10.0 10.0 10.0 10.0 10.0 10.0 10.0 10.0 10.0 10.0 10.0
Soybean Oil7 14.3 14.3 14.3 14.3 14.3 14.3 Squid1 150.0 136.1 136.1 136.1 136.1 150.0 136.1 136.1 136.1 136.1 136.1 136.1 136.1
Vitamin C1 0.5 0.5 0.5 0.5 0.5 0.5 0.5 0.5 0.34 0.5 0.5 0.5 0.5 Vitamin-Mineral
Premix1 2.3 2.3 2.3 2.3 2.3 2.3 2.3 2.3 2.3 1.5 1.5 2.3 2.3
Wheat Starch2 300.1 242.8 412.9 411.9 162.4 232.5 248.6 418.6 413.1 244.5 414.6 287.1 456.11Zeigler Brothers, Gardners, PA, USA. 2MP Biomedicals, Cleveland, OH, USA. 3Fisher Scientific, Fair Lawn, NJ, USA.

27Table 1. Continued 4Sigma, St. Louis, MO, USA. 5Keltone HV Alginate, NutraSweet-Kelco Company, Chicago, IL, USA. 6Omega Protein Corporation Inc., Houston, TX, USA. 7The J. M. Smucker Company, Orrville, OH, USA. ASee Appendix A for composition. BSee Appendix B for composition. Diet ID: 100 – Shrimp Mariculture Project (A.L.L.) Reference Diet 101 – 35% Crude Protein Diet 102 – 25% Crude Protein Diet 103 – Diet 102 with Methionine Increased to 0.85% 104 – Diet 101 with Ash and Fiber Increased to 24 and 10%, respectively 105 – Diet 101 with Squid Meal : Krill Meal : Fish Meal Ratio Adjusted to 15 : 10.5 : 15 106 – Diet 101 with 1/3 Less MgO 107 – Diet 102 with 1/3 Less MgO 108 – Diet 102 with 1/3 Less Vitamin C 109 – Diet 101 with 1/3 Less Vitamins and Minerals 110 – Diet 102 with 1/3 Less Vitamins and Minerals 111 – Diet 101 with 1/3 Less Ca : P 112 – Diet 102 with 1/3 Less Ca : P

28
Source of shrimp
Specific-pathogen-free L. vannamei postlarvae were obtained from The Oceanic
Institute (Kailua-Kona, HI) and stocked into 8.00-m diameter outdoor fiberglass tanks.
Postlarvae were fed live Artemia sp. nauplii and a commercial postlarval feed (Rangen
45/10; Rangen Inc., Buhl, ID) twice and 12 times daily, respectively. Postlarvae were
held approximately 8 weeks to allow for acclimation to laboratory conditions (30.4 ± 0.3
oC, 32.6 ± 0.3‰) and to achieve proper weight for stocking (5.22 g ± 0.44).
Experimental system and design
The experimental system for this study consisted of 400 tanks (19-L volume,
bottom surface area 0.09 m2) connected to a semi-closed (8% new water daily)
recirculating seawater system. Seawater was pumped through a sand filter, biological
filter, 50-µm cartridge filter, heat exchanger and ultraviolet disinfection unit to achieve a
recirculating rate of 0.6 L min-1 tank-1 (1,440% exchange tank-1 day-1). A light:dark
photoperiod of 12:12 h was provided by supplemental compact fluorescent lighting. At
the start of the experiment shrimp were blotted dry, weighed and stocked individually
into each tank. Twenty shrimp were randomly assigned to each diet listed in Table 1.
Uneaten feed, feces, molts, and dead shrimp in each tank were removed daily prior to
filling (0.4 g feed shrimp-1 day-1) wheel-type automatic feeders (set to deliver 15
feedings day-1 tank-1) with the appropriate experimental feed. Temperature, salinity and
dissolved oxygen (DO) were monitored daily using a YSI 85® Meter (YSI Inc., Yellow
Springs, OH). Ammonia-nitrogen, NO2-N, NO3-N, and pH were monitored weekly
using methods adapted from those of Spotte (1979a,b) and Solarzano (1969), Spotte

29
(1979a,b), Mullen and Riley (1955), Spotte (1979a,b) and Strickland and Parsons
(1972), and a Brinkman Metrohm® pH meter, respectively.
Termination of trial and statistical analysis
Experimental tanks used in the growth study were harvested after 7 weeks.
Shrimp where then enumerated, blotted dry and weighed individually by treatment tank.
Feed performance was evaluated by the following biometrics: ln final weight, ln weight
gain, percent survival, percent growth and instantaneous growth rate (IGR).
Instantaneous growth rate was calculated by the following equation: IGR = 100 ×
[ln(final weight/initial weight)]/duration of feeding trial in days (Cushing, 1968). Data
were statistically compared using SPSS by one-way ANOVA. Treatment means were
separated by the Student-Newman-Keuls test (P<0.05).
Growth and survival trial Experimental diets
Two semi-purified nutritionally replete diets were manufactured (cold extrusion
via Hobart mixer) at TAES Shrimp Mariculture Project (Port Aransas, TX). Ingredient
composition of the 25% crude protein (15.89 kJ g-1) and 35% crude protein (15.48 kJ g-1)
semi-purified basal diets are shown in Tables 2 and 3, respectively. All ingredients
except alginate and sodium metaphosphate were mixed in a food mixer (Model A-200,
Hobart Corporation, Troy, OH) for 40 min. In a separate bowl, alginate and sodium
metaphosphate were added to deionized water (400 ml kg-1) and mixed using a hand
mixer (Sunbeam Products Inc., Milford, MA) for approximately 45 seconds. This
mixture was then added to the dry ingredients and mixed an additional minute to achieve

30
a mash consistency appropriate for extrusion. Extrusion was accomplished using a meat
chopper attachment (Model A-200, Hobart Corporation, Troy, OH) fitted with a 3 mm
die. Moist feed strands were dried on wire racks in a forced air oven at 35 oC to a
moisture content of 8-10%. Dry feed strands were ground using a mortar and pestle to
provide a particle size ranging from 2-4 mm and stored at 4 oC until used.
Table 2. Composition of the 25% crude protein, 15.89 kJ g-1 diet. Ingredient Inclusion level
(g kg-1) Ingredient Inclusion level
(g kg-1) Alginate5 20.00 Mineral-Vitamin Premix1,A 2.70 Calcium Carbonate2 14.60 MgO3 17.30 Cellulose4 13.83 Phospholipid1 42.00 Cholesterol2 2.00 Sodium Metaphosphate3 10.00 Dicalcium Phosphorus2 65.60 Soybean Oil7 14.33 Fish Meal6 136.11 Squid1 136.11 KCl3 18.50 Vitamin C1 0.50 Krill1 90.74 Vitamin-Mineral Premix1,B 2.30 Methionine2 0.43 Wheat Starch2 412.95 Ash (g kg-1) 181.14a Energy (kJ kg-1) 15899a Dry Matter (g kg-1) 904.4a DCP (g kg-1) 208.4a Crude Lipid (g kg-1) 9.01a DE (kJ kg-1) 13347a Crude Protein (g kg-1) 250.7a PE ratio (g/kJ)* 1.56a 1Zeigler Brothers, Gardners, PA, USA. 2MP Biomedicals, Cleveland, OH, USA. 3Fisher Scientific, Fair Lawn, NJ, USA. 4Sigma, St. Louis, MO, USA. 5Keltone HV Alginate, NutraSweet-Kelco Company, Chicago, IL, USA. 6Omega Protein Corporation Inc., Houston, TX, USA. 7The J. M. Smucker Company, Orrville, OH, USA. ASee Appendix A for composition. BSee Appendix B for composition. *Calculation based on digestible energy and protein. aCalculated on an as-fed basis.

31
Table 3. Composition of the 35% crude protein, 15.48 kJ g-1 diet. Ingredient Inclusion level
(g kg-1) Ingredient Inclusion level
(g kg-1) Alginate5 20.00 Krill1 90.74 Calcium Carbonate2 14.60 Mineral-Vitamin Premix1,A 2.70 Cellulose4 53.69 MgO3 17.30 Cholesterol2 2.00 Phospholipid1 42.00 Diatomaceous Earth4 33.84 Sodium Metaphosphate3 10.00 Dicalcium Phosphorus2 65.60 Squid1 136.11 Fish Meal6 136.11 Vitamin C1 0.50 Isolated Soy (90%)1 111.12 Vitamin-Mineral Premix1,B 2.30 KCl3 18.50 Wheat Starch2 242.88 Ash (g kg-1) 217.13a Energy (kJ kg-1) 15480a Dry Matter (g kg-1) 906.7a DCP (g kg-1) 318.0a Crude Lipid (g kg-1) 7.68a DE (kJ kg-1) 13221a Crude Protein (g kg-1) 352.6a PE ratio (g/kJ)* 2.40a 1Zeigler Brothers, Gardners, PA, USA. 2MP Biomedicals, Cleveland, OH, USA. 3Fisher Scientific, Fair Lawn, NJ, USA. 4Sigma, St. Louis, MO, USA. 5Keltone HV Alginate, NutraSweet-Kelco Company, Chicago, IL. 6Omega Protein Corporation Inc., Houston, TX, USA. ASee Appendix A for composition. BSee Appendix B for composition. *Calculation based on digestible energy and protein. aCalculated on an as-fed basis.
Source of shrimp
Specific-pathogen-free L. vannamei postlarvae were obtained from The Oceanic
Institute (Kailua-Kona, HI) and stocked into 2.44-m diameter fiberglass tanks.
Postlarvae were fed live Artemia sp. nauplii and a commercial postlarval feed (Rangen
45/10; Rangen Inc., Buhl, ID) twice and 12 times daily, respectively. Postlarvae were
held approximately 8 weeks to allow for acclimation to laboratory conditions (30.1 ± 0.5
oC, 32.2 ± 0.4‰) and to achieve proper weight for stocking (5.47 g ± 0.29).

32
Experimental system and design
The experimental system for this study consisted of 400 tanks (19 L volume,
bottom surface area 0.09 m2) connected to a semi-closed (8% new water daily)
recirculating seawater system. Seawater was pumped through a sand filter, biological
filter, 50-µm cartridge filter, heat exchanger and ultraviolet disinfection unit to achieve a
recirculating rate of 0.6 L min-1 tank-1 (1,440% exchange tank-1 day-1). A light:dark
photoperiod of 12:12 h was provided by supplemental compact fluorescent lighting. At
the start of the experiment shrimp were blotted dry, weighed and stocked individually
into each tank. Twenty shrimp were randomly assigned to each constant feed rate (Table
4) for both semi-purified diets. Uneaten feed, feces, molts, and dead shrimp in each tank
were removed daily prior to filling wheel-type automatic feeders (set to deliver 15
feedings day-1 tank-1) with the appropriate experimental feed. Temperature, salinity and
dissolved oxygen (DO) were monitored daily using a YSI 85® Meter (YSI Inc., Yellow
Springs, OH). Ammonia-nitrogen, NO2-N, NO3-N, and pH were monitored weekly
using methods adapted from those of Spotte (1979a,b) and Solarzano (1969), Spotte
(1979a,b) and Mullen and Riley (1955), Spotte (1979a,b) and Strickland and Parsons
(1972), and a Brinkman Metrohm® pH meter, respectively.
33
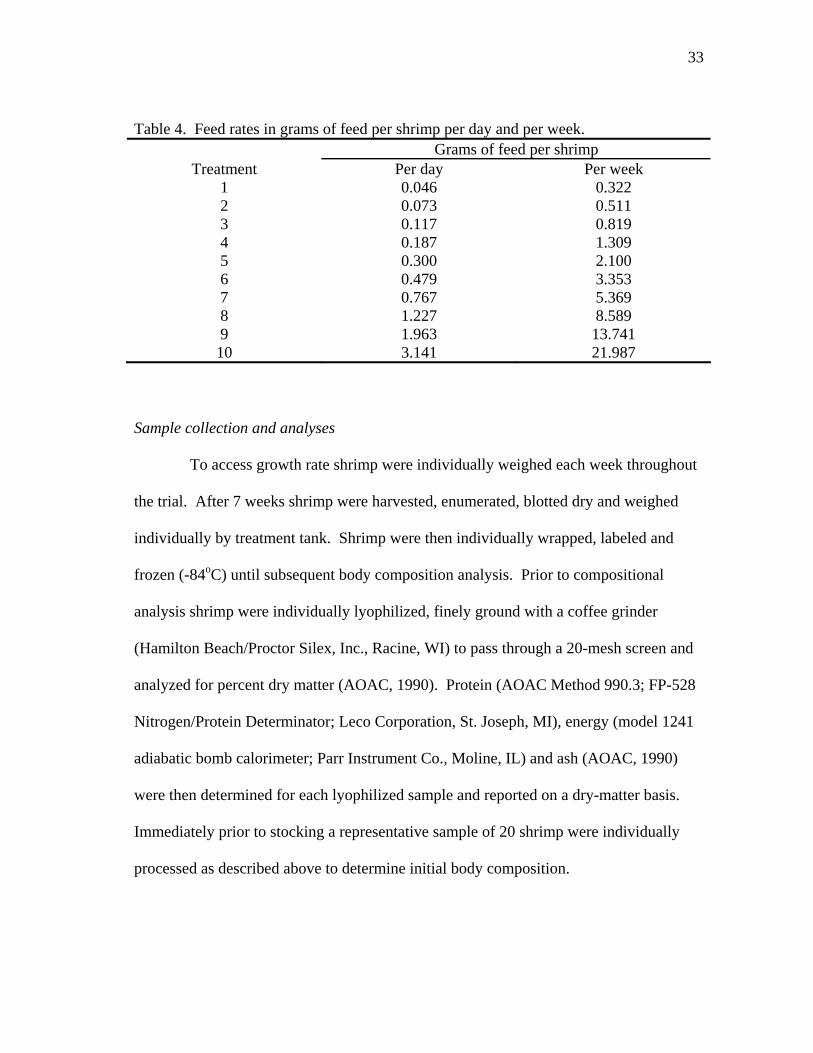
Table 4. Feed rates in grams of feed per shrimp per day and per week. Grams of feed per shrimp
Treatment Per day Per week 1 0.046 0.322 2 0.073 0.511 3 0.117 0.819 4 0.187 1.309 5 0.300 2.100 6 0.479 3.353 7 0.767 5.369 8 1.227 8.589 9 1.963 13.741 10 3.141 21.987
Sample collection and analyses
To access growth rate shrimp were individually weighed each week throughout
the trial. After 7 weeks shrimp were harvested, enumerated, blotted dry and weighed
individually by treatment tank. Shrimp were then individually wrapped, labeled and
frozen (-84oC) until subsequent body composition analysis. Prior to compositional
analysis shrimp were individually lyophilized, finely ground with a coffee grinder
(Hamilton Beach/Proctor Silex, Inc., Racine, WI) to pass through a 20-mesh screen and
analyzed for percent dry matter (AOAC, 1990). Protein (AOAC Method 990.3; FP-528
Nitrogen/Protein Determinator; Leco Corporation, St. Joseph, MI), energy (model 1241
adiabatic bomb calorimeter; Parr Instrument Co., Moline, IL) and ash (AOAC, 1990)
were then determined for each lyophilized sample and reported on a dry-matter basis.
Immediately prior to stocking a representative sample of 20 shrimp were individually
processed as described above to determine initial body composition.

34
Statistical analysis
To determine daily protein and energy requirements, shrimp specific growth rate
and body composition data were regressed against protein and energy intake by using
broken-line regression (Robbins et al., 1979). Maintenance energy and protein
requirements were determined by regressing the growth rate back to zero.
Results
Starvation trial
Water quality
Mean (± standard deviation) NH3-N, NO2-N, NO3-N and pH were 0.05 ± 0.02
mg L-1, 0.09 ± 0.02 mg L-1, 1.48 ± 1.11 mg L-1, and 8.03 ± 0.02, respectively. Mean (±
standard deviation) temperature, salinity, and DO were 30.2 ± 0.47 oC, 30.5 ± 0.6‰, and
5.99 ± 0.44 mg L-1, respectively.
Allometric equations for whole-body composition
The absolute composition (i.e. g shrimp-1 or kJ shrimp-1) of L. vannamei changed
in a linear fashion as initial shrimp weight increased (Table 5) allowing allometric
equations to be fitted for energy, protein, ash and dry matter:
Energy (kJ shrimp-1) = 4.49 * W(g)1.076 (R2 = 0.988) (Equation 1)
Protein (g shrimp-1) = 0.157 * W(g)1.103 (R2 = 0.993) (Equation 2)
Ash (g shrimp-1) = 0.034 * W(g)0.921 (R2 = 0.967) (Equation 3)
Dry matter (g shrimp-1) = 0.236 * W(g)1.047 (R2 = 0.991) (Equation 4)
35
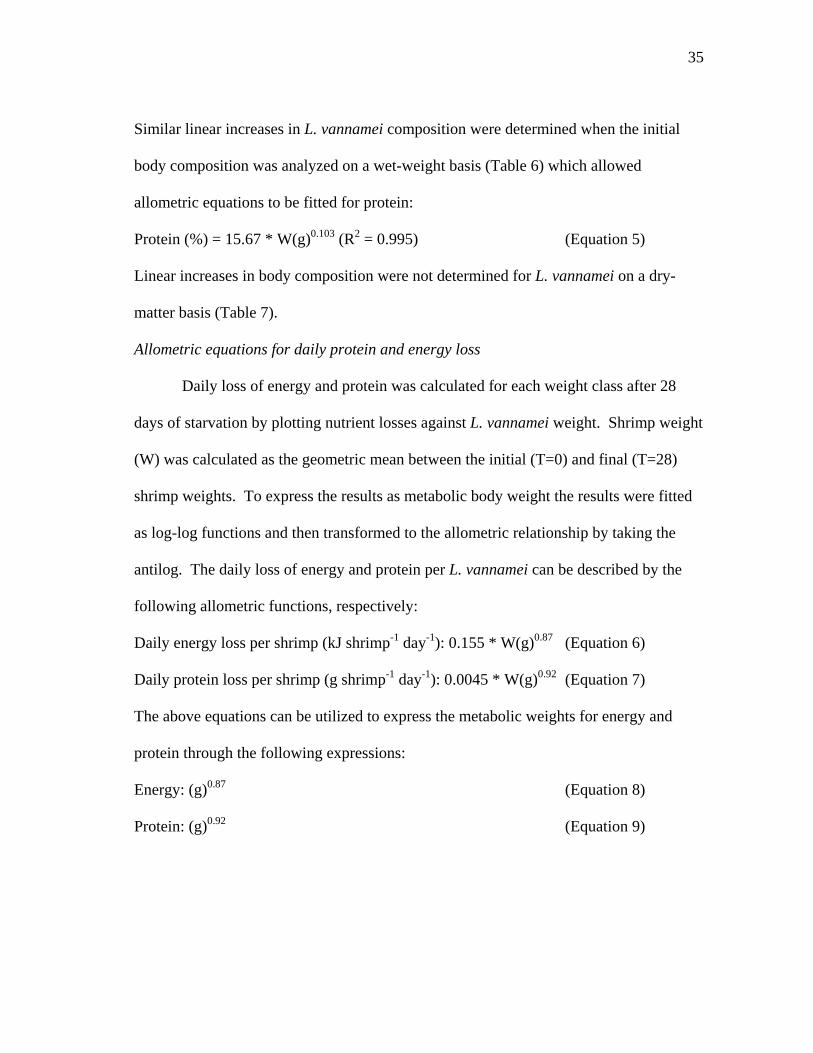
Similar linear increases in L. vannamei composition were determined when the initial
body composition was analyzed on a wet-weight basis (Table 6) which allowed
allometric equations to be fitted for protein:
Protein (%) = 15.67 * W(g)0.103 (R2 = 0.995) (Equation 5)
Linear increases in body composition were not determined for L. vannamei on a dry-
matter basis (Table 7).
Allometric equations for daily protein and energy loss
Daily loss of energy and protein was calculated for each weight class after 28
days of starvation by plotting nutrient losses against L. vannamei weight. Shrimp weight
(W) was calculated as the geometric mean between the initial (T=0) and final (T=28)
shrimp weights. To express the results as metabolic body weight the results were fitted
as log-log functions and then transformed to the allometric relationship by taking the
antilog. The daily loss of energy and protein per L. vannamei can be described by the
following allometric functions, respectively:
Daily energy loss per shrimp (kJ shrimp-1 day-1): 0.155 * W(g)0.87 (Equation 6)
Daily protein loss per shrimp (g shrimp-1 day-1): 0.0045 * W(g)0.92 (Equation 7)
The above equations can be utilized to express the metabolic weights for energy and
protein through the following expressions:
Energy: (g)0.87 (Equation 8)
Protein: (g)0.92 (Equation 9)

36Table 5. Effect of starvation on absolute body composition of four different size classes of L. vannamei1. Time in days at slaughter
0 7 14 21 28 % Gain (Loss) Over 28 Days
Mean Shrimp Wt. (g) 5.51±0.327 5.05±0.347 4.68±0.320 4.53±0.216 4.67±0.348 (15.24) Ash (g shrimp-1) 0.17±0.017 0.16±0.020 0.14±0.023 0.14±0.012 0.16±0.036 (5.88) Dry Matter (g shrimp-1) 1.38±0.143 1.10±0.094 0.81±0.076 0.66±0.095 0.70±0.102 (49.27) Energy (kJ shrimp-1) 27.65±3.025 20.04±1.857 13.85±1.125 11.09±1.665 11.00±1.635 (60.21) Protein (g shrimp-1) 1.02±0.107 0.85±0.078 0.59±0.059 0.45±0.086 0.43±0.045 (57.84)
Mean Shrimp Wt. (g) 7.19±0.320 6.81±0.342 6.49±0.484 6.09±0.280 6.16±0.239 (14.32) Ash (g shrimp-1) 0.20±0.015 0.19±0.014 0.20±0.029 0.20±0.016 0.20±0.024 0.00 Dry Matter (g shrimp-1) 1.87±0.148 1.57±0.106 1.31±0.177 0.97±0.077 0.93±0.082 (50.26) Energy (kJ shrimp-1) 37.95±3.522 29.75±2.167 22.93±3.250 15.52±1.736 14.94±1.539 (60.63) Protein (g shrimp-1) 1.38±0.097 1.24±0.073 1.00±0.142 0.67±0.083 0.64±0.062 (53.62) Mean Shrimp Wt. (g) 14.10±0.589 14.03±0.550 12.71±0.655 12.54±0.700 12.13±0.716 (13.97) Ash (g shrimp-1) 0.38±0.022 0.40±0.016 0.36±0.034 0.40±0.025 0.42±0.033 9.52 Dry Matter (g shrimp-1) 3.76±0.185 3.38±0.169 2.62±0.194 2.31±0.192 2.08±0.187 (44.68) Energy (kJ shrimp-1) 77.65±4.916 66.32±4.158 48.83±4.409 41.04±3.970 35.44±3.824 (54.36) Protein (g shrimp-1) 2.89±0.129 2.75±0.161 2.11±0.179 1.75±0.206 1.50±0.192 (48.09) Mean Shrimp Wt. (g) 16.59±1.016 16.17±0.842 14.97±0.679 14.73±1.008 13.95±1.049 (15.91) Ash (g shrimp-1) 0.47±0.030 0.47±0.045 0.46±0.024 0.46±0.047 0.43±0.075 (8.51) Dry Matter (g shrimp-1) 4.44±0.246 3.86±0.308 3.22±0.197 2.79±0.276 2.35±0.234 (47.07) Energy (kJ shrimp-1) 91.88±5.372 76.40±7.091 61.55±4.184 51.34±5.464 41.88±3.999 (54.41) Protein (g shrimp-1) 3.49±0.189 3.17±0.254 2.60±0.179 2.20±0.244 1.75±0.169 (49.86) 1Means of 10 shrimp ± standard deviation.

37Table 6. Effect of starvation on body composition (wet-weight basis) of four different size classes of L. vannamei1. Time in days at slaughter
0 7 14 21 28 % Gain (Loss) Over 28 Days
Mean Shrimp Wt. (g) 5.51±0.327 5.05±0.347 4.68±0.320 4.53±0.216 4.67±0.348 (20.69) Ash (%)2 3.14±0.351 3.14±0.260 3.07±0.334 3.05±0.197 3.35±0.592 6.69 Moisture (%) 74.54±1.483 78.15±0.813 82.61±0.946 85.31±1.612 85.03±1.291 14.07 Energy (kJ g-1)2 5.10±0.326 3.97±0.200 2.97±0.163 2.42±0.271 2.34±0.209 (54.10) Protein (%)2 18.73±1.084 16.89±0.866 12.60±0.739 9.82±1.573 9.22±0.427 (50.77)
Mean Shrimp Wt. (g) 7.19±0.320 6.81±0.342 6.49±0.484 6.09±0.280 6.16±0.239 (14.32) Ash (%)2 2.74±0.141 2.85±0.193 3.07±0.278 3.25±0.228 3.20±0.307 16.79 Moisture (%) 73.97±1.606 76.89±1.108 79.93±1.430 84.05±1.171 84.86±1.119 14.72 Energy (kJ g-1)2 5.27±0.380 4.35±0.238 3.51±0.284 2.55±0.263 2.42±0.221 (53.97) Protein (%)2 19.16±0.996 18.18±0.666 15.40±1.195 11.09±1.345 10.35±0.847 (45.98) Mean Shrimp Wt. (g) 14.10±0.589 14.03±0.550 12.71±0.655 12.54±0.700 12.13±0.716 (13.97) Ash (%)2 2.69±0.091 2.88±0.084 2.84±0.182 3.23±0.208 3.46±0.185 28.62 Moisture (%) 73.29±0.800 75.89±0.813 79.35±0.651 81.56±0.714 82.87±1.123 13.07 Energy (kJ g-1)2 5.52±0.255 4.72±0.225 3.84±0.184 3.26±0.179 2.92±0.263 (46.97) Protein (%)2 20.50±0.638 19.55±0.623 16.57±0.693 13.94±1.048 12.40±1.364 (39.51) Mean Shrimp Wt. (g) 16.59±1.016 16.17±0.842 14.97±0.679 14.73±1.008 13.95±1.049 (15.91) Ash (%)2 2.83±0.076 2.91±0.229 2.89±0.160 3.12±0.216 3.04±0.353 7.42 Moisture (%) 73.18±0.678 76.17±0.815 78.51±0.778 81.10±0.780 83.13±0.860 13.60 Energy (kJ g-1)2 5.52±0.217 4.72±0.238 4.10±0.179 3.47±0.184 3.01±0.175 (45.45) Protein (%)2 21.02±0.529 19.57±0.770 17.36±0.766 14.92±0.919 12.52±0.656 (40.44) 1Means of 10 shrimp ± standard deviation. 2Results expressed on a wet-weight basis.

38Table 7. Effect of starvation on body composition (dry-matter basis) of four different size classes of L. vannamei1. Time in days at slaughter
0 7 14 21 28 % Gain (Loss) Over 28 Days
Mean Shrimp Wt. (g) 5.51±0.327 5.05±0.347 4.68±0.320 4.53±0.216 4.67±0.348 (15.24) Ash (%)2 12.34±1.253 14.39±1.361 17.66±1.647 20.88±1.645 22.28±1.906 80.55 Moisture (%) 74.54±1.483 78.15±0.813 82.61±0.946 85.31±1.612 85.03±1.291 14.07 Energy (kJ g-1)2 19.99±3.037 18.15±0.69 17.02±0.598 16.61±0.744 15.69±0.439 (21.55) Protein (%)2 73.62±1.739 77.28±2.298 72.48±1.682 66.64±5.069 61.74±3.443 (16.14)
Mean Shrimp Wt. (g) 7.19±0.320 6.81±0.342 6.49±0.484 6.09±0.280 6.16±0.239 (14.32) Ash (%)2 10.56±0.575 12.36±1.139 15.31±0.900 20.48±2.276 21.13±1.335 100.00 Moisture (%) 73.97±1.606 76.89±1.108 79.93±1.430 84.05±1.171 84.86±1.119 14.72 Energy (kJ g-1)2 20.25±0.456 18.91±0.380 17.53±0.393 15.98±0.648 16.02±0.615 (20.87) Protein (%)2 73.68±1.180 78.73±1.427 76.71±1.376 69.31±3.735 68.34±2.361 (7.24) Mean Shrimp Wt. (g) 14.10±0.589 14.03±0.550 12.71±0.655 12.54±0.700 12.13±0.716 (13.97) Ash (%)2 10.08±0.212 11.97±0.618 13.75±0.966 17.53±1.410 20.27±1.848 101.09 Moisture (%) 73.29±0.800 75.89±0.813 79.35±0.651 81.56±0.714 82.87±1.123 13.07 Energy (kJ g-1)2 20.58±0.418 19.58±0.418 18.57±0.506 17.69±0.351 17.02±0.523 (17.28) Protein (%)2 76.77±0.821 81.08±1.432 80.23±1.222 75.46±2.985 72.19±3.566 (5.97) Mean Shrimp Wt. (g) 16.59±1.016 16.17±0.842 14.97±0.679 14.73±1.008 13.95±1.049 (15.91) Ash (%)2 10.55±0.308 12.21±0.952 13.46±0.675 16.55±1.241 18.02±1.806 70.80 Moisture (%) 73.18±0.678 76.17±0.815 78.51±0.778 81.10±0.780 83.13±0.860 13.60 Energy (kJ g-1)2 20.66±0.364 19.79±0.472 19.12±0.271 18.40±0.414 17.82±0.430 (13.77) Protein (%)2 78.42±1.678 82.12±1.319 80.77±2.039 78.91±2.441 74.21±1.156 (5.37) 1Means of 10 shrimp ± standard deviation. 2Results expressed on a dry-matter basis.

39
Preliminary evaluation of experimental diets
Water quality
Mean (± standard deviation) NH3-N, NO2-N, NO3-N and pH were 0.12 ± 0.03
mg L-1, 0.22 ± 0.07 mg L-1, 5.48 ± 1.09 mg L-1, and 8.01 ± 0.1, respectively. Mean (±
standard deviation) temperature, salinity, and DO were 30.3 ± 0.33 oC, 31.6 ± 0.5‰, and
5.99 ± 0.21 mg L-1, respectively.
Growth and survival of L. vannamei fed preliminary diets
Results from the preliminary growth trial are summarized in Table 8. Diet 100
(A.L.L. reference diet) produced significantly (P<0.05) greater responses than all other
diets for the measured growth metrics (ln final weight gain, ln weight gain, IGR, and
percent growth). Survival was high (95-100%) for all dietary treatments and was not
significantly different among treatments (P>0.05). No significant differences were
determined between the 35 and 25% crude protein diets (diets 101 and 102, respectively)
or between these diets and Zeigler 35% Hi-density or Rangen 45/10 commercial feeds
(diets 114 and 113, respectively). Dietary adjustments (+/- 33%) of magnesium oxide
(diets 106 and 107), vitamin and mineral premixes (diets 109 and 110) or the Ca:P ratio
(diets 111 and 112) had no significant effect on measured growth metrics for either the
basal 35 or 25% crude protein diets. Adjustment of the methionine content to 0.85%
(diet 103) or removal of 33% vitamin C (diet 108) from the 25% crude protein diet also
had no significant effect on measured growth matrices. Similarly, adjustment of the ash
and fiber contents (diet 104) or the squid meal:krill meal:fish meal ratio (diet 105) in the
35% crude protein diet had no significant effect on measured growth metrics.

40
Table 8. Response of L. vannamei fed preliminary diets.1,2 Diet ln Final Weight
(g) ln Weight Gain (g)
IGR Growth (%)
Survival (%)
100 2.54b(0.13) 2.26b(0.35) 3.82b(0.64) 384b(70) 100a(0) 101 2.32a(0.19) 2.03a(0.23) 3.31a(0.40) 306a(69) 100a(0) 102 2.31a(0.14) 2.03a(0.19) 3.44a(0.42) 332a(78) 100a(0) 103 2.31a(0.15) 2.02a(0.19) 3.33a(0.40) 311a(68) 100a(0) 104 2.21a(0.13) 1.90a(0.17) 3.18a(0.36) 285a(60) 95a(8.43) 105 2.30a(0.15) 2.00a(0.20) 3.26a(0.40) 298a(70) 95a(8.43) 106 2.35a(0.16) 2.01a(0.28) 3.30a(0.44) 307a(72) 95a(8.43) 107 2.34a(0.21) 1.90a(0.27) 3.04a(0.44) 266a(67) 100a(0) 108 2.31a(0.22) 2.06a(0.22) 3.35a(0.41) 313a(67) 100a(0) 109 2.23a(0.19) 1.93a(0.23) 3.19a(0.39) 287a(65) 95a(8.43) 110 2.31a(0.21) 2.02a(0.26) 3.35a(0.49) 318a(94) 95a(8.43) 111 2.27a(0.14) 1.97a(0.19) 3.26a(0.42) 300a(69) 100a(0) 112 2.29a(0.15) 1.99a(0.22) 3.22a(0.47) 293a(76) 100a(0) 113 2.32a(0.15) 2.04a(0.22) 3.38a(0.43) 320a(78) 100a(0) 114 2.21a(0.17) 1.89a(0.22) 3.19a(0.39) 287a(63) 100a(0) 1Means of 20 replicates (SD) 2Means with similar superscripts in same column are not statistically different (P>0.05) Diet ID: 100 – Shrimp Mariculture Project (A.L.L.) Reference Diet 101 – 35% Crude Protein Diet 102 – 25% Crude Protein Diet 103 – Diet 102 with Methionine Increased to 0.85% 104 – Diet 101 with Ash and Fiber Increased to 24 and 10%, respectively 105 – Diet 101 with Squid Meal : Krill Meal : Fish Meal Ratio Adjusted to 15 : 10.5 : 15 106 – Diet 101 with 1/3 Less MgO 107 – Diet 102 with 1/3 Less MgO 108 – Diet 102 with 1/3 Less Vitamin C 109 – Diet 101 with 1/3 Less Vitamins and Minerals 110 – Diet 102 with 1/3 Less Vitamins and Minerals 111 – Diet 101 with 1/3 Less Ca : P 112 – Diet 102 with 1/3 Less Ca : P 113 – Rangen 45/15 Commercial Feed 114 – Zeigler 35% Hi-Density Commercial Feed

41
Growth and survival trial
Water quality
Mean (± standard deviation) NH3-N, NO2-N, NO3-N and pH were 0.09 ± 0.01
mg L-1, 0.11 ± 0.03 mg L-1, 3.74 ± 1.12 mg L-1, and 8.01 ± 0.2, respectively. Mean (±
standard deviation) temperature, salinity, and DO were 30.5 ± 0.41 oC, 30.8 ± 0.4‰, and
5.97 ± 0.39 mg L-1, respectively.
Apparent consumption
To determine apparent consumption, feed rate was regressed against maximum
weight gain for the 25 and 35% protein diets (Figures 1 and 2; respectively). Apparent
consumption for the shrimp fed the 25% protein diet was estimated to be 0.32 g feed
day-1 shrimp-1 and was obtained from the regression equation: apparent consumption =
1383.57 + 42921.56x with a correlation coefficient (C) of 15287.77 as follows: apparent
consumption = (C – Bo)/B1. Apparent consumption for the 35% protein diet was
estimated to be 0.31 g feed day-1 shrimp-1 and was obtained from the regression
equation: apparent consumption = 415.17 + 50039.30x with an correlation coefficient
(C) of 16189.82 as described above.
Conversion efficiencies
Protein and energy conversion efficiencies increased with feed rate until shrimp
received 0.063 g DP shrimp-1 day-1 (4.00 kJ DE shrimp-1 day-1) of the 25% protein diet
(Table 9) or 0.095 g DP shrimp-1 day-1 (3.96 kJ DE shrimp-1 day-1) of the 35% protein
diet (Table 10); then progressively decreased as feed rates increased. Protein conversion
efficiency for maximum growth was more efficient for the 25% protein diet than the

42
35% protein diet; however, energy conversion efficiency for maximum growth was less
efficient. Digestible protein and digestible energy feed rates which provided the most
efficient protein and energy conversion also provided the best feed conversion ratio
(FCR) and feed efficiency ratio (FER) for the 35% protein diet (Table 11); however, the
best FCR and FER was obtained for the 25% protein diet when shrimp were fed 0.039 g
DP shrimp-1 day-1 (2.49 kJ DE shrimp-1 day-1; Table 12). Similar decreases in FCR and
FER were witnessed for both diets as feed rates increased above those which provided
the best growth.
.0460 .0730 .1170 .1870 .3000 .4790 .7670 1.2270 1.9630 3.1410
Daily Feed Rate (g feed / shrimp)
-5.00
0.00
5.00
10.00
15.00
Final
Weig
ht G
ain (g
)
355
155 308
109
354
271
Figure 1. Weight gain (g) vs. daily feed rate (g feed/shrimp) for Litopenaeus vannamei fed a 25% protein, 15.89 kJ g-1 diet.

43
.0460 .0730 .1170 .1870 .3000 .4790 .7670 1.2270 1.9630 3.1410
Daily Feed Rate (g feed / shrimp)
-5.00
0.00
5.00
10.00
15.00Fin
al W
eight
Gain
(g)
228
278 131
185
36337
242
394
Figure 2. Weight gain (g) vs. daily feed rate (g feed/shrimp) for Litopenaeus vannamei fed a 35% protein, 15.48 kJ g-1 diet.

44Table 9. Energy and protein conversion efficiencies of L. vannamei fed incremental levels of a 25% crude protein, 15.89 kJ g-1 diet1.
Daily Feeding Rate Protein
(g DP shrimp-1) Energy
(kJ DE shrimp-1)
Energy Conversion
Efficiency2
Protein Conversion
Efficiency3 0.000 0.00 0 0 0.010 0.615 -45.32 -96.09 0.015 0.974 -16.30 -25.53 0.024 1.564 0.60 12.80 0.039 2.497 10.86 34.61 0.063 4.008 12.63 35.95 0.100 6.401 9.60 26.36 0.160 10.250 5.72 15.68 0.256 16.397 4.13 11.41 0.409 26.233 2.33 6.38 0.655 41.978 1.48 4.06
1Results based on 20 shrimp. 2Final body protein-initial body protein x 100 (total protein fed)-1. 3Final body energy-initial body energy x 100 (total energy fed)-1.

45Table 10. Energy and protein conversion efficiencies of L. vannamei fed incremental levels of a 35% crude protein, 15.48 kJ g-1 diet1.
Daily Feeding Rate Protein
(g DP shrimp-1) Energy
(kJ DE shrimp-1)
Energy Conversion
Efficiency2
Protein Conversion
Efficiency3 0.000 0.000 0 0 0.015 0.606 -50.29 -77.00 0.023 0.966 -20.06 -25.21 0.037 1.548 -2.33 3.76 0.059 2.472 11.77 25.78 0.095 3.966 15.45 30.64 0.152 6.334 11.81 22.55 0.244 10.142 6.31 12.32 0.390 16.225 4.05 7.73 0.624 25.957 2.75 5.14 0.999 41.534 1.74 3.31
1Results based on 20 shrimp. 2Final body protein-initial body protein x 100 (total protein fed)-1. 3Final body energy-initial body energy x 100 (total energy fed)-1.
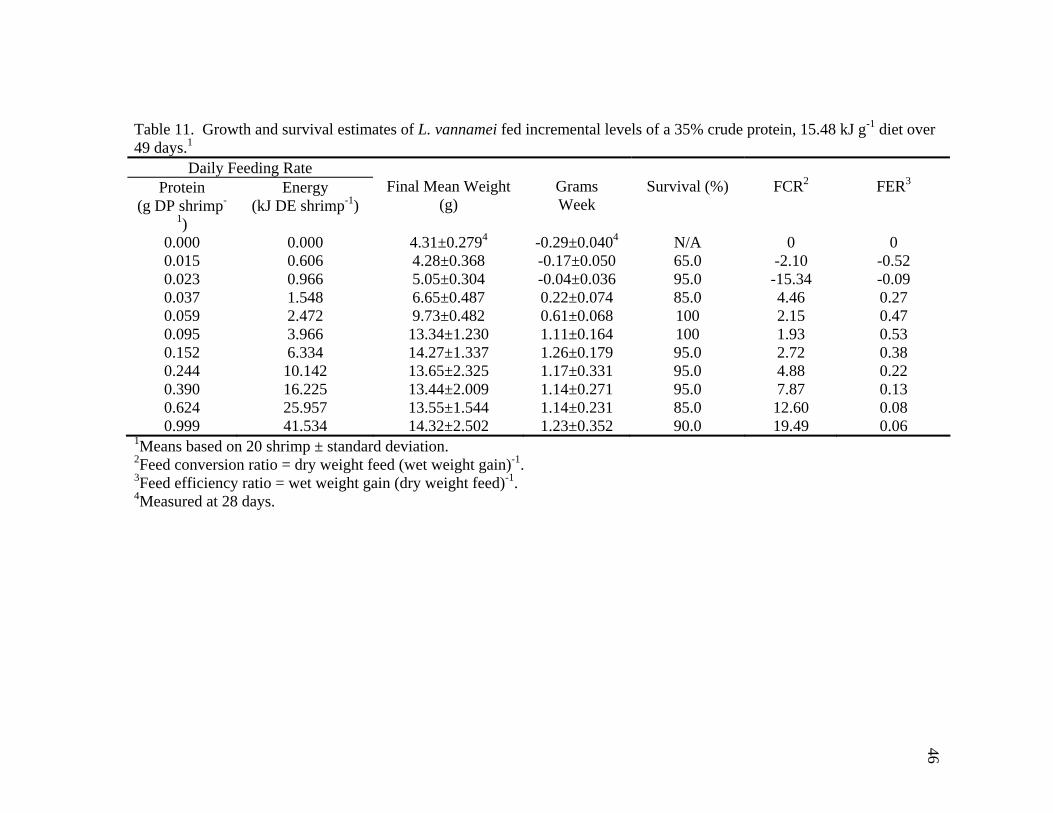
46Table 11. Growth and survival estimates of L. vannamei fed incremental levels of a 35% crude protein, 15.48 kJ g-1 diet over 49 days.1
Daily Feeding Rate Protein
(g DP shrimp-
1)
Energy (kJ DE shrimp-1)
Final Mean Weight
(g)
Grams Week
Survival (%)
FCR2
FER3
0.000 0.000 4.31±0.2794 -0.29±0.0404 N/A 0 0 0.015 0.606 4.28±0.368 -0.17±0.050 65.0 -2.10 -0.52 0.023 0.966 5.05±0.304 -0.04±0.036 95.0 -15.34 -0.09 0.037 1.548 6.65±0.487 0.22±0.074 85.0 4.46 0.27 0.059 2.472 9.73±0.482 0.61±0.068 100 2.15 0.47 0.095 3.966 13.34±1.230 1.11±0.164 100 1.93 0.53 0.152 6.334 14.27±1.337 1.26±0.179 95.0 2.72 0.38 0.244 10.142 13.65±2.325 1.17±0.331 95.0 4.88 0.22 0.390 16.225 13.44±2.009 1.14±0.271 95.0 7.87 0.13 0.624 25.957 13.55±1.544 1.14±0.231 85.0 12.60 0.08 0.999 41.534 14.32±2.502 1.23±0.352 90.0 19.49 0.06
1Means based on 20 shrimp ± standard deviation. 2Feed conversion ratio = dry weight feed (wet weight gain)-1. 3Feed efficiency ratio = wet weight gain (dry weight feed)-1. 4Measured at 28 days.

47Table 12. Growth and survival estimates of L. vannamei fed incremental levels of a 25% crude protein, 15.89 kJ g-1 diet over 49 days.1
Daily Feeding Rate Protein
(g DP shrimp-
1)
Energy (kJ DE shrimp-
1)
Final Mean Weight
(g)
Grams Week
Survival (%)
FCR2
FER3
0.000 0.000 4.31±0.2794 -0.29±0.0404 N/A 0 0 0.010 0.615 4.54±0.375 -0.14±0.050 80.0 -2.70 -0.43 0.015 0.974 5.57±0.366 -0.01±0.052 100 29.18 -0.01 0.024 1.564 7.11±0.408 0.25±0.053 90.0 3.38 0.31 0.039 2.497 9.91±0.694 0.64±0.107 90.0 2.11 0.49 0.063 4.008 12.10±1.434 0.94±0.208 95.0 2.35 0.45 0.100 6.401 13.06±2.530 1.08±0.366 100 3.49 0.32 0.160 10.250 12.45±1.742 1.01±0.245 95.0 5.63 0.19 0.256 16.397 13.84±2.801 1.19±0.393 100 7.99 0.14 0.409 26.233 12.67±1.856 1.03±0.261 90.0 15.26 0.07 0.655 41.978 13.17±2.763 1.10±0.385 90.0 22.69 0.05
1Means based on 20 shrimp ± standard deviation. 2Feed conversion ratio = dry weight feed (wet weight gain)-1. 3Feed efficiency ratio = wet weight gain (dry weight feed)-1. 4Measured at 28 days.

48
Apparent daily digestible protein requirements for growth and maintenance
Daily digestible protein (DP) requirements for shrimp fed increasing feed rates of
the 25% crude protein diet produced linear increases in weight gain up to 0.065 g DP
shrimp-1 day-1 for a 11.28 g shrimp to 0.069 g DP shrimp-1 day-1 for a 7.69 g shrimp
(Table 13). Regression equations for the linear growth portion could best be described
by the following equations, where y = growth response and x = feed rate in g DP: y = -
1.246 + 97.885x (R2 = 0.992) and y = -0.350 + 33.504x (R2 = 0.989) for the 11.28 and
7.69 g shrimp, respectively. Maintenance DP requirements were between 0.009 g DP
shrimp-1 day-1 for a 7.69 g shrimp to 0.014 g DP shrimp-1 day-1 for a 13.08-g shrimp and
were determined by regressing DP feed rate back to zero weight gain.
Table 13. Weekly apparent protein requirements (g DP shrimp-1 day-1) for maximum growth and maintenance of L. vannamei fed a 25% crude protein, 15.89 kJ g-1 diet obtained by regressing weight gain onto provided protein (g-DP protein shrimp-1 day-1).
Protein Requirement (g DP Shrimp-1 Day-1) No. of Weeks Max. Wt. Gain Maintenance
Mean Max. Wt. Shrimp (g)
2 0.069 0.009 7.69 3 0.067 0.009 9.07 4 0.066 0.010 10.23 5 0.065 0.012 11.28 6 0.067 0.012 12.36 7 0.066 0.014 13.08
Mean1 0.067±0.001 0.011±0.002 1Mean protein requirements ± standard deviation.
Shrimp responded to increased feed rates by decreasing their percent body ash
and moisture content while increasing protein content until the feed rate reached 0.063 g
DP shrimp-1 day-1 (Table 14). Increases in feed rate above this level had minimal effect

49
on the rates of change for these body composition components. This plateau in body
protein allowed daily DP requirements for a 13.08-g shrimp to be estimated by
regressing net changes in body protein with increases in DP feeding rates (Table 15).
Net changes in body protein increased linearly (R2 = 0.971) with increased DP feed rates
up to 0.066 g DP shrimp-1 day-1 and could best be described by the linear equation: y =
0.027 + 31.559x, where y = net change in body protein and x = feed rate in g DP.
Maintenance DP requirements were estimated at 0.014 g DP shrimp-1 day-1 for an 13.08-
g shrimp by regressing DP feed rate back to zero weight gain.
Daily DP requirements for shrimp fed increasing quantities of the 35% protein
diet were numerically higher than shrimp fed the 25% protein diet for the duration of the
trial. Daily DP requirements for shrimp fed the 35% protein diet were between 0.083 g
DP shrimp-1 day-1 for an 8.11-g shrimp to 0.098 g DP shrimp-1 day-1 for an 13.79 g
shrimp with the linear growth portion best described by the following equations, where y
= growth response and x = feed rate in g DP: y = -0.715 + 36.512x (R2 = 0.984) and y =
-2.736 + 101.979 (R2 = 0.990); respectively (Table 16). Regressing DP feed rates back
to zero weight gain produced maintenance DP requirements between 0.017 g DP shrimp-
1 day-1 for an 8.11-g shrimp to 0.024 g DP shrimp-1 day-1 for an 13.79-g shrimp which
were higher than values obtained for shrimp fed the 25% protein diet.

50Table 14. Body composition of L. vannamei fed incremental levels of a 25% crude protein, 15.89 kJ g-1 diet over 49 days.1
Daily Feeding Rate Protein
(g DP shrimp-1) Energy
(kJ DE shrimp-1)
Dry Matter (g shrimp-1)
Energy
(kJ shrimp-1)2
Protein
(g shrimp-1)2
Ash
(g shrimp-1)2 0.000 0.00 0.613±0.0703 9.752±1.2303 0.416±0.0623 0.129±0.0133 0.010 0.615 0.675±0.110 11.413±1.820 0.475±0.082 0.134±0.022 0.015 0.974 1.041±0.096 18.388±1.876 0.789±0.080 0.163±0.011 0.024 1.564 1.539±0.117 28.208±2.476 1.202±0.108 0.223±0.010 0.039 2.497 2.280±0.144 43.484±2.928 1.813±0.123 0.296±0.031 0.063 4.008 2.935±0.334 57.182±6.656 2.343±0.249 0.366±0.054 0.100 6.401 3.254±0.634 63.500±12.899 2.569±0.508 0.378±0.056 0.160 10.250 3.126±0.501 61.847±10.853 2.495±0.411 0.344±0.049 0.256 16.397 3.448±0.658 67.136±12.355 2.738±0.508 0.424±0.093 0.409 26.233 3.196±0.571 63249±11.945 2.557±0.462 0.355±0.061 0.655 41.978 3.234±0.628 63.877±12.568 2.585±0.507 0.398±0.105
Initial 1.329±0.122 25.451±2.489 0.957±0.071 0.160±0.019 1Means of 20 shrimp ± standard deviation. 2Results expressed on a dry-matter basis. 3Results based on 28 days of starvation.

51
Table 15. Apparent protein requirement (DP shrimp-1 day-1) for maximum growth and maintenance of L. vannamei fed a 25% crude protein, 15.89 kJ g-1 diet obtained by regressing change in body protein onto provided protein (g-DP protein shrimp-1 day-1).
Protein Requirement (g DP Shrimp-1 Day-1) No. of Weeks Max. Wt. Gain Maintenance
Mean Max. Wt. Shrimp (g)
7 0.066 0.014 13.08 Table 16. Weekly apparent protein requirements (g DP shrimp-1 day-1) for maximum growth and maintenance of L. vannamei fed a 35% crude protein, 15.48 kJ g-1 diet obtained by regressing weight gain onto provided protein (g-DP protein shrimp-1 day-1).
Protein Requirement (g DP Shrimp-1 Day-1) No. of Weeks Max. Wt. Gain Maintenance
Mean Max. Wt. Shrimp (g)
2 0.083 0.017 8.11 3 0.083 0.021 9.60 4 0.086 0.021 10.92 5 0.095 0.021 12.08 6 0.096 0.023 13.01 7 0.098 0.024 13.79
Mean1 0.090±0.007 0.021±0.002 1Mean protein requirements ± standard deviation.
As feed rate increased from 0.015 to 0.095 g DP shrimp-1 day-1 shrimp responded
by decreasing their percent body moisture and ash while increasing percent protein
(Table 17). Shrimp fed more than 0.095 g DP shrimp-1 day-1 had minimal increases in
percent ash, moisture and protein which allowed changes in net body protein to be
regressed with increases in DP feeding rates to estimate daily DP requirements for the
13.79 g shrimp (Table 18). Increased DP feed rates produced linear (R2 = 0.995)
increases in body protein up to 0.098 g DP shrimp-1 day-1 and could best be described by
the linear equation: y = 0.083 + 24.729x, where y = net change in body protein and x =
feed rate in g DP. Maintenance DP requirements were estimated at 0.030 g DP shrimp-1

52
day-1 for the 13.79-g shrimp by regressing DP feed rate back to zero weight gain.
Apparent daily digestible energy requirements for growth and maintenance
Daily DE requirements for shrimp fed at increasing rates with the 25% crude
protein diet produced linear increases in weight gain up to 4.171 kJ DE shrimp-1 day-1
for a 11.28-g shrimp, to 4.422 kJ DE shrimp-1 day-1 for a 7.69-g shrimp (Table 19).
Linear growth portions can best be described by the following regression equations,
where y = growth response and x = feed rate in kJ DE: y = -1.246 + 6386.905x (R2=
0.992) and y = -0.350 + 2186.113x (R2 = 0.989) for the 11.28 and 7.96 g shrimp,
respectively. Regressing DE feed rate back to zero weight gain resulted in maintenance
DE requirements between 0.564 kJ DE shrimp-1 day-1 for an 9.07-g shrimp to 0.887 kJ
DE shrimp-1 day-1 for an 13.08-g shrimp.
Shrimp which were fed increasing quantities of feed experienced a decrease in
percent body moisture and ash and an increase in energy (kJ g-1) until the feed rate
reached 4.008 kJ DE shrimp-1 day-1 (Table 14). Feed rates above 4.008 kJ DE shrimp-1
day-1 had a minimal effect on body energy which allowed changes in net body energy to
be regressed with increases in DE feeding rates to estimate daily DE requirements for
the 13.08-g shrimp (Table 20). Increased DE feed rates produced linear (R2 = 0.971)
increases in body energy up to 4.330 kJ DE shrimp-1 day-1 and could best be described
by the linear equation: y = 1383.568 + 12152.384x, where y = net change in body energy
and x = feed rate in kJ DE. Maintenance DE requirements were estimated at 0.891 kJ
DE shrimp-1 day-1 for the 13.08-g shrimp by regressing DE feed rate back to zero weight
gain.
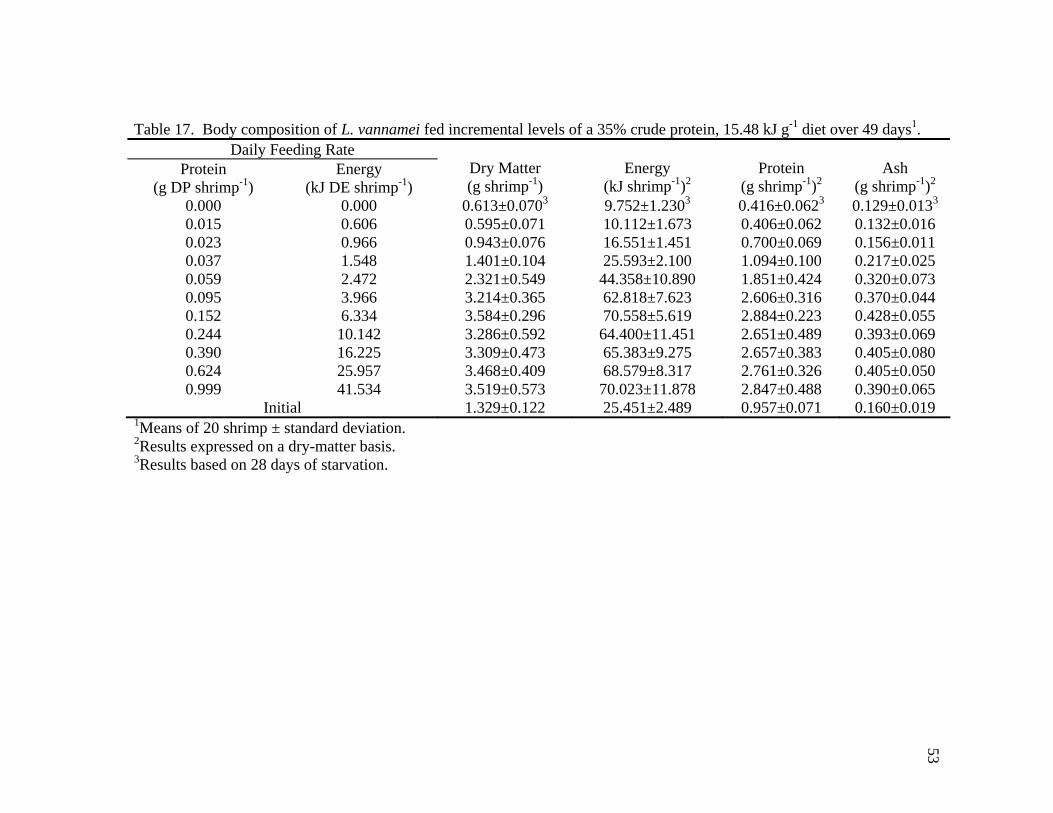
53Table 17. Body composition of L. vannamei fed incremental levels of a 35% crude protein, 15.48 kJ g-1 diet over 49 days1. Daily Feeding Rate
Protein (g DP shrimp-1)
Energy (kJ DE shrimp-1)
Dry Matter (g shrimp-1)
Energy
(kJ shrimp-1)2
Protein
(g shrimp-1)2
Ash
(g shrimp-1)2 0.000 0.000 0.613±0.0703 9.752±1.2303 0.416±0.0623 0.129±0.0133 0.015 0.606 0.595±0.071 10.112±1.673 0.406±0.062 0.132±0.016 0.023 0.966 0.943±0.076 16.551±1.451 0.700±0.069 0.156±0.011 0.037 1.548 1.401±0.104 25.593±2.100 1.094±0.100 0.217±0.025 0.059 2.472 2.321±0.549 44.358±10.890 1.851±0.424 0.320±0.073 0.095 3.966 3.214±0.365 62.818±7.623 2.606±0.316 0.370±0.044 0.152 6.334 3.584±0.296 70.558±5.619 2.884±0.223 0.428±0.055 0.244 10.142 3.286±0.592 64.400±11.451 2.651±0.489 0.393±0.069 0.390 16.225 3.309±0.473 65.383±9.275 2.657±0.383 0.405±0.080 0.624 25.957 3.468±0.409 68.579±8.317 2.761±0.326 0.405±0.050 0.999 41.534 3.519±0.573 70.023±11.878 2.847±0.488 0.390±0.065
Initial 1.329±0.122 25.451±2.489 0.957±0.071 0.160±0.019 1Means of 20 shrimp ± standard deviation. 2Results expressed on a dry-matter basis. 3Results based on 28 days of starvation.

54
Table 18. Apparent protein requirement (g DP shrimp-1 day-1) for maximum growth and maintenance of L. vannamei fed a 35% crude protein, 15.48 kJ g-1 diet obtained by regressing change in body protein onto provided protein (g-DP protein shrimp-1 day-1).
Protein Requirement (g DP Shrimp-1 Day-1) No. of Weeks Max. Wt. Gain Maintenance
Mean Max. Wt. Shrimp (g)
7 0.098 0.030 13.79 Table 19. Weekly apparent energy requirements (kJ DE shrimp-1 day-1) for maximum growth and maintenance of L. vannamei fed a 25% crude protein, 15.89 kJ g-1 diet obtained by regressing weight gain onto provided energy (kJ shrimp-1 day-1).
Energy Requirement (kJ DE Shrimp-1 Day-1) No. of Weeks Max. Wt. Gain Maintenance
Mean Max. Wt. Shrimp (g)
2 4.426 0.606 7.69 3 4.276 0.564 9.07 4 4.250 0.644 10.23 5 4.171 0.736 11.28 6 4.292 0.782 12.36 7 4.238 0.887 13.08
Mean1 4.275±0.083 0.703±0.121 1Mean energy requirements ± standard deviation. Table 20. Apparent energy requirement (DE shrimp-1 day-1) for maximum growth and maintenance of L. vannamei fed a 25% crude protein, 15.89 kJ g-1 diet obtained by regressing change in body energy onto provided energy (kJ DE shrimp-1 day-1).
Energy Requirement (kJ DE Shrimp-1 Day-1) No. of Weeks Max. Wt. Gain Maintenance
Mean Max. Wt. Shrimp (g)
7 4.330 0.891 13.08 Daily DE requirements for shrimp fed the 35% protein diet were between 3.460
kJ DE shrimp-1 day-1 for an 9.60-g shrimp to 4.091 kJ DE shrimp-1 day-1 for an 13.79-g
shrimp with the linear growth portion best described by the following equations, where y
= growth response and x = feed rate in kJ DE: -1.367 + 6036.066x (R2 = 0.989) and y = -
2.736 + 10260.754x (R2 = 0.990); respectively (Table 21). Regressing DE feed intake

55
back to zero weight gain produced maintenance DE requirements between 0.740 kJ DE
shrimp-1 day-1 for an 8.11-g shrimp to 1.012 kJ DE shrimp-1 day-1 for an 13.79-g shrimp
which were higher than values obtained for the shrimp fed the 25% protein diet.
Table 21. Weekly apparent energy requirements (kJ DE shrimp-1 day-1) for maximum growth and maintenance of L. vannamei fed a 35% crude protein, 15.48 kJ g-1 diet obtained by regressing weight gain onto provided energy (kJ shrimp-1 day-1).
Energy Requirement (kJ DE Shrimp-1 Day-1) No. of Weeks Max. Wt. Gain Maintenance
Mean Max. Wt. Shrimp (g)
2 3.476 0.740 8.11 3 3.460 0.861 9.60 4 3.581 0.878 10.92 5 3.974 0.882 12.08 6 4.012 0.945 13.01 7 4.091 1.012 13.79
Mean1 3.765±0.288 0.886±0.092 1Mean energy requirements ± standard deviation.
Percent body ash and moisture content decreased while energy content (kJ g-1)
increased as feed rate increased to 3.966 kJ DE shrimp-1 day-1 (Table 17). Feed rates
between 3.966 kJ DE shrimp-1 day-1 and 41.534 kJ DE shrimp-1 day-1 only had a minimal
effect on body energy which allowed daily DE requirements to be estimated for the
13.79-g shrimp by regressing net changes in body energy with increases in DE feeding
rates (Table 22). Net changes in body energy increased linearly (R2 = 0.995) with
increased DE feed rates up to 4.167 kJ DE shrimp-1 day-1 and could best be described by
the linear equation: y = 918.932 + 13323.856x, where y = net body change in energy and
x = feed rate in kJ DE. Maintenance DE requirements were estimated at 1.096 kJ DE

56
shrimp-1 day-1 for the 13.79 g shrimp by regressing DE feed rate back to zero weight
gain.
Table 22. Apparent energy requirement (kJ DE shrimp-1 day-1) for maximum growth and maintenance of L. vannamei fed a 35% crude protein, 15.48 kJ g-1 diet obtained by regressing change in body energy onto provided energy (kJ DE shrimp-1 day-1).
Energy Requirement (kJ DE Shrimp-1 Day-1) No. of Weeks Max. Wt. Gain Maintenance
Mean Max. Wt. Shrimp (g)
7 4.167 1.096 13.79 Discussion
Starvation trial
Water quality
To assure these inorganic compounds do no interfere with the experiment,
ammonia-N should be maintained below 2.37 mg L-1 (0.09 mg L-1 for NH sub(3)-N
(Chen and Lin 1991), nitrite levels below 2.04 mg L-1 (Chen and Lin, 1991) and nitrate
should be below 25 mg L-1 (Chen and Lei, 1990). Values obtained during the
experiment were well below these recommendations which suggest shrimp were
maintained under optimal water quality parameters for the duration of the 4-week trial.
Allometric equations for whole-body composition
The absolute energy, protein, ash and dry matter content of shrimp increased in a
linear fashion with growth (5.51 to 16.59 g) (equations 1, 2, 3 and 4, respectively), while
only protein content (g 100 g-1 live weight) increased linearly (equation 5) with growth
on a wet-weight basis. While no studies exist for shrimp, allometric equations
determined for carp (Pfeffer and Potthast, 1977), trout (Pfeffer and Potthast, 1977) and

57
gilthead seabream (Lupatsch et al., 1998) suggest protein content per kg live weight does
not change significantly with fish size, while lipid content increases. Shrimp have a
limited ability to store lipid outside their hepatopancreas while fish and higher animals
have the ability to deposit lipid stores in various tissues as they reach maturity. This
physiological difference may explain why a linear increase in protein deposition
(equation 5) was witnessed as shrimp growth increased; however, it is not currently
known what effect sexual maturity may have on the linearity of the protein increase
relative to body composition.
Allometric equations for daily protein and energy loss
The relationship between energy changes and body weight (equation 6) for L.
vannamei maintained at 30oC could best be described when shrimp body weight was
raised to the power 0.87 (equation 8). No studies involving shrimp have utilized energy
loss during starvation to determine the exponent b of metabolic body weight (a x
BW(g)b) which is proportional to the maintenance requirement for energy; however
metabolic-body weight relationships are commonly determined for fish (Cui and Liu,
1990; Cho 1992; Lupatsch et al., 1998; Lupatsch et al., 2003). The exponent most
commonly referenced in fish studies is 0.80 (Brett and Groves, 1979); however values
range from 0.824 in trout (Cho 1992) to 0.86 in African catfish (Hogendoorn, 1983).
The value obtained for shrimp in this study (0.87) is close to the values obtained by Cui
and Liu (1990) for 6 different teleost species (0.855) and by Hogendoorn (1983) for
African catfish (0.86); however, the daily energy loss during starvation for L. vannamei
was approximately six times greater when compared to African catfish when referring to

58
a common metabolic weight of (kg)0.86. This high energy loss may be attributed to the
energetic inefficiency of utilizing body protein as energy, opposed to lipid reserves in
fish, the loss of energy (~1.4 kJ per cast; Read and Caulton, 1980) attributed to the
export of the cast during the molt cycle as well as from ejection of an peritrophic
membrane by unfed shrimp (unpublished data, in Cordova-Murueta et al., 2003). These
physiological differences may help explain why L. vannamei is unable to survive
starvation periods greater than 28 days while studies utilizing catfish typically withhold
feeding for periods of 56 days without significant mortality (Gatlin et al., 1986).
The relationship between protein changes and body weight (equation 7) for L.
vannamei maintained at 30oC could best be described when shrimp body weight was
raised to the power 0.92 (equation 9). While few studies have been undertaken to
determine this value in fish (Beck, 1987; Lupatsch et al., 1998) no studies exist for
shrimp. The values commonly reported for fish are between 0.70 for gilthead seabream
(Lupatsch et al., 1998) to 0.739 for trout (Beck, 1987) while the value obtained in this
study suggests shrimp have a higher metabolic body weight for protein which may be
attributed to their limited ability to store lipid and carbohydrate. The difference between
the exponents for protein and energy loss in shrimp (0.92, 0.87; respectively) are closer
than those obtained in most fish studies (0.70, 0.80; respectively) which further suggests
proteins importance to supply the energy requirements to a starving shrimp.

59
Preliminary evaluation of experimental diets
Water quality
Values of pertinent water quality characteristics obtained during the experiment
were well within acceptable levels which suggest shrimp were maintained under optimal
water quality parameters for the duration of the 6-week trial.
Growth and survival of L. vannamei fed preliminary diets
The lack of a significant difference between the 25 and 35% crude protein diets
and the commercial diets suggests the diets may be used in the requirement study
described below to provide estimates for daily protein and energy requirements which
are applicable to commercial feeds under the same experimental conditions. Similarly,
the lack of a significant growth effect when the 25 and 35% diets were adjusted for
magnesium, vitamins, minerals, vitamin C, calcium and phosphorus suggests these
nutrients are neither limiting or in excess to a point which would affect growth and the
determination of daily requirements. While the significant difference in growth matrices
between the A.L.L. reference diet and the commercial diets precluded its use in the
requirement study, this diet was selected for use in the digestibility trials due to its
proven performance and high attractibility.
Growth and survival trial
Water quality
Values of pertinent water quality characteristics obtained during this experiment
also were well within acceptable levels suggesting shrimp were maintained under
optimal water quality parameters for the duration of the 7-week trial.

60
Apparent consumption
It has been suggested that digestible energy content is a major factor which
controls feed intake in fish (Page and Andrews, 1973; Boonyaratpalin 1978; Wilson et
al., 1985; Gatlin et al, 1986; Boujard and Medale 1994; Kentouri et al., 1995; Paspatis
and Boujard, 1996; Lupatsch et al., 1998; Lupatsch et al., 2001) as well as shrimp (Davis
et al., 1995). Similar apparent consumption between the 25 and 35% protein diets (0.32
and 0.31 g-feed day-1 shrimp-1; Figures 1 and 2, respectively) appears to suggest L.
vannamei regulates their feed intake to meet an energy requirement as opposed to a
protein requirement originally suggested by Kureshy and Davis (2002). This apparent
ability to consume a diet to meet an energy requirement may explain the conflicting
results in ad-libitum feeding studies which attempted to determine an optimum protein
requirement (as well as other dietary components) for L. vannamei as well as other
species of shrimp. Ad-libitum requirement studies which utilized diets low in digestible
energy would be consumed at a greater level than those diets with higher levels of
digestible energy leading to different apparent dietary requirements. Since few, if any,
of these requirement studies cited dietary digestible energy content or measured dietary
consumption there exists the possibility that many nutrient requirement studies may need
to be reevaluated to determine their accuracy.
Ad-libitum studies which cite dietary digestible energy also need to be aware
there is the potential for a reduction in feed intake by dietary constituents other than
energy. Page and Andrews (1973) witnessed a reduced feeding rate in channel catfish
which were fed diets with increasing fiber levels while Bromley and Adkins (1984)
61
witnessed a similar reduction in feed intake in rainbow trout fed diets containing over
30% cellulose. These findings suggest an organism can only increase feed intake until
they reach a gut/digestive capacity at which point they can no longer increase intake to
compensate for a lower energy diet. Ad-libitum feeding studies utilizing L. vannamei
suggest dietary levels of ash and fiber can be increased to 25 and 15 %, respectively,
without a significant reduction in growth; however, growth was significantly reduced in
a study involving 45.4% dietary ash (unpublished results, Texas A&M Shrimp
Mariculture Facility). Until the ability to easily determine apparent consumption has
been perfected, dietary studies involving L. vannamei should report dietary digestible
energy as well as utilize factorial modeling to determine an apparent consumption to
allow more uniform comparisons between different research efforts.
Conversion efficiencies
Protein conversion efficiency for maximum growth was more efficient in the
25% protein diet (35.9%; Table 9) as opposed to the 35% protein diet (30.6%; Table 10);
however, growth was lower in the lower-protein diet. This suggests shrimp which
consumed the 25% protein diet lacked an adequate amount of ingested protein to
produce the same growth rate as observed in the 35% protein diet but were able to
efficiently utilize the available protein for growth, as opposed to energy, better than the
shrimp fed the 35% protein diet. The partitioning of protein between growth and energy
also can be examined through a comparison of the energy conversion efficiencies.
Shrimp which consumed the 35% protein diet had a higher energy conversion efficiency
(15.5%) as compared to those which consumed the 25% protein diet (12.6%). This

62
further suggests the 35% protein diet was over-formulated in protein (i.e. limiting in
non-protein energy) while the 25% protein diet was limited in protein due to an excess of
non-protein energy. These findings also strengthen the argument L. vannamei eats to
meet an energy requirement as the apparent consumption rate was ~10% of the dietary
ration offered to the shrimp fed the highest feed ration. Based on the results from this
study, it appears that to optimize protein utilization for growth, the digestible energy
level of the 25% protein diet needs to be lowered to increase dietary intake or the
digestible protein level in the 35% protein diet needs to be lowered while maintaining
DE. The high level of ash (22%) and fiber (10%) already contained in these diets may
reduce one’s success in lowering dietary energy enough to increase consumption before
the gut capacity of the shrimp is exceeded. Therefore it seems prudent to attempt to
reduce the protein level in the 35% diet to reach an ideal protein/energy ratio where
protein is maximally utilized for growth as opposed to energy.
The ability to optimize this ratio will depend greatly on the nutritional
physiology of L. vannamei as previous studies have suggested L. vannamei, like other
crustacea, prefers to utilize protein as an energy source even in the presence of adequate
dietary non-protein energy (Scheer and Scheer 1951; Scheer et al., 1952; Huggins and
Munday 1968; Lee and Lawrence 1997). These conclusions; however, are typically
based on differences in weight gain, FCR and FER measurements for L. vannamei fed
varying levels of protein without any reference to protein and energy conversion
efficiencies. While this study clearly showed ingested protein was more efficiently
utilized for growth for the 25% protein diet, better FCR and FER values were obtained

63
for the shrimp fed the 35% protein diet (Tables 12 and 11, respectively). This apparent
anomaly occurs because shrimp are eating to meet an energy level and therefore can’t
ingest enough of the 25% protein diet to maximize their protein intake for growth while
those which consume the 35% protein diet ingest excess protein which allows for
maximum growth, increasing FCR and FER, but is also utilized for energy, reducing
protein conversion efficiency. While L. vannamei can utilize dietary protein to meet
energy requirements, it appears excess dietary protein is utilized not protein needed for
growth. Studies which fail to take into account relative protein and energy efficiencies,
dietary digestible protein and energy, as well as the fact shrimp may eat to an energy
requirement, will conclude higher protein content is necessary to maximize growth, FCR
and FER. When all factors are taken into close consideration it becomes readily
apparent that optimization of the protein to energy ratio is necessary to reduce costs and
nitrogenous waste through utilization of protein for growth as opposed to energy.
Apparent daily digestible protein requirements for maximum growth and maintenance
The mean apparent daily digestible protein requirement for 7.69 to 13.08 g L.
vannamei fed the 25% protein diet was 0.067 g DP shrimp-1 day-1 (6.31 g DP kg-1 BW d-
1) while the 35% protein diet produced a mean apparent digestible protein requirement of
0.090 g DP shrimp-1 day-1 (8.00 g DP kg-1 BW d-1) for 8.11 to 13.79 g L. vannamei. The
difference in apparent protein requirement for maximum growth may be explained by
the utilization of protein for energy in the 35% protein diet which produced an elevated
apparent requirement due to the high metabolic cost to convert protein to energy.

64
Cuzon et al. (2004) recommended a daily intake of 1.2 g digestible protein for an
L. vannamei biomass of 100 g shrimp (12 g DP kg-1 BW d-1) fed a diet with a P/E ratio
of 23 mg DP per kJ DE. This recommended DP feeding rate is approximately 47 and
33% greater than the daily DP values recommended in this study obtained from the 25
and 35% protein diets, respectively. Kureshy and Davis (2002) suggested 23.5 g CP kg-1
BW d-1 (17.88 g DP kg-1 BW d-1) of a 32% protein diet and 20.5 g CP kg-1 BW d-1
(15.39 g DP kg-1 BW d-1) of a 48% protein diet was necessary to produce maximum
growth of L. vannamei subadults. These apparent DP requirements are approximately
64 and 59% higher than the apparent DP requirement obtained for the 25% protein diet
and approximately 55 and 48% higher than the values obtained for the 35% protein diet
utilized in this study. This large apparent difference can be attributed to the significant
difference in feeding rates obtained between the two trials. Kureshy and Davis (2002)
reported a CP requirement which corresponded to a feeding rate of ~7% body weight
while the apparent feeding rates obtained in this study corresponded to ~2.5% body
weight. The difference in apparent protein requirement between the two studies may
also be attributed to shrimp in the current study were individually held and fed 15 times
per day while Kureshy and Davis (2002) placed eight shrimp per tank and fed them four
feedings per day. Lawrence et al. (unpublished results) determined feed utilization
increased when ingestion rate, feeding frequency and daily ration size increased
suggesting differences in nutrient requirements may be achieved depending on how feed
is introduced to subadult L. vannamei. Arayankanada (1995) also suggested feeding
frequency could affect nutrient requirements and concluded the low (15%) dietary

65
protein requirement obtained in his study could be attributed to higher feeding frequency
(15 feedings per day). Furthermore, Kuresy and Davis (2002) adjusted the feeding rates
after 2 weeks according to the biomass of each tank while the shrimp in the current study
received a set amount of feed per day throughout the trial. Adjustment of the feeding
rates 2 weeks prior to termination may have prevented shrimp from obtaining a weight
consistent with available nutrients as it is unlikely, especially at the lowest feeding
ration, that each shrimp obtained the same quantity of feed and grew at the same rate.
Shrimp in the current study grew linearly (R2 = 0.992 and R2= 0.986, for shrimp fed the
25 and 35% protein diets, respectively) over the course of the experiment which suggests
they reached an apparent growth equilibrium with the provided nutrients until maximum
growth was achieved.
While it is common to see variations in apparent requirements, the previous values
reported for L. vannamei appear elevated especially when one considers Teshima et al.
(2001) reported a protein requirement of 10 g per kg-1 BW d-1 to maintain maximum
body protein retention in Marsupenaeus japonicus. M. japonicus is generally considered
a shrimp species which requires more dietary protein than other shrimp species
(Kanazawa, 1990). Dietary protein requirements for M. japonicus have been reported as
high as 57% (Deshimaru and Yone, 1978), while the highest protein requirement
reported for the more herbivorous L. vannamei was 40% (Colvin and Brand, 1977).
Based solely on the feeding habit of L. vannamei one would expect the daily DP
requirement (6.31 – 8.00 g DP kg-1 BW d-1) to be lower than those obtained for the
carnivorous M. japonicus (10 g DP kg-1 BW d-1) which suggests the values obtained in

66
the current study may be closer to the true apparent requirement than those previously
reported. Daily DP requirements obtained in this study are also in agreement with
studies involving omnivorous fish. Gatlin et al. (1986) determined the protein
requirement for maximum weight gain was 8.75 g DP kg-1 BW d-1 for channel catfish
fed incremental feeding rates ranging from 0% to 5% body weight per day.
The apparent digestible protein requirement for maximum growth decreased
throughout the 7 week trial from 8.97 g DP kg-1 BW d-1 at week 2 for 7.69 g shrimp to
5.04 g DP kg-1 BW d-1 at week 7 for 13.08 g shrimp fed the 25% protein diet. A similar
reduction was witnessed for those shrimp which consumed the 35% protein diet as the
apparent protein requirement decreased from 10.24 g DP kg-1 BW d-1 at week 2 for 8.11
g shrimp to 7.11 g DP kg-1 BW d-1 at week 7 for 13.79 g shrimp. Reduced protein
requirements with age have been reported for L. vannamei (Colvin and Brand 1977;
Akiyama et al., 1992; Pedrazzoli et al., 1998), P. californiensis (Colvin and Brand,
1977), L. setiferus (Garcia-Carreno 1998), P. monodon (Chen, 1998) and fish (Lupatsch
et al., 1998). The reduction in apparent protein requirement has been attributed to a
reduction in growth potential as shrimp get larger; however, maximum weekly growth
throughout the 7 week trial was linear. This suggests the reduced apparent protein
requirement may be partially explained by a reduction in protein digestibility as L.
vannamei grows older (Table on p. 83). This reduction in apparent protein digestibility
(Table on p. 83) combined with constant energy digestibility (Table on p. 83) suggests
their ability to utilize carbohydrates and lipids as energy, as opposed to dietary protein,
increases with age which may contribute to the reduction in apparent protein

67
requirement witnessed in this study. This reduction in apparent protein requirement
ultimately will affect the digestible crude protein to digestible energy ratio and may need
to be considered when formulating diets for “older” L. vannamei.
While Cuzon et al. (2004) reported that protein requirement was probably not as
highly correlated to protein accretion as in vertebrates due to chitin synthesis, results
from this study suggest the opposite. Daily digestible protein requirements for
maximum growth for the 13.08 g shrimp fed the 25% protein diet obtained from growth
and body compositional analysis were 0.066 g DP shrimp-1 day-1 and 0.066 g DP shrimp-
1 day-1, respectively. A perfect correlation between apparent daily digestible protein
requirements was also obtained from growth and body compositional analysis (0.098 g
DP shrimp-1 day-1 and 0.098 g DP shrimp-1 day-1, respectively) for the 13.79 g shrimp
fed the 35% protein diet. These results suggests daily digestible protein requirements for
maximum growth can be estimated from the body compositional analysis of L. vannamei
fed graded levels of feed and provide an important conformational metric when
assessing apparent requirements.
The mean apparent daily digestible protein requirement for maintenance was 0.11 g
DP shrimp-1 day-1 (1.03 g DP kg-1 BW d-1) for 7.69 – 13.08 g L. vannamei fed the 25%
protein diet and 0.021 g DP shrimp-1 day-1 (1.87 g DP kg-1 BW d-1) for 8.11 – 13.79 g L.
vannamei which consumed the 35% protein diet. The difference in apparent
maintenance requirement between the two diets may be explained by the utilization of
protein for energy in the 35% diet and by the higher growth rate achieved by L.
vannamei which consumed the 35% protein diet. These factors will increase the

68
apparent requirement as there is a high metabolic cost to convert protein to energy
(deamination of protein to be utilized as energy is energetically costly) and maintenance
requirements for protein increase with increased shrimp weight.
The values obtained in this study are similar to apparent digestible protein
maintenance requirements obtained by Kuresy and Davis (2002). Kuresy and Davis
(2002) obtained daily CP maintenance values between 1.5 – 2.1 g CP / kg-1 BW d-1 for
subadult L. vannamei fed either 0.4, 0.6, 0.8, 1.0, 1.4, 1.8, 2.6 and 3.2 g of a 16% crude
protein diet per shrimp per week or 0.4, 0.55, 0.7, 0.85, 1.0, 1.3, 1.6, and 1.9 g of a 32%
crude protein diet per shrimp per week. The consistency between the results in the
current study and those obtained by Kuresy and Davis (2002) for apparent maintenance
requirement, but not apparent DP requirement for maximum growth, further strengthen
the theory feeding level should not be adjusted based on a change in biomass but kept
constant throughout the study by feeding a set level of diet per shrimp per day. It is not
clear why Kureshy and Davis (2002) utilized two different experiments with two
different feeding strategies to obtain apparent maintenance (g diet per shrimp per week)
and apparent maximum weight gain (% diet per biomass adjusted biweekly)
requirements as both values can be obtained from a single study. In one of the only
other studies to determine an apparent DP maintenance requirement for shrimp, Teshima
et al (2001) determined the apparent maintenance protein requirement was 1.09 g DP kg-
1 BW d-1 for M. japonicus which is slightly higher than the apparent requirement
obtained from the 25% protein diet but lower than the estimate obtained from the 35%
protein diet. While this might suggest a similar metabolic rate among shrimp, Rosas et

69
al. (2001b) suggested L. setiferus might have a higher metabolic rate than L. vannamei
juveniles based on a two fold increase in routine oxygen consumption and apparent heat
increment of L. setiferus juveniles vs. L. vannamei juveniles. This two fold difference
suggests L. setiferus may have twice the maintenance requirement of L. vannamei;
however, research to determine the daily digestible maintenance requirement for L.
setiferus has not yet been undertaken. Apparent DP maintenance values obtained in this
study are also in agreement with DP maintenance requirements obtained for different
fish species. McGoogan and Gatlin (1998) determined the maintenance DP requirement
for juvenile red drum was 1.5 – 2.5 g DP kg-1 BW d-1, while Gatlin et al. (1986)
determined the maintenance protein requirement was 1.32 g DP kg-1 BW d-1 for channel
catfish. Apparent DP maintenance requirements estimated by regressing protein
accretion back to zero displayed a high degree of correlation to those values obtained
from growth data. Daily digestible protein requirements for maintenance obtained from
growth and body compositional analysis were 0.014 g DP shrimp-1 day-1 and 0.014 g DP
shrimp-1 day-1, respectively for 13.08 g L. vannamei. A high correlation between
apparent daily digestible maintenance protein requirements was also obtained from
growth and body compositional analysis (0.024 g DP shrimp-1 day-1 and 0.030 g DP
shrimp-1 day-1, respectively) for 13.79 g shrimp fed the 35% protein diet. These results
suggests daily digestible maintenance requirements can be estimated from body
compositional analysis of L. vannamei fed graded levels of feed which helps to validate
the results obtained from growth data.

70
Apparent daily digestible energy requirements for maximum growth and maintenance
Shrimp derive energy through the catabolism of feed and utilize the energy for
maintenance, growth, reproduction and physical activity. Energy requirements have
been estimated for fish since Ege and Krogh (1914) applied the principles of
bioenergetics to fish; however, few studies have focused on daily digestible energy
requirements in shrimp (Cuzon et al., 2004). In this study the mean apparent daily
digestible energy requirement for 7.69 to 13.08 g L. vannamei fed the 25% protein diet
was 4.275 kJ DE shrimp-1 day-1 (402.62 kJ DE kg-1 BW d-1) while the 35% protein diet
produced an apparent daily digestible energy requirement of 3.765 kJ DE shrimp-1 day-1
(334.72 kJ DE kg-1 BW d-1) for 8.11 to 13.79 g L. vannamei. The lower apparent energy
requirement for L. vannamei fed the 35% protein diet may by attributed to the lower
efficiency of utilizing protein for energy. Rosas et al. (2002) determined that while L.
vannamei are well adapted to live without starch, protein utilization as energy produces a
substantial loss of energy through ammonia excretion.
Cuzon et al. (2004) suggested 140 kJ DE a day to be adequate for a biomass of
100 g shrimp which is equivalent to 1400 kJ DE a day for 1 kg shrimp. This
recommended level is 71 and 76% higher than the value obtained in this study even
though the energy retention in his study was higher (20%) than the maximum energy
retention obtained for L. vannamei fed the 25 (~12%) and 35% (~15%) protein diets
utilized in this study. While the reason for the large difference in apparent daily DE
requirements for maximum growth is not known, the values obtained in the current study
are similar to values reported for omnivorous fish while the values reported by Cuzon et

71
al (2004) are closer to values reported for carnivorous fish. Gatlin et al (1986) obtained
an apparent daily DE requirement of 417.35 kJ energy kg-1 BW d-1 for channel catfish
fed either a 25% crude protein (11.92 kJ/g) diet or a 35% crude protein (16.69 kJ/g) diet
which is close to the values obtained in the current study for similarly omnivorous L.
vannamei. McGoogan and Gatlin (1998) reported a DE requirement for maximum
weight gain of 774 – 954 kJ DE kg-1 BW d-1 for the carnivorous red drum (Boothby and
Avault 1971) which is closer, but still lower, than the energy requirement suggested by
Cuzon et al (2004) for L. vannamei.
Apparent daily energy requirements for maximum growth decreased throughout
the 7 week trial as shrimp size increased. Apparent daily DE requirements for maximum
growth at week 2 for 7.69 g shrimp was 574.08 kJ DE kg-1 BW d-1 while the apparent
requirement was only 322.79 kJ DE kg-1 BW d-1 at week 7 for 13.08 g L. vannamei
which consumed the 25% protein diet. Apparent daily DE requirement also decreased
for shrimp fed the 35% protein diet from 428.86 kJ DE kg-1 BW d-1 for 8.11 g L.
vannamei at week 2 to 296.73 kJ DE kg-1 BW d-1 for 13.79 g shrimp at week 7. This
reduction in apparent daily DE requirement may be attributed to L. vannamei’s reduced
apparent protein requirement with age due to a reduction in protein digestibility (Table
on p. 83). A similar decrease in apparent daily energy requirement has not been reported
for shrimp; therefore it is not possible to compare this event to other studies.
Apparent daily DE requirements for maximum weight gain obtained from whole
body energy deposition were in agreement with those values obtained based on
maximum weight gain. Apparent daily DE requirements based on energy deposition

72
was 4.330 kJ DE shrimp-1 day-1 while maximum weight gain produced an apparent
requirement of 4.238 kJ DE shrimp-1 day-1 for 13.08 g L. vannamei fed the 25% protein
diet. A high correlation was also obtained for 13.79 g shrimp which consumed the 35%
protein diet (4.167 kJ DE shrimp-1 day-1 and 4.091 kJ DE shrimp-1 day-1 for energy
deposition and maximum weight gain, respectively). McGoogan and Gatlin (1998)
witnessed a large difference in apparent DE requirement determined by maximum
weight gain and whole body energy gain and attributed the difference to a possible
increase in energy density with lipid deposition. As has been mentioned, shrimp have a
limited ability to store lipid and carbohydrate and therefore do not have the ability to
store excess energy, as lipid or carbohydrate reserves, as growth plateaus. This finding
once again helps to underscore this major physiological difference between fish and
shrimp and may help to explain the high degree of correlation between the apparent
requirements determined from both maximum growth and energy deposition.
Mean apparent daily DE maintenance requirements for 7.69 – 13.08 g L.
vannamei fed the 25% protein diet was 0.702 kJ DE shrimp-1 day-1 (66.232 kJ DE kg-1
BW d-1) while the requirement was 0.887 kJ DE shrimp-1 day-1 (7.698 kJ DE kg-1 BW d-
1) for 8.07 – 13.79 g L. vannamei fed the 35% protein diet. The difference in apparent
maintenance requirements can partially be explained, as described for protein, by the
utilization of protein for energy in the 35% protein diet and by the higher growth rate
achieved by L. vannamei fed the 35% protein diet. There are few, if any, studies which
have reported apparent daily DE requirements for maintenance for any species of
shrimp; however, the values in the current study are in agreement with those values

73
obtained from fish. Gatlin et al. (1986) determined the apparent maintenance
requirement for energy to be between 71.12 – 72.50 kJ energy kg-1 BW d-1 for channel
catfish while McGoogan and Gatlin (1998) reported an apparent daily DE requirement
between 57.99 – 93.01 kJ DE kg-1 BW d-1 for red drum fed a diet containing 36.5% DP
and 14.2 kJ DE. The similarities between apparent daily DE maintenance requirements
is not surprising as aquatic species tend to have on average a 10-fold lower basal
metabolism than homeothermic vertebrates (Kleiber, 1965) due to the their ability to
take advantage of the energetic benefits provided by their aquatic habitat.
Apparent daily DE requirements for maintenance obtained from whole-body
energy deposition were in agreement with those values obtained based on maximum
weight gain. Apparent daily DE requirements based on energy deposition was 0.891 kJ
DE shrimp-1 day-1 while maximum weight gain produced an apparent requirement of
0.887 kJ DE shrimp-1 day-1 for 13.08 g L. vannamei fed the 25% protein diet. A high
correlation was also obtained for 13.79 g shrimp which consumed the 35% protein diet
(1.096 kJ DE shrimp-1 day-1 and 1.012 kJ DE shrimp-1 day-1 for maximum weight gain
and energy deposition, respectively). This high degree of correlation between apparent
daily maintenance requirements obtained from body accretion and maximum weight is
in agreement with the high correlation obtained between the apparent daily requirements
necessary to produce maximum growth in L. vannamei. Due to the sparse data
concerning daily apparent maintenance energy for shrimp it is not possible to compare
the current results with prior research efforts; however, it is suggested this agreement is
due to L. vannamei’s limited ability to store lipid and carbohydrate.

74
CHAPTER III
APPARENT DRY MATTER, PROTEIN AND ENERGY DIGESTIBILITY OF
INGREDIENTS FOR PACIFIC WHITE SHRIMP Litopenaeus vannamei DIETS
Introduction
Although L. vannamei has been cultivated commercially for years, few studies
have focused on determining the energy and protein availability for commonly utilized
dietary ingredients (Akiyama et al., 1989; Davis and Arnold, 1993; Davis and Arnold,
1995). While direct measurement of digestibility coefficients is difficult (Smith and
Tabrett, 2004), apparent digestibility may be determined by utilizing an in vivo
digestibility method such as the indirect chromic oxide method (Akiyama et al., 1989;
Davis and Arnold, 1993; Davis and Arnold, 1995, Davis et al., 2002), the indirect
ytterbium acetate method (Smith and Tabrett, 2004) or the indirect titanium dioxide
method (Smith and Tabrett, 2004). Studies involving L. vannamei typically have
utilized the chromic oxide method (Smith et al., 1985; Davis and Arnold, 1993) due to
its ability to produce consistent results (Akiyama et al., 1989; Smith and Tabrett, 2004).
Accurate digestible energy and digestible protein coefficients are necessary to
precisely formulate diets to meet nutritional requirements as well as to effectively allow
cost substitution of ingredients and reduce waste production. Commercial diets are
currently formulated based on data which was derived from pond and laboratory studies
which measured growth parameters with no knowledge of nutrient availability. Since

75
these formulations utilize gross dietary composition which produced “optimal” growth
they can only be formulated “least cost” by adjusting protein sources while maintaining
gross dietary requirements. Formulations which rely solely on gross dietary
composition, as opposed to digestible composition, can produce a feed which is over-
formulated increasing both costs and pollutant levels as protein is the most expensive
component in feeds (Cordova-Murueta and Garcia-Carreno, 2002) and can lead to the
accumulation of inorganic nitrogen in culture water (Velasco et al., 1999). While Lee
and Lawrence (1997) suggested in 1997 that environmental regulations may have a
greater role in digestibility research than economical considerations, few studies have
focused on digestibility for either reason (Cuzon et al., 2004). This is surprising as feed
is a major part of production costs (Akiyama et al., 1992; Sarac et al., 1993) and
additional savings may be realized by optimizing feed formulations.
One only needs to look at the poultry industry to realize that a more cost
efficient, and environmentally sound, feed can be formulated based on the digestibility
(i.e. nutrient availability) of ingredients utilized in the diet. This formulation method
allows ingredients to be selected to meet both the nutritional as well as economical
requirements of the least-cost diet under consideration. Knowledge of digestibility
coefficients of ingredients also allows for an added measure of quality assurance as
digestibility of ingredients can vary considerable depending upon their overall freshness
and previous treatment (Garcia-Carreno, 1998). Utilization of currently available data
will not allow for the formulation of a least-polluting diet based on digestible energy
values and in some cases digestible protein values. The objective of this study was to

76
determine apparent dry matter, protein and energy digestibility for select ingredients
used in L. vannamei diets.
Materials and methods
In vivo experiments
Source of shrimp
Specific-pathogen-free L. vannamei postlarvae were obtained from the Oceanic
Institute (Kailua-Kona, HI) and stocked into 2.44-m diameter fiberglass tanks.
Postlarvae were fed live Artemia sp. nauplii and a commercial postlarval feed (Rangen
45/10; Rangen Inc., Buhl, ID) twice and 12 times daily, respectively. Postlarvae were
held approximately 13 weeks to allow for acclimation to laboratory conditions (30.1 ±
0.5 oC, 32.2 ± 0.4‰) and to achieve proper weight for the trial (9.75 g ± 0.43; 11.33 ±
0.61).
Experimental system
The experimental system consisted of 60 rectangular tanks (119 L volume; 0.3-
m2 bottom surface area) connected to a semi closed (10% new water daily) 43,000-L
indoor recirculating system. Seawater was pumped through a sand filter to achieve a
recirculating rate of 1.89 L min-1 tank-1 (2,400% daily exchange tank-1 day-1). A
light:dark photoperiod of 12:12 h was provided by supplemental compact fluorescent
lighting. Each tank was stocked with thirty 8-10 g L. vannamei to achieve a biomass of
270±20 g. Temperature, salinity and dissolved oxygen (DO) were monitored daily using
a YSI 85® Meter (YSI Inc., Yellow Springs, OH). Ammonia-nitrogen, NO2-N, NO3-N,

77
and pH were monitored weekly using methods adapted from those of Spotte (1979a,b)
and Solarzano (1969), Spotte (1979a,b), Mullen and Riley (1955), Spotte (1979a,b) and
Strickland and Parsons (1972), and a Brinkman Metrohm® pH meter, respectively.
Diet preparation and apparent digestibility determination
Apparent dry matter, protein and energy digestibility was determined for 32 feed
ingredients used to formulate L. vannamei diets (Table 23). The digestibility trial
followed the chromic oxide indicator method described by Cho et al. (1982). A 35%
crude protein, 8.41 kJ g-1 reference diet (Table 24) was mixed in bulk as a 35-kg batch
to assure uniformity between test diets. All ingredients for the reference diet, except
alginate and sodium metaphosphate, were mixed in a food mixer (Model L-800, Hobart
Corporation, Troy, OH) for 3 hours. One kg of reference diet and 32 test diets
comprised of 700 g kg-1 reference diet by weight and 300 g kg-1 test ingredient were
individually mixed in a food mixer (Model A-200, Hobart Corporation, Troy, OH) for
40 minutes. In a separate bowl, alginate and sodium metaphosphate were added to
deionized water (400 ml kg-1) and mixed using a hand mixer (Sunbeam Products Inc.,
Milford, MA) for approximately 45 seconds. The alginate was then added to the dry
ingredients and mixed an additional minute to achieve a mash consistency appropriate
for extrusion. Extrusion was accomplished using a meat chopper attachment (Model A-
200, Hobart Corporation, Troy, OH) fitted with a 3-mm die. Moist feed strands were
dried on wire racks in a forced air oven at 35 oC to a moisture content of 8-10%. Dry
feed strands were ground using a mortar and pestle to provide a particle size ranging
from 2-4 mm and stored at 4 oC until used.

78Table 23. Test ingredients used in the digestibility trials. Trial No.
International Feed No.
Ingredients Trial No.
International Feed No.
Ingredients
1 Blood Meal (Conventional)1 1 Fish Meal (Misc. Asian)2 1 5-00-381 Bood Meal (Spray Dried)1 1 Fish Meal (Misc. Peru)2 1 5-01-162 Casein4 1 5-14-503 Gelatin4 2 5-28-242 Corn Gluten1 2 Krill Meal1 2 5-01-663 Crab Meal1 2 Krill Flour2 1 Diatomaceous Earth5 1 5-03-798 Poultry By-product1 2 5-02-141 Distillers Grains1 2 5-04-612 Soybean Meal, 48% (Solvent Extract)1 1 5-03-795 Feather Meal1 2 5-04-597 Soybean Meal (Full Fat)1 1 5-01-985 Fish Meal (Anchovy)1 2 5-08-038 Soybean Meal (Isolated, 90%)1 1 5-01-985 Fish Meal (Anchovy-Peru)2 2 Squid (Liver Meal-Asian)2 1 5-02-000 Fish Meal (Herring)1 2 Squid (Muscle Meal)1 1 Fish Meal (Hoki-N. Zealand)2 2 Squid (Muscle Meal)1 1 5-01-985 Fish Meal (Mackerel-Chile)2 2 Squid (Whole)1 1 5-02-009 Fish Meal (Menhaden)1 2 Squid (Whole-Asian)2 1 5-02-009 Fish Meal (Menhaden)1 1 Wheat Gluten4 1 5-01-977 Fish Meal (Menhaden)3 1 Wheat Starch4
1Zeigler Brothers, Gardners, PA, USA. 2Evialis, Vannes Cedex, France. 3Omega Protein Corporation Inc., Houston, TX, USA. 4MP Biomedicals, Cleveland, OH, USA. 5Sigma, St. Louis, MO, USA. 6The J. M. Smucker Company, Orrville, OH, USA.

79
Table 24. Composition of the 35% crude protein, 8.40 kJ g-1, reference diet. Ingredient Inclusion level
(g kg-1) Ingredient Inclusion level
(g kg-1) Alginate5 20.00 Krill1 105.00 Calcium Carbonate2 14.60 Mineral-Vitamin Premix1,A 2.70 Cellulose4 20.00 MgO3 17.30 Cholesterol2 2.00 Phospholipid1 42.00 Chromic Oxide3 10.00 Sodium Metaphosphate3 10.00 Dicalcium Phosphorus2 65.60 Squid1 150.00 Fish Meal6 150.00 Vitamin C1 0.50 Isolated Soy (90%)1 79.40 Vitamin-Mineral Premix1,B 2.30 KCl3 18.50 Wheat Starch2 290.10 Crude Protein (%) 35.00* Energy, kcal g-1 2.01* Digestible Protein (%) 31.63* Digestible Energy, kcal g-1 1.72* Ash (%) 17.01* Lipid (%) 8.03* 1Zeigler Brothers, Gardners, PA, USA. 2MP Biomedicals, Cleveland, OH, USA. 3Fisher Scientific, Fair Lawn, NJ, USA. 4Sigma, St. Louis, MO, USA. 5Keltone HV Alginate, NutraSweet-Kelco Company, Chicago, IL. 6Omega Protein Corporation Inc., Houston, TX, USA. 7Ingredient composition of the premix. ASee Appendix A for composition. BSee Appendix B for composition. *Calculated on an as-fed basis. Sample collection
The first digestibility trial consisted of 19 test diets and the reference diet
randomly assigned to 60 tanks providing three replicates per diet. Shrimp were
acclimated to test diets and culture conditions 4 days prior to the start of fecal
collections. At the start of each collection day tanks were siphoned of fecal material and
shrimp molts. Shrimp were fed 0.2 g feed per shrimp per hour for 6 consecutive hours.
Uneaten feed was removed from tanks prior to each feeding to minimize leaching losses.
Fecal material was collected 1 h after each feeding by siphoning the feces onto a 42-µm

80
screen. Feces was rinsed with deionized water, transferred to individually labeled vials
and frozen (-84oC) until analysis. Feces from the first daily collection were discarded to
minimize influence from previously eaten fecal material. Feces were collected for four
consecutive days and pooled such that each replicate consisted of the feces from one
tank collected over four consecutive days. The above procedure was then repeated for
the remaining 13 test diets and the reference diet using 11.33±0.61 g shrimp. To assess
the effect of shrimp size on digestibility the above procedure was repeated for the
reference diet using shrimp with mean weights of 8.65±0.29, 13.14±0.08, and
15.09±0.08 g.
Analysis of feed and feces
Prior to compositional analysis, feed and fecal samples were lyophilized, ground
into a fine powder using a mortal and pestle and analyzed for percent dry matter
(AOAC, 1990). Protein (AOAC Method 990.3; FP-528 Nitrogen/Protein Determinator;
Leco Corporation, St. Joseph, MI), energy (model 1241 adiabatic bomb calorimeter; Parr
Instrument Co., Moline, IL) and chromic oxide (McGinnis and Kasting, 1964) were then
determined for each lyophilized sample and reported on a dry-matter basis. Apparent
digestibility coefficient (ADC) values for the test and reference diets were calculated by
the following equation (Pond et al. 1995):
% indicator in diet % nutrient in feces ADC (%) = 100 – ------------------------ X ------------------------ X 100
% indicator in feces % nutrient in diet

81
where indicator is chromic oxide and nutrient is dry matter, protein, or energy. To
determine the ADC for dry matter, protein and energy for the test ingredient the
following equation was used (Bureau and Hua, 2006):
For all test ingredients:
ADCtest ingredient = ADCtest diet + [(ADCtest diet – ADCref. diet) x (0.7 x Dref/0.3 x Dingr)]
where Dref = % nutrient (or kcal g-1 gross energy) of reference diet mash; Dingr = %
nutrient (or kcal g-1 gross energy) of test ingredient.
Statistical analysis
ADC values were subjected to analysis of variance using SPSS to determine if
significant differences exist between the ingredients. Significant differences (P<0.05)
were separated using the Bonferroni inequality to assure the experimentwise error rate
was less than or equal to 0.05.
In vitro experiments
In vitro analysis of selected ingredients
Fourteen ingredients (conventional blood meal, spray dried blood meal, corn
gluten, crab meal, distillers grains, feather meal, Anchovy fish meal, Herring fish meal,
Menhaden fish meal, poultry by-product, 48% soybean meal, full fat soybean meal,
squid muscle meal-Lima and squid muscle meal-Paita) were sent to Zeigler Brothers,
Gardners, PA for in vitro ACPD analysis using either 0.20% or 0.0002% pepsin. ADC
values were subjected to correlation analysis using SPSS to determine the strength of the
linear relation between in vivo and in vitro crude protein digestibility coefficients.

82
Results
In vivo experiments
Water quality
To assure these inorganic compounds do not interfere with the experiment,
ammonia-N should be maintained below 2.37 mg L-1 (0.09 mg L-1 for NH sub(3)-N
(Chen and Lin 1991), nitrite levels below 2.04 mg L-1 (Chen and Lin 1991) and nitrate
should be below 25 mg L-1 (Chen and Lei 1990). Values obtained during the experiment
were well below these recommendations which suggest shrimp were maintained under
optimal water quality parameters for the duration of the 4-week trial.
Weight-class effect on digestibility coefficients
Significant differences in apparent crude protein digestibility (ACPD) were
observed for the five different weight classes of L. vannamei (Table 25). ACPD
coefficients were significantly higher for the 8.56 g L. vannamei than all other weight
classes. No significant differences in ACPD were determined among the three largest
weight classes (11.33, 13.14, 15.09 g) while the second weight class (9.75 g) had an
ACPD which was significantly higher than the two largest weight classes (13.14, 15.09
g) but not significantly different from the third weight class (11.33 g). No significant
differences in apparent dry matter digestibility (ADMD) (range: 70.58-72.06%) or
apparent energy digestibility (AED) (range: 84.30-86.00%) coefficients were observed
between the five different weight classes.

83
Table 25. Effect of mean weight on in vivo digestibility in L. vannamei fed a 35% standard reference diet1.
Mean Weight (g)2 ADMD (%) ACPD (%) AED (%) 8.56±0.29a 71.45±2.36f 90.38±0.66i 85.20±0.79j 9.75±0.43b 72.06±0.88f 89.10±0.42h 86.00±0.19j 11.33±0.61c 70.58±2.35f 88.44±0.11gh 85.48±0.45j 13.14±0.08d 71.58±2.25f 87.95±0.34g 85.85±0.92j 15.09±0.08e 70.77±2.74f 87.79±0.25g 84.30±0.61j
1Values are means ± sd and values with similar superscripts are not significantly different (P>0.05). 2Mean weight obtained at start of 4 day trial ± Standard Deviation (N = 3).
Apparent dry matter digestibility
Apparent digestibility coefficients for the ingredients are presented in Tables 26
and 27. ADMD values of ingredients ranged from 4.3% for diatomaceous earth to
96.5% for gelatin. Purified meals (range: 89.4-96.5%) had significantly higher ADMD
than all other ingredients tested, with gelatin having the highest numerical ADMD.
ADMD coefficients differed significantly between fish meals (range: 55.8-78.3%) and
were inversely correlated to ash content (r=-0.89; P<0.0001). No significant differences
in ADMD were noted between the two anchovy fish meals; however, there was a
significant difference in ADMD between the three menhaden fish meals. Significant
differences in ADMD coefficients also were observed for practical plant meals (range:
41.8 to 78.7%); however, the coefficients were not correlated to ingredient ash content
(P>0.05). Corn gluten meal had the second lowest ash content of all ingredients (1.5%)
but had an ADMD (41.8%) which was only significantly greater than diatomaceous
earth (4.3%). Dry matter digestibility of practical animal meals (range: 57.0-63.9%) was
less variable than ADMD of marine meals (range: 43.3-81.7%).

84Table 26. Percent ash, dry matter protein content (DMPC), apparent dry matter digestibility (ADMD) and apparent crude protein digestibility (ACPD) of ingredients consumed by L. vannamei.* Ingredient Ash (%) DMPC (%) ADMD (%) ACPD (%) Blood Meal (Conventional)1,C 1.56 ± 0.09 97.6 ± 0.5 57.0 ± 3.8l,m 66.2 ± 1.6l Blood Meal (Spray Dried)1,C 2.84 ± 0.01 99.1 ± 0.5 63.4 ± 4.5h,i,j,k,l 70.8 ± 1.8k Casein4,E 0.73 ± 0.01 95.9 ± 0.2 89.5 ± 1.4b 96.4 ± 1.0b Corn Gluten1,D 1.48 ± 0.02 71.6 ± 0.0 41.8 ± 1.0o 59.1 ± 1.9m Crab Meal1,B 44.77 ± 0.59 33.3 ± 0.8 43.3 ± 1.4n,o 84.0 ± 1.9f,g,,h Distillers Grains1,D 5.02 ± 0.13 30.4 ± 0.6 47.2 ± 3.7n 78.5 ± 1.4i,j Feather Meal1,C 2.74 ± 0.04 86.7 ± 0.1 61.3 ± 0.9j,k,l,m 63.9 ± 0.7l Fish Meal (Anchovy)1,A 14.99 ± 0.23 70.0 ± 0.8 78.3 ± 2.3c,d 87.9 ± 0.7d,e,f Fish Meal (Anchovy-Peru)2,A 14.37 ± 0.16 74.45 78.0 ± 1.0c,d 88.5 ± 2.4d,e Fish Meal (Herring)1,A 12.21 ± 0.03 78.7 ± 0.6 72.7 ± 3.9d,e,f,g 90.1 ± 1.1d,e Fish Meal (Hoki-New Zealand)2,A 17.76 ± 1.55 71.95 67.1 ± 2.0g,h,i,j,k 88.1 ± 1.0d,e,f Fish Meal (Mackerel-Chile)2,A 16.92 ± 0.00 74.75 73.5 ± 3.9d,e,f,g 88.8 ± 2.8d,e Fish Meal (Menhaden)1,A 20.09 ± 0.21 68.3 ± 0.2 68.1 ± 2.1f,g,h,I,j 89.0 ± 2.2d,e Fish Meal (Menhaden)1,A 29.15 ± 0.35 61.8 ± 0.4 55.6 ± 3.7m 83.7 ± 0.7g,h Fish Meal (Menhaden)3,A 21.25 ± 0.09 68.9 ± 0.6 60.2 ± 0.5k,l,m 83.2 ± 1.4h Fish Meal (Misc. Species-Asian)2,A 22.66 ± 0.51 65.45 55.8 ± 4.0m 78.6 ± 0.9i,j Fish Meal (Misc. Species-Peru)2,A 16.17 ± 0.04 71.85 70.7 ± 4.0e,f,g 87.6 ± 2.6e,f,g Gelatin4,E 0.06 ± 0.00 112.4 ± 0.0 96.5 ± 1.9a 99.7 ± 1.9a Krill Meal1,B 12.23 ± 0.25 70.2 ± 1.2 72.6 ± 0.2d,e,f,g 80.5 ± 1.1i Krill Flour2,B 9.52 ± 0.05 62.85 81.7 ± 1.0c 89.4 ± 1.1d,e Poultry By-Product1,C 16.80 ± 0.07 68.3 ± 1.6 63.9 ± 3.9h,i,j,k,l 78.7 ± 1.7i,j Soybean Meal (48% Solvent Extract)1,D 7.40 ± 0.12 51.6 ± 0.1 75.9 ± 1.6c,d,e 92.9 ± 0.3b,c Soybean Meal (Full Fat)1,D 5.31 ± 0.08 42.5 ± 0.3 63.5 ± 2.2h,i,j,k,l 87.1 ± 1.8e,f,g,h
Soybean Meal (Isolated, 90%)1,D 4.65 ± 0.02 89.6 ± 0.3 78.7 ± 0.7c,d 93.7 ± 0.8b,c Squid (Liver Meal-Asian)2,D 6.27 ± 0.15 53.55 61.8 ± 3.3i,j,k,l,m 66.4 ± 1.9l Squid (Muscle Meal-Lima)1,D 4.22 ± 0.59 91.4 ± 0.3 69.8 ± 4.6e,f,g,h 84.6 ± 2.4f,g,h

85Table 26. Continued Ingredient Ash (%) DMPC (%) ADMD (%) ACPD (%) Squid (Muscle Meal-Paita)1,D 3.84 ± 0.03 90.1 ± 0.2 74.7 ± 1.4d,e,f 86.6 ± 0.8e,f,g,h
Squid (Whole)1,D 4.24 ± 0.05 88.9 ± 0.1 68.6 ± 1.0f,g,h,i 84.5 ± 1.9f,g,h Squid (Whole, Asian)2,D 10.20 ± 0.08 73.05 61.9 ± 0.8i,j,k,l,m 75.4 ± 0.9j Wheat Gluten4,E 0.65 ± 0.00 83.7 ± 0.5 89.4 ± 1.0b 95.8 ± 0.6b Values are means of three determinations ± s.d. *Means with similar lowercase superscripts are not significantly different (P>0.05). 1Zeigler Brothers, Gardners, PA, USA. 2Evialis, Vannes Cedex, France. 3Omega Protein Corporation Inc., Houston, TX, USA. 4MP Biomedicals, Cleveland, OH, USA. 5Results provided by Evialis, Vannes Cedex, France. AFish Meals. BMarine Meals. CPractical Animal Meals. DPractical Plant Meals. EPurified Ingredients.

86Table 27. Percent ash, dry matter energy content (DMEC), apparent dry matter digestibility (ADMD) and apparent energy digestibility (AED) of ingredients consumed by L. vannamei.* Ingredient Ash (%) DMEC (kcal g-1) ADMD (%) AED (%) Blood Meal (Conventional)1,C 1.56 ± 0.09 5.74 ± 0.05 57.0 ± 3.8l,m 72.2 ± 1.6i,j Blood Meal (Spray Dried)1,C 2.84 ± 0.01 5.91 ± 0.06 63.4 ± 4.5h,i,j,k,l 75.1 ± 2.1h,i Casein4,E 0.73 ± 0.01 5.74 ± 0.02 89.5 ± 1.4b 100.9 ± 1.8a Corn Gluten1,D 1.48 ± 0.02 5.67 ± 0.00 41.8 ± 1.0o 65.4 ± 1.7l Crab Meal1,B 44.77 ± 0.59 2.64 ± 0.04 43.3 ± 1.4n,o 80.6 ± 1.9f,g Diatomaceous Earth5,E 99.23 ± 0.08 0.15 ± 0.00 4.3 ± 2.1p 80.6 ± 2.1f,g Distillers Grains1,D 5.02 ± 0.13 5.33 ± 0.03 47.2 ± 3.7n 69.6 ± 1.4j,k Feather Meal1,C 2.74 ± 0.04 5.91 ± 0.01 61.3 ± 0.9j,k,l,m 72.7 ± 0.2i,j Fish Meal (Anchovy)1,A 14.99 ± 0.23 5.16 ± 0.01 78.3 ± 2.3c,d 89.5 ± 0.5b Fish Meal (Anchovy-Peru)2,A 14.37 ± 0.16 4.77 ± 0.02 78.0 ± 1.0c,d 87.1 ± 2.1b,c,d Fish Meal (Herring)1,A 12.21 ± 0.03 5.30 ± 0.01 72.7 ± 3.9d,e,f,g 89.4 ± 0.7b Fish Meal (Hoki-New Zealand)2,A 17.76 ± 1.55 4.62 ± 0.03 67.1 ± 2.0g,h,i,j,k 88.8 ± 1.2b,c Fish Meal (Mackerel-Chile)2,A 16.92 ± 0.00 4.54 ± 0.04 73.5 ± 3.9d,e,f,g 88.3 ± 2.1b,c Fish Meal (Menhaden)1,A 20.09 ± 0.21 4.80 ± 0.03 68.1 ± 2.1f,g,h,i,j 88.4 ± 2.0b,c Fish Meal (Menhaden)1,A 29.15 ± 0.35 4.42 ± 0.03 55.6 ± 3.7m 83.3 ± 1.2c,d,e,f,g Fish Meal (Menhaden)3,A 21.25 ± 0.09 4.64 ± 0.01 60.2 ± 0.5k,l,m 86.7 ± 1.9b,c,d,e Fish Meal (Misc. Species-Asian)2,A 22.66 ± 0.51 4.14 ± 0.02 55.8 ± 4.0m 81.3 ± 1.0f,g Fish Meal (Misc. Species-Peru)2,A 16.17 ± 0.04 4.76 ± 0.01 70.7 ± 4.0e,f,g 87.3 ± 1.6b,c,d Gelatin4,E 0.06 ± 0.00 5.14 ± 0.02 96.5 ± 1.9a 102.2 ± 2.0a Krill Meal1,B 12.23 ± 0.25 5.19 ± 0.01 72.6 ± 0.2d,e,f,g 80.6 ± 0.9f,g Krill Flour2,B 9.52 ± 0.05 5.47 ± 0.02 81.7 ± 1.0c 87.2 ± 0.6b,c,d Poultry By-Product1,C 16.80 ± 0.07 4.94 ± 0.02 63.9 ± 3.9h,i,j,k,l 82.1 ± 1.3d,e,f,g Soybean Meal (48% Solvent Extract)1,D 7.40 ± 0.12 4.42 ± 0.01 75.9 ± 1.6c,d,e 85.6 ± 0.7b,c,d,e,f Soybean Meal (Full Fat)1,D 5.31 ± 0.08 5.56 ± 0.03 63.5 ± 2.2h,i,j,k,l 80.8 ± 1.9f,g Soybean Meal (Isolated, 90%)1,D 4.65 ± 0.02 5.38 ± 0.01 78.7 ± 0.7c,d 95.0 ± 5.5a,b Squid (Liver Meal-Asian)2,B 6.27 ± 0.15 5.33 ± 0.03 61.8 ± 3.3i,j,k,l,m 74.0 ± 1.5i,j

87Table 27. Continued Ingredient Ash (%) DMEC (kcal g-1) ADMD (%) AED (%) Squid (Muscle Meal-Lima)1,B 4.22 ± 0.59 5.63 ± 0.02 69.8 ± 4.6e,f,g,h 81.8 ± 1.6e,f,g Squid (Muscle Meal-Paita)1,B 3.84 ± 0.03 5.69 ± 0.01 74.7 ± 1.4d,e,f 84.1 ± 0.7b,c,d,e,f Squid (Whole)1,B 4.24 ± 0.05 5.61 ± 0.01 68.6 ± 1.0f,g,h,i 67.6 ± 7.8k,l Squid (Whole, Asian)2,B 10.20 ± 0.08 4.73 ± 0.01 61.9 ± 0.8i,j,k,l,m 78.5 ± 1.4g,h Wheat Gluten4,E 0.65 ± 0.00 5.65 ± 0.01 89.4 ± 1.0b 99.5 ± 1.4a Wheat Starch4,E 0.21 ± 0.01 4.17 ± 0.02 92.3 ± 2.3a,b 98.9 ± 0.9a Values are means of three determinations ± s.d. *Means with similar lowercase superscripts are not significantly different (P>0.05). 1Zeigler Brothers, Gardners, PA, USA. 2Evialis, Vannes Cedex, France. 3Omega Protein Corporation Inc., Houston, TX, USA. 4MP Biomedicals, Cleveland, OH, USA. 5Sigma, St. Louis, MO, USA. AFish Meals. BMarine Meals. CPractical Animal Meals. DPractical Plant Meals. EPurified Ingredients.

88
Apparent crude protein digestibility
Apparent crude protein digestibility (ACPD) coefficients ranged from 59.1% for
corn gluten to 99.7% for gelatin. ACPD coefficients for all purified ingredients (range:
95.8-99.7%) were greater than 95%, with gelatin having the highest value with an ACPD
of 99.7%. ACPD coefficients for fish meals (range: 78.6-90.1%) were lower than those
obtained for purified ingredients but higher than all other ingredient classifications.
Soybean products (90% protein isolate and 48% solvent extracted meal) had
significantly higher ACPD than all other practical plant meals (range: 59.1-93.7%), fish
meals, marine meals, and practical animal meals tested while corn gluten meal (59.1%)
had the lowest ACPD of all ingredients. ACPD coefficients for all practical animal
meals (range: 63.9-78.7%) were in the bottom third of all ingredients with feather meal,
conventional blood meal and spray dried blood meal comprising three of the five lowest
ACPD values. ACPD coefficients for marine meals were between 89.4% for krill flour
to 66.4% for Asian squid liver meal. No significant differences in ACPD coefficients
were observed between the two different squid muscle meals; however, there was a
significant difference between the two different whole squid products. ACPD was not
correlated to crude protein content (P>0.05), energy content (P>0.05) or ash content
(P>0.05) of the ingredients.
Apparent energy digestibility
Apparent energy digestibility (AED) coefficients ranged from 65.4% for corn
gluten to 102.2% for gelatin. As a group purified ingredients had the highest AED
coefficients ranging from a low of 80.6% for diatomaceous earth to a high of 102.2% for

89
gelatin. Gelatin had the highest numerical AED but was not significantly different from
casein, 90% isolated soybean protein, wheat gluten and wheat starch. AED values for
menhaden fish meal (83.3) and Asian miscellaneous species fish meal (81.3) were lower
than all other fish meal AED values (range: 81.3 to 89.5%) and corresponded to the two
lowest ADMD coefficients in the group; however, variability in AED coefficients were
smaller than for ADMD coefficients. AED values of practical plant meals (range: 65.4-
89.5%) showed the greatest degree of variability. Corn gluten meal had a significantly
lower AED (65.4%) than all ingredients while the AED for 90% isolated soybean
protein (95.0%) was not significantly different than the highest numerical ingredient
AED. Practical animal meals (range: 72.2-82.1%) as a group had the lowest average
AED and ash content of all ingredient classifications. Poultry by-product meal, which
had the highest ash content in the group, had a significantly higher AED coefficient than
all other ingredients in the group. AED coefficients for marine meals ranged from a low
of 67.6% for squid liver meal to 87.2% for krill flour. No significant differences were
noted between the two squid muscle meals; however, there were significant differences
in AED coefficients between the two whole squid products. Apparent energy
digestibility was positively correlated (r=0.91 P<0.0001) to apparent crude protein
digestibility. AED was not correlated to crude protein content (P>0.05), energy content
(P>0.05) or ash content (P>0.05) of the ingredients.

90
In vitro experiments
In vitro determination of apparent crude protein coefficients
In vitro ACPD values obtained using 0.20% pepsin ranged from 97.6% for
conventional blood meal to 76.6% for crab meal and between 98.3% for conventional
blood meal to 36.7% for feather meal using 0.0002% pepsin (Table 28). In vivo ACPD
coefficients were positively correlated (r=0.55; P<0.05) to in vitro values obtained from
using 0.0002% pepsin. No correlation (P>0.05) was observed between in vivo ACPD
coefficients and in vitro values obtained using 0.20% pepsin.
Table 28. A comparison of in vivo and pepsin digestibility in L. vannamei. Ingredient In vivo digestibility 0.20% Pepsin 0.0002% Pepsin
ADMD1 ACPD1 ACPD1 ACPD1 Blood Meal (Conventional)2 57.0 ± 3.8 66.2 ± 1.6 97.6 98.3 Blood Meal (Spray Dried)2 63.4 ± 4.5 70.8 ± 1.8 93.3 96.1
Corn Gluten2 41.8 ± 1.0 59.1 ± 1.9 97.7 45.3 Crab Meal2 43.3 ± 1.4 84.0 ± 1.9 76.6 61.0
Distillers Grains2 47.2 ± 3.7 78.5 ± 1.4 79.3 41.7 Feather Meal2 61.3 ± 0.9 63.9 ± 0.7 86.9 36.7
Fish Meal (Anchovy)2 78.3 ± 2.3 87.9 ± 0.7 95.3 88.6 Fish Meal (Herring)2 72.7 ± 3.9 90.1 ± 1.1 94.3 85.4
Fish Meal (Menhaden)2 68.1 ± 2.1 89.0 ± 2.2 96.4 93.6 Poultry By-Product2 63.9 ± 3.9 78.7 ± 1.7 92.0 61.7
Soybean Meal (48%)2 75.9 ± 1.6 91.9 ± 0.3 92.9 83.6 Soybean Meal (Full Fat)2 63.5 ± 2.2 87.1 ± 1.8 95.2 89.6
Squid (Muscle Meal-Lima)2 69.8 ± 2.6 84.6 ± 2.4 97.4 81.9 Squid (Muscle Meal-Paita)2 74.7 ± 1.4 86.6 ± 0.8 96.1 82.9
1All values reported as percentage ± standard deviation, where applicable. 2Zeigler Brothers, Gardners, PA, USA.

91
Discussion
In vivo experiments Water quality
Water quality values obtained during this experiment were well below the upper
limited recommended for shrimp which suggesting the shrimp in this experiment were
maintained under optimal water quality parameters for the duration of the fecal
collection period.
Weight-class effect on digestibility coefficients
Significant differences in ACPD were determined for the five different weight
classes of L. vannamei fed the standard reference diet. Smith et al. (1985) reported no
differences in protein or feed digestibilities for L. vannamei between 10 and 15 grams
fed identical diets containing 22, 30 and 38% protein. No significant differences in
protein digestibility was witnessed in the current study for L. vannamei between 11.75
and 15.09 grams; however, significant differences in protein digestibility were
determined between 9.75 and 15.09-g L. vanammei which is only slightly outside the
size range reported by Smith et al. (1985). Fenucci et al. (1982) also determined there
was no significant difference in ACPD between 7 and 14-g L. vannamei which spans a
size range that produced significant differences in this study. Differences in ACPD
reported in this study are similar to those reported for L. setiferus (Fenucci et al., 1982)
and suggests L. vannamei utilizes protein more efficiently at sizes less than 9.75 g.
The significant differences in apparent crude protein digestibility may be
attributed to increased statistical sensitivity due to the small standard deviation between

92
replicates as the numerical difference in ACPD between all size classes was only 2.59%
(87.79% – 90.38%). Since all shrimp used in the trial were from the same “batch” it is
not likely the differences in ACPD were genetically induced; however, the 13.14- and
15.09-g L. vannamei had been fed chromic oxide digestibility feeds for 4 and 5 weeks,
respectively. Divakaran (2005) suggested the ~1% free chromium, as chromium salts, in
chromic oxide could be absorbed by shrimp, therefore its possible the lower ACPD
reported in this study may be caused by chromium affecting the gut either as an irritant
or as a “mild” toxicant. However, this would not explain the lack of differences for
ADMD and AED as these values should be equally affected by anything interfering with
digestion. The significant difference in ACPD coefficients reported in this study had no
effect on ingredient ACPD coefficients as there was no significant difference in ACPD
between the 9.75- and 11.33-g shrimp used in the ingredient digestibility study.
Apparent dry matter digestibility
Apparent dry matter digestibility provides a good estimate of the degree to which
an ingredient is digested and absorbed by the gut. ADMD values were between 41.8 and
96.8% and were highest for the purified ingredients. Significant differences in ADMD
were not determined between high protein and high carbohydrate purified ingredients
which suggests L. vannamei are able to utilize carbohydrates as efficiently as protein
provided dietary levels are within reason. The difference in ADMD between diets high
in carbohydrate and protein reported by Akiyama et al (1989) may have been caused by
comparing the protein diets to the diet high in corn starch as corn products have
produced low apparent digestibility coefficients (Davis et al., 1993; Tables 26 and 27).

93
Apparent dry matter digestibility for wheat starch in this study was only exceeded by the
ADMD obtained for gelatin and is higher than all ADMD values obtained by Akiyama
et al (1989) which suggests it is readily utilized by L. vannamei as a carbohydrate
(energy) source.
Purified ingredients had the highest ADMD coefficients of all ingredients tested
in the current study. While other ingredients tend to vary between studies and batches,
purified ingredients consistently have high dry matter, energy and protein digestibility
coefficients (L. vannamei: Akiyama et al., 1989 and Tables 26 and 27; P. monodon:
Shiau et al., 1992; Palaemon serratus: Forster and Gabbott, 1971; Pandalus platyceros:
Forster and Gabbott, 1971; Procambarus clarkia: Brown et al., 1986). These
ingredients, while not commonly used commercially due to their price, are important
sources of energy and protein in purified and semi-purified research diets. The
consistency in apparent digestibility between shrimp species may allow for the
formulation of a universal reference digestibility diet which would allow better
comparison of data between species as well as reduce variability between studies
involving the same species.
Differences in ADMD between the fish meals can be attributed to the negative
correlation observed between ash content and ADMD. This correlation makes fish meal
one of the few ingredients which can be initially evaluated for apparent dry matter
digestibility based on an easily measurable compositional metric. Differences in ash
between the fish meals, however, can’t be attributed to species differences as it is not
known how the samples were processed. Fish meals which are made from whole fish

94
typically have less ash than those which are made after fillets are removed (Anderson et
al., 1993). Despite these potential processing differences, ADMD values obtained for
Menhaden fish meal were in agreement with those values previously obtained for L.
vannamei (Akiyama et al., 1989) and P. setiferus (Brunson et al., 1997).
ADMD coefficients for soybean meal increased with the level of ingredient
refinement and protein content from 63.5% for full fat soybean meal to 78.7% for 90%
isolated soybean protein. Similar increases were determined by Akiyama et al (1989)
who reported an ADMD of 55.9% for soybean meal and 84.1% for soy protein fed to L.
vannamei. This increase in ADMD can be attributed to the highly digestible protein
contained in these ingredients and suggests the lipid fraction is poorly digested in the full
fat and 48% soybean meals. The poor utilization of the lipid fraction may be due to the
high (>10%) dietary level of lipid in the digestibility diets as L. vannamei has been
shown to poorly utilize dietary lipid above 10% (Dokken, 1987).
ADMD coefficients for squid also increased with the level of ingredient
“refinement” from whole squid (61.9-68.6%) to squid muscle meal (69.8-74.7%). This
increase in ADMD may be attributed to the increased level of highly digestible protein
in the squid muscle meal. The significant difference in ADMD between the two krill
meals may be due to the difference in particle size which would provided more surface
area for digestive enzymes; however, the meals were obtained from two different
sources and may have other compositional differences which affected the ADMD
determination.

95
Apparent protein digestibility
Apparent protein digestibility coefficients from this study compare very
favorably with previously reported data for L. vannamei (Akiyama et al., 1989) using a
single feedstuff. The lack of differences between the studies suggests ACPD
coefficients are minimally affected by nutrient associations (current study) or
nutritionally incomplete diets (Akiyama et al., 1989), provided the respective
experimental methods are followed. The minimal difference between the studies may
also be attributed to the same extrusion process (cold extrusion using a Hobart mixer) as
extrusion techniques have been shown to affect apparent digestibility coefficients (Davis
and Arnold, 1995). Differences in apparent digestibility attributed to extrusion method
are not universal for all ingredients (Davis and Arnold, 1995) which suggest the
importance of utilizing a “reference extrusion method” to allow comparison between
different studies.
Purified ingredients had the highest dry matter protein contents and ACPD
coefficients and lowest ash content of all ingredients tested. While these ingredients are
highly digestible their amino acid profiles are not well balanced. Wheat gluten is low in
lysine and has been used in experiments to determine the lysine requirement for L.
vannamei (Fox et al., 1995). Purified diets high in casein and gelatin have produced
growth responses which are typically lower than those obtained when using practical
plant and animal meals (D’Abramo and Castell, 1997). These deficiencies, combined
with their high cost, have limited their use to purified and semi-purified research feeds

96
which can be supplemented with additionally expensive additives (i.e. crystalline amino
acids) to produce an adequate research diet.
Fish meal ACPD coefficients as a group were higher than all other ingredient
classifications except purified ingredients. The high ACPD obtained for fish meals,
combined with their balanced essential amino acid profile, implies their relative
importance in dietary formulations and helps to explain why fish meal substitution with
animal and by-product meals is not always successful. The significant differences in
digestibility between the different lots of menhaden fish meal suggest the importance of
batch to batch digestibility screening of raw ingredients. The higher ash content of the
low ACPD menhaden fish meal suggests a higher bone and scale content which is
indicative of the use of low quality material left over after the fish was filleted.
Differences in ash may be detected by performing routine compositional analysis on
incoming ingredients; however, this type of screening will not detect differences in
apparent digestibility caused by excessive heat treatment, freshness of the ingredient, or
differences in the drying processes (Anderson et al., 1993). Differences in apparent
digestibility between batches of ingredients are common (Lemos et al., 2000) and can
lead to formulation errors which could reduced shrimp growth. Differences among fish
meal ACPD coefficients may also be attributed to differences in chemical composition
caused by processing (i.e. amount of lipid left in the meal), excessive heat treatment or
from species differences (Anderson et al., 1993). Despite all these potential effects, fish
meal ACPD coefficients obtained in this study were in agreement with those previously
97
obtained for L. vannamei (Akiyama et al, 1989), Procambarus clarkia (Reigh et al.,
1990) and Penaeus setiferus (Brunson et al., 1997).
The protein in both 48% and 90% soybean products was significantly more
digestible than the protein found in the fish, animal and marine meals tested. Similarly,
Ezquerra et al. (1997) determined plant proteins were more digestible than animal
proteins using an in vitro ACPD method involving L. vannamei, while Smith et al.
(1985) reported no difference in ACPD between plant and animal protein for both
medium and large L. vannamei. These results are in contrast to the significantly lower
ACPD coefficients obtained for plant meals versus fish, marine and animal meals for P.
serratus (Forster and Gabbot, 1971), P. platyceros (Forster and Gabbot, 1971) and P.
stylirostris (Fenucci et al., 1982) and imply the omnivorous nature of L. vannamei.
These results suggest the importance plant proteins may have in removing fish meals
from L. vannamei diets; however, high ACPD coefficients alone will not predict
ingredients’ ability to support growth as plant proteins are typically low in the essential
amino acids lysine and methionine. Apparent digestibility coefficients for protein need
to be combined with apparent amino acid digestibility to allow effective substitution of
low priced plant ingredients with higher priced fish meals.
While ingredient ash content tended to be inversely related to ingredient protein
content a similar correlation was not determined between ash content and ACPD. Corn
gluten meal had the second lowest ash content of all ingredients tested but had the lowest
ACPD. These results demonstrate the difficulty in predicting apparent digestibility
coefficients even for plant ingredients which typically have greater compositional

98
consistency between batches than fish, marine and animal meals. While high ash
content may reduce digestibility coefficients, digestibility is also affected by processing
and anti-nutritional factors such as tannins, phytate and oligosaccharides.
Practical animal meals generally are high in protein and contain a balanced
amino acid profile; however they are commonly affected by a lack of consistent quality
from batch to batch due to differences in processing and the quality of raw ingredients.
Therefore, it is hard to determine if the low ACPD coefficients obtained for practical
animal meals is attributed to the terrestrial nature of the protein or because the ingredient
quality of the waste by-products, obtained during the slaughter and processing of poultry
and cattle, were low. Differences in blood meal ACPD coefficients may be attributed to
the difference in processing temperatures as spray drying typically involves lower
processing temperatures than those encountered during the conventional ring-drying
process. High temperatures experienced in the drying process can damage amino acids
(i.e., Mallard reaction, oxidative degradation, etc.) making them unavailable to the
animal. The high percentage of protein (>97%) in blood meal makes it especially
sensitive to heat which can lead to very significant reductions in apparent protein
digestibility (Cho et al., 1982).
It is interesting to note that despite the commercial use of krill and squid muscle
meals in Penaeid diets, previous ACPD coefficients have not been reported. The marine
protein in both squid muscle meals produced ACPD coefficients which were statistically
equivalent to those obtained by the fish meals with the highest ACPD coefficients.
Similarly, the protein in krill flour was only significantly less digestible than the protein

99
contained in purified ingredients and was statistically equivalent to the fish meals with
the highest ACPD coefficients. The use of these ingredients in commercial formulations
demonstrates how growth data, not digestibility coefficients, are utilized to formulate
diets. The ACPD for crab meal was higher than previous results obtained for L. setiferus
(Brunson et al., 1997) and Procambarus clarkia (Reigh et al., 1990); however, one must
interpret this coefficient with caution as the high chitin content of this meal will be
included as protein overestimating the ingredients true protein content. Similarly, ACPD
coefficients for squid liver meal need to be interpreted with care as the ingredient is
typically blended with either highly digestible soy protein or the lower digestible potato
protein. Apparent digestibility of squid liver meal may change depending on which
ingredient is included which may explain the large difference in ACPD between the
current study and the results reported for Penaeus monodon (Merican and Shim, 1995).
While the ACPD coefficients obtained in this study may not be completely
applicable for other species of shrimp due to species specific protein digestion (Lemos et
al., 2000), these values may still serve as an estimate, especially where species-specific
data are not yet available.
Apparent energy digestibility
Purified ingredients were highly digested and produced the highest AED
coefficients of all ingredient classifications. The AED coefficient obtained in this study
for wheat gluten was numerically lower than that obtained for L. setiferus (Brunson et
al., 1997). A similar AED value was originally obtained for wheat gluten using the same
calculation method (Cho et al., 1982) utilized by Brunson et al. (1997). The wheat

100
gluten coefficient was reduced to 99.5% after recalculation using the formula suggested
by Bureau and Hua (2006) which has been shown to account for the mathematical errors
in the Cho et al (1982) calculation. Brunson et al. (1997) attributed the 106% AED to
associative effects among ingredients; however, digestibility coefficients in the current
study were adjusted on average 5% when recalculated by the method suggested by
Bureau and Hua (2006). The lack of apparent nutrient associations determined in this
study may be attributed to the use of the calculation method as the elevated AED
coefficient originally obtained in this study for wheat gluten most likely would have
been attributed to a nutrient interaction.
The high ADMD (92.3%) and AED (98.9%) for wheat starch reported in this
study helps to explain why starch may replace protein in diets without decreasing growth
(Cruz-Suarez et al., 1994) as well as why high levels of wheat starch were efficiently
utilized by L. vannamei (Cousin, 1995). Davis et al (1993) however, reported a
comparatively low ADMD (51%) and an AED (71%) for wheat starch fed to L.
vannamei. Since both studies utilized the same experimental and extrusion methods the
differences illustrate how apparent digestibility coefficients can vary for feed ingredients
based on the environmental, physiological, and dietary conditions under which the
measurements were made. The effect of these factors on carbohydrate digestion was
determined by Gaxiola et al. (2005) who reported L. vannamei hexokinase IV-like
specific activity was affected by synergistic effects between dietary carbohydrate,
salinity and moult stage. These complexities and interaction in L. vannamei digestion
make obtaining an absolute value nearly impossible; however, apparent digestibility

101
coefficients still allow for the determination of a defined range for each ingredient and
provide a valuable measure to formulate cost-effective, environmentally-friendly feeds.
AED coefficients for the fish meals evaluated in this study were consistently high
ranking them ahead of all other classifications except purified ingredients. The high
AED suggests the lipid fractions, which are an excellent source of essential fatty acids,
contained within the fish meals were highly digested even though dietary lipid exceeded
10% for many of the fish meal digestibility diets. This high digestibility also may help
to explain why fish meal replacement using solvent-extracted soybean meals, which
appeared to have a low lipid digestibility in this study, do not always produce equivalent
growth responses in L. vannamei (Lim and Dominy, 1990).
The low AED for corn gluten meal was surprising as Davis and Arnold (1995)
reported an increase in AED values with increased processing; however, the ADE in this
study is higher than the value obtained for steam cracked corn (Davis and Arnold, 1993).
Steam cracked corn had the lowest ADMD and AED of ingredients tested by Davis and
Arnold (1993) while corn gluten meal had the second lowest ADMD, and lowest AED
and ACPD of all ingredients tested in this study. Extruded corn products have produced
high AED coefficients; however, this effect is attributed to the increased gelatinization
which occurs during extrusion (Davis and Arnold, 1995). High AED coefficients were
obtained for cooked corn using Procambarus clarkii (Brown et al., 1989) and
Macrobrachium rosenbergii (Law et al., 1990); however, AED values for non cooked
corn products for these species are not available for comparison.

102
AED coefficients for crab meal were much higher than those reported for
Penaeus setiferus and suggest L. vannamei has a much higher chitinase activity.
Chitinases permit the digestion of chitinous exoskeletons which account for the majority
of the ash in crab meal. Studies have shown L. vannamei has chitinase activity and is
effectively able to digest chitin (Lee and Lawrence, 1982). While P. setiferus also
possesses chitinase activity, its ability to digest chitin is limited to 25% of the available
chitin when dietary levels are in excess of 40 g kg-1 (Clark et al., 1993).
Apparent energy digestibility was positively correlated to apparent crude protein
digestibility which is not surprising as the majority of energy in the dietary ingredients
tested comes from protein. Additional ingredients which possess the majority of their
energy as carbohydrates need to be tested to assess L. vannamei’s ability to utilize this
source of energy. It is unfortunate that no direct comparison of the energy digestibility
coefficients obtained in this study could be compared to previously reported data from L.
vannamei, or in most cases other species of shrimp, as no published reports exist for the
ingredients tested.
In vitro experiments
In vitro determination of apparent crude protein coefficients
In vitro ACPD coefficients were positively correlated (r=0.55; P<0.05) to in vitro
values obtained using 0.0002% pepsin. These preliminary results are promising as in
vitro determinations are fast, inexpensive and can be performed in settings not
appropriate for in vivo work. The r value obtained in this study is the same as that
obtained for the pH-drop method (r2=0.55) but lower than that obtained for the pH-stat

103
correlated method (r2=0.73 to 0.80; Ezquerra et al., 1998). Utilization of 0.0002%
pepsin tended to underestimate the digestibility of samples with high ash content and
overestimate the digestibility of poorly digested samples which also was witnessed in
samples analyzed using the pH-drop method (Ezquerra et al., 1998). The lack of
correlation using 0.20% pepsin is not surprising as L. vannamei does not possess this
enzyme in their digestive tract (Lee and Lawrence, 1982). While these preliminary
results suggest dilute concentrations of pepsin may be utilized to approximate in vivo
results, Lemos (2003) reported pepsin digestibility is not applicable for prepared feeds
and plant ingredients. Considerably more research needs to be undertaken before the
results can be used to supplement in vivo digestibility trials involving L. vannamei. In
vitro digestibility results will only be able to replace in vivo work if they can predict the
complex nature of shrimp digestion, which has been shown to be modulated by the
components in the feed producing 10-44% differences in ADC over a control (Cordova-
Murueta and Garcia-Carreno, 2002). While in vitro methods have improved greatly, it
still appears they are not able to replace in vivo apparent digestibility trials especially
when one wishes to determine more than apparent protein digestibility.
104
CHAPTER IV
SUMMARY AND CONCLUSIONS
Summary
Similar apparent consumption between the 25 and 35% crude protein diets (0.32
and 0.31 g-feed day-1 shrimp-1; Figures 1 and 2, respectively) appears to suggest that L.
vannamei regulates feed intake to meet an energy requirement as opposed to a protein
requirement. This apparent ability to consume a diet to meet an energy level may
explain the conflicting results in ad-libitum feeding studies which have attempted to
determine optimum dietary protein requirements (as well as other dietary components)
for L. vannamei as well as other species of shrimp. Ad-libitum requirement studies
which have utilized diets low in digestible energy would be consumed at a greater level
than diets with higher levels of digestible energy leading to different apparent dietary
requirements. Since few, if any, of these requirement studies have cited dietary
digestible energy content or measured diet consumption, there exists the possibility that
many nutrient requirement studies may need to be reevaluated to determine their
accuracy.
In the present study, protein conversion efficiency for maximum growth was
more efficient in shrimp fed the 25% protein diet (35.9%; Table 9) as opposed to the
35% protein diet (30.6%; Table 10), although, growth was lower for shrimp fed that diet.
This suggests shrimp which consumed the 25% protein diet lacked an adequate amount
105
of ingested protein to produce the same growth rate as observed in those fed the 35%
protein diet but were able to more efficiently utilize the available protein for growth, as
opposed to energy compared to shrimp fed the 35% protein diet. Based on the results
from this study, it appears to optimize protein utilization for growth the digestible energy
(DE) level of the 25% protein diet would need to be lowered to increase dietary intake or
the digestible protein level in the 35% protein diet would need to be lowered while
maintaining the same DE. The high level of ash (22%) and fiber (10%) already
contained in these diets may reduce one’s success in lowering dietary energy enough to
increase consumption before the gut capacity of the shrimp is exceeded. Therefore it
seems prudent to attempt to reduce the protein level in the 35% diet to reach an ideal
protein/energy ratio where protein is maximally utilized for growth as opposed to
energy.
Accurate digestible protein and energy requirements are needed to precisely
formulate diets to meet nutritional requirements as well as to effectively allow cost
substitution of ingredients and reduce waste production. While adequate dietary protein
requirements have been estimated, few studies have determined daily digestible protein
and energy requirements for L. vannamei. This study utilized two diets (25 and 35%
crude protein) fed at 10 different feed rates to produce differences in shrimp specific
growth rate which were regressed against daily digestible protein and energy intake to
estimate the daily digestible protein and energy requirements. The mean apparent daily
digestible protein requirement for 7.69 to 13.08 g L. vannamei fed the 25% protein diet
was 0.067 g DP shrimp-1 day-1 (6.31 g DP kg-1 BW d-1) while the 35% protein diet

106
produced a mean apparent digestible protein requirement of 0.090 g DP shrimp-1 day-1
(8.00 g DP kg-1 BW d-1) for 8.11 to 13.79 g L. vannamei. Maintenance requirements
were estimated by regressing the digestible crude protein feed rates back to zero and was
0.11 g DP shrimp-1 day-1 (1.03 g DP kg-1 BW d-1) for L. vannamei fed the 25% protein
diet and 0.021 g DP shrimp-1 day-1 (1.87 g DP kg-1 BW d-1) for L. vannamei which
consumed the 35% protein diet. The mean apparent daily DE requirement for L.
vannamei fed the 25% protein diet was 4.276 kJ DE shrimp-1 day-1 (402.6 kJ DE kg-1
BW d-1) while the 35% protein diet produced an apparent daily DE requirement of 3.765
kJ DE shrimp-1 day-1 (334.7 kJ DE kg-1 BW d-1) for L. vannamei. Mean apparent daily
DE maintenance requirements for L. vannamei fed the 25% protein diet was 0.702 kJ DE
shrimp-1 day-1 (66.2 kJ DE kg-1 BW d-1) while the requirement was 0.887 kJ DE shrimp-1
day-1 (78.8 kJ DE kg-1 BW d-1) for L. vannamei fed the 35% protein diet.
The apparent digestible protein requirement for maximum growth decreased
throughout the 7-week trial from 8.97 g DP kg-1 BW d-1 at week 2 for 7.69 g shrimp to
5.04 g DP kg-1 BW d-1 at week 7 for 13.08 g shrimp fed the 25% protein diet. A similar
reduction was witnessed for those shrimp which consumed the 35% protein diet as the
apparent protein requirement decreased from 10.24 g DP kg-1 BW d-1 at week 2 for 8.11
g shrimp to 7.11 g DP kg-1 BW d-1 at week 7 for 13.79 g shrimp. Apparent daily energy
requirements for maximum growth also decreased throughout the 7-week trial as shrimp
size increased. Apparent daily DE requirements for maximum growth at week 2 for 7.69
g shrimp was 540.1 kJ DE kg-1 BW d-1 while the apparent requirement was only 322.8
kJ DE kg-1 BW d-1 at week 7 for 13.08 g L. vannamei which consumed the 25% protein
107
diet. Apparent daily DE requirement also decreased for shrimp fed the 35% protein diet
from 428.9 kJ DE kg-1 BW d-1 for 8.11 g L. vannamei at week 2 to 296.7 kJ DE kg-1 BW
d-1 for 13.79 g shrimp at week 7. The reduction in apparent protein requirement has
been attributed to a reduction in growth potential as shrimp get larger; however,
maximum weekly growth throughout the 7-week trial was linear. This suggests the
reduced apparent protein requirement may be partially explained by a reduction in
protein digestibility as L. vannamei grows older (Chapter III, Table 25). This reduction
in apparent protein digestibility combined with constant energy digestibility (Chapter III,
Table 25) suggests their ability to utilize carbohydrates and lipids as energy, as opposed
to dietary protein, increases with age which may contribute to the reduction in apparent
protein requirement witnessed in this study.
Daily digestible protein and energy requirements also were determined by
regressing body compositional data against daily digestible protein and energy intake.
Daily digestible protein requirements for maximum growth for the 13.08 g shrimp fed
the 25% protein diet obtained from body compositional analysis was 0.066 g DP shrimp-
1 day-1 and 0.098 g DP shrimp-1 day-1 for 13.79 g shrimp fed the 35% protein diet.
Maintenance requirements were 0.014 g DP shrimp-1 day-1 for the 13.08 g shrimp fed the
25% protein diet and 0.030 g DP shrimp-1 day-1 for the 13.79 g shrimp fed the 35%
protein diet. DE requirements for maximum weight gain obtained from energy
deposition was 4.330 kJ DE shrimp-1 day-1 for 13.08 g L. vannamei fed the 25% protein
diet and 4.167 kJ DE shrimp-1 day-1 for 13.79 g shrimp fed the 35% protein diet.
Although protein and energy requirements are crucial for developing a true least-cost

108
least-polluting diet, they must be combined with accurate digestible protein and energy
data for ingredients commonly used in the aquaculture industry.
Significant differences in apparent crude protein digestibility (ACPD) were
determined for the five different weight classes of L. vannamei fed the standard
reference diet. Differences in ACPD reported in this study are similar to those reported
for L. setiferus (Fenucci et al., 1982) and suggests L. vannamei utilizes protein more
efficiently at sizes less than 9.75 g. Apparent dry matter digestibility (ADMD) values
were between 41.8 and 96.8% and were highest for the purified ingredients. Significant
differences in ADMD were not determined between high protein and high carbohydrate
purified ingredients which suggests L. vannamei are able to utilize carbohydrates as
efficiently as protein provided dietary levels are within reason. ADMD coefficients for
soybean meal increased with the level of ingredient refinement and protein content from
63.5% for full fat soybean meal to 78.7% for 90% isolated soybean protein. This
increase in ADMD can be attributed to the highly digestible protein contained in these
ingredients and suggests the lipid fraction is poorly digested in the full fat and 48%
soybean meals. The poor utilization of the lipid fraction may be due to the high (>10%)
dietary level of lipid in the digestibility diets as L. vannamei has been shown to poorly
utilize dietary lipid above 10% (Dokken, 1987).
Apparent protein digestibility coefficients from this study compare very
favorably with previously reported data for L. vannamei (Akiyama et al., 1989) using a
single feedstuff. The lack of differences between the studies suggests ACPD
coefficients are minimally affected by nutrient associations (current study) or

109
nutritionally incomplete diets (Akiyama et al., 1989) provided the respective
experimental methods are followed. Fish meal ACPD coefficients as a group were
higher than all other ingredient classifications except purified ingredients. The high
ACPD obtained for fish meals, combined with their balanced essential amino acid
profile, implies their relative importance in dietary formulations and helps to explain
why fish meal substitution with animal and by-product meals is not always successful.
The plant protein in both 48% and 90% crude protein soybean meal was significantly
more digestible than the protein found in the fish, animal and marine meals tested.
These results suggest the importance plant proteins may have in replacing fish meals
from L. vannamei diets; however high ACPD coefficients alone will not predict the
ingredients ability to support growth as plant proteins are typically low in the essential
amino acids lysine and methionine. Apparent digestibility coefficients for protein need
to be combined with apparent amino acid digestibility to allow effective substitution of
low priced plant ingredients for higher priced fish meals. It is interesting to note that
despite the commercial use of krill and squid muscle meals in penaeid diets, previous
ACPD coefficients have not been reported. The marine protein in both squid muscle
meals produced ACPD coefficients which were statistically equivalent to those obtained
by the fish meals with the highest ACPD coefficients. Similarly, the protein in krill flour
was only significantly less digestible than the protein contained in purified ingredients
and was statistically equivalent to the fish meals with the highest ACPD coefficients.
While the ACPD coefficients obtained in this study may not be completely applicable
for other species of shrimp due to species specific protein digestion (Lemos et al., 2000),

110
these values may still serve as an estimate, especially where species specific data is not
yet available.
The high ADMD (92.3%) and AED (98.9%) for wheat starch reported in this
study helps to explain why starch may replace protein in diets without decreasing growth
(Cruz-Suarez et al., 1994) as well as why high levels of wheat starch were efficiently
utilized by L. vannamei (Cousin 1995). Apparent energy digestibility (AED)
coefficients for the fish meals evaluated in this study were consistently high ranking
them ahead of all other classifications except purified ingredients. The high AED
suggests the lipid fractions, which are an excellent source of essential fatty acids,
contained within the fish meals were highly digested even though dietary lipid exceeded
10% for many of the fish meal digestibility diets. This high digestibility may also help
to explain why fish meal replacement using solvent-extracted soybean meals, which
appeared to have a low lipid digestibility in this study, do not always produce equivalent
growth responses in L. vannamei (Lim and Dominy, 1990). The low AED for corn
gluten meal was surprising as Davis and Arnold (1995) reported an increase in AED
values with increased processing; however, the ADE in this study is higher than the
value obtained for steam cracked corn (Davis and Arnold, 1993). Steam cracked corn
had the lowest ADMD and AED of ingredients tested by Davis and Arnold (1993) while
corn gluten meal had the second lowest ADMD, and lowest AED and ACPD of all
ingredients tested in this study. Extruded corn products have produced high AED
coefficients; however, this effect is attributed to the increased gelatinization which
occurs during extrusion (Davis and Arnold, 1995).

111
In vivo ACPD coefficients were positively correlated (r=0.55; P<0.05) to in vitro
values obtained using 0.0002% pepsin. Utilization of 0.0002% pepsin tended to
underestimate the digestibility of samples with high ash content and overestimate the
digestibility of poorly digested samples which was also witnessed in samples analyzed
using the pH-drop method (Ezquerra et al., 1998). While these preliminary results
suggest dilute concentrations of pepsin may be utilized to approximate in vivo results,
Lemos (2003) reported pepsin digestibility is not applicable for prepared feeds and plant
ingredients. Considerably more research needs to be undertaken before the results can
be used to supplement in vivo digestibility trials involving L. vannamei.
Conclusions
• Similar apparent consumption between the 25 and 35% crude protein diets (0.32
and 0.31 g-feed day-1 shrimp-1; Figures 1 and 2, respectively) appears to suggest
L. vannamei regulates their feed intake to meet an energy requirement as opposed
to a protein requirement.
• It appears neither diet utilized in this study was optimally balanced in terms of an
ideal protein/energy ratio. This ratio needs to be optimized to allow protein to be
maximally utilized for growth as opposed to energy.
• Daily digestible protein and energy requirements determined by regressing body
compositional data against daily digestible protein and energy intake were very
similar to those values obtained by regressing changes in growth against daily
digestible values. This suggests growth changes in body composition are a valid
method to estimate requirements.

112
• The apparent digestible protein and energy requirements for maximum growth
decreased throughout the 7 week even though maximum weight gain was linear.
This decrease in apparent requirement may be attributed to the change in molting
frequency or the decrease in protein digestibility with age.
• Significant differences in ACPD were determined for the 5 different weight
classes of L. vannamei fed the standard reference diet which suggests L.
vannamei utilizes protein more efficiently at sizes less than 9.75 grams.
• Purified ingredients had the highest ADMD, ACPD and AED coefficients of all
ingredients tested which suggests digestibility is greatly enhanced as the level of
refinement increases.
• The high ACPD obtained for fish meals, combined with their balanced essential
amino acid profile, implies their relative importance in dietary formulations and
helps to explain why fish meal substitution with animal and by-product meals is
not always successful.
• The plant protein in both 48% and 90% soybean meal was significantly more
digestible than the protein found in the fish, animal and marine meals tested.
These results suggest the importance plant proteins may have in removing fish
meals from L. vannamei diets.
• In vivo ACPD coefficients were positively correlated (r=0.55; P<0.05) to in vitro
values obtained using 0.0002% pepsin and suggests in vitro studies may someday
approximate in vivo studies.
113
REFERENCES
Akiyama, D.M., 1988. Soybean meal utilization by marine shrimp. American Soybean Association, Singapore.
Akiyama, D.M., Coelho, S.R., Lawrence, A.L., Robinson, E.H., 1989. Apparent digestibility of feedstuffs by the marine shrimp Penaeus vannamei Boone. Nippon Suisan Gakkaishi 55, 91-98.
Akiyama, D.M., 1991. Soybean meal utilization by marine shrimp. In: Akiyama, D.M., Tan, R.K.H. (Eds.), Proceedings of the Aquaculture Feed Processing and Nutrition Workshop, Thailand and Indonesia, September 19-25. American Soybean Assoc., Singapore, pp. 201-225.
Akiyama, D.M., Dominy, W.G., Lawrence, A., 1992. Penaeid shrimp nutrition. In: Fast, A.W., Lester, J. (Eds.), Marine Shrimp Culture: Principles and Practices. Elsevier, Amsterdam, pp. 535-567.
Alava, V.R., Pascual, F.P., 1987. Carbohydrate requirements of P. monodon (Fabricius) juveniles. Aquaculture 61, 211-217.
Anderson, S.J., Lall, S.P., Anderson, D.M., McNiven, M.A., 1993. Evaluation of protein quality in fish meals by chemical and biological assays. Aquaculture 115, 305-325.
Andrews, J.W., Sick, L.V., Baptist, G.J., 1972. The influence of dietary proteins and energy levels on growth and survival of penaeid shrimp. Aquaculture 1, 341-347.
AOAC, 1990. Official Methods of Analysis, 15th ed., Vol. 1. Association of Official Analytical Chemists, Arlington, VA, USA
Aquacop, 1989. Production results and meeting operating costs of the first super intensive shrimp farm in Tahiti. Abstract from the 1989 WAS Meeting, Los Angeles
Aranyakananda, P., 1995. Dietary protein and energy requirements of Penaeus vannamei and the optimal protein to energy ratio. Ph.D Dissertation, Texas A&M University., College Station, TX, 95 pp.
Beck, F., 1987. Untersuchungen zum Protein- und Energieerhaltungsbedarf der Regenbogenforelle (Salmo gairdneri Richardson): Schatzung der Hungerverluste. Dissertation Universitat Munchen, Munchen, pp. 143.
Beseres, J.J., Lawrence, A.L., Feller, R.J., 2005. Variation in fiber, protein, and lipid content of shrimp feed—effects on gut passage times measured in the field. Journal of Shellfish Research 24, 301-308.
Bhaskar, T.I.C.J., Ali, S.A., 1984. Studies on the protein requirement of postlarval of the penaeid prawn Penaeus indicus H. Milne Edwards using purified diets. Indian Journal of Fisheries 31, 74-81.
Boonyaratpalin, M., 1978. Effect of dietary levels of energy and protein on voluntary food consumption, growth, and body and serum composition of channel catfish. Ph.D. Dissertation, Auburn University, Auburn, AL, pp. 77.

114
Boothby, R.N., Avault, J.W., 1971. Food habits, length weight relationships, and condition factor of the red drum (Sciaenops ocellatus) in southeastern Louisiana. Trans American Fishery Society 100, 290-295.
Bordner, C.E., D’Abramo, L.R., Conklin, D.E., 1983. Assimilation of nutrients by cultured hybrid lobsters (Homarus sp.) fed experimental diets. Proceedings of the World Mariculture Society 14, 11-24.
Boujard, T., Medale, F., 1994. Regulation of voluntary feed intake in juvenile rainbow trout fed by hand or by self-feeders with diets containing two different protein/energy ratios. Aquatic Living Resource 7, 211-215.
Boyd, C., Clay, J., 1998. Shrimp aquaculture and the environment. Scientific American June, 58-65.
Bray, W.A., Lawrence, A.L., Leung-Trujillo, J.R., 1994. The effect of salinity on growth and survival of Penaeus vannamei, with observations on the interaction of IHHN virus and salinity. Aquaculture 122, 133-146.
Brett, J.R., Groves, T.D.D., 1979. Physiological energetics. In: Hoar, W.S., Randall, D.J., Brett, J.R. (Editors), Fish Physiology, Vol. VIII. Academic Press, New York, NY, pp. 279-352.
Bromley, P.J., Adkins, T.C., 1984. The influence of cellulose filler on feeding, growth and utilization of protein and energy in rainbow trout, Salmo gairdnerii Richardson. Journal of Fishery Biology 24, 235-244.
Brown, P.B., Williams, C.D., Robinson, E.H., 1986. Evaluation of methods for determining digestion coefficients for adult red swamp crayfish Procambarus clarkii. Journal of the World Aquaculture Society 17, 19-24.
Brown, P.B., Robinson, E.H., Clark, A.E., Lawrence, A.L., 1989. Apparent digestible energy coefficients and associative effects in practical diets for red swamp crayfish. Journal of the World Aquaculture Society 20, 122-126.
Brunson, R.P., Romaire, R.P., Reigh, R.C., 1997. Apparent digestibility of selected ingredients in diets for white shrimp Penaeus setiferus L. Aquaculture Nutrition 3, 9-16.
Bureau, D.P., Hua, K., 2006. Letter to the Editor of Aquaculture. Aquaculture 252, 103-105.
Cam, D., Cuzon, G., Aquacop, 1995. Effect of rationing whether one or two meal a day with an extruded feed for juvenile P. vannamei. Impact on FCR. International Ifremer Rep. 27 pp.
Chen, H.Y., 1998. Nutritional requirement of the black tiger shrimp: Penaeus monodon. Review in Fisheries Science 6, 79-95.
Chen, J.C., Lei, S.C., 1990. Toxicity of ammonia and nitrite to Penaeus monodon juveniles. Journal of the World Aquaculture Society 21, 300-306.
Chen,J.C., Lin, C.Y., 1991. Lethal effects of ammonia and nitrite on Penaeus penicillatus juveniles at two salinity levels. Comparative Biochemistry and Physiology 100C, 477-482.
Chevalier, P. L., Wormhoudt, A. V., 1998. Alpha-glucosidase from the hepatopancreas of the shrimp, Penaeus vannamei (Crustacea-Decapoda). The Journal of Experimental Zoology 280, 384-394.

115
Cho, C., 1992. Feeding systems for rainbow trout and other salmonids with reference to current estimates of energy and protein requirements. Aquaculture 100, 107-123.
Cho, C.Y., Slinger, S.J., Bayley, H.S., 1982. Bioenergetics of salmonid fishes: energy intake, expenditure ad productivity. Comparative Biochemistry and Physiology 73B, 25-41.
Clark, D.J., Lawrence, A.L., Swakon, D.H.D., 1993. Apparent chitin digestibility in panaeid shrimp. Aquaculture 109, 51-57.
Coelho, S.R., 1984. Effects of environmental salinity and dietary protein levels on digestibility in four species of penaeid shrimp. Master’s thesis, Texas A&M University, College Station, TX, USA, 1-66.
Colvin, L.B., Brand, C.W., 1977. The protein requirement of penaeid shrimp at various life cycle stages in controlled environmental systems. Proceedings of the World Mariculture Society 8, 821-840.
Colvin, P.M., 1976. Nutritional studies on penaeid prawns: protein requirements in compounded diets for juvenile Penaeus indicus (Milne Edwards). Aquaculture 7, 315-326.
Cordova-Murueta, J.H., Garcia-Carreno, F.L., 2002. Nutritive value of squid and hydrolyzed protein supplement in shrimp feed. Aquaculture 210 371-384.
Cordova_Murueta, J.H., Garcia-Carreno, F.L., Navarrete-del-Toro, M.A., 2003. Digestive enzymes present in crustacean feces as a tool for biochemical, physiological, and ecological studies. Journal of Experimental Biology and Ecology 297, 43-56.
Cordova-Murueta, J.H., Garcia-Carreno, F.L., Navarrete-del-Toro, M.A., 2004. Effect of stressors on shrimp digestive enzymes from assays of feces: an alternate method of evaluation. Aquaculture 233, 439-449.
Cousin, M., Cuzon, G., Blanchet, E., Ruelle, F., 1991. Protein requirements following an optimum dietary energy to protein ration for Penaeus vannamei juveniles. In: Kaushik, S.J., Liquet, P. (Eds.), Fish Nutrition in Practice. Institut National de la Recherche Agronomique, Paris, France, pp. 599-606.
Cousin, M., 1995. Etude de l’utilisation des glucides et du rapport proteins-energie chez les deux especes de crevettes peneides, Penaeus vannamei et Penaeus stylirostris. These, INRA Paris Grignon.
Cruz-Ricque, L.E., Guillaume, J., 1987. Squid protein effect on growth of four Penaeid shrimp. Journal of the World Aquaculture Society 18, 209-217.
Cruz-Suarez, L.E., Ricque-Marie, D., Pinal-Mansilla, J.D., Wesche-Ebelling, P., 1994. Effect of different carbohydrate sources on the growth of Penaeus vannamei: economical impact. Aquaculture 123, 349-360.
Cui, Y., Liu, J., 1990. Comparison of energy budget among six teleosts—II. Metabolic rates. Comparitive Biochemistry and Physiology 97A, 169-174.
Cushing, D.H., 1968. Fisheries Biology, A study in Population Dynamics. University of Wisconsin Press, Madison, WI, 200 pp.
Cuzon, G., Lawrence, A., Gaxiola, G., Rosas, C., Guillaume, J., 2004. Nutrition of Litopenaeus vannamei reared in tanks or in ponds. Aquaculture 235, 513-551.

116
D’Abramo, L.R., Casttell, D., 1997. Research Methodology. In: D’Abramo, L/R/, Conklin, D.E., Akiyama, D.E. (Eds.), Crustacean Nutrition. World Aquaculture
Society, Baton Rouge, LA, USA, pp. 3-20. Davis, D.A., Arnold, C.R., 1993. Evaluation of five carbohydrate sources for Penaeus
vannamei. Aquaculture 114, 285-292. Davis, D.A., Arnold, C.R., 1995. Effects of two extrusion processing conditions on the
digestibility of four cereal grains for Penaeus vannamei. Aquaculture 133, 287-294.
Davis, D.A., Arnold, C.R., McCallum, I., 2002. Nutritional value of feed peas (Pisum sativum) in practical diet formulations for Litopenaeus vannamei. Aquaculture Nutrition 8, 87-94.
Deering, M.J., Hewitt, D.R., Sarac, H.Z., 1996. A comparison of inert markers used to estimate protein digestibility in the leader prawn Penaeus monodon. Journal of the World Mariculture Society 27, 103-106.
Deshimaru, O., Yone, Y., 1978. Optimal level of dietary protein for prawn. Bulletin of the Japanese Society of Scientific Fisheries 44, 1395-1397.
Divakaran, S., 2005. Chromic oxide: The inert marker for in vivo digestibility studies in shrimp, problems and solutions. Aqua Feeds: Formulation and Beyond 2, 28-29.
Dokken, Q.R., 1987. Effects of varying dietary macronutrient and energy rations on growth and survival of Penaeus vannamei and Penaeus setiferus. Ph.D. Dissertation, Texas A&M University, College Station, TX, 80 pp.
Ege, R., Krogh, A., 1914. On the relation between the temperature and the respiratory exchange in fishes. Int. Revue ges. Hydrobiol. Hydrogr. 1, 48-55.
Egusa, S., 1961. Studies on the respiration of the ‘kuruma’ prawn, Penaeus japonicus Bate. II. Preliminary experiments on its oxygen consumption. Bulletin of the Japanese Society of Fish 27, 650-659.
Ezquerra, J.M., Garcia-Carreno, F.L., Civera, R., Haard, N.F., 1997. pH-stat method to predict protein digestibility in white shrimp (Penaeus vannamei). Aquaculture 157, 251-262.
Ezquerra, J.M., Garcia-Carreno, F.L., Carrillo, O., 1998. In vitro digestibility of dietary protein sources for white shrimp (Penaeus vannamei). Aquaculture 163, 123-136.
Fenucci, J.L., Fenucci, A.C., Lawrence, A.L., Zein-Elden, Z.P., 1982. The assimilation of protein and carbohydrate from prepared diets by the shrimp, Penaeus stylirostris. Journal of the World Mariculture Society 13, 134-145.
Forster, J.R.M., Gabbot, P.A., 1971. The assimilation of nutrients from compounded diets by the prawns Palaemon serratus and Pandalus platyceros. Journal of the Marine Biological Association of the United Kingdom 51, 943-961.
Fox, J.M., Lawrence, A.L., Chan, E.L., 1995. Dietary requirement for lysine by juvenile Penaeus vannamei using intact and free amino acid sources. Aquaculture 131, 279-290.
Garcia-Carreno, F.L., Navarrete del Toro, A., Ezquerra, J.M., 1997. Digestive shrimp proteases for evaluation of protein digestibility in vitro: I. Effect of protease inhibitors in protein ingredients. Journal of Marine Biotechnology 5, 36-40.

117
Garcia-Carreno, F.L., 1998. Prediction of protein digestibility in shrimp and use of second generation protein ingredients in aquaculture feeds. In: IV International Symposium Nutrition in Aquaculture. La Paz, BCS, Mexico, November 15-18. CIBNOR, La Paz, BCS, Mexico, Conference.
Gatlin, D.M., Poe, W.E., Wilson, R.P., 1986. Protein and energy requirements of fingerling channel catfish for maintenance and maximum growth. Journal of Nutrition 116, 2121-2131.
Gaxiola, G., Cuzon, G., Garcia, T., Taboada, G., Brito, R., Chimal, M.E., Paredes, A., Soto, L., Rosas, C., Wormhoudt, A., 2005. Factorial effects of salinity, dietary carbohydrate and moult cycle on digestive carbohydrases and hexokinases in Litopenaeus vannamei (Boone, 1931). Comparative Biochemistry and Physiology, Part A 140, 29-39.
Guillaume, J., 1997. Protein and amino acids. In: D’Abramo, L/R/, Conklin, D.E., Akiyama, D.E. (Eds.), Crustacean Nutrition. World Aquaculture Society, Baton Rouge, LA, USA, pp. 26-50.
Hogendoorn, H., 1983. Growth and production of the African catfish, Clarias lazera. III. Bioenergetic relations of body weight and feeding level. Aquaculture 35, 1-17.
Huggins, A.K., Munday, K.A., 1968. Crustacean metabolism. In: Advances in Comparative Physiology and Biochemistry. O. Lowenstein (ed.) Academic Press, New York pp. 271-278.
Kanazawa, A., 1990. Protein requirements of Penaeid shrimp. In Barret J. (ed.), Advances in Tropical Aquaculture Workshop in Thahiti, Feb 20 – March 4, 1989. AQUACOP IFREMER Actes de Colloque 9, 261-270.
Kentouri, M., Divanach, P., Geurden, I., Anthouard, M., 1995. Evidence of adaptive behaviour in gilthead seabream (Sparus aurata L.) in relation to diet composition, in a self-feeding condition. Ictyophysiology Acta 18, 125-143.
Kleiber, M., 1965. Metabolic body size, In: In Energy Metabolism. (Blaxter, J.H.S. ed.), pp. 427-435. Academic Press, London.
Kureshy, N., Davis, D.A., 2002. Protein requirement for maintenance and maxium weight gain for the Pacific white shrimp, Litopenaeus vannamei. Aquaculture 204, 125-143.
Lan, C.C., Pan, B.S., 1993. In-vitro digestibility simulating the proteolysis of feed protein in the midgut gland of grass shrimp (Penaeus monodon). Aquaculture 109, 59-70.
Law, A.T., Chin, K.S.S., Ang, K.J., Kamarudin, M.S., 1990. Digestibility of low cost ingredients in pelleted feeds by Macrobrachium rosenbergii (De Man). In: Hirano R., Hanyu, I., (Eds.), The Second Asian Fisheries Forum. The Asian Fisheries Society, Manila, Philippines. Pp. 333-3336.
Lawrence, A., Castille, F., 1993. Growth, survival and consumption rate of Penaeus vannamei to feeds containing different levels of fish, krill and Artemia meals. Special Publication of the European Aquaculture Society

118
Lawrence, A., Castille, F., Samocha, T., Velasco, M., 2001. “Environmentally friendly” or “least polluting” feed and feed management for aquaculture. In: Browdy, C.L., Jory, D.E. (Eds.), The new wave, proceedings of the special session on sustainable shrimp culture, Aquaculture 2001. The World Aquaculture Society, Baton Rouge, LA, USA, pp. 84-95.
Leavitt, D.F., 1985. An evaluation of gravimetric and inert marker techniques to measure digestibility in the American lobster. Aquaculture 47, 131-142.
Lee, D.L., 1970. Study on digestion and absorption of protein in artificial feeds by four species of shrimps. China Fisheries Monthly 208, 2-4.
Lee, P.G., Lawrence, A.L., 1982. A quantitative analysis of digestive enzymes in penaeid shrimp, influences of diet, age and species. Physiologist 25, 241.
Lee, P.G., Lawrence, A.L., 1997. Digestibility. In: D’Abramo, L/R/, Conklin, D.E., Akiyama, D.E. (Eds.), Crustacean Nutrition. World Aquaculture Society, Baton Rouge, LA, USA, pp. 194-260.
Lemos, D., Ezquerra, J.M., Garcia-Carreno, F.L., 2000. Protein digestion in penaeid shrimp: digestive proteinases, proteinase inhibitors and feed digestibility. Aquaculture 186, 89-105.
Lemos, D., 2003. In vitro determination of protein digestibility with enzymes from the target species. International Aqua Feed 6, 40-42.
Liao, I.C., Chen, Y.H., 1994. Culture of kuruma prawn in Asia. World Aquaculture 25, 18-33.
Lim, C., Dominy, W., 1990. Evaluation of soybean meal as a replacement for marine animal protein in diets for shrimp Penaeus vannamei. Aquaculture 87, 53-64.
Lopez, C., Velasco, M., Hinrichsen, J.P., Lawrence, A., Rutman, M., 1998. Effect of krill meal on Penaeus vannamei growth. Aquaculture ’98 Book of Abstracts 336.
Lovell, T., 1989. Nutrition and feeding of fish. Van Nostrand Reinhold, New York, New York, USA.
Lupatsch, I., Kissil, G. W., Sklan, D., Pfeffer, E., 1998. Energy and protein requirements for maintenance and growth in gilthead seabream (Sparus aurata L.). Aquaculture Nutrition 4, 165-173.
Lupatsch, I., Kissil, G.W., Sklan, D., Pfeffer, E., 2001. Effects of varying dietary protein and energy supply on growth, body composition and protein utilization in gilthead seabream (Sparus aurata L.). Aquaculture Nutrition 7, 71-80.
Lupatsch, I., Kissil, G.W., Sklan, D., 2003. Comparison of energy and protein efficiency among three fish species gilthead sea bream (Sparus aurata), European sea bass (Dicentrarchus labrax) and white grouper (Epinephelus aeneus): energy expenditure for protein and lipid deposition. Aquaculture 225, 175-189.
McGinnis, A.J., Kasting, R., 1964. Colorimetric analysis of chromic oxide used to study food utilization by phytophagous insects. Agricultural and Food Chemistry 12, 259-262.
119
McGoogan, B.B., Gatlin, D.M., 1998. Metabolic requirements of red drum, Sciaenops ocellatus, for protein and energy based on weight gain and body composition. Journal of Nutrition 128, 123-129.
Merican, Z.O., Shim, K.F., 1995. Apparent digestibility of lipid and fatty acids in residual lipids of meals by Penaeus monodon. Aquaculture 133, 275-286.
Mullen, J.D., Riley, J.P., 1955. The spectrophotometric determination of nitrite in natural waters, with particular reference to sea-water. Anal. Chim. Acta., 12, 464-480.
NRC (National Research Council). 1980. Nutrient Requirements of Warmwater Fishes and Shellfishes, Revised Edition. National Academy Press, Washington, D.C., U.S.A.
Page, J.W., Andrews, J.W., 1973. Interactions of dietary levels of protein and energy on channel catfish (Ictalurus punctatus). Journal of Nutrition 103, 1339-1346.
Paspatis, M., Boujard, T., 1996. A comparative study of automatic feeding and self- feeding in juvenile Atlantic salmon (Salmo salar) fed diets if different energy levels. Aquaculture 145, 245-257.
Pedrazzoli, A., Molina, C., Montoya, N., Townsend, S., Leon-Hing, A., Paredes, Y., Calderon, J., 1998. Recent advances on nutrition research of Penaeus vannamei in Equador. Reviews of Fisheries Science 61, 143-151.
Pfeffer, E., Pieper, A., 1979. Application of the factorial approach for deriving nutrient requirements of growing fish. In: Proc. World Symp. On Finfish Nutrition and Fishfeed Technology, Hamburg (1978). (Halver, J.E., Tiews, K., eds.), Vol. II., 545-553.
Pfeffer, E., Potthast, V., 1977. Advances in Animal Physiology and Animal Nutrition. Studies on Nutrition of Carp and Trout. Vol. 8, pp. 32-55. Paul Parey, Hamburg.
Ponce-Palafox, J., Martinez-Palacios, C.A., Ross, L.G., 1997. The effects of salinity and temperature on the growth and survival rates of juvenile white shrimp, Penaeus vannamei, Boone, 1931. Aquaculture 157, 107-115.
Pond, W.G., Church, D.C., Pond, K.R., 1995. Basic animal nutrition and feeding, 4th edn. John Wiley and Sons Inc., New York. 615 pp.
Ram, N., Ulitzur, S., Avnimelech, Y., 1981. Microbial and chemical changes occurring at the mud-water interface in experimental fish aquarium. Bamidgeh 33, 71-87.
Read, G.L.H., Caulton, M.S., 1980. Changes in mass and chemical composition during the moult cycle and ovarian development in immature and mature P. indicus Milne Edwards. Comparative Biochemistry and Physiology 66A, 431-437.
Reigh, R.C., Branden, S.L., Craig, R.J., 1990. Apparent digestibility coefficients for common feedstuffs in formulated diets for red swamp crayfish, Procambarus clarkii.. Aquaculture 84, 321-334.
Robbins, K.R., Norton, H.W., Baker, D.H., 1979. Estimation of nutrient requirements from growth data. Journal of Nutrition 109, 1710-1714.
Rosas, C., Sanchez, A., Diaz-Iglesia, E., Brito, R., Martinez, E., Soto, L.A., 1997. Critical dissolved oxygen level to Penaeus setiferus and P. schmitti postlarvae (PL10-18) exposed to salinity changes. Aquaculture 152, 259-272.

120
Rosas, C., Cuzon, G., Gaxiola, G., Priol, Y.L., Pascual, C., Rossignyol, J., Contreras, F., Sanchez, A., Wormhoudt, A.V., 2001a. Metabolism and growth of juveniles of Litopenaeus vannamei: effect of salinity and dietary carbohydrate levels. Journal of Experimental Marine Biology and Ecology 259, 1-22.
Rosas, C., Cuzon, G., Taboada, G., Pascual, C., Gaxiola, G., Van Wormhoudt, A., 2001b. Effect of dietary protein and energy levels on growth, oxygen consumption, haemolymph and digestive gland carbohydrates, nitrogen excretion and osmotic pressure of Litopenaeus vannamei (Boone) and L. setiferus (Linne) juveniles (Crustacea, Decapoda; Penaeidae). Aquaculture Research 32, 531-547.
Rosas, C., Cuzon, G., Gaxiola, G., Pascual, C., Taboada, G., Arena, L., Wormhoudt, A., 2002. An energetic and conceptual model of the physiological role of dietary carbohydrates and salinity on Litopenaeus vannamei juveniles. Journal of Experimental Marine Biology and Ecology 268, 47-67.
Sarac, Z., Thaggard, H., Saunders, J., Gravel, M., Neill, A., Cowan, R.T., 1993. Observations on the chemical composition of some commercial prawn feeds and associated growth responses in Penaeus monodon. Aquaculture 115, 97-110.
Scheer, B.T., Scheer, M.A.R., 1951. The hormonal regulation of metabolism in crustaceans. I. Blood sugar in spiny lobsters. Physiological Comparata Oecologica 2, 198-209.
Scheer, B.T., Schwabe, C.W., Scheer, M.A.R., 1952. The hormonal regulations of metabolism in crustaceans. III. Tissue oxidations in crustaceans. Physiologica Comparata Oecologica 2, 327-338.
Sedgwick, R.W., 1979. Influence of dietary protein and energy on growth, food consumption and food conversion in Penaeus merguiensis De Man. Aquaculture 16, 7-30.
Seidman, E.R., Lawrence, A.L., 1985. Growth, feed digestibility, and proximate body composition of juvenile Penaeus vannamei and Penaeus monodon grown at different dissolved oxygen levels. J. World Maricul. Soc. 16, 333-346.
Shearer, K.D., 1995. The use of factorial modeling to determine the dietary requirements for essential elements in fishes. Aquaculture 133, 57-72.
Shiau, S.Y., Chou, B., 1991. Effects of dietary protein and energy on growth performance of the tiger shrimp Penaeus monodon reared in seawater. NipponSuisan Gakkaishi 57, 2271-2276.
Shiau, S.Y., Lin, S.F., Lu, L.J., 1991. Effects of different types of wheat flour in feed for grass prawn Penaeus monodon. Nippon Suisan Gakkaishi 57, 705-710.
Shiau, S.Y., Lin, K.P., Chiou, C.L., 1992. Digestibility of different protein sources by Penaeus monodon raised in brackish water and in sea water. Journal of Applied Aquaculture 1, 47-53.
Shiau, S.Y., Peng, C.Y., 1992. Utilization of different carbohydrates at different dietary protein levels in grass prawns, Penaeus monodon, reared in seawater. Aquaculture 101, 241-250.
Shilo, M., Rimon, A., 1982. Factors which affect the intensification of fish breeding in Israel. 2. Ammonia transformation in intensive fish ponds. Bamidgeh 34, 101-114.

121
Smith, L.L., Lee, P.G., Lawrence, A.L., Strawn, K., 1985. Growth and digestibility by three sizes of Penaeus vannamei Boone: effects of dietary protein level and protein source. Aquaculture 46, 85-96.
Smith, D.M., Tabrett, S.J., 2004. Accurate measurement of in vivo digestibility of shrimp feeds. Aquaculture 232, 563-580.
Smith, D.M., Tabrett, S.J., Barclay, M.C., Irvin, S.J., 2005. The efficacy of ingredients included in shrimp feeds to simulate intake. Aquaculture Nutrition 11, 263-272.
Solarzano, L., 1969. Determination of ammonia in natural waters by the phenolhypochlorite method. Limnology and Oceanography 14, 799-801.
Solbe, J.F., 1978. Studies of the effects of pollution on freshwater fish. In: O. Ravera (Editor), Biological Aspects of Freshwater Pollution. Pergamon Press, Oxford, pp. 1-17.
Spotte, S., 1979a. Fish and invertebrate culture: water management in closed systems, 2nd ed. Wiley, New York, pp. 179.
Spotte, S., 1979b. Seawater aquariums: the captive environment. Wiley, New York, pp. 413.
Strickland, J.D.H., Parsons, T.R., 1972. A practical handbook of seawater analysis, 2nd ed. Bull. 167, Fish. Res. Board Can., Ottawa, pp. 310.
Teshima, S., Koshio, S., Ishikawa, M., Kanazawa, A., 2001. Protein requirement of the prawn Marsupenaeus japonicus estimated by a factorial method. Hydrobiologia 449, 293-300.
Velasco, M., Lawrence, A.L., Neill, W.H., 1998. Development of a static-water ecoassay with microcosm tanks for postlarval Penaeus vannamei. Aquaculture 161, 79-87.
Velasco, M., Lawrence, A.L., Neill, W.H., 1999. Effectos de la proteina y el fosforo dietario en la calidad de agua de acuacultura. In: Cruz, L.E., Mendoza, R.E., Ricque, D. (Eds.), Memorias del Tercer Simposium Internacional de Nutricion Acuicola. Universidad Autonoma de Nuevo Leon, Monterrey, Nuevo Leon, Mexico, pp. 597-612.
Wilson, R.P., Gatlin, D.M., III, Poe, W.E., 1985. Postprandial changes in serum amino acids of the channel catfish fed diets containing different levels of protein and energy. Aquaculture 49, 101-110.
Wyban, J., Walsh, W., Godin, D.M., 1995. Temperature effects on growth, feeding rate and feed conversion of the Pacific white shrimp (Penaeus vannamei)

122
APPENDIX A
COMPOSITION OF THE MINERAL-VITAMIN PREMIX
Table A-1. Composition of the mineral-vitamin premix. Nutrient Name Unit of
Measure Value Nutrient Name Unit of
Measure Value
Calcium % 0.08 Phenylalanine % 0.40 Phosphorus % 1.08 Phenyl-Tyrosine % 0.80
Sodium % 38.90 Threonine % 0.36 Potassium % 1.20 Tryptophan % 0.12
Magnesium % 0.56 Valine % 0.56 Iron PPM 72 Retinol IU/KG 600000 Zinc PPM 46072 Cholecalciferol IU/KG 500000
Manganese PPM 1100 Tocopherol MG/KG 40012 Copper PPM 12024 Thiamine MG/KG 7056
Arginine % 0.56 Riboflavin MG/KG 11001 Histidine % 0.24 Pyridoxine MG/KG 22003 Isoleucine % 0.44 Niacin MG/KG 22096 Leucine % 0.96 Pantothenic Acid MG/KG 8208 Lysine % 0.41 Biotin MG/KG 200
Methionine % 0.16 Folic Acid MG/KG 5000 Methionine/Cystine % 0.32 Cyanocobalam MG/KG 40 % = Percent. PPM = Parts per million. IU/KG = International units per kilogram. MG/KG = Milligrams per kilogram.

123
APPENDIX B
COMPOSITION OF THE VITAMIN-MINERAL PREMIX
Table B-1. Composition of the vitamin-mineral premix. Nutrient Name Unit of
Measure Value Nutrient Name Unit of
Measure Value
Calcium % 0.08 Phenylalanine % 0.40 Phosphorus % 1.08 Phenyl-Tyrosine % 0.80
Sodium % 38.90 Threonine % 0.36 Potasium % 1.20 Tryptophan % 0.12
Magnesium % 0.56 Valine % 0.56 Iron PPM 72 Retinol IU/KG 1100000Zinc PPM 72 Cholecalciferol IU/KG 500000
Manganese PPM 5300 Tocopherol MG/KG 40012 Copper PPM 24 Thiamine MG/KG 3556
Arginine % 0.56 Riboflavin MG/KG 5551 Histidine % 0.24 Pyridoxine MG/KG 11006 Isoleucine % 0.44 Niacin MG/KG 11096 Leucine % 0.96 Pantothenic Acid MG/KG 4108 Lysine % 0.41 Biotin MG/KG 100
Methionine % 0.16 Folic Acid MG/KG 2500 Methionine/Cystine % 0.32 Cyanocobalam MG/KG 20 % = Percent. PPM = Parts per million. IU/KG = International units per kilogram. MG/KG = Milligrams per kilogram.

124APPENDIX C
ADDITIONAL PROTEIN/ENERGY CALCULATIONS FROM CHAPTER II
Table C-1. Body composition of L. vannamei fed incremental levels of a 25% crude protein, 3.80 kcal g-1 diet over 49 days.1 Daily Feeding Rate
Protein (g DP shrimp-1)
Energy (kcal DE shrimp-1)
Moisture
(%)
Energy
(kcal g-1)2
Protein
(%)2
Ash (%)2
0.000 0.000 85.79±1.1443 3.80±0.1233 67.74±3.4613 21.21±2.2173 0.010 0.147 84.04±1.500 4.04±0.108 70.22±2.350 19.81±1.553 0.015 0.233 79.98±1.105 4.22±0.101 75.70±2.335 16.40±0.917 0.024 0.374 77.91±0.840 4.38±0.100 78.04±1.758 14.97±1.017 0.039 0.597 76.01±0.914 4.56±0.104 79.51±1.737 13.00±0.861 0.063 0.958 74.82±0.982 4.66±0.104 79.93±1.531 12.36±0.916 0.100 1.530 74.05±0.986 4.66±0.119 78.97±2.294 11.38±0.671 0.160 2.450 74.07±0.976 4.72±0.103 79.81±2.133 11.48±0.670 0.256 3.919 74.30±0.870 4.66±0.101 79.47±1.898 11.75±0.984 0.409 6.270 74.29±1.844 4.72±0.117 79.97±1.217 11.92±1.187 0.655 10.033 74.44±0.606 4.72±0.068 79.94±1.929 11.95±1.043
Initial 73.98±1.225 4.58±0.073 72.28±3.214 12.06±1.118 1Means of 20 shrimp ± standard deviation. 2Results expressed on a dry matter basis. 3Results based on 28 days of starvation.

125Table C-2. Body composition of L. vannamei fed incremental levels of a 25% crude protein, 3.80 kcal g-1 diet over 49 days.1
Daily Feeding Rate Protein
(g DP shrimp-1) Energy
(kcal DE shrimp-1)
Moisture
(%)
Energy
(kcal g-1)2
Protein
(%)2
Ash (%)2
0.000 0.000 85.79±1.1443 0.54±0.0483 9.64±1.1203 3.00±0.2963 0.010 0.147 84.04±1.500 0.64±0.061 11.21±1.149 3.09±0.347 0.015 0.233 79.98±1.105 0.84±0.056 15.16±1.059 3.18±0.149 0.024 0.374 77.91±0.840 0.97±0.051 17.25±0.894 3.26±0.158 0.039 0.597 76.01±0.914 1.09±0.060 19.08±0.952 3.05±0.210 0.063 0.958 74.82±0.982 1.17±0.058 20.13±0.863 3.05±0.230 0.100 1.530 74.05±0.986 1.21±0.062 20.49±0.850 2.92±0.151 0.160 2.450 74.07±0.976 1.22±0.063 20.68±0.724 2.96±0.105 0.256 3.919 74.30±0.870 1.20±0.052 20.42±0.884 2.96±0.188 0.409 6.270 74.29±1.844 1.21±0.109 20.56±1.515 2.97±0.101 0.655 10.033 74.44±0.606 1.21±0.041 20.43±0.778 3.06±0.286
Initial 73.98±1.225 1.19±0.065 18.76±0.689 3.13±0.298 1Means of 20 shrimp ± standard deviation. 2Results expressed on a wet weight basis. 3Results based on 28 days of starvation.

126Table C-3. Body composition of L. vannamei fed incremental levels of a 35% crude protein, 3.70 kcal g-1 diet over 49 days1.
Daily Feeding Rate Protein
(g DP shrimp-1) Energy
(kcal DE shrimp-1)
Moisture
(%)
Energy
(kcal g-1)2
Protein
(%)2
Ash (%)2
0.000 0.000 85.79±1.1443 3.80±0.1233 67.74±3.4613 21.21±2.2173 0.015 0.145 84.88±1.770 4.06±0.270 67.99±3.573 21.79±2.316 0.023 0.231 80.31±0.874 4.19±0.101 74.20±2.694 16.90±1.006 0.037 0.370 78.37±1.010 4.36±0.079 78.03±2.128 14.89±1.244 0.059 0.591 75.22±4.934 4.56±0.095 79.88±3.490 13.17±1.347 0.095 0.948 75.10±2.388 4.67±0.118 81.01±1.892 11.98±0.997 0.152 1.514 74.17±0.604 4.71±0.095 80.53±1.694 11.57±0.771 0.244 2.424 74.19±1.043 4.69±0.104 80.66±2.821 11.87±0.701 0.390 3.878 73.96±0.884 4.72±0.078 80.31±2.242 11.80±0.833 0.624 6.204 73.68±0.796 4.73±0.101 79.79±2.246 11.46±0.761 0.999 9.927 74.66±2.432 4.75±0.099 80.84±2.563 11.61±0.600
Initial 73.98±1.225 4.58±0.073 72.28±3.214 12.06±1.118 1Means of 20 shrimp ± standard deviation. 2Results expressed on a dry matter basis. 3Results based on 28 days of starvation.

127Table C-4. Body composition of L. vannamei fed incremental levels of a 35% crude protein, 3.70 kcal g-1 diet over 49 days1.
Daily Feeding Rate Protein
(g DP shrimp-1) Energy
(kcal DE shrimp-1)
Moisture
(%)
Energy
(kcal g-1)2
Protein
(%)2
Ash (%)2
0.000 0.000 85.79±1.1443 0.54±0.0483 9.64±1.1203 3.00±0.2963 0.015 0.145 84.88±1.770 0.62±0.099 10.27±1.370 3.27±0.392 0.023 0.231 80.31±0.874 0.83±0.046 14.62±0.977 3.34±0.160 0.037 0.370 78.37±1.010 0.94±0.047 16.90±1.160 3.34±0.316 0.059 0.591 75.22±4.934 1.13±0.236 19.78±3.862 3.35±0.636 0.095 0.948 75.10±2.388 1.16±0.126 20.19±2.093 2.86±0.252 0.152 1.514 74.17±0.604 1.22±0.377 20.80±0.716 2.97±0.172 0.244 2.424 74.19±1.043 1.21±0.067 20.83±1.277 3.02±0.187 0.390 3.878 73.96±0.884 1.23±0.053 20.91±0.807 3.07±0.213 0.624 6.204 73.68±0.796 1.24±0.048 20.96±0.815 3.00±0.176 0.999 9.927 74.66±2.432 1.21±0.123 20.57±2.157 2.84±0.411
Initial 73.98±1.225 1.19±0.065 18.76±0.689 3.13±0.298 1Means of 20 shrimp ± standard deviation. 2Results expressed on a wet weight basis. 3Results based on 28 days of starvation.

128
VITA
Name: Anthony Joseph Siccardi III Address: Shrimp Mariculture Research Facility, 1300 Port Street, Port Aransas,
Texas, 78373 Email Address: [email protected] Education: B.S., Marine Biology, Long Island University, Southampton Campus,
1995 M.S., Environmental Science, New Jersey Institute of Technology, 1998 M.S., Mariculture, Texas A&M University, Corpus Christi, 2004
Ph.D., Nutrition, Texas A&M University, College Station, 2006