daily mail / itv news eu referendum survey - comres · daily mail / itv news – eu referendum...
TRANSCRIPT

Daily Mail / ITV News – EU Referendum Survey
All UK adults
(turnout
weighted)
Overall voting
intention
Remain 48% 54%
Leave 42% 46%
Don’t know 11% -
METHODOLOGY NOTE
ComRes interviewed 1,032 UK adults aged 18+ from 17th-22nd June 2016. Data were weighted to be representative of all UK adults
aged 18+. ComRes sets quotas during fieldwork and weights the raw data on the following demographic information: age, gender,
government office region, social grade and public / private working sector. The sample includes both landline and mobile telephone
numbers. Additionally the data is weighted by past vote recall. The voting intention figures are then modelled using the ComRes
Likely Electorate Model to take account for known turnout patterns. ComRes is a member of the British Polling Council and abides
by its rules. http://www.britishpollingcouncil.org/
To commission a voting intention poll or a public opinion survey please contact Tom Mludzinski: [email protected]
To register for Pollwatch, a weekly newsletter update on the polls, please email: [email protected]

CATI Opinion Poll - EU referendum
Fieldwork: 17th - 22nd June 2016Prepared by ComRes
CVQ1. Thinking back to the General Election in May last year, which party, if any, did you vote for? Was it Conservative, Labour, Liberal Democrat, UKIP, SNP some other party, or did you not vote? ....................................................................................................................................... 1Base: All respondents
C2. If the referendum on Britain's membership of the European Union were being held tomorrow, how likely or unlikely would you be to vote? Please rate your answer on a scale from 1-10 where 1 is certain not to vote and 10 is absolutely certain to vote. ............................................... 4Base: All respondents
C3. If a referendum were held tomorrow on the UK's membership of the European Union (EU), how would you vote on the following question? “Should the UK remain a member of the European Union, or leave the European Union?” ................................................................................. 9Base: All respondents
C3. If a referendum were held tomorrow on the UK's membership of the European Union (EU), how would you vote on the following question? “Should the UK remain a member of the European Union, or leave the European Union?” ................................................................................ 12Base: (Turnout weighted)
C3. If a referendum were held tomorrow on the UK's membership of the European Union (EU), how would you vote on the following question? “Should the UK remain a member of the European Union, or leave the European Union?” ................................................................................ 15Base: All respondents likely to vote expressing a voting intention, including squeeze. (Turnout weighted)
Q1. Have you definitely decided how you will vote or may you change your mind? .............................................................................................................................................................................................................................................................................................................................. 18Base: All who have said how they would vote
Q2. Who of the following, if any, was/will be important to you in deciding how you will vote at the upcoming referendum on Britain's membership of the European Union? ..................................................................................................................................................................................... 21Base: All respondents
Q3. Do you think it would be better for the economy if Britain remained in the EU or if left the EU? ..................................................................................................................................................................................................................................................................................................... 24Base: All who have not said how they would vote
Q4_1. During the referendum campaign, the following claims have been made about what would happen if Britain voted to leave the EU. Some are positive, others are negative. Can you please tell me if each claim has made you more likely to vote for Remain, more likely to vote forLeave or has it made no difference? That we could save £350m a week sent to the EU .................................................................................................................................................................................................................................................................................................................... 27Base: All respondents
Q4_2. During the referendum campaign, the following claims have been made about what would happen if Britain voted to leave the EU. Some are positive, others are negative. Can you please tell me if each claim has made you more likely to vote for Remain, more likely to vote forLeave or has it made no difference? That we could introduce an Australian-style points system for immigration ............................................................................................................................................................................................................................................................................... 30Base: All respondents
Q4_3. During the referendum campaign, the following claims have been made about what would happen if Britain voted to leave the EU. Some are positive, others are negative. Can you please tell me if each claim has made you more likely to vote for Remain, more likely to vote forLeave or has it made no difference? That taxes will go up and there will be more public spending cuts ............................................................................................................................................................................................................................................................................................ 33Base: All respondents
Q4_4. During the referendum campaign, the following claims have been made about what would happen if Britain voted to leave the EU. Some are positive, others are negative. Can you please tell me if each claim has made you more likely to vote for Remain, more likely to vote forLeave or has it made no difference? That house prices will be lower .................................................................................................................................................................................................................................................................................................................................................. 36Base: All respondents
Q4_5. During the referendum campaign, the following claims have been made about what would happen if Britain voted to leave the EU. Some are positive, others are negative. Can you please tell me if each claim has made you more likely to vote for Remain, more likely to vote forLeave or has it made no difference? That we wouldn’t have to accept Turkish immigrants if they joined the EU ............................................................................................................................................................................................................................................................................... 39Base: All respondents
Q4_6. During the referendum campaign, the following claims have been made about what would happen if Britain voted to leave the EU. Some are positive, others are negative. Can you please tell me if each claim has made you more likely to vote for Remain, more likely to vote forLeave or has it made no difference? That we can take back control ................................................................................................................................................................................................................................................................................................................................................... 42Base: All respondents
Q4_7. During the referendum campaign, the following claims have been made about what would happen if Britain voted to leave the EU. Some are positive, others are negative. Can you please tell me if each claim has made you more likely to vote for Remain, more likely to vote forLeave or has it made no difference? That it would be a leap in the dark ............................................................................................................................................................................................................................................................................................................................................. 45Base: All respondents
Q4_8. During the referendum campaign, the following claims have been made about what would happen if Britain voted to leave the EU. Some are positive, others are negative. Can you please tell me if each claim has made you more likely to vote for Remain, more likely to vote forLeave or has it made no difference? That it could lead to a recession ................................................................................................................................................................................................................................................................................................................................................ 48Base: All respondents
Q5. If the UK voted to leave the European Union, which of the following do you think would do the best job as British Prime Minister negotiating Britain's withdrawal from the EU? ....................................................................................................................................................................... 51Base: All respondents
CVQ1. Thinking back to the General Election in May last year, which party, if any, did you vote for? Was it Conservative, Labour, Liberal Democrat, UKIP, SNP some other party, or did you not vote? ...................................................................................................................................... 54Base: All respondents

Table 1/1
CATI Opinion Poll - EU referendumCVQ1. Thinking back to the General Election in May last year, which party, if any, did you vote for? Was it Conservative, Labour, Liberal Democrat, UKIP, SNP some other party, or did you not vote?Base: All respondents
GENDER AGE SOCIAL GRADE Total Male Female 18-24 25-34 35-44 45-54 55-64 65+ AB C1 C2 DE
Unweighted Total 1032 528 504 84 154 180 186 163 265 320 261 211 240
Weighted Total 1032 503 529 118 178 171 186 151 229 276 286 225 246100% 100% 100% 100% 100% 100% 100% 100% 100% 100% 100% 100% 100%
Conservative 278 139 139 16 37 43 47 37 98 96 77 40 6427% 28% 26% 14% 21% 25% 25% 24% 43% 35% 27% 18% 26%
Labour 235 108 127 30 51 46 35 34 39 72 67 44 5223% 22% 24% 26% 29% 27% 19% 23% 17% 26% 23% 20% 21%
Liberal Democrat 61 31 30 1 13 14 8 6 19 23 11 10 176% 6% 6% 1% 7% 8% 4% 4% 8% 8% 4% 4% 7%
UKIP 95 59 36 5 9 7 29 18 27 19 18 30 299% 12% 7% 5% 5% 4% 16% 12% 12% 7% 6% 13% 12%
SNP 36 21 16 - 6 9 8 7 5 7 16 10 34% 4% 3% - 4% 6% 4% 5% 2% 2% 6% 4% 1%
Some other party 42 26 16 4 12 7 6 7 6 14 15 6 74% 5% 3% 3% 7% 4% 3% 4% 3% 5% 5% 3% 3%
Did not vote 208 98 110 53 41 32 37 29 17 37 63 59 4920% 20% 21% 45% 23% 18% 20% 19% 7% 13% 22% 26% 20%
Don't remember 21 2 19 - 2 3 6 4 6 4 4 6 72% * 4% - 1% 2% 3% 2% 3% 1% 2% 3% 3%
Refused 27 7 20 3 1 9 3 4 7 5 9 6 83% 1% 4% 3% 1% 5% 1% 2% 3% 2% 3% 3% 3%
NA-Northern Ireland 28 11 17 5 4 2 6 6 7 - 6 14 93% 2% 3% 4% 2% 1% 3% 4% 3% - 2% 6% 4%
Fieldwork: 17th - 22nd June 2016 Prepared by ComRes
Page 1

Table 1/2
CATI Opinion Poll - EU referendumCVQ1. Thinking back to the General Election in May last year, which party, if any, did you vote for? Was it Conservative, Labour, Liberal Democrat, UKIP, SNP some other party, or did you not vote?Base: All respondents
REGION SUMMARY PAST VOTE – GENERAL ELECTION 2015 Total England Scotland England & Wales North Midlands South GB Cons Lab UKIP
Unweighted Total 1032 858 93 910 242 260 356 1003 236 258 106
Weighted Total 1032 866 88 916 242 261 364 1004 278 235 95100% 100% 100% 100% 100% 100% 100% 100% 100% 100% 100%
Conservative 278 261 12 266 55 87 119 278 278 - -27% 30% 14% 29% 23% 33% 33% 28% 100% - -
Labour 235 207 14 221 68 54 85 235 - 235 -23% 24% 16% 24% 28% 21% 23% 23% - 100% -
Liberal Democrat 61 56 4 56 16 18 22 61 - - -6% 7% 5% 6% 7% 7% 6% 6% - - -
UKIP 95 87 - 95 22 33 31 95 - - 959% 10% - 10% 9% 13% 9% 10% - - 100%
SNP 36 - 36 - - - - 36 - - -4% - 41% - - - - 4% - - -
Some other party 42 34 1 40 8 8 17 42 - - -4% 4% 2% 4% 3% 3% 5% 4% - - -
Did not vote 208 176 18 190 60 44 72 208 - - -20% 20% 21% 21% 25% 17% 20% 21% - - -
Don't remember 21 19 - 21 7 9 4 21 - - -2% 2% - 2% 3% 3% 1% 2% - - -
Refused 27 26 1 26 7 6 13 27 - - -3% 3% 1% 3% 3% 2% 4% 3% - - -
NA-Northern Ireland 28 - - - - - - - - - -3% - - - - - - - - - -
Fieldwork: 17th - 22nd June 2016 Prepared by ComRes
Page 2

Table 1/3
CATI Opinion Poll - EU referendumCVQ1. Thinking back to the General Election in May last year, which party, if any, did you vote for? Was it Conservative, Labour, Liberal Democrat, UKIP, SNP some other party, or did you not vote?Base: All respondents
DECISION EDUCATION
Total Remain Leave Don't know Definitely decided May change mind University educatedNon-university
educated
Unweighted Total 1032 481 431 120 611 118 336 693
Weighted Total 1032 483 434 115 612 130 334 696100% 100% 100% 100% 100% 100% 100% 100%
Conservative 278 116 140 22 162 34 88 18927% 24% 32% 19% 26% 26% 26% 27%
Labour 235 166 50 19 153 20 100 13523% 34% 12% 17% 25% 15% 30% 19%
Liberal Democrat 61 42 16 3 38 7 28 336% 9% 4% 2% 6% 5% 8% 5%
UKIP 95 2 90 4 64 6 10 859% * 21% 3% 10% 5% 3% 12%
SNP 36 22 13 1 28 3 16 204% 4% 3% 1% 5% 3% 5% 3%
Some other party 42 26 12 3 28 3 21 214% 5% 3% 3% 5% 3% 6% 3%
Did not vote 208 80 90 38 102 47 55 15120% 17% 21% 33% 17% 36% 16% 22%
Don't remember 21 3 7 10 5 2 4 172% 1% 2% 9% 1% 1% 1% 2%
Refused 27 7 6 14 7 5 8 193% 2% 1% 12% 1% 4% 3% 3%
NA-Northern Ireland 28 19 9 - 26 3 3 263% 4% 2% - 4% 2% 1% 4%
Fieldwork: 17th - 22nd June 2016 Prepared by ComRes
Page 3

Table 2/1
CATI Opinion Poll - EU referendumC2. If the referendum on Britain's membership of the European Union were being held tomorrow, how likely or unlikely would you be to vote? Please rate your answer on a scale from 1-10 where 1 is certain not to vote and 10 is absolutely certain to vote.Base: All respondents
GENDER AGE SOCIAL GRADE Total Male Female 18-24 25-34 35-44 45-54 55-64 65+ AB C1 C2 DE
Unweighted Total 1032 528 504 84 154 180 186 163 265 320 261 211 240
Weighted Total 1032 503 529 118 178 171 186 151 229 276 286 225 246100% 100% 100% 100% 100% 100% 100% 100% 100% 100% 100% 100% 100%
1 - Certain not to vote (1) 51 23 28 8 13 6 11 7 6 8 9 17 175% 5% 5% 7% 8% 3% 6% 5% 3% 3% 3% 7% 7%
2 (2) 7 4 2 - 4 - 2 - 1 1 - 2 31% 1% * - 2% - 1% - * * - 1% 1%
3 (3) 9 3 6 5 - 2 2 - 1 - 3 3 31% 1% 1% 4% - 1% 1% - * - 1% 1% 1%
4 (4) 8 5 3 5 - 3 - - - - 2 3 41% 1% 1% 4% - 2% - - - - 1% 1% 2%
5 (5) 35 11 24 5 6 6 7 3 8 3 10 11 123% 2% 5% 5% 3% 3% 4% 2% 4% 1% 3% 5% 5%
6 (6) 9 1 7 2 2 1 - 2 2 3 2 1 21% * 1% 2% 1% * - 1% 1% 1% 1% 1% 1%
7 (7) 15 14 1 3 6 1 2 2 1 3 5 4 31% 3% * 3% 4% * 1% 1% 1% 1% 2% 2% 1%
8 (8) 31 16 15 7 8 2 5 4 4 9 10 7 53% 3% 3% 6% 4% 1% 3% 3% 2% 3% 4% 3% 2%
9 (9) 55 30 25 7 6 14 10 10 8 14 17 13 105% 6% 5% 6% 3% 8% 5% 7% 3% 5% 6% 6% 4%
10 - Absolutely certain to vote (10) 808 394 414 74 133 136 147 122 197 234 225 164 18578% 78% 78% 63% 75% 79% 79% 81% 86% 85% 79% 73% 75%
Prefer not to say 2 - 2 - - 2 - - - - 2 - -* - * - - 1% - - - - 1% - -
Don't know 2 - 2 - - - 1 - 1 - 1 - 1* - * - - - 1% - 1% - * - 1%
Mean score 9.03 9.08 8.98 8.26 8.72 9.21 9.02 9.25 9.39 9.44 9.21 8.65 8.69Standard deviation 2.35 2.28 2.42 2.86 2.71 2.09 2.43 2.10 1.88 1.78 2.01 2.75 2.75Standard error .07 .10 .11 .31 .22 .16 .18 .16 .12 .10 .12 .19 .18
Fieldwork: 17th - 22nd June 2016 Prepared by ComRes
Page 4

Table 2/2
CATI Opinion Poll - EU referendumC2. If the referendum on Britain's membership of the European Union were being held tomorrow, how likely or unlikely would you be to vote? Please rate your answer on a scale from 1-10 where 1 is certain not to vote and 10 is absolutely certain to vote.Base: All respondents
REGION SUMMARY PAST VOTE – GENERAL ELECTION 2015 Total England Scotland England & Wales North Midlands South GB Cons Lab UKIP
Unweighted Total 1032 858 93 910 242 260 356 1003 236 258 106
Weighted Total 1032 866 88 916 242 261 364 1004 278 235 95100% 100% 100% 100% 100% 100% 100% 100% 100% 100% 100%
1 - Certain not to vote (1) 51 43 6 46 13 14 16 51 - 5 25% 5% 6% 5% 5% 5% 4% 5% - 2% 2%
2 (2) 7 6 - 6 3 2 1 6 1 2 -1% 1% - 1% 1% 1% * 1% * 1% -
3 (3) 9 4 2 4 2 - 2 6 1 - -1% 1% 2% * 1% - 1% 1% * - -
4 (4) 8 8 - 8 2 2 5 8 3 - -1% 1% - 1% 1% 1% 1% 1% 1% - -
5 (5) 35 27 6 29 4 11 12 34 5 6 -3% 3% 7% 3% 2% 4% 3% 3% 2% 2% -
6 (6) 9 6 - 9 3 2 - 9 1 2 -1% 1% - 1% 1% 1% - 1% 1% 1% -
7 (7) 15 10 - 15 3 2 6 15 1 1 31% 1% - 2% 1% 1% 2% 2% * * 3%
8 (8) 31 24 4 27 4 5 15 31 6 8 33% 3% 5% 3% 2% 2% 4% 3% 2% 3% 3%
9 (9) 55 51 2 51 13 17 21 53 16 11 25% 6% 2% 6% 5% 7% 6% 5% 6% 5% 2%
10 - Absolutely certain to vote (10) 808 683 68 718 195 205 283 786 242 199 8678% 79% 78% 78% 80% 79% 78% 78% 87% 85% 90%
Prefer not to say 2 2 - 2 - - 2 2 - - -* * - * - - * * - - -
Don't know 2 2 - 2 - 1 1 2 1 1 -* * - * - * * * * * -
Mean score 9.03 9.07 8.84 9.05 9.04 9.07 9.10 9.03 9.66 9.47 9.68
Fieldwork: 17th - 22nd June 2016 Prepared by ComRes
Page 5

Table 2/3
CATI Opinion Poll - EU referendumC2. If the referendum on Britain's membership of the European Union were being held tomorrow, how likely or unlikely would you be to vote? Please rate your answer on a scale from 1-10 where 1 is certain not to vote and 10 is absolutely certain to vote.Base: All respondents
REGION SUMMARY PAST VOTE – GENERAL ELECTION 2015 Total England Scotland England & Wales North Midlands South GB Cons Lab UKIP
Unweighted Total 1032 858 93 910 242 260 356 1003 236 258 106
Weighted Total 1032 866 88 916 242 261 364 1004 278 235 95100% 100% 100% 100% 100% 100% 100% 100% 100% 100% 100%
Standard deviation 2.35 2.31 2.59 2.32 2.44 2.33 2.22 2.35 1.18 1.69 1.30Standard error .07 .08 .27 .08 .16 .14 .12 .07 .08 .11 .13
Fieldwork: 17th - 22nd June 2016 Prepared by ComRes
Page 6

Table 2/4
CATI Opinion Poll - EU referendumC2. If the referendum on Britain's membership of the European Union were being held tomorrow, how likely or unlikely would you be to vote? Please rate your answer on a scale from 1-10 where 1 is certain not to vote and 10 is absolutely certain to vote.Base: All respondents
DECISION EDUCATION
Total Remain Leave Don't know Definitely decided May change mind University educatedNon-university
educated
Unweighted Total 1032 481 431 120 611 118 336 693
Weighted Total 1032 483 434 115 612 130 334 696100% 100% 100% 100% 100% 100% 100% 100%
1 - Certain not to vote (1) 51 14 15 22 20 7 9 425% 3% 3% 19% 3% 5% 3% 6%
2 (2) 7 2 3 2 - 5 1 51% * 1% 2% - 3% * 1%
3 (3) 9 4 4 2 5 2 - 91% 1% 1% 1% 1% 2% - 1%
4 (4) 8 4 5 - - 8 2 71% 1% 1% - - 6% * 1%
5 (5) 35 17 3 15 4 16 4 313% 4% 1% 13% 1% 12% 1% 5%
6 (6) 9 8 1 - 4 5 3 61% 2% * - 1% 4% 1% 1%
7 (7) 15 6 8 1 7 8 3 121% 1% 2% 1% 1% 6% 1% 2%
8 (8) 31 19 4 8 14 10 9 223% 4% 1% 7% 2% 7% 3% 3%
9 (9) 55 25 25 5 43 7 21 335% 5% 6% 4% 7% 5% 6% 5%
10 - Absolutely certain to vote (10) 808 384 366 59 514 64 281 52578% 79% 84% 51% 84% 49% 84% 75%
Prefer not to say 2 - - 2 - - - 2* - - 1% - - - *
Don't know 2 1 - 1 1 - 1 1* * - 1% * - * *
Mean score 9.03 9.19 9.33 7.14 9.43 7.64 9.46 8.82
Fieldwork: 17th - 22nd June 2016 Prepared by ComRes
Page 7

Table 2/5
CATI Opinion Poll - EU referendumC2. If the referendum on Britain's membership of the European Union were being held tomorrow, how likely or unlikely would you be to vote? Please rate your answer on a scale from 1-10 where 1 is certain not to vote and 10 is absolutely certain to vote.Base: All respondents
DECISION EDUCATION
Total Remain Leave Don't know Definitely decided May change mind University educatedNon-university
educated
Unweighted Total 1032 481 431 120 611 118 336 693
Weighted Total 1032 483 434 115 612 130 334 696100% 100% 100% 100% 100% 100% 100% 100%
Standard deviation 2.35 2.03 2.01 3.65 1.82 2.90 1.74 2.57Standard error .07 .09 .10 .34 .07 .27 .10 .10
Fieldwork: 17th - 22nd June 2016 Prepared by ComRes
Page 8

Table 3/1
CATI Opinion Poll - EU referendumC3. If a referendum were held tomorrow on the UK's membership of the European Union (EU), how would you vote on the following question? “Should the UK remain a member of the European Union, or leave the European Union?”Base: All respondents
GENDER AGE SOCIAL GRADE Total Male Female 18-24 25-34 35-44 45-54 55-64 65+ AB C1 C2 DE
Unweighted Total 1032 528 504 84 154 180 186 163 265 320 261 211 240
Weighted Total 1032 503 529 118 178 171 186 151 229 276 286 225 246100% 100% 100% 100% 100% 100% 100% 100% 100% 100% 100% 100% 100%
Remain 483 235 248 77 114 92 66 47 88 169 149 75 9047% 47% 47% 65% 64% 54% 36% 31% 38% 61% 52% 33% 37%
Leave 434 227 206 38 47 63 88 83 115 88 107 119 11942% 45% 39% 32% 27% 37% 47% 55% 50% 32% 37% 53% 49%
Don't know 115 40 75 4 16 16 32 21 26 18 30 31 3611% 8% 14% 3% 9% 10% 17% 14% 11% 7% 10% 14% 15%
Fieldwork: 17th - 22nd June 2016 Prepared by ComRes
Page 9

Table 3/2
CATI Opinion Poll - EU referendumC3. If a referendum were held tomorrow on the UK's membership of the European Union (EU), how would you vote on the following question? “Should the UK remain a member of the European Union, or leave the European Union?”Base: All respondents
REGION SUMMARY PAST VOTE – GENERAL ELECTION 2015 Total England Scotland England & Wales North Midlands South GB Cons Lab UKIP
Unweighted Total 1032 858 93 910 242 260 356 1003 236 258 106
Weighted Total 1032 866 88 916 242 261 364 1004 278 235 95100% 100% 100% 100% 100% 100% 100% 100% 100% 100% 100%
Remain 483 400 45 419 98 118 184 464 116 166 247% 46% 51% 46% 41% 45% 51% 46% 42% 71% 2%
Leave 434 374 29 395 121 116 137 424 140 50 9042% 43% 34% 43% 50% 44% 38% 42% 50% 21% 94%
Don't know 115 92 13 102 23 27 42 115 22 19 411% 11% 15% 11% 9% 10% 12% 11% 8% 8% 4%
Fieldwork: 17th - 22nd June 2016 Prepared by ComRes
Page 10

Table 3/3
CATI Opinion Poll - EU referendumC3. If a referendum were held tomorrow on the UK's membership of the European Union (EU), how would you vote on the following question? “Should the UK remain a member of the European Union, or leave the European Union?”Base: All respondents
DECISION EDUCATION
Total Remain Leave Don't know Definitely decided May change mind University educatedNon-university
educated
Unweighted Total 1032 481 431 120 611 118 336 693
Weighted Total 1032 483 434 115 612 130 334 696100% 100% 100% 100% 100% 100% 100% 100%
Remain 483 483 - - 331 66 239 24447% 100% - - 54% 50% 72% 35%
Leave 434 - 434 - 282 65 68 36342% - 100% - 46% 50% 21% 52%
Don't know 115 - - 115 - - 26 8811% - - 100% - - 8% 13%
Fieldwork: 17th - 22nd June 2016 Prepared by ComRes
Page 11
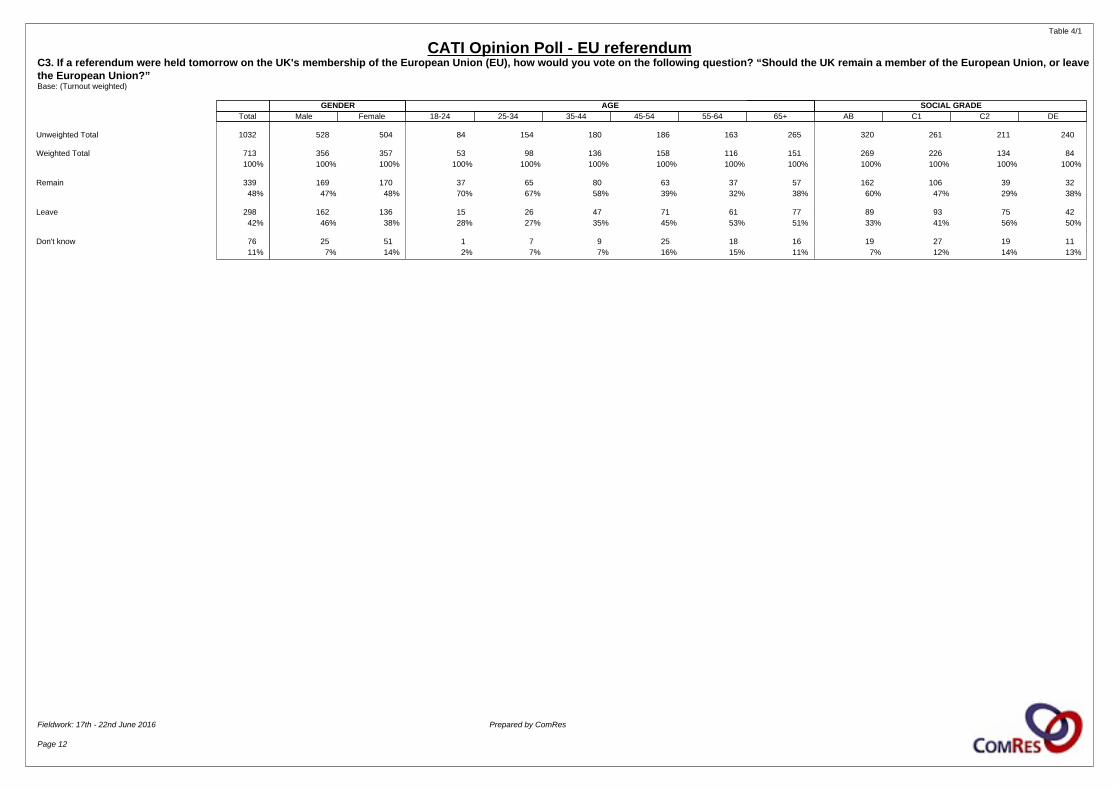
Table 4/1
CATI Opinion Poll - EU referendumC3. If a referendum were held tomorrow on the UK's membership of the European Union (EU), how would you vote on the following question? “Should the UK remain a member of the European Union, or leave the European Union?”Base: (Turnout weighted)
GENDER AGE SOCIAL GRADE Total Male Female 18-24 25-34 35-44 45-54 55-64 65+ AB C1 C2 DE
Unweighted Total 1032 528 504 84 154 180 186 163 265 320 261 211 240
Weighted Total 713 356 357 53 98 136 158 116 151 269 226 134 84100% 100% 100% 100% 100% 100% 100% 100% 100% 100% 100% 100% 100%
Remain 339 169 170 37 65 80 63 37 57 162 106 39 3248% 47% 48% 70% 67% 58% 39% 32% 38% 60% 47% 29% 38%
Leave 298 162 136 15 26 47 71 61 77 89 93 75 4242% 46% 38% 28% 27% 35% 45% 53% 51% 33% 41% 56% 50%
Don't know 76 25 51 1 7 9 25 18 16 19 27 19 1111% 7% 14% 2% 7% 7% 16% 15% 11% 7% 12% 14% 13%
Fieldwork: 17th - 22nd June 2016 Prepared by ComRes
Page 12

Table 4/2
CATI Opinion Poll - EU referendumC3. If a referendum were held tomorrow on the UK's membership of the European Union (EU), how would you vote on the following question? “Should the UK remain a member of the European Union, or leave the European Union?”Base: (Turnout weighted)
REGION SUMMARY PAST VOTE – GENERAL ELECTION 2015 Total England Scotland England & Wales North Midlands South GB Cons Lab UKIP
Unweighted Total 1032 858 93 910 242 260 356 1003 236 258 106
Weighted Total 713 598 64 634 170 169 259 698 215 161 65100% 100% 100% 100% 100% 100% 100% 100% 100% 100% 100%
Remain 339 284 33 297 71 83 129 330 91 117 148% 47% 51% 47% 42% 49% 50% 47% 42% 73% 2%
Leave 298 253 23 269 82 70 101 292 108 32 6342% 42% 35% 42% 48% 42% 39% 42% 50% 20% 96%
Don't know 76 61 9 68 17 15 29 76 16 12 111% 10% 13% 11% 10% 9% 11% 11% 7% 8% 2%
Fieldwork: 17th - 22nd June 2016 Prepared by ComRes
Page 13

Table 4/3
CATI Opinion Poll - EU referendumC3. If a referendum were held tomorrow on the UK's membership of the European Union (EU), how would you vote on the following question? “Should the UK remain a member of the European Union, or leave the European Union?”Base: (Turnout weighted)
DECISION EDUCATION
Total Remain Leave Don't know Definitely decided May change mind University educatedNon-university
educated
Unweighted Total 1032 481 431 120 611 118 336 693
Weighted Total 713 339 298 76 446 75 256 454100% 100% 100% 100% 100% 100% 100% 100%
Remain 339 339 - - 242 36 188 15148% 100% - - 54% 48% 73% 33%
Leave 298 - 298 - 204 39 47 24942% - 100% - 46% 52% 18% 55%
Don't know 76 - - 76 - - 21 5411% - - 100% - - 8% 12%
Fieldwork: 17th - 22nd June 2016 Prepared by ComRes
Page 14

Table 5/1
CATI Opinion Poll - EU referendumC3. If a referendum were held tomorrow on the UK's membership of the European Union (EU), how would you vote on the following question? “Should the UK remain a member of the European Union, or leave the European Union?”Base: All respondents likely to vote expressing a voting intention, including squeeze. (Turnout weighted)
GENDER AGE SOCIAL GRADE Total Male Female 18-24 25-34 35-44 45-54 55-64 65+ AB C1 C2 DE
Unweighted Total 955 500 455 83 149 164 167 145 247 308 239 193 215
Weighted Total 663 338 324 52 96 128 144 102 141 261 207 119 76100% 100% 100% 100% 100% 100% 100% 100% 100% 100% 100% 100% 100%
Remain 358 174 184 37 69 80 68 41 63 170 110 43 3454% 51% 57% 71% 72% 62% 47% 40% 45% 65% 53% 36% 45%
Leave 305 165 141 15 27 48 76 61 78 90 97 76 4246% 49% 43% 29% 28% 38% 53% 60% 55% 35% 47% 64% 55%
Fieldwork: 17th - 22nd June 2016 Prepared by ComRes
Page 15

Table 5/2
CATI Opinion Poll - EU referendumC3. If a referendum were held tomorrow on the UK's membership of the European Union (EU), how would you vote on the following question? “Should the UK remain a member of the European Union, or leave the European Union?”Base: All respondents likely to vote expressing a voting intention, including squeeze. (Turnout weighted)
REGION SUMMARY PAST VOTE – GENERAL ELECTION 2015 Total England Scotland England & Wales North Midlands South GB Cons Lab UKIP
Unweighted Total 955 799 83 843 228 238 333 926 225 246 104
Weighted Total 663 561 57 590 161 157 243 647 206 156 65100% 100% 100% 100% 100% 100% 100% 100% 100% 100% 100%
Remain 358 301 34 315 77 86 138 349 97 123 254% 54% 59% 53% 48% 55% 57% 54% 47% 79% 2%
Leave 305 260 24 275 84 71 105 299 108 33 6346% 46% 41% 47% 52% 45% 43% 46% 53% 21% 98%
Fieldwork: 17th - 22nd June 2016 Prepared by ComRes
Page 16

Table 5/3
CATI Opinion Poll - EU referendumC3. If a referendum were held tomorrow on the UK's membership of the European Union (EU), how would you vote on the following question? “Should the UK remain a member of the European Union, or leave the European Union?”Base: All respondents likely to vote expressing a voting intention, including squeeze. (Turnout weighted)
DECISION EDUCATION
Total Remain Leave Don't know Definitely decided May change mind University educatedNon-university
educated
Unweighted Total 955 481 431 43 611 118 320 633
Weighted Total 663 339 298 26 446 75 244 418100% 100% 100% 100% 100% 100% 100% 100%
Remain 358 339 - 19 242 36 194 16354% 100% - 72% 54% 48% 80% 39%
Leave 305 - 298 7 204 39 49 25546% - 100% 28% 46% 52% 20% 61%
Fieldwork: 17th - 22nd June 2016 Prepared by ComRes
Page 17

Table 6/1
CATI Opinion Poll - EU referendumQ1. Have you definitely decided how you will vote or may you change your mind?Base: All who have said how they would vote
GENDER AGE SOCIAL GRADE Total Male Female 18-24 25-34 35-44 45-54 55-64 65+ AB C1 C2 DE
Unweighted Total 733 395 338 69 123 137 128 110 166 243 192 153 145
Weighted Total 745 385 361 96 149 131 128 102 141 217 223 160 145100% 100% 100% 100% 100% 100% 100% 100% 100% 100% 100% 100% 100%
Definitely decided 612 325 287 63 116 111 110 89 123 184 190 130 10882% 85% 80% 66% 78% 85% 86% 88% 88% 85% 85% 81% 74%
May change mind 130 57 73 32 32 19 17 13 16 31 33 29 3717% 15% 20% 34% 22% 15% 14% 12% 12% 14% 15% 18% 25%
Don't know 3 2 * - 1 - * - 1 1 - * 1* 1% * - 1% - * - 1% 1% - * 1%
Fieldwork: 17th - 22nd June 2016 Prepared by ComRes
Page 18

Table 6/2
CATI Opinion Poll - EU referendumQ1. Have you definitely decided how you will vote or may you change your mind?Base: All who have said how they would vote
REGION SUMMARY PAST VOTE – GENERAL ELECTION 2015 Total England Scotland England & Wales North Midlands South GB Cons Lab UKIP
Unweighted Total 733 598 67 637 164 181 253 704 161 188 76
Weighted Total 745 614 66 651 172 178 264 717 195 174 70100% 100% 100% 100% 100% 100% 100% 100% 100% 100% 100%
Definitely decided 612 505 52 535 144 142 220 587 162 153 6482% 82% 79% 82% 83% 80% 83% 82% 83% 88% 91%
May change mind 130 106 14 113 28 36 43 128 34 20 617% 17% 21% 17% 16% 20% 16% 18% 17% 12% 9%
Don't know 3 3 - 3 1 - 1 3 - - -* * - * 1% - 1% * - - -
Fieldwork: 17th - 22nd June 2016 Prepared by ComRes
Page 19

Table 6/3
CATI Opinion Poll - EU referendumQ1. Have you definitely decided how you will vote or may you change your mind?Base: All who have said how they would vote
DECISION EDUCATION
Total Remain Leave Don't know Definitely decided May change mind University educatedNon-university
educated
Unweighted Total 733 396 337 - 611 118 261 471
Weighted Total 745 398 348 - 612 130 266 479100% 100% 100% - 100% 100% 100% 100%
Definitely decided 612 331 282 - 612 - 228 38482% 83% 81% - 100% - 86% 80%
May change mind 130 66 65 - - 130 37 9317% 17% 19% - - 100% 14% 19%
Don't know 3 1 1 - - - 1 2* * * - - - * *
Fieldwork: 17th - 22nd June 2016 Prepared by ComRes
Page 20

Table 7/1
CATI Opinion Poll - EU referendumQ2. Who of the following, if any, was/will be important to you in deciding how you will vote at the upcoming referendum on Britain's membership of the European Union?Base: All respondents
GENDER AGE SOCIAL GRADE Total Male Female 18-24 25-34 35-44 45-54 55-64 65+ AB C1 C2 DE
Unweighted Total 1032 528 504 84 154 180 186 163 265 320 261 211 240
Weighted Total 1032 503 529 118 178 171 186 151 229 276 286 225 246100% 100% 100% 100% 100% 100% 100% 100% 100% 100% 100% 100% 100%
David Cameron 270 123 147 35 41 47 45 37 66 77 80 38 7526% 25% 28% 30% 23% 27% 24% 24% 29% 28% 28% 17% 30%
Boris Johnson 260 120 140 22 19 37 61 56 66 63 61 61 7625% 24% 26% 18% 11% 22% 33% 37% 29% 23% 21% 27% 31%
Jeremy Corbyn 205 95 110 38 35 48 35 25 24 59 72 31 4320% 19% 21% 32% 20% 28% 19% 17% 11% 21% 25% 14% 17%
Nigel Farage 195 115 81 17 16 29 41 45 47 44 55 47 5019% 23% 15% 15% 9% 17% 22% 30% 20% 16% 19% 21% 20%
Nicola Sturgeon 138 70 68 15 23 21 23 23 33 36 42 23 3713% 14% 13% 13% 13% 12% 12% 15% 14% 13% 15% 10% 15%
Michael Gove 164 78 86 16 13 19 24 35 56 41 45 32 4616% 15% 16% 13% 8% 11% 13% 23% 25% 15% 16% 14% 19%
George Osborne 138 72 66 16 23 21 21 20 36 48 38 16 3513% 14% 12% 14% 13% 12% 11% 13% 16% 17% 13% 7% 14%
Other 10 5 5 3 2 2 2 1 - 2 5 1 21% 1% 1% 2% 1% 1% 1% 1% - 1% 2% * 1%
None 384 187 198 41 95 68 70 47 64 111 98 98 7737% 37% 37% 35% 53% 40% 37% 31% 28% 40% 34% 44% 31%
Don't know 12 3 9 3 1 - 3 2 2 - 7 5 -1% 1% 2% 3% 1% - 2% 2% 1% - 2% 2% -
Fieldwork: 17th - 22nd June 2016 Prepared by ComRes
Page 21

Table 7/2
CATI Opinion Poll - EU referendumQ2. Who of the following, if any, was/will be important to you in deciding how you will vote at the upcoming referendum on Britain's membership of the European Union?Base: All respondents
REGION SUMMARY PAST VOTE – GENERAL ELECTION 2015 Total England Scotland England & Wales North Midlands South GB Cons Lab UKIP
Unweighted Total 1032 858 93 910 242 260 356 1003 236 258 106
Weighted Total 1032 866 88 916 242 261 364 1004 278 235 95100% 100% 100% 100% 100% 100% 100% 100% 100% 100% 100%
David Cameron 270 236 16 249 56 74 106 266 110 59 1126% 27% 19% 27% 23% 28% 29% 26% 40% 25% 11%
Boris Johnson 260 232 11 244 53 92 88 255 90 38 4925% 27% 13% 27% 22% 35% 24% 25% 32% 16% 51%
Jeremy Corbyn 205 173 17 179 42 56 75 195 20 98 320% 20% 19% 20% 17% 21% 21% 19% 7% 42% 4%
Nigel Farage 195 170 10 181 43 65 63 191 48 42 5519% 20% 11% 20% 18% 25% 17% 19% 17% 18% 58%
Nicola Sturgeon 138 96 35 100 26 32 39 134 20 47 613% 11% 40% 11% 11% 12% 11% 13% 7% 20% 6%
Michael Gove 164 144 12 149 31 56 58 161 75 26 2216% 17% 14% 16% 13% 21% 16% 16% 27% 11% 23%
George Osborne 138 115 12 122 22 42 51 134 50 39 713% 13% 14% 13% 9% 16% 14% 13% 18% 16% 7%
Other 10 10 - 10 1 4 5 10 - 3 -1% 1% - 1% * 1% 1% 1% - 1% -
None 384 323 31 343 101 82 139 373 91 81 2337% 37% 35% 37% 42% 31% 38% 37% 33% 35% 24%
Don't know 12 11 - 12 6 2 3 12 2 1 -1% 1% - 1% 3% 1% 1% 1% 1% 1% -
Fieldwork: 17th - 22nd June 2016 Prepared by ComRes
Page 22

Table 7/3
CATI Opinion Poll - EU referendumQ2. Who of the following, if any, was/will be important to you in deciding how you will vote at the upcoming referendum on Britain's membership of the European Union?Base: All respondents
DECISION EDUCATION
Total Remain Leave Don't know Definitely decided May change mind University educatedNon-university
educated
Unweighted Total 1032 481 431 120 611 118 336 693
Weighted Total 1032 483 434 115 612 130 334 696100% 100% 100% 100% 100% 100% 100% 100%
David Cameron 270 172 75 24 145 55 98 17326% 36% 17% 21% 24% 42% 29% 25%
Boris Johnson 260 56 181 24 154 26 56 20425% 11% 42% 21% 25% 20% 17% 29%
Jeremy Corbyn 205 154 34 17 127 27 93 11120% 32% 8% 15% 21% 21% 28% 16%
Nigel Farage 195 55 130 11 135 21 41 15419% 11% 30% 10% 22% 16% 12% 22%
Nicola Sturgeon 138 91 35 12 88 18 52 8613% 19% 8% 10% 14% 14% 16% 12%
Michael Gove 164 39 112 13 96 21 39 12516% 8% 26% 11% 16% 16% 12% 18%
George Osborne 138 85 35 17 73 29 54 8413% 18% 8% 15% 12% 22% 16% 12%
Other 10 6 3 1 4 2 4 61% 1% 1% 1% 1% 2% 1% 1%
None 384 175 149 61 211 52 142 24037% 36% 34% 53% 34% 40% 43% 35%
Don't know 12 3 5 5 7 - 2 111% 1% 1% 4% 1% - * 2%
Fieldwork: 17th - 22nd June 2016 Prepared by ComRes
Page 23

Table 8/1
CATI Opinion Poll - EU referendumQ3. Do you think it would be better for the economy if Britain remained in the EU or if left the EU?Base: All who have not said how they would vote
GENDER AGE SOCIAL GRADE Total Male Female 18-24 25-34 35-44 45-54 55-64 65+ AB C1 C2 DE
Unweighted Total 111 42 69 1 16 19 30 19 26 24 29 25 33
Weighted Total 107 37 70 * 16 16 31 20 23 17 28 30 32100% 100% 100% 100% 100% 100% 100% 100% 100% 100% 100% 100% 100%
Remained 26 10 16 * 6 - 7 4 9 9 4 6 724% 27% 23% 100% 36% - 23% 19% 39% 52% 15% 20% 22%
Left 11 4 7 - 4 1 5 - 1 1 5 3 210% 10% 10% - 26% 6% 15% - 3% 8% 17% 8% 6%
Don't know 70 23 47 - 6 15 19 16 13 7 19 22 2366% 63% 67% - 38% 94% 62% 81% 58% 40% 68% 72% 72%
Fieldwork: 17th - 22nd June 2016 Prepared by ComRes
Page 24

Table 8/2
CATI Opinion Poll - EU referendumQ3. Do you think it would be better for the economy if Britain remained in the EU or if left the EU?Base: All who have not said how they would vote
REGION SUMMARY PAST VOTE – GENERAL ELECTION 2015 Total England Scotland England & Wales North Midlands South GB Cons Lab UKIP
Unweighted Total 111 90 13 98 22 27 41 111 22 23 4
Weighted Total 107 86 11 96 18 26 41 107 22 19 4100% 100% 100% 100% 100% 100% 100% 100% 100% 100% 100%
Remained 26 24 2 24 7 4 13 26 9 7 124% 28% 20% 25% 37% 14% 32% 24% 42% 36% 26%
Left 11 9 1 9 2 2 5 11 - 1 210% 11% 12% 10% 10% 9% 13% 10% - 7% 44%
Don't know 70 53 8 63 10 20 23 70 13 11 166% 61% 69% 65% 54% 77% 55% 66% 58% 57% 30%
Fieldwork: 17th - 22nd June 2016 Prepared by ComRes
Page 25

Table 8/3
CATI Opinion Poll - EU referendumQ3. Do you think it would be better for the economy if Britain remained in the EU or if left the EU?Base: All who have not said how they would vote
DECISION EDUCATION
Total Remain Leave Don't know Definitely decided May change mind University educatedNon-university
educated
Unweighted Total 111 - - 111 - - 26 84
Weighted Total 107 - - 107 - - 26 80100% - - 100% - - 100% 100%
Remained 26 - - 26 - - 9 1724% - - 24% - - 34% 21%
Left 11 - - 11 - - 2 910% - - 10% - - 7% 11%
Don't know 70 - - 70 - - 15 5466% - - 66% - - 59% 68%
Fieldwork: 17th - 22nd June 2016 Prepared by ComRes
Page 26

Table 9/1
CATI Opinion Poll - EU referendumQ4_1. During the referendum campaign, the following claims have been made about what would happen if Britain voted to leave the EU. Some are positive, others are negative. Can you please tell me if each claim has made you more likely to vote for Remain, more likely to vote for Leave or has it made no difference?
That we could save £350m a week sent to the EUBase: All respondents
GENDER AGE SOCIAL GRADE Total Male Female 18-24 25-34 35-44 45-54 55-64 65+ AB C1 C2 DE
Unweighted Total 1032 528 504 84 154 180 186 163 265 320 261 211 240
Weighted Total 1032 503 529 118 178 171 186 151 229 276 286 225 246100% 100% 100% 100% 100% 100% 100% 100% 100% 100% 100% 100% 100%
More likely to vote Remain 166 87 79 18 37 26 20 21 44 57 48 23 3816% 17% 15% 16% 21% 15% 11% 14% 19% 21% 17% 10% 16%
More likely to vote Leave 386 183 203 42 44 59 74 74 93 81 88 109 10837% 36% 38% 35% 25% 35% 40% 49% 41% 30% 31% 49% 44%
Made no difference 471 227 244 58 94 84 90 55 90 133 149 92 9746% 45% 46% 49% 53% 49% 48% 37% 39% 48% 52% 41% 40%
Don't know 9 6 3 - 2 2 2 1 2 5 1 1 21% 1% 1% - 1% 1% 1% 1% 1% 2% * * 1%
Fieldwork: 17th - 22nd June 2016 Prepared by ComRes
Page 27

Table 9/2
CATI Opinion Poll - EU referendumQ4_1. During the referendum campaign, the following claims have been made about what would happen if Britain voted to leave the EU. Some are positive, others are negative. Can you please tell me if each claim has made you more likely to vote for Remain, more likely to vote for Leave or has it made no difference?
That we could save £350m a week sent to the EUBase: All respondents
REGION SUMMARY PAST VOTE – GENERAL ELECTION 2015 Total England Scotland England & Wales North Midlands South GB Cons Lab UKIP
Unweighted Total 1032 858 93 910 242 260 356 1003 236 258 106
Weighted Total 1032 866 88 916 242 261 364 1004 278 235 95100% 100% 100% 100% 100% 100% 100% 100% 100% 100% 100%
More likely to vote Remain 166 135 14 144 36 36 63 158 47 48 216% 16% 16% 16% 15% 14% 17% 16% 17% 20% 2%
More likely to vote Leave 386 333 28 348 101 105 127 376 116 62 7337% 38% 32% 38% 42% 40% 35% 37% 42% 27% 77%
Made no difference 471 392 44 416 103 118 171 460 111 124 2046% 45% 50% 45% 42% 45% 47% 46% 40% 53% 21%
Don't know 9 7 1 8 2 2 2 9 4 1 -1% 1% 2% 1% 1% 1% 1% 1% 1% * -
Fieldwork: 17th - 22nd June 2016 Prepared by ComRes
Page 28

Table 9/3
CATI Opinion Poll - EU referendumQ4_1. During the referendum campaign, the following claims have been made about what would happen if Britain voted to leave the EU. Some are positive, others are negative. Can you please tell me if each claim has made you more likely to vote for Remain, more likely to vote for Leave or has it made no difference?
That we could save £350m a week sent to the EUBase: All respondents
DECISION EDUCATION
Total Remain Leave Don't know Definitely decided May change mind University educatedNon-university
educated
Unweighted Total 1032 481 431 120 611 118 336 693
Weighted Total 1032 483 434 115 612 130 334 696100% 100% 100% 100% 100% 100% 100% 100%
More likely to vote Remain 166 150 6 10 104 18 72 9316% 31% 1% 8% 17% 14% 22% 13%
More likely to vote Leave 386 44 305 36 210 66 56 32937% 9% 70% 32% 34% 51% 17% 47%
Made no difference 471 284 122 65 296 44 201 26946% 59% 28% 57% 48% 33% 60% 39%
Don't know 9 5 * 4 2 2 5 51% 1% * 3% * 2% 1% 1%
Fieldwork: 17th - 22nd June 2016 Prepared by ComRes
Page 29

Table 10/1
CATI Opinion Poll - EU referendumQ4_2. During the referendum campaign, the following claims have been made about what would happen if Britain voted to leave the EU. Some are positive, others are negative. Can you please tell me if each claim has made you more likely to vote for Remain, more likely to vote for Leave or has it made no difference?
That we could introduce an Australian-style points system for immigrationBase: All respondents
GENDER AGE SOCIAL GRADE Total Male Female 18-24 25-34 35-44 45-54 55-64 65+ AB C1 C2 DE
Unweighted Total 1032 528 504 84 154 180 186 163 265 320 261 211 240
Weighted Total 1032 503 529 118 178 171 186 151 229 276 286 225 246100% 100% 100% 100% 100% 100% 100% 100% 100% 100% 100% 100% 100%
More likely to vote Remain 176 71 105 32 36 24 16 29 39 48 48 39 4117% 14% 20% 27% 20% 14% 9% 19% 17% 17% 17% 17% 17%
More likely to vote Leave 398 201 197 45 57 55 81 71 90 90 104 100 10339% 40% 37% 38% 32% 32% 43% 47% 39% 33% 37% 44% 42%
Made no difference 449 230 220 41 83 90 88 50 96 136 131 84 9844% 46% 41% 35% 47% 53% 47% 33% 42% 49% 46% 37% 40%
Don't know 9 1 8 - 2 2 1 * 4 1 2 2 31% * 2% - 1% 1% 1% * 2% * 1% 1% 1%
Fieldwork: 17th - 22nd June 2016 Prepared by ComRes
Page 30

Table 10/2
CATI Opinion Poll - EU referendumQ4_2. During the referendum campaign, the following claims have been made about what would happen if Britain voted to leave the EU. Some are positive, others are negative. Can you please tell me if each claim has made you more likely to vote for Remain, more likely to vote for Leave or has it made no difference?
That we could introduce an Australian-style points system for immigrationBase: All respondents
REGION SUMMARY PAST VOTE – GENERAL ELECTION 2015 Total England Scotland England & Wales North Midlands South GB Cons Lab UKIP
Unweighted Total 1032 858 93 910 242 260 356 1003 236 258 106
Weighted Total 1032 866 88 916 242 261 364 1004 278 235 95100% 100% 100% 100% 100% 100% 100% 100% 100% 100% 100%
More likely to vote Remain 176 146 15 152 26 47 72 167 41 54 417% 17% 17% 17% 11% 18% 20% 17% 15% 23% 4%
More likely to vote Leave 398 338 27 363 99 114 125 390 136 58 7339% 39% 31% 40% 41% 44% 34% 39% 49% 25% 77%
Made no difference 449 376 44 395 112 98 165 439 98 121 1844% 43% 51% 43% 46% 38% 45% 44% 35% 52% 19%
Don't know 9 6 1 6 4 2 1 8 3 2 *1% 1% 2% 1% 2% 1% * 1% 1% 1% *
Fieldwork: 17th - 22nd June 2016 Prepared by ComRes
Page 31

Table 10/3
CATI Opinion Poll - EU referendumQ4_2. During the referendum campaign, the following claims have been made about what would happen if Britain voted to leave the EU. Some are positive, others are negative. Can you please tell me if each claim has made you more likely to vote for Remain, more likely to vote for Leave or has it made no difference?
That we could introduce an Australian-style points system for immigrationBase: All respondents
DECISION EDUCATION
Total Remain Leave Don't know Definitely decided May change mind University educatedNon-university
educated
Unweighted Total 1032 481 431 120 611 118 336 693
Weighted Total 1032 483 434 115 612 130 334 696100% 100% 100% 100% 100% 100% 100% 100%
More likely to vote Remain 176 138 23 15 104 22 57 11917% 29% 5% 13% 17% 17% 17% 17%
More likely to vote Leave 398 57 299 43 211 72 82 31739% 12% 69% 37% 35% 55% 24% 46%
Made no difference 449 283 111 55 291 36 193 25344% 58% 26% 48% 48% 27% 58% 36%
Don't know 9 6 * 2 5 * 2 71% 1% * 2% 1% * 1% 1%
Fieldwork: 17th - 22nd June 2016 Prepared by ComRes
Page 32

Table 11/1
CATI Opinion Poll - EU referendumQ4_3. During the referendum campaign, the following claims have been made about what would happen if Britain voted to leave the EU. Some are positive, others are negative. Can you please tell me if each claim has made you more likely to vote for Remain, more likely to vote for Leave or has it made no difference?
That taxes will go up and there will be more public spending cutsBase: All respondents
GENDER AGE SOCIAL GRADE Total Male Female 18-24 25-34 35-44 45-54 55-64 65+ AB C1 C2 DE
Unweighted Total 1032 528 504 84 154 180 186 163 265 320 261 211 240
Weighted Total 1032 503 529 118 178 171 186 151 229 276 286 225 246100% 100% 100% 100% 100% 100% 100% 100% 100% 100% 100% 100% 100%
More likely to vote Remain 297 149 147 49 76 55 39 32 44 102 82 51 6229% 30% 28% 42% 43% 32% 21% 21% 19% 37% 29% 23% 25%
More likely to vote Leave 163 90 73 8 17 22 32 36 47 37 30 44 5216% 18% 14% 7% 10% 13% 17% 24% 20% 13% 11% 20% 21%
Made no difference 564 262 302 60 84 92 113 81 133 135 172 129 12855% 52% 57% 51% 47% 54% 61% 54% 58% 49% 60% 57% 52%
Don't know 9 1 8 - - 2 1 1 5 2 2 1 41% * 1% - - 1% * 1% 2% 1% 1% * 2%
Fieldwork: 17th - 22nd June 2016 Prepared by ComRes
Page 33
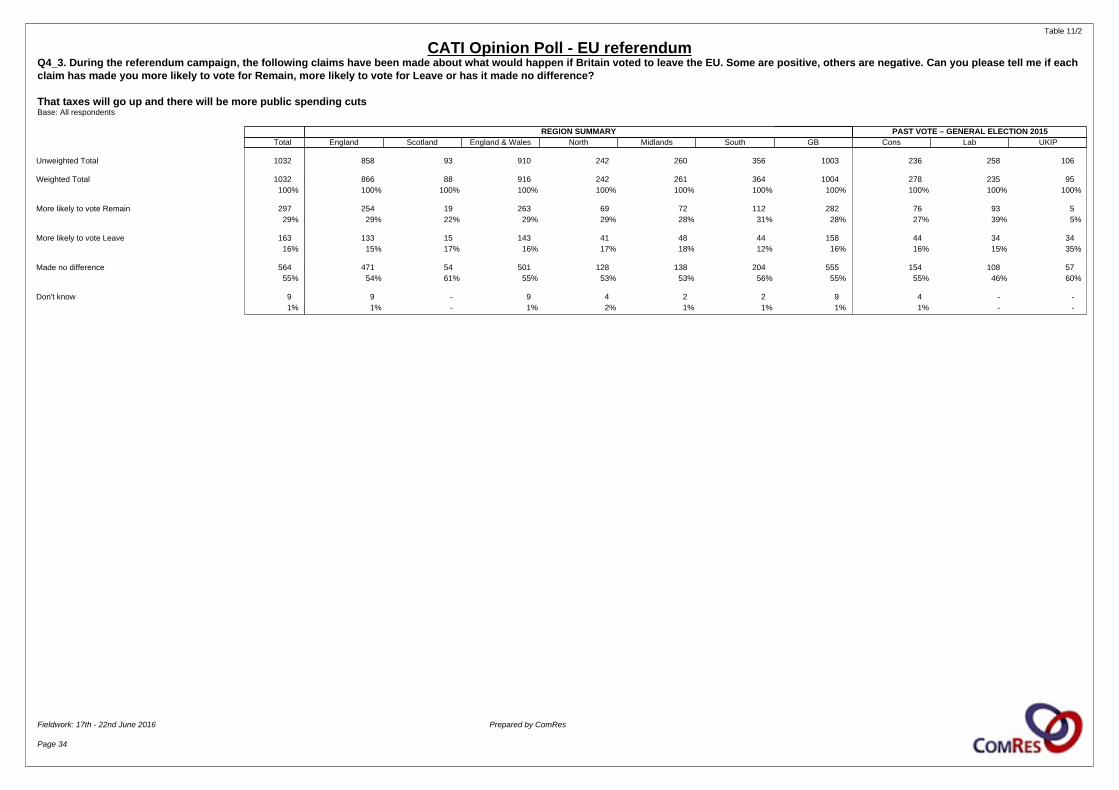
Table 11/2
CATI Opinion Poll - EU referendumQ4_3. During the referendum campaign, the following claims have been made about what would happen if Britain voted to leave the EU. Some are positive, others are negative. Can you please tell me if each claim has made you more likely to vote for Remain, more likely to vote for Leave or has it made no difference?
That taxes will go up and there will be more public spending cutsBase: All respondents
REGION SUMMARY PAST VOTE – GENERAL ELECTION 2015 Total England Scotland England & Wales North Midlands South GB Cons Lab UKIP
Unweighted Total 1032 858 93 910 242 260 356 1003 236 258 106
Weighted Total 1032 866 88 916 242 261 364 1004 278 235 95100% 100% 100% 100% 100% 100% 100% 100% 100% 100% 100%
More likely to vote Remain 297 254 19 263 69 72 112 282 76 93 529% 29% 22% 29% 29% 28% 31% 28% 27% 39% 5%
More likely to vote Leave 163 133 15 143 41 48 44 158 44 34 3416% 15% 17% 16% 17% 18% 12% 16% 16% 15% 35%
Made no difference 564 471 54 501 128 138 204 555 154 108 5755% 54% 61% 55% 53% 53% 56% 55% 55% 46% 60%
Don't know 9 9 - 9 4 2 2 9 4 - -1% 1% - 1% 2% 1% 1% 1% 1% - -
Fieldwork: 17th - 22nd June 2016 Prepared by ComRes
Page 34

Table 11/3
CATI Opinion Poll - EU referendumQ4_3. During the referendum campaign, the following claims have been made about what would happen if Britain voted to leave the EU. Some are positive, others are negative. Can you please tell me if each claim has made you more likely to vote for Remain, more likely to vote for Leave or has it made no difference?
That taxes will go up and there will be more public spending cutsBase: All respondents
DECISION EDUCATION
Total Remain Leave Don't know Definitely decided May change mind University educatedNon-university
educated
Unweighted Total 1032 481 431 120 611 118 336 693
Weighted Total 1032 483 434 115 612 130 334 696100% 100% 100% 100% 100% 100% 100% 100%
More likely to vote Remain 297 225 42 29 176 52 140 15729% 47% 10% 26% 29% 40% 42% 23%
More likely to vote Leave 163 25 122 16 99 16 19 14316% 5% 28% 14% 16% 12% 6% 21%
Made no difference 564 230 266 68 334 61 173 39055% 47% 61% 59% 54% 47% 52% 56%
Don't know 9 3 4 2 4 2 2 61% 1% 1% 1% 1% 1% * 1%
Fieldwork: 17th - 22nd June 2016 Prepared by ComRes
Page 35

Table 12/1
CATI Opinion Poll - EU referendumQ4_4. During the referendum campaign, the following claims have been made about what would happen if Britain voted to leave the EU. Some are positive, others are negative. Can you please tell me if each claim has made you more likely to vote for Remain, more likely to vote for Leave or has it made no difference?
That house prices will be lowerBase: All respondents
GENDER AGE SOCIAL GRADE Total Male Female 18-24 25-34 35-44 45-54 55-64 65+ AB C1 C2 DE
Unweighted Total 1032 528 504 84 154 180 186 163 265 320 261 211 240
Weighted Total 1032 503 529 118 178 171 186 151 229 276 286 225 246100% 100% 100% 100% 100% 100% 100% 100% 100% 100% 100% 100% 100%
More likely to vote Remain 174 83 91 20 52 27 18 23 34 56 48 36 3417% 16% 17% 17% 29% 16% 9% 15% 15% 20% 17% 16% 14%
More likely to vote Leave 203 108 96 42 33 22 37 32 36 43 53 51 5620% 21% 18% 36% 19% 13% 20% 21% 16% 15% 19% 23% 23%
Made no difference 648 309 338 55 93 120 131 94 155 173 185 137 15363% 62% 64% 47% 52% 70% 70% 62% 68% 63% 65% 61% 62%
Don't know 7 3 4 - - 2 - 1 3 3 - 1 21% 1% 1% - - 1% - 1% 1% 1% - 1% 1%
Fieldwork: 17th - 22nd June 2016 Prepared by ComRes
Page 36

Table 12/2
CATI Opinion Poll - EU referendumQ4_4. During the referendum campaign, the following claims have been made about what would happen if Britain voted to leave the EU. Some are positive, others are negative. Can you please tell me if each claim has made you more likely to vote for Remain, more likely to vote for Leave or has it made no difference?
That house prices will be lowerBase: All respondents
REGION SUMMARY PAST VOTE – GENERAL ELECTION 2015 Total England Scotland England & Wales North Midlands South GB Cons Lab UKIP
Unweighted Total 1032 858 93 910 242 260 356 1003 236 258 106
Weighted Total 1032 866 88 916 242 261 364 1004 278 235 95100% 100% 100% 100% 100% 100% 100% 100% 100% 100% 100%
More likely to vote Remain 174 138 16 149 28 46 64 165 47 51 117% 16% 18% 16% 12% 18% 18% 16% 17% 22% 1%
More likely to vote Leave 203 168 18 179 51 51 66 196 43 34 4320% 19% 20% 19% 21% 20% 18% 20% 15% 15% 45%
Made no difference 648 555 53 583 160 162 232 636 186 150 5163% 64% 60% 64% 66% 62% 64% 63% 67% 64% 53%
Don't know 7 5 1 5 2 1 2 6 2 - 11% 1% 2% 1% 1% * 1% 1% 1% - 1%
Fieldwork: 17th - 22nd June 2016 Prepared by ComRes
Page 37

Table 12/3
CATI Opinion Poll - EU referendumQ4_4. During the referendum campaign, the following claims have been made about what would happen if Britain voted to leave the EU. Some are positive, others are negative. Can you please tell me if each claim has made you more likely to vote for Remain, more likely to vote for Leave or has it made no difference?
That house prices will be lowerBase: All respondents
DECISION EDUCATION
Total Remain Leave Don't know Definitely decided May change mind University educatedNon-university
educated
Unweighted Total 1032 481 431 120 611 118 336 693
Weighted Total 1032 483 434 115 612 130 334 696100% 100% 100% 100% 100% 100% 100% 100%
More likely to vote Remain 174 150 12 12 107 27 82 9217% 31% 3% 11% 17% 21% 25% 13%
More likely to vote Leave 203 28 152 23 111 37 39 16420% 6% 35% 20% 18% 28% 12% 24%
Made no difference 648 302 267 79 392 66 210 43563% 62% 61% 69% 64% 50% 63% 63%
Don't know 7 4 3 1 3 1 2 51% 1% 1% * * 1% 1% 1%
Fieldwork: 17th - 22nd June 2016 Prepared by ComRes
Page 38

Table 13/1
CATI Opinion Poll - EU referendumQ4_5. During the referendum campaign, the following claims have been made about what would happen if Britain voted to leave the EU. Some are positive, others are negative. Can you please tell me if each claim has made you more likely to vote for Remain, more likely to vote for Leave or has it made no difference?
That we wouldn’t have to accept Turkish immigrants if they joined the EUBase: All respondents
GENDER AGE SOCIAL GRADE Total Male Female 18-24 25-34 35-44 45-54 55-64 65+ AB C1 C2 DE
Unweighted Total 1032 528 504 84 154 180 186 163 265 320 261 211 240
Weighted Total 1032 503 529 118 178 171 186 151 229 276 286 225 246100% 100% 100% 100% 100% 100% 100% 100% 100% 100% 100% 100% 100%
More likely to vote Remain 128 60 68 26 30 22 11 14 26 44 35 21 2812% 12% 13% 22% 17% 13% 6% 9% 11% 16% 12% 10% 11%
More likely to vote Leave 335 158 177 32 41 42 69 62 89 65 75 104 9232% 31% 33% 27% 23% 25% 37% 41% 39% 24% 26% 46% 37%
Made no difference 558 282 276 60 106 104 106 75 107 164 173 100 12154% 56% 52% 51% 60% 61% 57% 50% 47% 60% 60% 44% 49%
Don't know 11 2 9 - - 3 1 - 7 2 4 - 51% * 2% - - 2% 1% - 3% 1% 1% - 2%
Fieldwork: 17th - 22nd June 2016 Prepared by ComRes
Page 39

Table 13/2
CATI Opinion Poll - EU referendumQ4_5. During the referendum campaign, the following claims have been made about what would happen if Britain voted to leave the EU. Some are positive, others are negative. Can you please tell me if each claim has made you more likely to vote for Remain, more likely to vote for Leave or has it made no difference?
That we wouldn’t have to accept Turkish immigrants if they joined the EUBase: All respondents
REGION SUMMARY PAST VOTE – GENERAL ELECTION 2015 Total England Scotland England & Wales North Midlands South GB Cons Lab UKIP
Unweighted Total 1032 858 93 910 242 260 356 1003 236 258 106
Weighted Total 1032 866 88 916 242 261 364 1004 278 235 95100% 100% 100% 100% 100% 100% 100% 100% 100% 100% 100%
More likely to vote Remain 128 103 14 107 18 26 60 121 35 36 112% 12% 16% 12% 7% 10% 16% 12% 13% 15% 2%
More likely to vote Leave 335 286 25 303 86 91 109 328 115 49 6232% 33% 28% 33% 35% 35% 30% 33% 41% 21% 65%
Made no difference 558 470 46 498 136 143 191 544 124 149 3154% 54% 53% 54% 56% 55% 53% 54% 45% 63% 33%
Don't know 11 7 2 8 3 1 4 10 4 2 11% 1% 3% 1% 1% * 1% 1% 1% 1% 1%
Fieldwork: 17th - 22nd June 2016 Prepared by ComRes
Page 40

Table 13/3
CATI Opinion Poll - EU referendumQ4_5. During the referendum campaign, the following claims have been made about what would happen if Britain voted to leave the EU. Some are positive, others are negative. Can you please tell me if each claim has made you more likely to vote for Remain, more likely to vote for Leave or has it made no difference?
That we wouldn’t have to accept Turkish immigrants if they joined the EUBase: All respondents
DECISION EDUCATION
Total Remain Leave Don't know Definitely decided May change mind University educatedNon-university
educated
Unweighted Total 1032 481 431 120 611 118 336 693
Weighted Total 1032 483 434 115 612 130 334 696100% 100% 100% 100% 100% 100% 100% 100%
More likely to vote Remain 128 113 9 6 75 16 53 7612% 23% 2% 5% 12% 13% 16% 11%
More likely to vote Leave 335 36 261 38 184 51 45 28932% 7% 60% 33% 30% 39% 14% 41%
Made no difference 558 330 161 67 348 61 231 32554% 68% 37% 59% 57% 47% 69% 47%
Don't know 11 5 3 3 5 2 4 71% 1% 1% 3% 1% 1% 1% 1%
Fieldwork: 17th - 22nd June 2016 Prepared by ComRes
Page 41

Table 14/1
CATI Opinion Poll - EU referendumQ4_6. During the referendum campaign, the following claims have been made about what would happen if Britain voted to leave the EU. Some are positive, others are negative. Can you please tell me if each claim has made you more likely to vote for Remain, more likely to vote for Leave or has it made no difference?
That we can take back controlBase: All respondents
GENDER AGE SOCIAL GRADE Total Male Female 18-24 25-34 35-44 45-54 55-64 65+ AB C1 C2 DE
Unweighted Total 1032 528 504 84 154 180 186 163 265 320 261 211 240
Weighted Total 1032 503 529 118 178 171 186 151 229 276 286 225 246100% 100% 100% 100% 100% 100% 100% 100% 100% 100% 100% 100% 100%
More likely to vote Remain 176 75 101 29 41 27 17 18 46 55 46 34 4017% 15% 19% 24% 23% 15% 9% 12% 20% 20% 16% 15% 16%
More likely to vote Leave 455 219 237 46 51 67 99 86 106 104 111 127 11444% 44% 45% 39% 29% 39% 53% 57% 46% 38% 39% 56% 47%
Made no difference 396 209 188 43 86 76 70 47 74 116 129 64 8838% 42% 35% 37% 48% 45% 38% 31% 32% 42% 45% 29% 36%
Don't know 4 - 4 - - 1 - - 3 1 - - 3* - 1% - - 1% - - 1% * - - 1%
Fieldwork: 17th - 22nd June 2016 Prepared by ComRes
Page 42

Table 14/2
CATI Opinion Poll - EU referendumQ4_6. During the referendum campaign, the following claims have been made about what would happen if Britain voted to leave the EU. Some are positive, others are negative. Can you please tell me if each claim has made you more likely to vote for Remain, more likely to vote for Leave or has it made no difference?
That we can take back controlBase: All respondents
REGION SUMMARY PAST VOTE – GENERAL ELECTION 2015 Total England Scotland England & Wales North Midlands South GB Cons Lab UKIP
Unweighted Total 1032 858 93 910 242 260 356 1003 236 258 106
Weighted Total 1032 866 88 916 242 261 364 1004 278 235 95100% 100% 100% 100% 100% 100% 100% 100% 100% 100% 100%
More likely to vote Remain 176 152 11 158 37 43 72 168 46 57 217% 17% 12% 17% 15% 16% 20% 17% 17% 24% 3%
More likely to vote Leave 455 393 32 414 111 128 155 446 154 55 8244% 45% 36% 45% 46% 49% 43% 44% 56% 23% 86%
Made no difference 396 321 42 343 94 90 136 385 75 124 1138% 37% 48% 37% 39% 35% 37% 38% 27% 53% 12%
Don't know 4 1 3 1 - - 1 4 3 - -* * 3% * - - * * 1% - -
Fieldwork: 17th - 22nd June 2016 Prepared by ComRes
Page 43

Table 14/3
CATI Opinion Poll - EU referendumQ4_6. During the referendum campaign, the following claims have been made about what would happen if Britain voted to leave the EU. Some are positive, others are negative. Can you please tell me if each claim has made you more likely to vote for Remain, more likely to vote for Leave or has it made no difference?
That we can take back controlBase: All respondents
DECISION EDUCATION
Total Remain Leave Don't know Definitely decided May change mind University educatedNon-university
educated
Unweighted Total 1032 481 431 120 611 118 336 693
Weighted Total 1032 483 434 115 612 130 334 696100% 100% 100% 100% 100% 100% 100% 100%
More likely to vote Remain 176 151 12 13 103 21 70 10617% 31% 3% 12% 17% 16% 21% 15%
More likely to vote Leave 455 47 362 46 255 75 90 36544% 10% 83% 40% 42% 58% 27% 52%
Made no difference 396 282 60 54 251 34 171 22338% 58% 14% 47% 41% 26% 51% 32%
Don't know 4 4 - 1 4 - 3 2* 1% - 1% 1% - 1% *
Fieldwork: 17th - 22nd June 2016 Prepared by ComRes
Page 44

Table 15/1
CATI Opinion Poll - EU referendumQ4_7. During the referendum campaign, the following claims have been made about what would happen if Britain voted to leave the EU. Some are positive, others are negative. Can you please tell me if each claim has made you more likely to vote for Remain, more likely to vote for Leave or has it made no difference?
That it would be a leap in the darkBase: All respondents
GENDER AGE SOCIAL GRADE Total Male Female 18-24 25-34 35-44 45-54 55-64 65+ AB C1 C2 DE
Unweighted Total 1032 528 504 84 154 180 186 163 265 320 261 211 240
Weighted Total 1032 503 529 118 178 171 186 151 229 276 286 225 246100% 100% 100% 100% 100% 100% 100% 100% 100% 100% 100% 100% 100%
More likely to vote Remain 312 153 159 50 84 55 38 37 49 117 90 51 5330% 30% 30% 42% 47% 32% 20% 24% 21% 43% 31% 23% 22%
More likely to vote Leave 171 86 86 15 16 23 32 36 50 35 32 47 5717% 17% 16% 13% 9% 13% 17% 24% 22% 13% 11% 21% 23%
Made no difference 543 260 283 53 78 92 113 77 130 121 163 123 13553% 52% 54% 45% 44% 54% 61% 51% 57% 44% 57% 55% 55%
Don't know 6 4 1 - - 1 3 1 - 1 1 3 -1% 1% * - - 1% 2% 1% - * * 1% -
Fieldwork: 17th - 22nd June 2016 Prepared by ComRes
Page 45

Table 15/2
CATI Opinion Poll - EU referendumQ4_7. During the referendum campaign, the following claims have been made about what would happen if Britain voted to leave the EU. Some are positive, others are negative. Can you please tell me if each claim has made you more likely to vote for Remain, more likely to vote for Leave or has it made no difference?
That it would be a leap in the darkBase: All respondents
REGION SUMMARY PAST VOTE – GENERAL ELECTION 2015 Total England Scotland England & Wales North Midlands South GB Cons Lab UKIP
Unweighted Total 1032 858 93 910 242 260 356 1003 236 258 106
Weighted Total 1032 866 88 916 242 261 364 1004 278 235 95100% 100% 100% 100% 100% 100% 100% 100% 100% 100% 100%
More likely to vote Remain 312 261 24 276 63 68 130 300 79 107 430% 30% 27% 30% 26% 26% 36% 30% 28% 46% 4%
More likely to vote Leave 171 145 12 153 55 44 45 166 43 27 3917% 17% 14% 17% 23% 17% 12% 17% 15% 12% 41%
Made no difference 543 458 50 482 123 148 187 532 155 100 5253% 53% 57% 53% 51% 57% 51% 53% 56% 42% 55%
Don't know 6 2 1 4 1 - 1 6 1 1 -1% * 2% * * - * 1% * * -
Fieldwork: 17th - 22nd June 2016 Prepared by ComRes
Page 46

Table 15/3
CATI Opinion Poll - EU referendumQ4_7. During the referendum campaign, the following claims have been made about what would happen if Britain voted to leave the EU. Some are positive, others are negative. Can you please tell me if each claim has made you more likely to vote for Remain, more likely to vote for Leave or has it made no difference?
That it would be a leap in the darkBase: All respondents
DECISION EDUCATION
Total Remain Leave Don't know Definitely decided May change mind University educatedNon-university
educated
Unweighted Total 1032 481 431 120 611 118 336 693
Weighted Total 1032 483 434 115 612 130 334 696100% 100% 100% 100% 100% 100% 100% 100%
More likely to vote Remain 312 266 19 26 194 43 151 16030% 55% 4% 23% 32% 33% 45% 23%
More likely to vote Leave 171 11 146 14 99 23 16 15417% 2% 34% 12% 16% 17% 5% 22%
Made no difference 543 205 268 70 318 64 164 37853% 42% 62% 61% 52% 49% 49% 54%
Don't know 6 1 - 4 1 - 2 31% * - 4% * - 1% *
Fieldwork: 17th - 22nd June 2016 Prepared by ComRes
Page 47

Table 16/1
CATI Opinion Poll - EU referendumQ4_8. During the referendum campaign, the following claims have been made about what would happen if Britain voted to leave the EU. Some are positive, others are negative. Can you please tell me if each claim has made you more likely to vote for Remain, more likely to vote for Leave or has it made no difference?
That it could lead to a recessionBase: All respondents
GENDER AGE SOCIAL GRADE Total Male Female 18-24 25-34 35-44 45-54 55-64 65+ AB C1 C2 DE
Unweighted Total 1032 528 504 84 154 180 186 163 265 320 261 211 240
Weighted Total 1032 503 529 118 178 171 186 151 229 276 286 225 246100% 100% 100% 100% 100% 100% 100% 100% 100% 100% 100% 100% 100%
More likely to vote Remain 352 173 178 43 101 61 56 37 53 131 100 60 6234% 35% 34% 37% 57% 36% 30% 24% 23% 48% 35% 26% 25%
More likely to vote Leave 141 72 69 18 6 15 26 33 42 22 32 38 4814% 14% 13% 16% 3% 9% 14% 22% 18% 8% 11% 17% 20%
Made no difference 529 253 275 55 71 92 101 80 130 117 153 124 13551% 50% 52% 47% 40% 54% 54% 53% 57% 43% 53% 55% 55%
Don't know 11 4 7 1 - 2 2 1 4 5 1 4 11% 1% 1% 1% - 1% 1% 1% 2% 2% * 2% *
Fieldwork: 17th - 22nd June 2016 Prepared by ComRes
Page 48

Table 16/2
CATI Opinion Poll - EU referendumQ4_8. During the referendum campaign, the following claims have been made about what would happen if Britain voted to leave the EU. Some are positive, others are negative. Can you please tell me if each claim has made you more likely to vote for Remain, more likely to vote for Leave or has it made no difference?
That it could lead to a recessionBase: All respondents
REGION SUMMARY PAST VOTE – GENERAL ELECTION 2015 Total England Scotland England & Wales North Midlands South GB Cons Lab UKIP
Unweighted Total 1032 858 93 910 242 260 356 1003 236 258 106
Weighted Total 1032 866 88 916 242 261 364 1004 278 235 95100% 100% 100% 100% 100% 100% 100% 100% 100% 100% 100%
More likely to vote Remain 352 300 21 314 80 86 134 336 98 110 234% 35% 25% 34% 33% 33% 37% 33% 35% 47% 2%
More likely to vote Leave 141 115 11 126 42 37 35 136 38 22 3514% 13% 12% 14% 17% 14% 10% 14% 14% 9% 36%
Made no difference 529 445 52 469 115 137 193 521 138 101 5951% 51% 59% 51% 48% 53% 53% 52% 50% 43% 62%
Don't know 11 6 4 7 5 - 1 11 5 2 -1% 1% 4% 1% 2% - * 1% 2% 1% -
Fieldwork: 17th - 22nd June 2016 Prepared by ComRes
Page 49

Table 16/3
CATI Opinion Poll - EU referendumQ4_8. During the referendum campaign, the following claims have been made about what would happen if Britain voted to leave the EU. Some are positive, others are negative. Can you please tell me if each claim has made you more likely to vote for Remain, more likely to vote for Leave or has it made no difference?
That it could lead to a recessionBase: All respondents
DECISION EDUCATION
Total Remain Leave Don't know Definitely decided May change mind University educatedNon-university
educated
Unweighted Total 1032 481 431 120 611 118 336 693
Weighted Total 1032 483 434 115 612 130 334 696100% 100% 100% 100% 100% 100% 100% 100%
More likely to vote Remain 352 288 30 34 212 56 180 17234% 60% 7% 29% 35% 43% 54% 25%
More likely to vote Leave 141 19 111 11 82 15 12 12814% 4% 26% 10% 13% 12% 4% 18%
Made no difference 529 174 290 65 314 59 138 38851% 36% 67% 56% 51% 45% 41% 56%
Don't know 11 3 3 5 4 - 3 81% 1% 1% 5% 1% - 1% 1%
Fieldwork: 17th - 22nd June 2016 Prepared by ComRes
Page 50

Table 17/1
CATI Opinion Poll - EU referendumQ5. If the UK voted to leave the European Union, which of the following do you think would do the best job as British Prime Minister negotiating Britain's withdrawal from the EU?Base: All respondents
GENDER AGE SOCIAL GRADE Total Male Female 18-24 25-34 35-44 45-54 55-64 65+ AB C1 C2 DE
Unweighted Total 1032 528 504 84 154 180 186 163 265 320 261 211 240
Weighted Total 1032 503 529 118 178 171 186 151 229 276 286 225 246100% 100% 100% 100% 100% 100% 100% 100% 100% 100% 100% 100% 100%
David Cameron 339 169 170 47 75 61 40 38 77 115 90 58 7533% 34% 32% 40% 43% 36% 22% 25% 33% 42% 32% 26% 31%
Boris Johnson 180 97 83 23 10 28 51 28 39 32 48 57 4217% 19% 16% 19% 6% 17% 27% 19% 17% 12% 17% 25% 17%
Michael Gove 82 44 38 5 7 3 15 17 35 19 17 18 278% 9% 7% 4% 4% 2% 8% 11% 15% 7% 6% 8% 11%
George Osborne 34 15 19 7 10 4 5 3 5 7 13 3 103% 3% 4% 6% 5% 2% 3% 2% 2% 3% 5% 1% 4%
Theresa May 149 55 93 6 20 26 30 31 36 42 39 30 3714% 11% 18% 5% 11% 15% 16% 20% 16% 15% 14% 13% 15%
None of these 198 106 92 20 49 38 40 26 25 55 66 40 3719% 21% 17% 17% 27% 22% 22% 17% 11% 20% 23% 18% 15%
Don't know 52 17 35 10 7 10 3 9 13 4 13 18 175% 3% 7% 9% 4% 6% 2% 6% 6% 1% 5% 8% 7%
Fieldwork: 17th - 22nd June 2016 Prepared by ComRes
Page 51

Table 17/2
CATI Opinion Poll - EU referendumQ5. If the UK voted to leave the European Union, which of the following do you think would do the best job as British Prime Minister negotiating Britain's withdrawal from the EU?Base: All respondents
REGION SUMMARY PAST VOTE – GENERAL ELECTION 2015 Total England Scotland England & Wales North Midlands South GB Cons Lab UKIP
Unweighted Total 1032 858 93 910 242 260 356 1003 236 258 106
Weighted Total 1032 866 88 916 242 261 364 1004 278 235 95100% 100% 100% 100% 100% 100% 100% 100% 100% 100% 100%
David Cameron 339 278 33 293 68 87 123 326 111 76 833% 32% 38% 32% 28% 34% 34% 33% 40% 32% 8%
Boris Johnson 180 154 13 163 42 54 58 176 50 18 4617% 18% 14% 18% 17% 21% 16% 17% 18% 8% 48%
Michael Gove 82 70 6 74 18 21 31 80 42 9 148% 8% 7% 8% 7% 8% 8% 8% 15% 4% 15%
George Osborne 34 30 * 33 11 9 11 33 9 12 53% 3% * 4% 4% 3% 3% 3% 3% 5% 5%
Theresa May 149 123 12 128 36 34 52 140 41 42 414% 14% 14% 14% 15% 13% 14% 14% 15% 18% 4%
None of these 198 166 21 176 49 45 72 198 16 66 1719% 19% 24% 19% 20% 17% 20% 20% 6% 28% 18%
Don't know 52 47 2 49 19 10 18 51 8 12 15% 5% 2% 5% 8% 4% 5% 5% 3% 5% 1%
Fieldwork: 17th - 22nd June 2016 Prepared by ComRes
Page 52

Table 17/3
CATI Opinion Poll - EU referendumQ5. If the UK voted to leave the European Union, which of the following do you think would do the best job as British Prime Minister negotiating Britain's withdrawal from the EU?Base: All respondents
DECISION EDUCATION
Total Remain Leave Don't know Definitely decided May change mind University educatedNon-university
educated
Unweighted Total 1032 481 431 120 611 118 336 693
Weighted Total 1032 483 434 115 612 130 334 696100% 100% 100% 100% 100% 100% 100% 100%
David Cameron 339 232 75 31 204 52 145 19433% 48% 17% 27% 33% 40% 43% 28%
Boris Johnson 180 23 142 14 110 26 25 15517% 5% 33% 12% 18% 20% 7% 22%
Michael Gove 82 9 70 3 56 3 13 698% 2% 16% 2% 9% 3% 4% 10%
George Osborne 34 22 11 * 20 7 15 193% 5% 3% * 3% 5% 4% 3%
Theresa May 149 77 55 17 88 12 51 9814% 16% 13% 15% 14% 9% 15% 14%
None of these 198 99 64 35 106 24 74 12019% 20% 15% 30% 17% 18% 22% 17%
Don't know 52 20 17 14 29 7 11 415% 4% 4% 13% 5% 5% 3% 6%
Fieldwork: 17th - 22nd June 2016 Prepared by ComRes
Page 53

Table 18/1
CATI Opinion Poll - EU referendumCVQ1. Thinking back to the General Election in May last year, which party, if any, did you vote for? Was it Conservative, Labour, Liberal Democrat, UKIP, SNP some other party, or did you not vote?Base: All respondents
Unweighted Weighted
Unweighted Total 1032 1032
Weighted Total 1032 1032100% 100%
Conservative 236 27823% 27%
Labour 258 23525% 23%
Liberal Democrat 66 616% 6%
UKIP 106 9510% 9%
SNP 32 363% 4%
Some other party 71 427% 4%
Did not vote 187 20818% 20%
Don't remember 18 212% 2%
Refused 29 273% 3%
NA-Northern Ireland 29 283% 3%
Fieldwork: 17th - 22nd June 2016 Prepared by ComRes
Page 54