daimler fact sheet for q2 2017 and h1 2017 - mercedes-benz
TRANSCRIPT

Fact Sheet for Q2 2017 and H1 2017
July 26, 2017

Contents
Daimler Group
Stock Market Information 3
Earnings and Financial Situation 4 - 12
Information for Divisions
Mercedes-Benz Cars 13 - 16
Daimler Trucks 17 - 21
Mercedes-Benz Vans 22 - 24
Daimler Buses 25 - 26
Daimler Financial Services 27
2

Stock Market Information
3rd Quarter 4th Quarter 1st Quarter 2nd Quarter January - June
2016 2015 2016 2015 2017 2016 2017 2016 Change 2017 2016 Change
Earnings per share (in EUR)
basic 2.43 2.23 2.01 1.69 2.53 1.26 2.28 2.27 +0% 4.81 3.54 +36%
diluted 2.43 2.23 2.01 1.69 2.53 1.26 2.28 2.27 +0% 4.81 3.54 +36%
Average number of
shares outstanding (in millions)
(adjusted for treasury stocks)
basic 1,069.8 1,069.8 1,069.8 1,069.8 1,069.8 1,069.8 1,069.8 1,069.8 0% 1,069.8 1,069.8 0%
diluted 1,069.8 1,069.8 1,069.8 1,069.8 1,069.8 1,069.8 1,069.8 1,069.8 0% 1,069.8 1,069.8 0%
Number of shares outstanding 1,069.8 1,069.8 1,069.8 1,069.8 1,069.8 1,069.8 1,069.8 1,069.8 0%
(at period end, in millions)
Share price Frankfurt 62.71 64.85 70.72 77.58 69.20 67.37 63.37 53.52 +18%
(at period end, in EUR)
Market capitalization Frankfurt 67.09 69.38 75.66 83.00 74.03 72.07 67.80 57.26 +18%
(at period end, in billions of EUR)
3

Key Figures and Ratios
3rd Quarter 4th Quarter 1st Quarter 2nd Quarter January - June
(in millions of EUR) 2016 2015 2016 2015 2017 2016 2017 2016 Change 2017 2016 Change
Unit Sales (in units) 754,130 720,016 799,031 776,625 754,259 683,885 822,504 761,340 +8% 1,576,763 1,445,225 +9%
Revenue 38,597 37,276 41,001 40,428 38,776 35,047 41,158 38,616 +7% 79,934 73,663 +9%
EBIT 4,037 3,661 3,459 2,901 4,008 2,148 3,746 3,258 +15% 7,754 5,406 +43%
Net profit (loss), Group 2,726 2,415 2,206 1,874 2,801 1,400 2,507 2,452 +2% 5,308 3,852 +38%
Profit (loss) attributable to 2,595 2,385 2,149 1,807 2,706 1,353 2,439 2,429 +0% 5,145 3,782 +36%
shareholders of Daimler AG
R&D expenditure total 1,892 1,596 2,125 1,821 2,133 1,724 2,132 1,831 +16% 4,265 3,555 +20%
Expensed R&D costs 1,298 1,132 1,458 1,313 1,448 1,238 1,414 1,263 +12% 2,862 2,501 +14%
Capitalized development costs 594 464 667 508 685 486 718 568 +26% 1,403 1,054 +33%
Amortization on capitalized 318 310 318 324 326 314 331 318 +4% 657 632 +4%
development costs
Depreciation and amortization* 1,404 1,309 1,350 1,385 1,369 1,317 1,356 1,325 +2% 2,725 2,642 +3%
Capital expenditure total* 2,224 1,777 2,897 3,258 2,213 1,768 2,718 2,211 +23% 4,931 3,979 +24%
Investment in pp&e 1,418 1,131 1,993 1,854 1,290 1,116 1,397 1,325 +5% 2,687 2,441 +10%
Capitalized development costs 594 464 667 508 685 486 718 568 +26% 1,403 1,054 +33%
Financial investments and 212 182 237 896 238 166 603 318 +90% 841 484 +74% other intangible assets
* Industrial business.
(including amortization on capitalized development
costs, excluding depreciation on leased assets)
4

Free Cash Flow and Net Liquidity of the Industrial Business
3rd Quarter 4th Quarter 1st Quarter 2nd Quarter January - June
(in millions of EUR) 2016 2015 2016 2015 2017 2016 2017 2016 Change 2017 2016 Change
Net liquidity
at the beginning of the period 17,448 18,435 17,906 19,527 19,737 18,580 21,073 18,465 +14% 19,737 18,580 +6%
Free cash flow 473 1,463 1,281 -868 1,945 264 1,093 1,856 -41% 3,038 2,120 +43%
thereof: working capital* -1,197 -1,224 -299 -162 882 -223 98 247 -60% 980 24 .
Other -15 -371 550 -79 -609 -379 -3,784 -2,873 . -4,393 -3,252 .
thereof: dividends Daimler AG 0 0 0 0 0 0 -3,477 -3,477 . -3,477 -3,477 .
Net liquidity
at the end of the period 17,906 19,527 19,737 18,580 21,073 18,465 18,382 17,448 +5% 18,382 17,448 +5%
* Inventories, trade receivables and trade payables.
1)1)
5

Liquidity
3rd Quarter 4th Quarter 1st Quarter 2nd Quarter End of
(in millions of EUR) 2016 2015 2016 2015 2017 2016 2017 2016 Change Q2 2017 2016 Change
Group liquidity
Cash and cash equivalents 14,189 12,057 10,981 9,936 12,966 12,723 12,995 13,988 -7% 12,995 10,981 +18%
Marketable securities and term deposits 9,362 6,391 10,748 8,273 8,652 10,342 8,801 8,952 -2% 8,801 10,748 -18%
Gross liquidity 23,551 18,448 21,729 18,209 21,618 23,065 21,796 22,940 -5% 21,796 21,729 +0%
Financing liabilities (nominal) -110,880 -95,055 -117,625 -100,559 -117,411 -104,060 -119,426 -109,489 . -119,426 -117,625 .
Net debt -87,329 -76,607 -95,896 -82,350 -95,793 -80,995 -97,630 -86,549 . -97,630 -95,896 .
Liquidity of the industrial business
Cash and cash equivalents 12,577 10,742 8,751 8,369 11,307 11,156 11,030 12,665 -13% 11,030 8,751 +26%
Marketable securities and term deposits 8,149 5,131 9,498 6,999 7,443 9,078 7,635 7,701 -1% 7,635 9,498 -20%
Gross liquidity 20,726 15,873 18,249 15,368 18,750 20,234 18,665 20,366 -8% 18,665 18,249 +2%
Financing liabilities (nominal) -2,820 3,654 1,488 3,212 2,323 -1,769 -283 -2,918 . -283 1,488 .
Net liquidity 17,906 19,527 19,737 18,580 21,073 18,465 18,382 17,448 +5% 18,382 19,737 -7%
6

Pension and Health-Care Benefits
3rd Quarter 4th Quarter 1st Quarter 2nd Quarter End of
(in billions of EUR) 2016 2015 2016 2015 2017 2016 2017 2016 Change Q2 2017 2016 Change
Pension benefits
Benefit obligations -33.6 -28.9 -31.2 -27.6 -31.2 -30.2 -31.7 -32.3 . -31.7 -31.2 .
Plan assets 22.7 18.1 23.4 20.2 23.5 20.0 23.6 22.1 +7% 23.6 23.4 +1%
Funded status -10.9 -10.8 -7.8 -7.4 -7.7 -10.2 -8.1 -10.2 . -8.1 -7.8 .
Funding ratio 67.6% 62.6% 75.0% 73.2% 75.3% 66.2% 74.4% 68.4% . 74.4% 75.0% .
Health-care benefits
Benefit obligations -1.2 -1.1 -1.2 -1.1 -1.2 -1.1 -1.1 -1.1 . -1.1 -1.2 .
Plan assets 0.0 0.0 0.0 0.0 0.0 0.0 0.0 0.0 . 0.0 0.0 .
Reimbursement Medicare Act 0.0 0.1 0.1 0.0 0.1 0.0 0.1 0.0 . 0.1 0.1 0%
Funded status -1.2 -1.0 -1.1 -1.1 -1.1 -1.1 -1.0 -1.1 . -1.0 -1.1 .
7

Unit Sales
3rd Quarter 4th Quarter 1st Quarter 2nd Quarter January - June
(in units) 2016 2015 2016 2015 2017 2016 2017 2016 Change 2017 2016 Change
Mercedes-Benz Cars 565,564 508,350 589,119 532,686 568,070 496,756 595,178 546,517 +9% 1,163,248 1,043,273 +11%
Daimler Trucks 97,143 128,496 104,019 136,445 94,007 105,664 116,429 108,282 +8% 210,436 213,946 -2%
Mercedes-Benz Vans 85,238 75,732 97,628 99,869 86,778 76,647 103,393 99,583 +4% 190,171 176,230 +8%
Daimler Buses 6,185 7,438 8,265 7,625 5,404 4,818 7,504 6,958 +8% 12,908 11,776 +10%
Daimler Group 754,130 720,016 799,031 776,625 754,259 683,885 822,504 761,340 +8% 1,576,763 1,445,225 +9%
8

Production Volume
3rd Quarter 4th Quarter 1st Quarter 2nd Quarter January - June
(in units) 2016 2015 2016 2015 2017 2016 2017 2016 Change 2017 2016 Change
Mercedes-Benz Cars 596,443 540,200 545,839 520,703 584,942 523,029 600,358 570,041 +5% 1,185,300 1,093,070 +8%
Daimler Trucks 98,741 129,890 90,114 127,565 104,799 111,909 119,522 110,501 +8% 224,321 222,410 +1%
Mercedes-Benz Vans 84,123 77,425 91,022 89,475 104,116 89,741 100,884 103,688 -3% 205,000 193,429 +6%
Daimler Buses 6,952 7,070 7,052 6,292 6,583 5,576 7,973 6,600 +21% 14,556 12,176 +20%
Daimler Group 786,259 754,585 734,027 744,035 800,440 730,255 828,737 790,830 +5% 1,629,177 1,521,085 +7%
9

Revenue
3rd Quarter 4th Quarter 1st Quarter 2nd Quarter January - June
(in millions of EUR) 2016 2015 2016 2015 2017 2016 2017 2016 Change 2017 2016 Change
Mercedes-Benz Cars 23,251 20,707 23,931 22,457 22,723 19,980 23,571 22,122 +7% 46,294 42,102 +10%
Daimler Trucks 7,851 9,650 8,466 10,073 7,940 8,204 9,028 8,666 +4% 16,968 16,870 +1%
Mercedes-Benz Vans 3,120 2,752 3,459 3,477 2,993 2,815 3,324 3,441 -3% 6,317 6,256 +1%
Daimler Buses 937 1,018 1,287 1,181 900 830 1,154 1,122 +3% 2,054 1,952 +5%
Daimler Financial Services 5,133 4,702 5,651 4,942 5,911 4,862 5,930 5,014 +18% 11,841 9,876 +20%
Reconciliation -1,695 -1,553 -1,793 -1,702 -1,691 -1,644 -1,849 -1,749 . -3,540 -3,393 .
Daimler Group 38,597 37,276 41,001 40,428 38,776 35,047 41,158 38,616 +7% 79,934 73,663 +9%
10

Earnings Before Interest and Taxes (EBIT) and Return on Sales (RoS)
3rd Quarter 4th Quarter 1st Quarter 2nd Quarter January - June
(EBIT in millions of EUR, RoS in %) 2016 2015 2016 2015 2017 2016 2017 2016 Change 2017 2016 Change
Mercedes-Benz Cars
EBIT 2,746 2,183 2,561 1,675 2,234 1,395 2,404 1,410 +70% 4,638 2,805 +65%
RoS 11.8% 10.5% 10.7% 7.5% 9.8% 7.0% 10.2% 6.4% . 10.0% 6.7% .
Daimler Trucks
EBIT 464 791 347 631 668 516 543 621 -13% 1,211 1,137 +7%
RoS 5.9% 8.2% 4.1% 6.3% 8.4% 6.3% 6.0% 7.2% . 7.1% 6.7% .
Mercedes-Benz Vans
EBIT 312 193 156 238 357 301 358 401 -11% 715 702 +2%
RoS 10.0% 7.0% 4.5% 6.8% 11.9% 10.7% 10.8% 11.7% . 11.3% 11.2% .
Daimler Buses
EBIT 45 89 77 34 65 39 64 88 -27% 129 127 +2%
RoS 4.8% 8.7% 6.0% 2.9% 7.2% 4.7% 5.5% 7.8% . 6.3% 6.5% .
Daimler Financial Services
EBIT 438 378 390 387 524 432 522 479 +9% 1,046 911 +15%
Return on equity (RoE) 17.7% 16.6% 15.2% 16.0% 19.3% 17.4% 18.8% 19.3% . 19.1% 18.4% .
Reconciliation 32 27 -72 -64 160 -535 -145 259 . 15 -276 .
Daimler Group 4,037 3,661 3,459 2,901 4,008 2,148 3,746 3,258 +15% 7,754 5,406 +43%
11

Disclosed Items Affecting EBIT
3rd Quarter 4th Quarter 1st Quarter 2nd Quarter January - June
(in millions of EUR) 2016 2015 2016 2015 2017 2016 2017 2016 2017 2016
Restructuring of own dealer network 41 21 -53 -49 - -10 - -11 - -21
Relocation of headquarters of MBUSA - 1 - -9 - - - - - -
Expenses in connection with Takata airbags - - -20 -300 - -20 - -440 - -460
Public-sector levies related to prior periods - - - -121 - - - - - -
Profit/loss in connection with remeasurement of inventories 46 - - - - - - -284 - -284
Settlement in connection with patent dispute - - - - - - - -64 - -64
Involvement of new investors in HERE - - - - 183 - - - 183 -
Workforce adjustments -49 -10 -8 -23 - - - -34 - -34
Restructuring of own dealer network 3 -4 -10 -24 - -1 - -6 - -7
Sale of Atlantis Foundries - - - -6 - - - - - -
Sale of real estate at the Kawasaki site in Japan - - - - 267 - - - 267 -
Expenses related to fixed cost optimization - - - - - - -24 - -24 -
Restructuring of own dealer network - -3 -8 -18 - -1 - -2 - -3
Relocation of headquarters of MBUSA - - - -1 - - - - - -
Expenses in connection with Takata airbags -7 - -13 -40 - -4 - -59 - -63
Workforce adjustments in Germany - - -8 - - -30 - - - -30
Restructuring of own dealer network 1 -1 - -2 - - - -1 - -1
Sale of investment in New MCI Holdings Inc. - - - 16 - - - - - -
Workforce adjustments -8 - -1 - - - - - - -
Expenses related to legal proceedings - - - - - - - -400 - -400
Impairment of investment in BAIC Motor - - - - - -244 - - - -244
Losses from currency transactions (not alloc. to business operations) - - - - - -222 - -19 - -241
Contribution of shares of Renault and Nissan to pension plan assets - - - - - - - 605 - 605
Impairment reversal of investment in BAIC Motor - - - - 240 - - - 240 -
Me
rce
de
s-
Be
nz
Ca
rs
Da
imle
r
Tru
ck
s
Me
rce
de
s-
Be
nz
Va
ns
Da
imle
r
Bu
se
sR
eco
ncil
iati
on
12

Mercedes-Benz Cars
Overview
3rd Quarter 4th Quarter 1st Quarter 2nd Quarter January - June
2016 2015 2016 2015 2017 2016 2017 2016 Change 2017 2016 Change
Unit sales (units) 565,564 508,350 589,119 532,686 568,070 496,756 595,178 546,517 +9% 1,163,248 1,043,273 +11%
Retail sales (units) 563,487 503,853 584,798 526,611 594,781 518,940 619,367 561,189 +10% 1,214,148 1,080,129 +12%
Production (units) 596,443 540,200 545,839 520,703 584,942 523,029 600,358 570,041 +5% 1,185,300 1,093,070 +8%
Revenue (millions of EUR) 23,251 20,707 23,931 22,457 22,723 19,980 23,571 22,122 +7% 46,294 42,102 +10%
EBIT (millions of EUR) 2,746 2,183 2,561 1,675 2,234 1,395 2,404 1,410 +70% 4,638 2,805 +65%
Return on sales (%) 11.8% 10.5% 10.7% 7.5% 9.8% 7.0% 10.2% 6.4% . 10.0% 6.7% .
V-Class retail sales 12,177 7,336 12,238 8,951 12,567 9,401 15,963 12,879 +24% 28,530 22,280 +28%
(included in MBC retail sales)
13

Mercedes-Benz Cars
Unit Sales
3rd Quarter 4th Quarter 1st Quarter 2nd Quarter January - June
(in units) 2016 2015 2016 2015 2017 2016 2017 2016 Change 2017 2016 Change
Mercedes-Benz Cars 565,564 508,350 589,119 532,686 568,070 496,756 595,178 546,517 +9% 1,163,248 1,043,273 +11%
Europe 244,553 218,602 256,247 230,872 241,403 222,663 270,433 256,260 +6% 511,836 478,923 +7%
of which Germany 79,064 73,445 80,873 78,165 74,072 69,723 85,369 84,040 +2% 159,441 153,763 +4%
NAFTA 105,123 100,332 110,219 105,798 93,184 89,830 94,554 100,934 -6% 187,738 190,764 -2%
of which USA 89,878 88,073 93,449 92,938 78,425 77,256 77,605 86,624 -10% 156,030 163,880 -5%
Asia 190,566 163,335 196,332 172,501 210,730 162,691 204,709 165,803 +23% 415,439 328,494 +26%
of which China 126,601 105,675 135,487 116,142 154,563 108,342 150,146 117,134 +28% 304,709 225,476 +35%
of which locally produced vehicles 83,376 72,249 90,295 74,905 109,438 69,832 101,371 73,566 +38% 210,809 143,398 +47%
Rest of World 25,322 26,081 26,321 23,515 22,753 21,572 25,482 23,520 +8% 48,235 45,092 +7%
14

Mercedes-Benz Cars
Retail Sales
3rd Quarter 4th Quarter 1st Quarter 2nd Quarter January - June
(in units) 2016 2015 2016 2015 2017 2016 2017 2016 Change 2017 2016 Change
Mercedes-Benz Cars 563,487 503,853 584,798 526,611 594,781 518,940 619,367 561,189 +10% 1,214,148 1,080,129 +12%
Europe 247,262 222,565 256,665 229,953 258,524 238,143 277,951 264,310 +5% 536,475 502,453 +7%
of which Germany 83,493 76,759 86,082 82,582 77,837 72,806 90,605 88,465 +2% 168,442 161,271 +4%
NAFTA 103,093 99,768 108,161 108,182 95,523 89,804 100,557 103,179 -3% 196,080 192,983 +2%
of which USA 87,866 86,708 93,204 95,215 80,155 77,048 83,733 88,345 -5% 163,888 165,393 -1%
Asia 188,877 155,065 194,211 164,260 216,943 168,608 215,185 170,253 +26% 432,128 338,861 +28%
of which China 130,409 102,875 134,383 110,207 151,878 110,870 154,792 118,267 +31% 306,670 229,137 +34%
of which locally produced vehicles 85,523 68,212 85,328 72,407 105,180 72,327 107,783 78,538 +37% 212,963 150,865 +41%
Rest of World 24,255 26,455 25,761 24,216 23,791 22,385 25,674 23,447 +9% 49,465 45,832 +8%
V-Class (included in MBC retail sales) 12,177 7,336 12,238 8,951 12,567 9,401 15,963 12,879 +24% 28,530 22,280 +28%
15

Mercedes-Benz Cars
Market Shares*
3rd Quarter 4th Quarter 1st Quarter 2nd Quarter January - June
(in %) 2016 2015 2016 2015 2017 2016 2017 2016 Change 2017 2016 Change
in % pts. in % pts.
European Union 6.6 6.1 6.5 6.0 5.9 5.8 6.3 6.0 +0.3 6.1 5.9 +0.2
of which Germany 10.5 10.1 11.3 10.4 10.1 9.8 10.6 10.4 +0.2 10.3 10.1 +0.2
USA 2.0 1.9 2.1 2.2 2.0 1.9 1.9 1.9 0.0 1.9 1.9 0.0
China 2.5 2.4 1.8 2.0 2.7 2.0 2.9 2.3 +0.6 2.8 2.1 +0.7
Japan 1.9 1.7 1.8 1.8 1.4 1.5 1.6 1.7 -0.1 1.5 1.6 -0.1
* Based on estimates in certain markets.
16
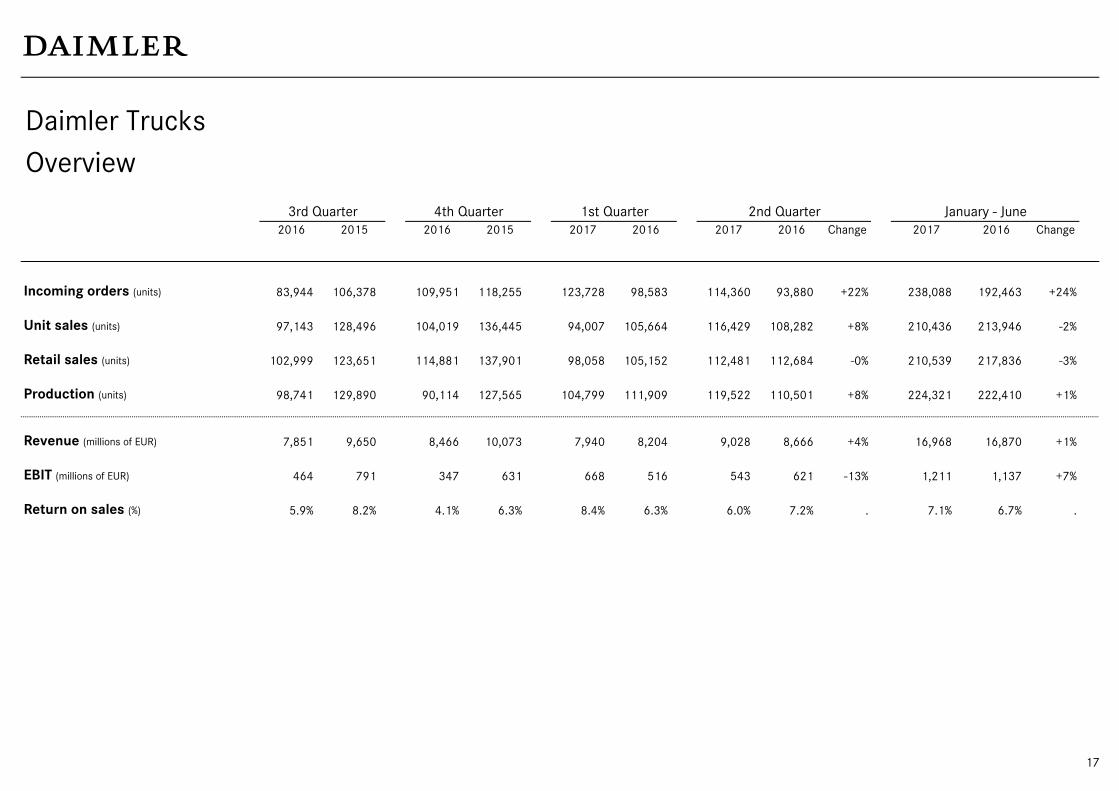
Daimler Trucks
Overview
3rd Quarter 4th Quarter 1st Quarter 2nd Quarter January - June
2016 2015 2016 2015 2017 2016 2017 2016 Change 2017 2016 Change
Incoming orders (units) 83,944 106,378 109,951 118,255 123,728 98,583 114,360 93,880 +22% 238,088 192,463 +24%
Unit sales (units) 97,143 128,496 104,019 136,445 94,007 105,664 116,429 108,282 +8% 210,436 213,946 -2%
Retail sales (units) 102,999 123,651 114,881 137,901 98,058 105,152 112,481 112,684 -0% 210,539 217,836 -3%
Production (units) 98,741 129,890 90,114 127,565 104,799 111,909 119,522 110,501 +8% 224,321 222,410 +1%
Revenue (millions of EUR) 7,851 9,650 8,466 10,073 7,940 8,204 9,028 8,666 +4% 16,968 16,870 +1%
EBIT (millions of EUR) 464 791 347 631 668 516 543 621 -13% 1,211 1,137 +7%
Return on sales (%) 5.9% 8.2% 4.1% 6.3% 8.4% 6.3% 6.0% 7.2% . 7.1% 6.7% .
17

Daimler Trucks
Unit Sales
3rd Quarter 4th Quarter 1st Quarter 2nd Quarter January - June
(in units) 2016 2015 2016 2015 2017 2016 2017 2016 Change 2017 2016 Change
Daimler Trucks 97,143 128,496 104,019 136,445 94,007 105,664 116,429 108,282 +8% 210,436 213,946 -2%
EU30* 21,307 19,938 22,616 24,793 17,394 15,469 20,431 20,381 +0% 37,825 35,850 +6%
of which Germany 8,306 8,011 9,334 11,403 6,458 5,515 8,069 8,335 -3% 14,527 13,850 +5%
NAFTA 31,433 52,185 33,197 49,503 32,906 40,428 42,293 40,643 +4% 75,199 81,071 -7%
of which USA 25,221 45,613 26,225 41,743 28,906 35,975 35,861 34,163 +5% 64,767 70,138 -8%
Latin America (excl. Mexico) 7,656 7,831 7,091 6,895 6,324 5,966 7,028 6,779 +4% 13,352 12,745 +5%
of which Brazil 3,453 4,343 2,814 3,464 2,427 2,864 2,920 2,971 -2% 5,347 5,835 -8%
Asia 28,070 36,081 31,575 38,920 30,000 35,419 35,682 30,385 +17% 65,682 65,804 -0%
of which Japan 11,749 11,706 11,267 11,157 11,608 12,370 10,195 11,025 -8% 21,803 23,395 -7%
Indonesia 6,690 5,416 8,227 7,216 7,232 7,391 9,823 5,642 +74% 17,055 13,033 +31%
India 2,438 3,566 2,700 3,802 3,736 4,037 3,554 3,906 -9% 7,290 7,943 -8%
Rest of World 8,677 12,461 9,540 16,334 7,383 8,382 10,995 10,094 +9% 18,378 18,476 -1%
BFDA - Beijing Foton Daimler
Automotive Co. Ltd. (Auman Trucks) 16,913 14,292 22,529 20,067 26,433 17,139 28,623 21,259 +35% 55,056 38,398 +43%
Daimler Trucks including BFDA 114,056 142,788 126,548 156,512 120,440 122,803 145,052 129,541 +12% 265,492 252,344 +5%
* European Union, Switzerland and Norway.
18

Daimler Trucks
Retail Sales
3rd Quarter 4th Quarter 1st Quarter 2nd Quarter January - June
(in units) 2016 2015 2016 2015 2017 2016 2017 2016 Change 2017 2016 Change
Daimler Trucks 102,999 123,651 114,881 137,901 98,058 105,152 112,481 112,684 -0% 210,539 217,836 -3%
EU30* 19,348 19,478 24,292 24,443 16,601 14,939 20,979 20,315 +3% 37,580 35,254 +7%
of which Germany 8,306 8,011 9,334 11,403 6,458 5,515 8,069 8,335 -3% 14,527 13,850 +5%
NAFTA 36,846 47,409 36,316 49,671 31,823 40,561 39,965 43,537 -8% 71,788 84,098 -15%
of which USA 30,392 41,551 28,898 42,229 27,790 35,762 33,393 36,739 -9% 61,183 72,501 -16%
Latin America (excl. Mexico) 7,534 8,501 7,384 7,378 6,399 6,162 6,992 7,206 -3% 13,391 13,368 +0%
of which Brazil 3,229 4,773 3,320 4,063 2,508 3,085 2,954 3,309 -11% 5,462 6,394 -15%
Asia 30,726 36,143 36,839 41,057 35,965 35,191 33,550 30,731 +9% 69,515 65,922 +5%
of which Japan 11,760 11,806 11,018 11,194 11,843 12,390 10,076 10,872 -7% 21,919 23,262 -6%
Indonesia 6,460 5,004 11,285 12,561 9,733 7,287 9,795 6,727 +46% 19,528 14,014 +39%
India 2,653 3,625 2,302 3,864 4,486 3,690 3,256 3,663 -11% 7,742 7,353 +5%
Rest of World 8,545 12,120 10,050 15,352 7,270 8,299 10,995 10,895 +1% 18,265 19,194 -5%
* European Union, Switzerland and Norway.
19

Daimler Trucks
Incoming Orders
3rd Quarter 4th Quarter 1st Quarter 2nd Quarter January - June
(in units) 2016 2015 2016 2015 2017 2016 2017 2016 Change 2017 2016 Change
Daimler Trucks 83,944 106,378 109,951 118,255 123,728 98,583 114,360 93,880 +22% 238,088 192,463 +24%
EU30* 17,067 17,098 21,988 19,517 21,310 20,736 19,738 19,868 -1% 41,048 40,604 +1%
of which Germany 6,678 7,172 7,815 7,601 8,748 8,994 7,496 7,291 +3% 16,244 16,285 -0%
NAFTA 23,840 34,437 40,361 41,577 45,967 29,378 35,989 24,948 +44% 81,956 54,326 +51%
of which USA 21,444 28,739 34,558 35,620 37,792 21,134 31,075 19,989 +55% 68,867 41,123 +67%
Latin America (excl. Mexico) 7,103 6,873 6,418 7,014 5,419 5,731 6,576 6,740 -2% 11,995 12,471 -4%
of which Brazil 3,453 4,343 2,814 3,464 2,427 2,864 2,920 2,971 -2% 5,347 5,835 -8%
Asia 28,739 35,458 31,336 35,581 40,233 33,404 39,000 31,547 +24% 79,233 64,951 +22%
of which Japan 12,059 11,829 10,817 11,173 12,500 12,297 12,284 13,147 -7% 24,784 25,444 -3%
Indonesia 6,080 6,369 7,999 6,596 11,855 6,536 10,290 7,260 +42% 22,145 13,796 +61%
India 2,463 3,852 2,529 3,397 4,336 3,715 4,953 3,560 +39% 9,289 7,275 +28%
Rest of World 7,195 12,512 9,848 14,566 10,799 9,334 13,057 10,777 +21% 23,856 20,111 +19%
* European Union, Switzerland and Norway.
20

Daimler Trucks
Market Shares*
3rd Quarter 4th Quarter 1st Quarter 2nd Quarter January - June
(in %) 2016 2015 2016 2015 2017 2016 2017 2016 Change 2017 2016 Change
in % pts. in % pts.
Trucks Europe / Latin America(Mercedes-Benz)
EU30** HDT/MDT 22.3 23.6 21.7 23.5 19.6 20.1 21.8 21.5 +0.3 21.0 21.0 0.0
Germany HDT/MDT 37.9 38.7 37.4 41.3 34.7 35.8 35.6 36.9 -1.3 35.3 36.5 -1.2
Brazil HDT/MDT 26.8 28.8 32.0 27.4 30.6 28.7 28.7 30.8 -2.1 29.4 30.0 -0.6
Trucks NAFTA(Freightliner/Western Star)
NAFTA Class 8 39.0 38.5 35.8 41.6 41.1 44.4 40.4 43.2 -2.8 40.6 43.6 -3.0
NAFTA Class 6-7 39.7 37.3 35.7 40.3 40.5 41.9 39.9 36.4 +3.5 40.1 38.5 +1.6
Trucks Asia(FUSO)
Japan Trucks Total 21.2 22.4 19.7 20.6 17.6 19.4 18.8 20.9 -2.1 18.4 20.4 -2.0
Indonesia Trucks Total 45.5 49.5 47.1 46.9 n.a.*** 47.6 n.a.*** 46.5 - n.a.*** 46.9 -
(BharatBenz)
India HDT/upper MDT 7.1 7.4 6.4 7.3 7.2 6.6 8.7 7.1 +1.6 8.1 6.9 +1.2
* Based on estimates in certain markets.
** European Union including Switzerland and Norway, excluding United Kingdom.
*** Data not available due to legal changes.
21

Mercedes-Benz Vans
Overview
3rd Quarter 4th Quarter 1st Quarter 2nd Quarter January - June
2016 2015 2016 2015 2017 2016 2017 2016 Change 2017 2016 Change
Unit sales (units) 85,238 75,732 97,628 99,869 86,778 76,647 103,393 99,583 +4% 190,171 176,230 +8%
Retail sales (units) 74,625 69,691 85,654 86,814 72,144 66,387 87,447 82,572 +6% 159,591 148,959 +7%
Production (units) 84,123 77,425 91,022 89,475 104,116 89,741 100,884 103,688 -3% 205,000 193,429 +6%
Revenue (millions of EUR) 3,120 2,752 3,459 3,477 2,993 2,815 3,324 3,441 -3% 6,317 6,256 +1%
EBIT (millions of EUR) 312 193 156 238 357 301 358 401 -11% 715 702 +2%
Return on sales (%) 10.0% 7.0% 4.5% 6.8% 11.9% 10.7% 10.8% 11.7% . 11.3% 11.2% .
V-Class retail sales 12,177 7,336 12,238 8,951 12,567 9,401 15,963 12,879 +24% 28,530 22,280 +28%
(excluded in MB Vans retail sales)
22

Mercedes-Benz Vans
Unit Sales
3rd Quarter 4th Quarter 1st Quarter 2nd Quarter January - June
2016 2015 2016 2015 2017 2016 2017 2016 Change 2017 2016 Change
Wholesales (in units) 85,238 75,732 97,628 99,869 86,778 76,647 103,393 99,583 +4% 190,171 176,230 +8%
EU30* 57,761 51,228 68,625 68,365 60,539 53,942 70,357 69,532 +1% 130,896 123,474 +6%
of which Germany 23,327 19,549 26,760 28,280 20,965 19,213 27,441 26,830 +2% 48,406 46,043 +5%
NAFTA 10,570 9,235 10,900 13,407 8,531 10,249 11,955 11,635 +3% 20,486 21,884 -6%
of which USA 8,171 7,369 8,673 10,755 6,251 8,068 8,994 8,837 +2% 15,245 16,905 -10%
Latin America (excl. Mexico) 3,390 3,478 3,582 4,836 3,860 2,480 3,974 3,045 +31% 7,834 5,525 +42%
Asia 6,607 2,689 6,360 4,719 6,787 3,118 8,856 6,441 +37% 15,643 9,559 +64%
of which China 4,124 1,704 3,794 2,673 4,404 1,488 6,312 4,230 +49% 10,716 5,718 +87%
Rest of World 6,910 9,102 8,161 8,542 7,061 6,858 8,251 8,930 -8% 15,312 15,788 -3%
* European Union, Switzerland and Norway.
23

Mercedes-Benz Vans
Retail Sales and Market Shares
3rd Quarter 4th Quarter 1st Quarter 2nd Quarter January - June
2016 2015 2016 2015 2017 2016 2017 2016 Change 2017 2016 Change
Retail sales (in units) 74,625 69,691 85,654 86,814 72,144 66,387 87,447 82,572 +6% 159,591 148,959 +7%
EU30* 50,642 46,199 59,663 59,979 49,204 45,533 60,512 58,008 +4% 109,716 103,541 +6%
of which Germany 18,853 16,338 22,315 24,236 16,769 15,461 21,946 22,181 -1% 38,715 37,642 +3%
NAFTA 11,959 8,856 11,147 11,817 9,720 9,267 11,114 11,333 -2% 20,834 20,600 +1%
of which USA 9,394 6,740 9,148 9,615 7,433 7,240 8,367 8,522 -2% 15,800 15,762 +0%
Latin America (excl. Mexico) 3,249 3,709 3,675 4,240 3,970 3,111 3,893 3,275 +19% 7,863 6,386 +23%
Asia 2,558 2,435 3,020 2,575 3,312 2,329 3,859 2,681 +44% 7,171 5,010 +43%
of which China 1,512 1,674 1,989 1,697 2,120 1,546 2,762 1,754 +57% 4,882 3,300 +48%
Rest of World 6,217 8,492 8,149 8,203 5,938 6,147 8,069 7,275 +11% 14,007 13,422 +4%
V-Class (excluded in MB Vans retail sales) 12,177 7,336 12,238 8,951 12,567 9,401 15,963 12,879 +24% 28,530 22,280 +28%
Market shares** (in percent)
EU30* small 3.2 3.0 3.2 3.7 3.0 2.9 2.9 2.9 0.0 pts. 3.0 2.9 +0.1 pts.
EU30* midsize/large 16.6 17.6 17.2 18.0 15.8 16.4 16.4 16.9 -0.5 pts. 16.1 16.6 -0.5 pts.
Germany midsize/large 26.2 27.7 29.1 29.5 27.1 27.2 25.4 26.9 -1.5 pts. 26.1 27.0 -0.9 pts.
USA large 9.0 8.7 7.7 9.2 7.3 6.9 6.3 6.9 -0.6 pts. 6.8 6.9 -0.1 pts.
* European Union, Switzerland and Norway.
** Based on estimates in certain markets.
24

Daimler Buses
Overview
3rd Quarter 4th Quarter 1st Quarter 2nd Quarter January - June
2016 2015 2016 2015 2017 2016 2017 2016 Change 2017 2016 Change
Unit sales* (units) 6,185 7,438 8,265 7,625 5,404 4,818 7,504 6,958 +8% 12,908 11,776 +10%
Production (units) 6,952 7,070 7,052 6,292 6,583 5,576 7,973 6,600 +21% 14,556 12,176 +20%
Revenue (millions of EUR) 937 1,018 1,287 1,181 900 830 1,154 1,122 +3% 2,054 1,952 +5%
EBIT (millions of EUR) 45 89 77 34 65 39 64 88 -27% 129 127 +2%
Return on sales (%) 4.8% 8.7% 6.0% 2.9% 7.2% 4.7% 5.5% 7.8% . 6.3% 6.5% .
* Due to the sales structure, retail sales correspond with wholesales.
25

Daimler Buses
Unit Sales and Market Shares
3rd Quarter 4th Quarter 1st Quarter 2nd Quarter January - June
2016 2015 2016 2015 2017 2016 2017 2016 Change 2017 2016 Change
Wholesales* (in units) 6,185 7,438 8,265 7,625 5,404 4,818 7,504 6,958 +8% 12,908 11,776 +10%
EU30** 1,842 1,935 3,185 3,257 1,392 1,572 2,202 2,239 -2% 3,594 3,811 -6%
of which Germany 569 535 1,286 1,240 509 482 811 726 +12% 1,320 1,208 +9%
NAFTA 1,195 1,236 1,461 1,221 757 549 1,041 628 +66% 1,798 1,177 +53%
of which Mexico 1,166 1,226 1,458 1,216 738 542 1,020 614 +66% 1,758 1,156 +52%
Latin America (excl. Mexico) 2,237 3,471 2,456 2,199 2,398 2,156 3,448 2,988 +15% 5,846 5,144 +14%
of which Brazil 1,012 1,929 669 1,179 1,399 1,460 2,108 1,796 +17% 3,507 3,256 +8%
Asia 470 251 585 399 515 183 439 521 -16% 954 704 +36%
Rest of World 441 545 578 549 342 358 374 582 -36% 716 940 -24%
Market shares*** (in percent)
EU30** heavy 28.5 30.2 27.1 26.8 30.5 32.5 32.1 30.8 +1.3 pts. 31.3 31.6 -0.3 pts.
Germany heavy 45.0 51.5 47.5 48.2 57.4 55.3 55.1 53.4 +1.7 pts. 56.2 54.3 +1.9 pts.
Brazil heavy 62.0 53.7 55.3 47.4 42.2 55.1 51.3 59.2 -7.9 pts. 48.1 57.3 -9.2 pts.
* Due to the sales structure, retail sales correspond with wholesales.
** European Union, Switzerland and Norway.
*** Based on estimates in certain markets.
26

Daimler Financial Services
Overview
3rd Quarter 4th Quarter 1st Quarter 2nd Quarter January - June
(in millions of EUR) 2016 2015 2016 2015 2017 2016 2017 2016 Change 2017 2016 Change
New business 15,658 14,589 17,030 15,310 16,812 13,707 17,925 15,415 +16% 34,737 29,122 +19%
Contract volume (end of period) 122,118 110,956 132,565 116,727 135,036 115,704 134,156 120,319 +12% 134,156 120,319 +12%
Revenue 5,133 4,702 5,651 4,942 5,911 4,862 5,930 5,014 +18% 11,841 9,876 +20%
EBIT 438 378 390 387 524 432 522 479 +9% 1,046 911 +15%
Return on equity (%) 17.7% 16.6% 15.2% 16.0% 19.3% 17.4% 18.8% 19.3% . 19.1% 18.4% .
27