dairy farming in uganda - organic eprints - welcome to organic eprints
TRANSCRIPT

Dairy farming in Uganda Production Effi ciency and Soil Nutrients under Different Farming Systems
INTERNATIONAL LIVESTOCK RESEARCH INSTITUTE
Research Report 1
I. Baltenweck, S. Mubiru, W. Nanyeenya, L. Njoroge, N. Halberg, D. Romney and S. Staal In collaboration with J. S. Tenywa and J. Mugisha

Supported by

1
PRODUCTION EFFICIENCY AND SOIL NUTRIENTS UNDER DIFFERENT FARMING SYSTEMS
Dairy farming in Uganda Production Effi ciency and Soil Nutrients
under Different Farming Systems
I. Baltenweck, S. Mubiru, W. Nanyeenya, L. Njoroge, N. Halberg, D. Romney and S. Staal
In collaboration with J. S. Tenywa and J. Mugisha
2
DAIRY FARMING IN UGANDA
ISBN 92-9146-206-3
Citation: Baltenweck I., Mubiru S., Nanyeenya W., Njoroge L., Halberg N., Romney D., Staal S. (2007). Dairy Production in Uganda: Production Effi ciency and Soil Management Strategies under Different Farming Systems. ILRI Research Report 1. International Livestock Research Institute, Nairobi, Kenya.
Cover image: National Agricultural Research Organization, Uganda
Publication Design: Lilian Ohayo
Printing: RAMCO Printing Works Limited
Disclaimer: This publication is an output from a project funded by the Danish International Development Agency (DANIDA) of the Kingdom of Demark for the benefi t of developing countries. However, the views expressed here are not necessarily those of DANIDA.

3
PRODUCTION EFFICIENCY AND SOIL NUTRIENTS UNDER DIFFERENT FARMING SYSTEMS
Table of contents
Introduction 4
Changing policy environment 5
Appropriate intensifi cation levels for smallholders 6
Low soil fertility 7
Study rationale and focus 8
Study districts 9
Study methods 11
Farm characterization 13
Economic fi ndings 15
Nutrient cycling fi ndings 21
Farmer feedback 24
Conclusions 25

4
DAIRY FARMING IN UGANDA
Prior to the 1980s, milk production in Uganda occurred largely in two contrasting
production systems. In the wetter parts of the country, especially in the southwest,
there were a few large, mostly government-owned commercial dairy farms on
which exotic and cross-bred dairy cattle were kept in paddocks and grazed on
improved or natural pastures. In the drier eastern and northeastern parts of the
country, pastoralists kept large numbers of local cattle breeds, notably the Small
East African Zebu (SEAZ), under traditional extensive management systems.
Although the pastoralists marketed some milk, most was consumed by the
household. Cattle were also valued as an expression of cultural prestige and a
means of accumulating capital and meeting planned and emergency expenses.
Smallholders, who tended to keep a few low yielding indigenous cattle as well as
growing crops, made little contribution to the nation’s marketed milk and were
primarily subsistence-oriented.
INTRODUCTION

5
PRODUCTION EFFICIENCY AND SOIL NUTRIENTS UNDER DIFFERENT FARMING SYSTEMS
CHANGING POLICY ENVIRONMENT
This situation changed in 1986 with the introduction of the National Economic
Recovery, Rehabilitation and Development Programs. This led to a shift in policy
emphasis which sparked off a number of initiatives, including the introduction of
zero-grazing, a system under which improved dairy cattle are kept permanently
in stalls and their feed – including specially grown fodder crops, crop residues
and bought-in feed and water – is ‘cut-and carried’ to them. Farm size tends
to be small, typically around 1.5 hectares, and crops such as bananas, maize,
beans, sweet potatoes, sorghum, vegetables and coffee are commonly grown in
intercropping systems alongside between one and fi ve zero-grazed dairy cattle.
From the mid 1980s, a number of non-governmental organizations, such as
Heifer Project International, promoted zero-grazing through schemes which often
involved donation of in-calf dairy heifers to benefi ciaries together with training on
managing improved dairy breeds, fodder production and other related activities.
Benefi ciaries repaid their loans in the form of the fi rst heifer born, which was
passed on to another benefi ciary. Other smallholders, inspired by the experience
of project benefi ciaries, acquired their own dairy cattle or gradually upgraded
their indigenous animals by cross-breeding through use of artifi cial insemination
or bull schemes. Some adopted strict zero-grazing systems, while others combined
grazing paddocks with stall feeding – a system that came to be known as ‘semi-
intensive’. As a result, over the last two decades in Uganda there has been a
steady increase in the number of improved dairy cattle, national milk production,
proportion of milk produced and marketed by smallholders, contribution of
dairying to the national economy and per capita milk consumption.
In 1992, the Government launched its Milk Master Plan, which aimed to improve
rural incomes and living standards of small-scale farmers; achieve self suffi ciency
in milk production; foster diversifi cation of dairy products through improved
processing; provide surplus for export through improved dairy production;
improve sustainability of milk production systems by increasing productivity of
individual animals rather than increasing cattle populations; and ensure existence
of competitive and liberal markets that reduce transaction costs and increase
producers’ share of consumer prices. Liberalization of the sub-sector in 1993 saw
the government monopoly on milk processing broken and the emergence of a
dozen or more medium-scale and around 60 small-scale private milk processors.
Under the Dairy Industry Act of 1998 a statutory body, the Dairy Development
Authority, was established with a mandate to realize the objectives of the master
plan.

6
DAIRY FARMING IN UGANDA
Whilst development agencies in Uganda have tended to promote intensifi cation of
dairy production to smallholder farmers – where intensifi cation is associated with
improved breeds of dairy cattle, smaller farm sizes and increased usage of labour
and purchased inputs per unit of milk produced – farmers themselves have adopted
a range of intensifi cation options that form a continuum, ranging from traditional
extensive systems to intensive zero-grazing systems. Some farmers, having initially
adopted more intensive options, have ‘extensifi ed/de-intensifi ed’; based on
their experiences with labour, feed and management costs, they have reverted
to less intensive systems such as relaxation from zero-grazing to semi-intensive
and downgrading of high-grade breed categories in other grazing systems. This
has raised questions about whether intensifi cation is always the best option for
smallholder farmers but to date there has been a lack of systematic studies of the
smallholder dairy sector in Uganda to provide the answers. Therefore, the current
study sought to fi ll this information gap, particularly to understand competitiveness
of different dairy production systems under different agro-climatic and market
potential scenarios. To inform the design of development projects, it is particularly
important to understand farmers’ motivation to intensify so that projects are
successful and sustainable.
APPROPRIATE INTENSIFICATION LEVELS FOR SMALLHOLDERS

7
PRODUCTION EFFICIENCY AND SOIL NUTRIENTS UNDER DIFFERENT FARMING SYSTEMS
LOW SOIL FERTILITY
Concerns have also been expressed about sustainability of mixed dairy-crop
systems. There is a general assumption that soil and general nutrient management
in these systems is effi cient. It is expected that manure from the cattle is applied
to the soil for fertility management. Similarly, the option of feeding crop residues
to cattle is an opportune effi cient nutrient recycling channel. On the other hand,
substantial quantities of nitrogen are expected to be fi xed by forage legumes which
ideally should be planted for cattle feeding in intensive systems. However, it is
not clear to what extent such nutrient management options are harnessed in these
mixed dairy-crop systems.
Although commonly perceived to be fertile, many soils in Uganda are in fact
naturally poor: they are ancient (more than 500 million years old) and in the fi nal
stage of the weathering process (and so most of the naturally occurring nutrients
have been leached out); the predominant minerals do not directly supply nutrients
to soils; they are acidic and infertile; nitrogen levels are generally low, phosphorus
commonly occurs in forms not readily available to crops and there are no primary
minerals that can supply potassium; and many minerals are easily leached out of
the root-zone of most crops1.
Previously practised ‘slash and burn’ and farming systems incorporating periods of
fallow have, with growing human populations, given way to permanent cultivation,
often with poor soil management practices. The combination of naturally infertile
soils and poor soil husbandry represents a serious threat to sustainable farming, not
just in Uganda but throughout much of Africa.
1Nkedi-Kizza, Peter, Jacob Aniku, and Christina Gladwin. “Gender And Soil Fertility In Uganda: A Comparison Of Soil Fertility Indicators For Women And Men’s Agricultural Plots.” African Studies Quarterly 6, no.1: [online] URL: http://web.africa.ufl .edu/asq/v6/v6i1a2.htm

8
DAIRY FARMING IN UGANDA
STUDY RATIONALE AND FOCUS
To respond to this situation, an in-depth study was carried out between 2001 and
2005 to gain a better understanding of dairy production systems in Uganda. Such
knowledge was expected to improve the targeting of evidence-based extension
messages to specifi c production systems and enable development of policies to
support the contribution of dairying to sustainable livelihoods of resource-poor
farmers. These outcomes would help to realize the vision of the Milk Master
Plan. The partners in the study were the Ugandan National Agricultural Research
Organization (NARO), Makerere University, the International Livestock Research
Institute (ILRI) and the Danish Institute of Agricultural Sciences (DIAS). The study
was funded by the Danish International Development Agency (DANIDA).
The study had two main components: one primarily economic and one focused on
nutrient cycling, although both components also involved broader characterization
of the Ugandan dairy sector. Each of the components was the basis for PhD theses
by Ugandan students, supported and supervised by researchers from NARO,
Makerere University, ILRI and DIAS. This summary paper is based on these two
theses2.
The economic component examined the economic effi ciency of the dairy and
whole farm enterprise as well as the factors and incentives infl uencing farmers’
adoption of dairy intensifi cation and crop–livestock interactions, such as feeding
crop residues and using manure to improve soil fertility. Although intensive
management methods, such as zero-grazing, are often promoted by development
agents in Uganda, the study set out to test whether intensifi cation was always the
most appropriate option.
The nutrient cycling component evaluated the balance of nitrogen, phosphorus
and potassium – key nutrients essential for successful crop production. Throughout
Africa there is a tendency to ‘mine soils’ by returning insuffi cient nutrients to
replace those lost through harvested crops; the result is negative nutrient balances
which can lead to land degradation and threaten sustainable farming.
2Mubiru, SL. 2006. Development of nutrient management strategies along a continuum of dairy production intensifi cation in Uganda. PhD thesis, Makerere University.
Nanyeenya WN. 2006. Incentives to intensifi cation of dairy production in Uganda. PhD thesis, Makerere University.

9
PRODUCTION EFFICIENCY AND SOIL NUTRIENTS UNDER DIFFERENT FARMING SYSTEMS
STUDY DISTRICTS
Figure 1: Surveyed districts and location of the farms.
The study was carried out in three districts – Mbarara, Masaka and Jinja – all of
which supply milk to the Ugandan capital (Figure 1). The three districts represent
different scenarios within the ‘Kampala milk shed’, including a range of agro-
ecological zones, cattle management practices and differing degrees of market
access. Previous studies had indicated that nutrient management practices
designed to maintain or improve soil fertility rarely occurred in any of the study
districts.
Mbarara is in the southwest of Uganda, bordering Tanzania, and is the most distant
of the three study districts from Kampala. Cattle production is largely extensive,
with agro-pastoralism being common. Most households combine crop and
livestock production, with bananas and coffee being the main crops. It is estimated
that 12% of cattle are exotic or cross-bred.

10
DAIRY FARMING IN UGANDA
Masaka district is in southern Uganda. The banana-coffee-livestock system is most
common although agro-pastoralism is also practised. Intensive dairying occurs
in peri-urban areas whilst extensive communal grazing is practised in the more
remote semi-arid areas. An estimated 11% of cattle are exotic or cross-bred.
Jinja is much smaller than the other two districts, has the highest human
population density and is closest to the capital city Kampala. It can be classifi ed
as agro-industrial with livestock rearing, fi shing and crop production all being
practised; the last includes subsistence agriculture as well as large-scale
commercial sugar and small-scale maize production. An estimated 18% of cattle
in the district are exotic or cross-bred.
11
PRODUCTION EFFICIENCY AND SOIL NUTRIENTS UNDER DIFFERENT FARMING SYSTEMS
STUDY METHODS
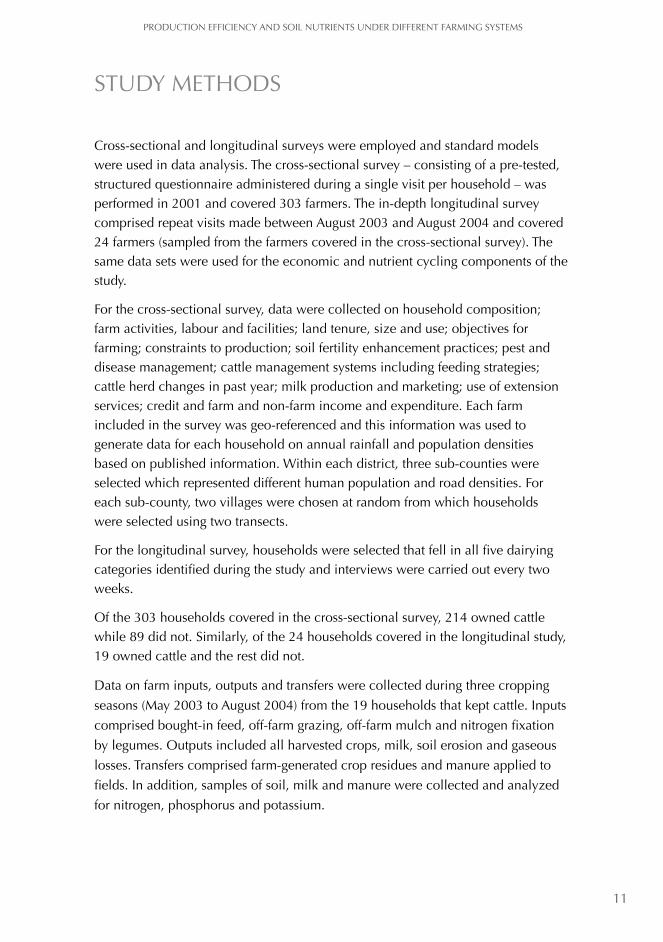
Cross-sectional and longitudinal surveys were employed and standard models were used in data analysis. The cross-sectional survey – consisting of a pre-tested, structured questionnaire administered during a single visit per household – was performed in 2001 and covered 303 farmers. The in-depth longitudinal survey comprised repeat visits made between August 2003 and August 2004 and covered 24 farmers (sampled from the farmers covered in the cross-sectional survey). The same data sets were used for the economic and nutrient cycling components of the study.
For the cross-sectional survey, data were collected on household composition; farm activities, labour and facilities; land tenure, size and use; objectives for farming; constraints to production; soil fertility enhancement practices; pest and disease management; cattle management systems including feeding strategies; cattle herd changes in past year; milk production and marketing; use of extension services; credit and farm and non-farm income and expenditure. Each farm included in the survey was geo-referenced and this information was used to generate data for each household on annual rainfall and population densities based on published information. Within each district, three sub-counties were selected which represented different human population and road densities. For each sub-county, two villages were chosen at random from which households were selected using two transects.
For the longitudinal survey, households were selected that fell in all fi ve dairying categories identifi ed during the study and interviews were carried out every two weeks.
Of the 303 households covered in the cross-sectional survey, 214 owned cattle while 89 did not. Similarly, of the 24 households covered in the longitudinal study, 19 owned cattle and the rest did not.
Data on farm inputs, outputs and transfers were collected during three cropping
seasons (May 2003 to August 2004) from the 19 households that kept cattle. Inputs
comprised bought-in feed, off-farm grazing, off-farm mulch and nitrogen fi xation
by legumes. Outputs included all harvested crops, milk, soil erosion and gaseous
losses. Transfers comprised farm-generated crop residues and manure applied to
fi elds. In addition, samples of soil, milk and manure were collected and analyzed
for nitrogen, phosphorus and potassium.

12
DAIRY FARMING IN UGANDA
3Vlaming, J., Van den Bosch, H., Van Wijk, M. S., De Jager, A., Bannick, A. and Keulen, H. 2001. Monitoring nutrient fl ows and economic performance in tropical farming systems (NUTMON) Part 1: Manual for the NUTMON-toolbox. Alterra, Green World research, Wageningen the Netherlands. p.180.
These data, together with published information, were then used to calculate
nutrient balances as nutrient inputs from all sources minus nutrient outputs.
Nutrient balances were determined at three levels: farm, land and patch (Figure
2). ‘Land’ corresponded to the area of the farm that was cultivated (e.g. in Figure
2, Plot 1 + Plot 2). ‘Patch’ corresponded to an area within the cultivated land on
which a single crop or combination of crops, such as bananas or maize and beans,
was grown (e.g. in Figure 2, Patch 1 and Patch 2 within Plot 1). Pasture and fallow
were included within the designation ‘crop’.
A variety of modelling approaches were used for different elements of the economic and nutrient cycling components of the study. Synthesis of the economic data adopted both regression analysis and a linear programming approach while the nutrient cycling component was largely based on the NUTMON3 method with minor modifi cations.
Figure 2: Model for the analysis of nutrient fl ows and balances.
Materialstransferredfrom oneplot toanother
-Feeds (off-farm)-Grazing (off-farm)
Manure applied tocrop or fodder fields
On farm grazing, fodder,crop residues
Products leaving thefarm from plots andpatches in
Inputs into thepatches & plotsfrom off-farm
Transfers amongpatches within the
same plot
Representation of a farm and the nutrients flows in and out of plots, patches and the livestock enterprises
Leguminous Nfixation
Milk
Farm
Un-used nutrients. Manure deposited in homestead area or kraal

13
PRODUCTION EFFICIENCY AND SOIL NUTRIENTS UNDER DIFFERENT FARMING SYSTEMS
FARM CHARACTERIZATION
Cross-sectional survey data were subjected to a process called cluster analysis, a
statistical tool used to group observations with similar tendencies based on a set
of variables (Table 1). Using this approach, fi ve different dairy production systems
were identifi ed. These are listed below in descending order of intensifi cation:
● zero-grazing
● semi-intensive
● fenced
● tethered
● herded
Zero-grazing is the most intensive of the fi ve production systems. In this system
improved dairy cattle are permanently kept in stalls with no free-grazing and
there is a high level of external inputs, including bought-in feeds, and signifi cant
expenditure on livestock and veterinary services. Farm size is small, productivity
high and farms tend to be close to towns. Because cattle are permanently
confi ned, a large proportion of the farm is cultivated for crops although the actual
area cropped is small. A wide variety of crops are grown but banana and beans
are predominant. The majority of the farms practising zero-grazing were located in
Jinja district where about a quarter of farms fall into this category.
Semi-intensive is similar to zero-grazing except cattle spend some time confi ned to
stalls and some time grazing in paddocks. A large proportion of the farm tends to
be devoted to growing fodder crops.
In fenced systems, cattle – a large proportion of which are improved dairy breeds
– graze in paddocks and therefore, not surprisingly, large pasture fi elds dominate.
There is low input of feeds from off the farm, little or no off-farm grazing and
fenced dairy farms tend to be close to road networks. Most farms practising fenced
dairy production were located in Mbarara district, where more than 70% of farms
fall into this category.
In the tethered system, predominantly local cattle breeds are mostly grazed off-
farm, freeing up land for cultivation, with sweet potatoes being the dominant crop.
Density of cattle tends to be high. Farms in the tethered category tend to co-exist
with zero-grazing, semi-intensive or fenced farms. Tethered farms were most

14
DAIRY FARMING IN UGANDA
common in Jinja and Masaka districts where about one third and one fi fth of farms,
respectively, fell into this category.
Herding is the least intensive of the fi ve production systems and consists of mostly
local breeds of cattle being grazed on and off-farm with pasture, fallow, banana
and beans as the main forms of cultivation. Sometimes cattle are grazed on fi elds
after harvesting has occurred. Most farms which practised herding were located in
Masaka district, where about 70% of farms fell into this category.
Table 1: Descriptive statistics of key farm characteristics from the cross-sectional survey
Variable Jinja Masaka Mbarara
Per cent of surveyed households owning cattle 72.6 71.9 75.8
Per cent of households practising only stall feeding 20.3 10.3 0
Per cent of household practising mainly stall feeding with some grazing
10.8 1.5 5.5
Per cent of households practising grazing with some stall feeding
48.6 50.0 7.6
Per cent of household practising only grazing 20.3 38.2 84.9
Average land size (ha) 1.8 1.7 6.0
(0.1, 20.2)* (0.2, 11.9)* (0, 72.8)*
Average number of cattle heads 3 5 17
Per cent of herd that is high grade 14 1.8 6
*Minimum and maximum hectarage

15
PRODUCTION EFFICIENCY AND SOIL NUTRIENTS UNDER DIFFERENT FARMING SYSTEMS
ECONOMIC FINDINGS
Four factors were identifi ed which were statistically associated with adoption of
dairy intensifi cation (see Table 2). These included two human capital factors, years
of formal education of the household head and proportion of adults working off-
farm, and two demand factors, human population density and distance to local
markets.
More formal education appears to equip farmers better to acquire and utilize the
information and skills needed for more intensive dairy production systems. The
fi nding related to off-farm working suggests that family labour is important for dairy
intensifi cation; with less family labour available there is a reduced tendency to
intensify. Not surprisingly, higher human population densities and more accessible
markets, both of which would be expected to increase demand, encouraged dairy
intensifi cation.
Table 2: Factors associated with adoption of dairy intensifi cation
Variable Impact on dairy intensifi cation
Years of formal education Positive
Proportion of adults working off farm Positive
Human population density Positive
Distance to local markets Negative
The study considered two examples of crop-livestock interactions: application
of manure to fi elds and feeding of crop residues to dairy cattle. A high degree of
interdependence was found; farmers were likely to adopt both practices, although
some factors were associated with one practice only (see Table 3).
Households where the head had more years of farming experience were more
likely to feed crop residues, although this factor had no impact on manure
application. The higher the rainfall (as measured by PPE which is the ratio of
precipitation to evapotranspiration), the less likely was the farm to feed crop
residues, presumably refl ecting the greater abundance of fodder and grazing in
wetter areas. It was more likely that crop residues would be fed the further the farm
was from a main road, which could be due to the greater diffi culty of transporting

16
DAIRY FARMING IN UGANDA
bought-in feed but more probably due to the low marketing opportunities. Finally,
more crop residues were fed where human population density was highest, which
could be explained by higher demand for milk in these areas but also by reduced
opportunities for off-farm grazing and increased crop production to meet the
demand for food making more crop residues available.
Application of manure to fi elds was associated with higher cattle densities. On
farms with high cattle densities, less land would be available for cropping thereby
increasing the need for higher yields which could be achieved through use of
manure. Farms where more adults worked off-farm were also more likely to
apply manure, perhaps because this increased their exposure to different ideas,
knowledge and skills, especially if they worked on other peoples’ farms. However,
the level of manure utilization was low on all farm types.
Table 3: Determinants of crop residue feeding and manure application
Variable Impact on residue feeding
Household head’s farming experience Positive
Impact on manure application
Household characteristics
No signifi cant impact
TLU* per hectare No signifi cant impact Positive
Adults working off farm No signifi cant impact Positive
Distance to all weather roads Positive No signifi cant impact
Distance to district main town Positive No signifi cant impact
Neighbourhood factors
Annual PPE Positive No signifi cant impact
Human population density (person/km2) Positive Positive*TLU: tropical livestock units
The cost of milk production was compared for each of the fi ve dairy production
systems using data obtained from the longitudinal study. The cost of production per
litre was highest in the tethered and lowest in the herded system. Estimates of fi xed
costs (cattle housing, dairy equipment and herd depreciation) were not included
in the estimates of cost of milk production so a true profi t margin could not be
calculated. However, the contribution margin – which is the difference between
sales price and cost estimates excluding fi xed costs – was highest for zero-grazing
and lowest for the tethered system. Break-downs of the cost components under the
different systems are shown in Figure 3.

17
PRODUCTION EFFICIENCY AND SOIL NUTRIENTS UNDER DIFFERENT FARMING SYSTEMS
herding tethering semi intensive
fenced zero grazing
Litr
es o
f milk
per
TLU
per
yea
r
Pct o
f milk
sol
d
0
500
1000
1500
2000
2500 80
70
milk per TLU
% milk sold
60
50
40
30
20
10
0
Figure 3: Cost (Ush per litre) of milk production and its components by dairy production system.
Dairy farming was profi table (as measured by a positive contribution margin)
under all fi ve production systems (Figure 3). Farms which practised zero-grazing,
semi-intensive or fenced production systems sold more milk and operated closer
to profi t maximization (i.e. were more commercially oriented) than those which
practised tethered or herding production systems. Moreover, analysis of milk
productivity of the different farming systems revealed that increasing the level of
intensifi cation resulted in an increase in the milk productivity and the percentage
of milk sold (Figure 4).
Figure 4: Relationship between milk productivity, market orientation and cattle farming system.
0
100
200
300
400
500
600
Zero grazing Semi-intensive Fenced Tethered Herded
Water purchase
Dairy inputs
Veterinary services
family labour
Hired labour
Milk Transport
Contribution margin
Ush
/L

18
DAIRY FARMING IN UGANDA
Net benefi ts achieved from dairying were close to profi t maximization in all fi ve
systems although overall farm benefi ts/hour were below the profi t maximization in
all systems except zero-grazing (Figure 5). Profi t maximization refers to the degree
to which net benefi ts match the economic effi ciency level of profi tability (as
determined by the linear programming model). This suggests that different cropping
patterns would give better economic returns. Choices of intensifi cation options and
of crops grown were evidently not solely driven by desire for profi t maximization;
other considerations such as the need for diversity of diets and to meet subsistence
food requirements, as well as risk aversion, also infl uenced decision making.
Risk-averse individuals’ decisions and plans are hatched such that they avoid worst
possible future outcomes and hence trade potential income for lower risk. Farmers
in all fi ve intensifi cation categories were risk averse to some extent, with farmers
in the more intensifi ed systems being least averse to risk and farmers in the more
extensive systems being more risk averse.
Figure 5: Comparison of observed and profi t maximization net farm and dairy benefi ts.
8000 1200
Ush
/hou
r
Herded Tethered Fenced Semi-intensive
Zero-grazing
Ush
0
200
400
600
800
1000
0
1000
2000
3000
4000
5000
6000
7000
Observed net farm benefits
Observed dairy benefits/hour
Profit max net farm benefits
Observed net farm benefits/hour
Profit max net farm benefits/hour
Profit max dairy benefits/hour

19
PRODUCTION EFFICIENCY AND SOIL NUTRIENTS UNDER DIFFERENT FARMING SYSTEMS
Besides examining to net farm and net dairy benefi ts, the study also examined
the opportunity cost of farm labour (i.e. the local wage rate) by comparing the
net benefi ts per hour of labour employed on the farm or dairy enterprise and the
prevailing hourly wage rates. Despite the variability in milk productivity and the
market orientation between farming systems, the net farm and dairy benefi ts per
hour invested remained above the cost of labour for all fi ve systems (Figure 6)
and there was no apparent relationship between degree of intensifi cation and the
dairy benefi ts per hour. This indicates that in the current situation, all systems are
remunerating the farmers’ labour above what they could get if they were to offer
their services outside their farms.
Figure 6: Comparison of the net farm and dairy benefi ts per hour and the local wage rate for different cattle farming systems.
It would be economically advantageous to increase the amount of crop residues
fed in the zero-grazing, semi-intensive and tethered systems, refl ecting relative feed
scarcity in these systems. In all systems except tethering, it would be benefi cial to
increase the amount of available land, for example by renting additional land.
Manure use was generally low; in no system was more than 15% of available
manure applied to the land. Utilization of manure was highest on zero-grazing
farms, where it was mostly applied to banana and coffee plots, and tethered
systems, where it was applied to banana and bean plots.
900
Ush
Herded Fenced Semi-intensive Zero-grazed
Net farm benefits/hour Dairy benefits/hour Wage rate
Tethered
800
700
600
500
400
300
200
100
0

20
DAIRY FARMING IN UGANDA
Labour is a major limiting factor in dairy production. Although there is a labour
market to bridge labour gaps in farm production, rising wage rates may render
hiring labour prohibitive and tremendously erode net benefi ts. A sensitivity
analysis was carried out to investigate the effect of a three-fold increase in current
wage rates on the net benefi ts currently realized in the different dairy production
systems. This increase is considered to be likely in the medium term based on
previous experience in the country; between 1988 and 2006, the daily wage rate
for unskilled labour in Uganda more than doubled. The results of the sensitivity
analysis are presented in Table 4.
The highest reduction in net farm benefi ts occur in the fenced system followed
closely by the zero-grazing system. These systems are therefore more sensitive
to increases in the price of hired labour and their long-term viability would be
affected most by raising labour costs. On the other hand, the semi-intensive,
herded and tethered systems show minor decreases in net farm benefi ts, suggesting
that these systems would not be adversely affected by rising labour costs.
Table 4: Sensitivity analysis of wage rate changes on net benefi ts
Market wage rate (shillings/hour) (2002/2003)
Dairy system
Zero grazing
Wage rate (shillings/hour) infl ated 200%
% reduction in net farm benefi ts
126 378 21
Semi-intensive 126 378 6
Fenced 74 222 23
Tethered 126 378 9
Herded 48 144 8

21
PRODUCTION EFFICIENCY AND SOIL NUTRIENTS UNDER DIFFERENT FARMING SYSTEMS
The nitrogen levels in all fi ve farm categories were below the critical levels (Figure
7). Phosphorus was above the critical level in all farm categories except zero-
grazing where it was below the critical level. Potassium was above the critical level
in all farm categories.
Figure 7: Comparison of soil nitrogen (N), phosphorus (P) and potassium (K) levels with critical minimum levels under different cattle farming systems (land-level based on soil samples).
The comparison of farm and land nutrient balances demonstrates the difference
between nutrients available on the farm and those actually utilized on cultivated
land. Table 5 summarizes the farm and land nutrient balance results for nitrogen,
phosphorus and potassium for each of the fi ve dairy production systems.
Herded0
20
40
60
80
100
120
Tethered Semi-intensive Non cattle
N (%) x 100
P (ppm)
Critical level K
Critical level P
Critical level N
K (meq/100g) x 100
Zero-grazingFenced
Table 5: Farm and land nutrient balances
Nutrient balances in kilograms of dry matter per hectare per season
*Includes ‘farmer controlled’ and ‘uncontrolled’ fl ow of nutrients: the former includes harvest, patch inputs, livestock feeds, grazing and milk while the latter includes soil erosion, deposition, gaseous losses and non-symbiotic N fi xation. Leguminous nitrogen-fi xation was considered to be within farmers’ control.
N: nitrogen, P: phosphorus, K: potassium
Farm level nutrient balance*
Zero grazing
N
Land level nutrient balance*
P K N P K
+ 15.8 + 12.0 + 18.9 - 39.6 - 2.4 - 53.5
Semi-intensive + 24.8 + 2.0 + 13.3 - 49.9 - 2.6 - 32.6
Fenced - 16.7 + 0.4 - 3.0 - 22.7 - 0.4 - 5.2
Tethered - 8.1 + 4.3 + 0.9 - 19.6 + 1.2 - 9.6
Herded - 15.8 + 1.6 - 3.4 - 18.1 + 1.1 - 6.1
NUTRIENT CYCLING FINDINGS

22
DAIRY FARMING IN UGANDA
There were large differences between nutrient balances at farm and land level,
refl ecting failure to apply available nutrients to the land. With the exception of
phosphorus in the tethered and herded systems, nutrient balances were negative at
the land level for all systems and nutrients.
Combining the results from the soil analyses with the nutrient balance results
points to a worrying situation; soils that are already below the critical level
for nitrogen are becoming ever more depleted. The same situation prevails for
phosphorus in the zero-grazing system. Although phosphorus levels are above the
critical level in all systems except zero-grazing, in the semi-intensive and fenced
systems the balance is negative, meaning that phosphorus levels are declining.
Whilst potassium levels are currently above the critical level in all fi ve systems, the
balance in all fi ve is negative. In summary, the situation is one of wholesale soil
mining, which has very severe implications for long-term sustainability of these
farming systems.
Within the negative nutrient balances at the land level, depicted in Table 5, are
smaller pockets of positive balances. These correspond to patches of land on which
specifi c crops are grown. For example, a large amount of manure tends to be
applied where pineapples, a high-value cash crop, are grown and as a result the
nutrient balance on the patches where pineapples are grown tends to be positive.
Leguminous crops such as beans and groundnuts, which can fi x atmospheric
nitrogen, have a benefi cial impact on nitrogen balances. On the other hand, some
crops are associated with very large negative nutrient balances; patches where
fodder crops and vegetables were grown had large negative balances for nitrogen,
phosphorus and potassium.
Nutrient balances can be important indicators of soil productivity and level of
nutrient management and could be useful for extension agents, researchers,
farmers and policymakers in determining the nutrient status of farms and
identifying areas in need of improvement. However, calculation of nutrient
balances is a highly complex process – far too complicated to be used routinely.
The study therefore set out to identify simple indicators of nutrient balances that
could be used to target advice and interventions and guide research and policies
for improving nutrient management. This was done by modelling data collected
previously for the nutrient balance studies.
The factor that had the largest positive infl uence on nutrient balance of nitrogen,
phosphorus and potassium was the proportion of available manure that was
applied to a patch. The factor that had the largest negative infl uence was the

23
PRODUCTION EFFICIENCY AND SOIL NUTRIENTS UNDER DIFFERENT FARMING SYSTEMS
quantity of materials removed from the patch, including those removed during
harvesting and grazing. In addition, several crops were associated with either
positive or negative infl uences on balances of some nutrients. For example, legume
crops were associated with positive nitrogen balances due to their nitrogen-
fi xing properties while the crop combination ‘coffee-fodder’ has a large negative
infl uence on all three nutrients, likely due to harvesting of large amounts of fodder
with minimal or no nutrient replacements. For other crops, the infl uence on the
balance of specifi c nutrients is likely to be due to the amount of that nutrient in the
crop. For example, sweet potatoes tend to have a negative infl uence on potassium
balances due to the high level of potassium extracted from the soil and transferred
to their vines and peels.
Although negative nutrient balances are a cause for concern and indicate
degradation of soils, they do not relate directly to crop yields, which are perhaps
of greatest immediate interest to farmers. Based on the fi nding that application
of manure had the largest positive infl uence on nutrient balances, the study
considered the impact of application of manure on the yields of two key crops,
bananas and elephant grass (also known as Napier grass). Bananas are an
important food and cash crop and elephant grass is a fodder crop used in zero-
grazing and semi-intensive production systems. The study focused on nitrogen
balance as the soil analyses found this nutrient to be most lacking.
The equations used earlier to derive the nutrient balances were also used to
calculate the quantity of manure that would be needed to attain zero nitrogen
balance. Zero nitrogen balance would infer that the amount of nitrogen removed
from the land was exactly balanced by the amount returned. For the tethered,
fenced and zero-grazing systems, suffi cient manure was available on the farm to
meet these needs. Assuming 25% dry matter content, application of about 2000 kg
of fresh manure per hectare (or 200 g per square metre) per growing season would
generate incremental yields of elephant grass worth about USD 400 and bananas
worth USD 185 per hectare. Assuming that labour and other costs would be below
these fi gures and that a market existed for the extra production, this appears to be a
fi nancially worthwhile intervention although one rarely utilized at present.

24
DAIRY FARMING IN UGANDA
FARMER FEEDBACK
At the end of the study, the results were conveyed to farmers in the three districts.
Farmers were asked what constraints they faced which prevented more widespread
use of manure to improve soil fertility. Answers provided included lack of
awareness and failure to prioritize this activity (it was regarded as work for women
and children); lack of knowledge of the benefi ts; lack of the necessary equipment,
such as wheelbarrows; and fear of introducing pests and diseases to their fi elds.
Related resources from the farmer feedback workshop and from another paper
associated with this study are available online from the following websites:
http://www.ugandadairy.dk/UgandaDairy.asp and
http://www.cipav.org.co/lrrd/lrrd19/7/mubi19100.htm

25
PRODUCTION EFFICIENCY AND SOIL NUTRIENTS UNDER DIFFERENT FARMING SYSTEMS
While dairy farming is profi table under all fi ve farming systems, profi tability (as
measured by the contribution margin) was highest under the two most intensive
systems, zero-grazing and semi-intensive. However, intensifi cation was not
necessarily the best option in all situations; for instance, profi tability was higher
under the herded system, considered to be the least intensive system, than under
the fenced or tethered systems. The study did not include estimates of fi xed costs;
opportunity cost of land is likely to be higher under the zero-grazing, semi-
intensive and tethered systems and the cost of purchasing improved breeds of dairy
cattle will be high in the more intensive systems that use these breeds.
The study identifi ed factors associated with adoption of dairy intensifi cation. These
included years of formal education of the household head and proportion of adults
working off-farm as well as factors associated with increased demand for milk.
This suggests that extension messages and policies regarding intensifi cation in the
smallholder dairy sector need to be carefully targeted to ensure they are relevant
and appropriate. It also highlights the value of personally witnessing benefi ts for
oneself, such as by working on neighbours’ farms, and of farmer-to-farmer training
approaches.
A worrying situation is revealed with regards to nutrient management on mixed
dairy-crop farms in Uganda. Irrespective of degree of intensifi cation, levels of some
key plant nutrients in the soil, especially nitrogen, are already below the level
considered critical for successful crop production and the levels are continuing to
drop; nutrients removed in crops and milk are not being replaced. This has serious
implications for the long-term sustainability of these farming systems; if nothing is
done, the food insecurity and poverty situation is likely to get worse.
In all systems except fenced and semi-intensive, adequate amounts of manure are
available on the farm to reverse this situation but currently the vast majority of
this potentially valuable manure is not utilized. In addition to improving the soil
nutrient balance, application of manure results in other benefi cial effects, such
as increased soil organic matter and capacity for holding water and nutrients,
and the benefi ts persist for more than one season. The situation on the farms was
exacerbated by the fact that there was no recorded use of artifi cial fertilizers and
very little use of any other off-farm sources of nutrients, such as mulch; inputs of
nutrients to the land from off-farm sources were close to nil for all fi ve categories
of farming systems except zero-grazing.
CONCLUSIONS

26
DAIRY FARMING IN UGANDA
Shortage of labour may be one reason that manure is underused; in cases where
manure is applied, this tends to be done during the school holidays when family
labour is most plentiful. Also, in some cases the cultivated plots may be distant
from the zero-grazing units, exacerbating transport problems. But in feedback
provided by the farmers at the end of the study, other factors were also mentioned
such as lack of awareness of the benefi ts of using manure, lack of basic equipment
for transporting manure and fear of introducing pests and diseases to their plots.
More work needs to be done to investigate the economics and practicalities of
manure application and how best to integrate this activity with other activities that
compete for available labour.


INTERNATIONAL LIVESTOCK RESEARCH INSTITUTE
www.ilri.org PO Box 30709 Nairobi 00100, Kenya