dairy wastewater treatment in continuous stirred … · equalization tank of wastewater treatment...
TRANSCRIPT
Environmental Engineering and Management Journal June 2019, Vol. 18, No. 6, 1219-1230
http://www.eemj.icpm.tuiasi.ro/; http://www.eemj.eu
“Gheorghe Asachi” Technical University of Iasi, Romania
DAIRY WASTEWATER TREATMENT IN CONTINUOUS STIRRED
TANK ELECTROCHEMICAL REACTOR (CSTER): PARAMETRIC
OPTIMIZATION AND KINETICS
Poonam Kumari, Jai Prakash Kushwaha, Vikas K. Sangal, Neetu Singh
Department of Chemical Engineering, Thapar Institute of Engineering and Technology (Deemed to be University), Patiala-147004, Punjab, India
Abstract Dairy wastewater has been a major environmental concern because of massive effluents characterized by high pollution load. This study reports the influence of initial pH (pHi), residence time (τ) and elapsed time (t) on the %COD removal (Y1) and specific energy consumed (kWh per kg of COD removed, Y2) for real dairy industry wastewater treatment in continuous stirred tank electrochemical reactor (CSTER) using aluminum electrodes. Central composite design (CCD) was applied for designing the experiments, analyzing the experimental data and optimizing the process parameters to maximizing Y1 and simultaneously minimizing Y2. Important design parameters for continuous reactors like steady state time (tS), mass transfer coefficient (km) and kinetic parameters were also estimated. Modified pseudo-first-order kinetic model was used for kinetic modeling with non-linear regression technique. Experiments conducted at optimal process parameters for CSTER (pHi= 4.5, τ= 141 min; t= 52 min) showed Y1 = 71.21%, Y2 = 4. Key words: aluminum electrode, COD removal, continuous electrochemical treatment, dairy wastewater, specific energy consumed Received: June, 2016; Revised final: January, 2017; Accepted: August, 2017; Published in final edited form: June 2019
1. Introduction
Increased demand in processed milk and milk products resulted enormous increase in dairy industries, consequently huge volume of wastewater is generated worldwide. Usually 0.2-10 liters of wastewater is generated for one liter of processed milk (Kushwaha et al., 2010a; Vourch et al., 2005). In dairy industry, various operational steps such as starting, equilibrating, stopping and rinsing the processing units (flushing water, first rinse water etc.) generates the wastewater (Kushwaha et al., 2011a; Vourch et al., 2008). However, large fraction of generated wastewater gets produced during cleaning operations. Dairy wastewater usually contains fat, lactose, nutrients, detergents and sanitizing agents, and loaded with high biochemical oxygen demand (BOD), chemical oxygen demand (COD) and
Author to whom all correspondence should be addressed: e-mail: [email protected]; Phone: +91-175-2393876; Fax: +91-175-2393005
dissolved/suspended solids (Hepsen and Kyaya, 2012; Kushwaha et al., 2010a). Therefore, its disposal concern is at highest.
Various technologies for the treatment of dairy wastewaters have been reported in the literature such as membrane filtration (Frappart et al., 2006; Vourch et al., 2005), coagulation (Kushwaha et al., 2010b; Rusten et al., 1993), biological treatment (Demirel et al., 2005; Mohseni-Bandpi and Bazari, 2004; Sirianuntapiboon et al., 2005) and adsorption (Kushwaha et al., 2010c; Rao and Bhole, 2002; Sarkar et al., 2006). Aerobic process has been reported to be high energy intensive, whereas, anaerobic processes are inefficient to nutrients degradation and need high controls. Therefore, biological methods are very costly in terms of operating as well as fixed cost. On the other hand, the physical/chemical methods have been reported to generate huge volume of secondary
Kumari et al./Environmental Engineering and Management Journal 18 (2019), 6, 1219-1230
1220
pollutants, and are costly due to expensive adsorbents/coagulants/chemicals (Borbón et al., 2014; Chen and Liu 2012; Demirel et al., 2005; Kushwaha et al., 2011a).
Electrochemical (EC) treatment method is a feasible technique for wastewater treatment, including dairy wastewater (Bensadok et al., 2011; Borbón et al., 2014; Kushwaha et al., 2011b; Maiti et al., 2011; Qasim and Mane, 2013; Sangal et al., 2013a; Sharma, 2014; Sundarapandiyan et al., 2018;Tchamango et al., 2010; Un et al., 2014; Wang et al., 2017; Yavuz et al., 2011). EC treatment offers high removal efficiencies in compact reactors with simple equipment/instruments for control and operation of the process (Wang et al., 2017; Yavuz et al., 2011). Further, EC treatment produces lesser sludge as secondary pollutants due to involvement of electro-oxidation. Moreover, Kushwaha et al. (2010b) reported EC methods very cost effective in terms of operating cost.
Excellent assessment of the available literature on dairy wastewater treatment has been presented by Arvanitoyannis (2006) and Kushwaha et al. (2011a). In most of the reported studies, authors used batch EC reactor for the dairy wastewater treatment (Bensadok et al., 2011; Kushwaha et al., 2010b; 2011b; Qasim and Mane, 2013; Sharma, 2014; Tchamango et al., 2010; Yavuz et al., 2011).
Dairy industries generate strong and large volume of wastewater, generally 0.2-10 litre of effluent per litre of processed milk (Vourch et al., 2008) with high flow rate (Castillo et al., 2007; Hepsen and Kaya, 2012). This discourages the treatment in batch EC reactor. However, only two studies (Benazzi et al., 2016; Un et al., 2014) are available in open literature for continuous EC treatment of dairy wastewater, reporting the influence of current density, retention time and pH on treatment efficiency. Benazzi et al. (2016) used synthetic dairy wastewater (milk powder dissolved in distilled water) with Aluminium (Al) electrode, and Un et al. (2014) studied whey wastewater (liquid discharged from cheese production) treatment with iron electrode.
Conversely, for real dairy wastewater, the treatment performance may be restricted by presence of contaminants other than milk wastes such as: milk solids, detergents, sanitizers, cleaning water, phosphates, sequestering agents, surfactants and many other factors like turbidity, high chloride content, pH, etc. (Demirel et al., 2005; Grasshoff, 1997; Passeggi et al., 2009). Moreover, steady state time (tS), mass transfer coefficient (km) and kinetic parameters, which
are important design parameters for the continuous reactors, and lacking in studies reported by Benazzi et al. (2016) and Un et al. (2014). Furthermore, energy consumption, which is an important operating cost parameter, is not reported in earlier studies. Therefore, in view of above lacking, more studies are needed to evaluate performance and applicability of continuous EC treatment to treat real dairy wastewater.
This study investigates EC treatment of real dairy industry wastewater in continuous stirred tank electrochemical reactor (CSTER). Experiments in CSTER were conducted to evaluate the influence of process parameters such as initial pH (pHi), residence time (τ) and elapsed time (t) on the %COD removal (Y1) and specific energy consumed (kWh per kg of COD removed, Y2) using Aluminium (Al) electrode, and steady state time (tS) and mass transfer coefficient (km) were estimated. Elapsed time is defined as the run time of the reactor after switching on the power supply to the reactor. Steady state time is defined as the time after which the treatment performance indicator (% COD removal) becomes constant. Central composite design (CCD) was applied for designing the experiments, analyzing the experimental data and optimizing the process parameters. Kinetic modeling was also performed using modified pseudo-first-order kinetic model through nonlinear regression technique.
2. Materials and methods
2.1. Wastewater and instrumentation
Dairy wastewater was collected from equalization tank of wastewater treatment plant of Verka Milk Plant, Patiala, Punjab, India, and was preserved at 4°C. The dairy wastewater was characterized for COD, BOD (5-day BOD), total nitrogen (TN), total solids and Turbidity immediately after collection and three more times during the study. The detailed statistics with minimum, mean and maximum values with standard deviation have been provided in Table 1. Analytical reagent grade chemicals were used for analysis of wastewater samples before and after the treatment. To measure the COD, a digestion unit (Spectra lab, 2015D, India) and a double beam UV-visible spectrophotometer (HACH, DR 5000, USA) were used. BOD was measured using digital BOD-measurement system (WTW Oxitop IS 6, Germany), and turbidity meter supplied by Spectra lab India (NT 2000) was used to measure the turbidity. TN was determined using the standard Kjeldahl method.
Table 1. Dairy industry wastewater characteristics
Parameter Values
Untreated EC Treated
Minimum Mean Maximum SD COD (mg/L) 2675 2800 2930 109.77 806 BOD5 (mg/L) 2085 2285 2475 170.68 630
TN (mg/L) 14.07 15.12 15.84 0.759 3.92 Total solids (mg/L) 21140 22000 22310 573.8 2000
Turbidity (NTU) 811.6 844.9 858 23.69 1.3
Dairy wastewater treatment in continuous stirred tank electrochemical reactor (CSTER)
1221
2.2. Reactor and experimental procedure
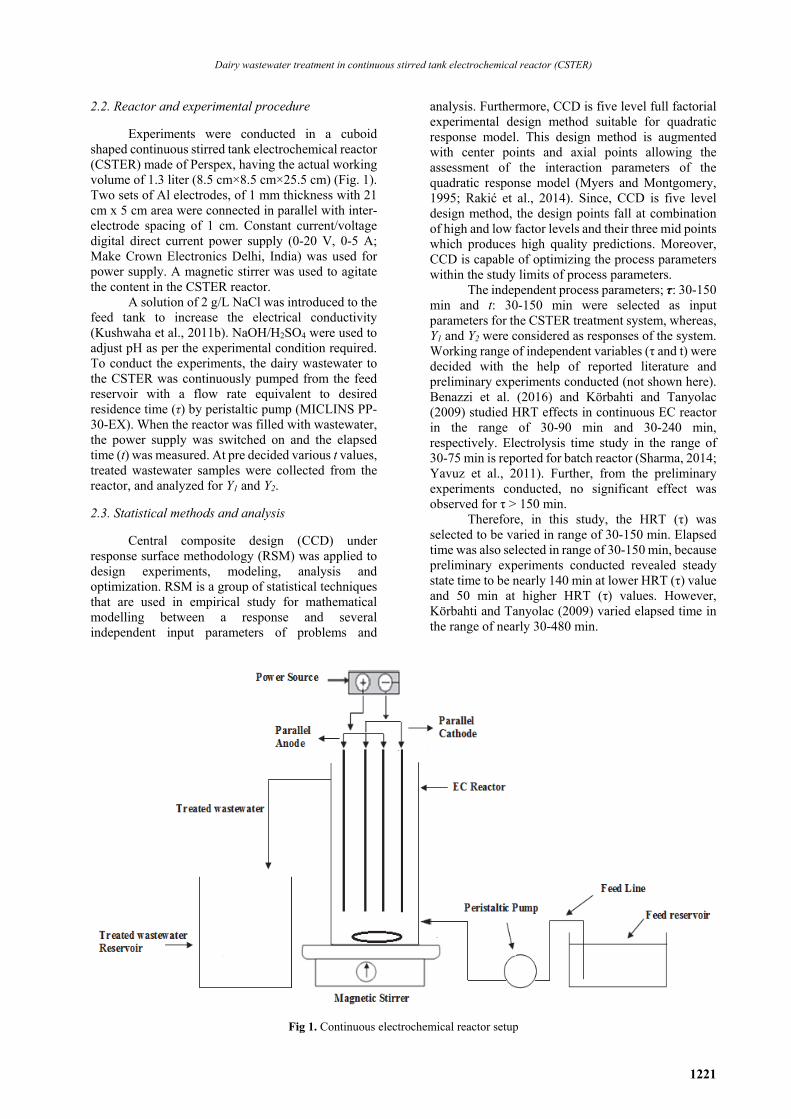
Experiments were conducted in a cuboid
shaped continuous stirred tank electrochemical reactor (CSTER) made of Perspex, having the actual working volume of 1.3 liter (8.5 cm×8.5 cm×25.5 cm) (Fig. 1). Two sets of Al electrodes, of 1 mm thickness with 21 cm x 5 cm area were connected in parallel with inter-electrode spacing of 1 cm. Constant current/voltage digital direct current power supply (0-20 V, 0-5 A; Make Crown Electronics Delhi, India) was used for power supply. A magnetic stirrer was used to agitate the content in the CSTER reactor.
A solution of 2 g/L NaCl was introduced to the feed tank to increase the electrical conductivity (Kushwaha et al., 2011b). NaOH/H2SO4 were used to adjust pH as per the experimental condition required. To conduct the experiments, the dairy wastewater to the CSTER was continuously pumped from the feed reservoir with a flow rate equivalent to desired residence time (τ) by peristaltic pump (MICLINS PP- 30-EX). When the reactor was filled with wastewater, the power supply was switched on and the elapsed time (t) was measured. At pre decided various t values, treated wastewater samples were collected from the reactor, and analyzed for Y1 and Y2.
2.3. Statistical methods and analysis Central composite design (CCD) under
response surface methodology (RSM) was applied to design experiments, modeling, analysis and optimization. RSM is a group of statistical techniques that are used in empirical study for mathematical modelling between a response and several independent input parameters of problems and
analysis. Furthermore, CCD is five level full factorial experimental design method suitable for quadratic response model. This design method is augmented with center points and axial points allowing the assessment of the interaction parameters of the quadratic response model (Myers and Montgomery, 1995; Rakić et al., 2014). Since, CCD is five level design method, the design points fall at combination of high and low factor levels and their three mid points which produces high quality predictions. Moreover, CCD is capable of optimizing the process parameters within the study limits of process parameters.
The independent process parameters; τ: 30-150 min and t: 30-150 min were selected as input parameters for the CSTER treatment system, whereas, Y1 and Y2 were considered as responses of the system. Working range of independent variables (τ and t) were decided with the help of reported literature and preliminary experiments conducted (not shown here). Benazzi et al. (2016) and Körbahti and Tanyolac (2009) studied HRT effects in continuous EC reactor in the range of 30-90 min and 30-240 min, respectively. Electrolysis time study in the range of 30-75 min is reported for batch reactor (Sharma, 2014; Yavuz et al., 2011). Further, from the preliminary experiments conducted, no significant effect was observed for τ > 150 min.
Therefore, in this study, the HRT (τ) was selected to be varied in range of 30-150 min. Elapsed time was also selected in range of 30-150 min, because preliminary experiments conducted revealed steady state time to be nearly 140 min at lower HRT (τ) value and 50 min at higher HRT (τ) values. However, Körbahti and Tanyolac (2009) varied elapsed time in the range of nearly 30-480 min.
Fig 1. Continuous electrochemical reactor setup
Kumari et al./Environmental Engineering and Management Journal 18 (2019), 6, 1219-1230
1222
To design experiments, the independent
process parameters were coded at five levels between -2 to +2, and suggested number of experiments with experimental conditions by CCD has been presented in Table 2.
In our previous study (Kushwaha et al., 2011b), batch electrochemical treatment of synthetic dairy wastewater using Al electrodes was reported and current density was optimized. Therefore, in this study all the experiments suggested by the CCD were conducted at previously optimized current (i) = 3.7 A (Kushwaha et al., 2011b). To optimize pHi, experiments were conducted for various pHi: 4.5-9 at current (i) = 3.7 A, τ = 45 min and t=150 min, and Y1 was measured.
The data obtained from the conducted experiments (Table 2) were fitted to quadratic equation (Eq. 1), and ANOVA was used to analyse the interaction between the process parameters and the responses.
ij
3
ji
4
1jiij
4
1i
2iiii
4
1iio XkXkXkkY
(1)
where: Y is response; ko, ki, kii, kij are constant coefficients and Xi the independent process variables. The sequential F-test and other adequacy measures were used for selecting the best model (Sangal et al., 2013b). The fit quality of quadratic model was evaluated by the coefficient of determination, R2 and adjusted R2. To come to a decision about the adequacy of the model for the % COD removal and specific energy consumed, two different tests such as the sequential model sum of squares and model summary statistics were carried out.
Since, there are two responses; Y1 and Y2, Therefore, optimum process parameters must ensure maximizing Y1 and at the same time minimizing Y2. For the purpose of optimization of process parameters, multi-response process optimization using desirability function approach of RSM was used (Kushwaha et al.,
2011b; Sangal et al., 2014). This approach transforms each individual response (Yi) to an individual desirability measure (di), where di lies between 0-1, using a desirability transformation function. Depending on the preferred target (nominal-the-best: NTB; larger-the-best: LTB; and smaller-the-best: STB) of the response (Yi), the individual desirability transformation function is varied. In this study, the preferred target for the responses Y1 (%COD Removal) and Y2 (specific energy consumed) were set as LTB and STB, respectively (Barman, 2016). The Eqs. (2) and (3) shows the desirability transformation function used to calculate the individual desirability measure for responses Y1 and Y2 with LTB and STB target set, respectively.
maxii
maxiimini
miniir
minimaxi
miniii
YYif,
YYYif,
YYif,
]
1YY
YY[
0
d
(2)
maxii
maxiimini
miniis
maximini
maxiii
YYif,
YYYif,
YYif,
]
0YY
YY[
1
d
(3)
Here, Yi-min and Yi-max is minimum and
maximum response values of ith response, respectively, while Yi is the ith response values. r and s is weight assigned to responses and we take all as 1 in this study. Importance factor was also selected as 1 for both the responses; Y1 and Y2.
The overall desirability (D) for the optimized system is explained by Eq. (4).
2
1
21 )( ddD (4)
where, d1 and d2 are individual desirability for responses Y1 and Y2, and 0≤D≤1.
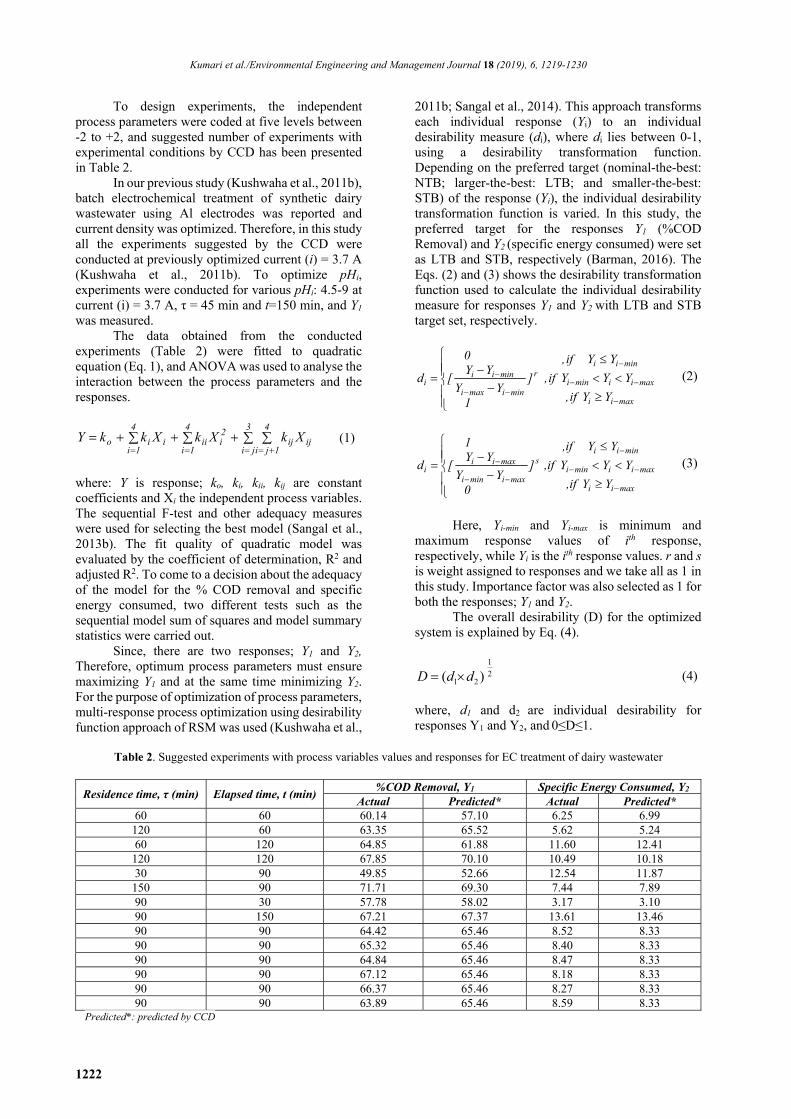
Table 2. Suggested experiments with process variables values and responses for EC treatment of dairy wastewater
Residence time, τ (min) Elapsed time, t (min) %COD Removal, Y1 Specific Energy Consumed, Y2
Actual Predicted* Actual Predicted* 60 60 60.14 57.10 6.25 6.99 120 60 63.35 65.52 5.62 5.24 60 120 64.85 61.88 11.60 12.41 120 120 67.85 70.10 10.49 10.18 30 90 49.85 52.66 12.54 11.87 150 90 71.71 69.30 7.44 7.89 90 30 57.78 58.02 3.17 3.10 90 150 67.21 67.37 13.61 13.46 90 90 64.42 65.46 8.52 8.33 90 90 65.32 65.46 8.40 8.33 90 90 64.84 65.46 8.47 8.33 90 90 67.12 65.46 8.18 8.33 90 90 66.37 65.46 8.27 8.33 90 90 63.89 65.46 8.59 8.33
Predicted*: predicted by CCD
Dairy wastewater treatment in continuous stirred tank electrochemical reactor (CSTER)
1223
3. Result and discussions 3.1. Effects of pHi on Y1
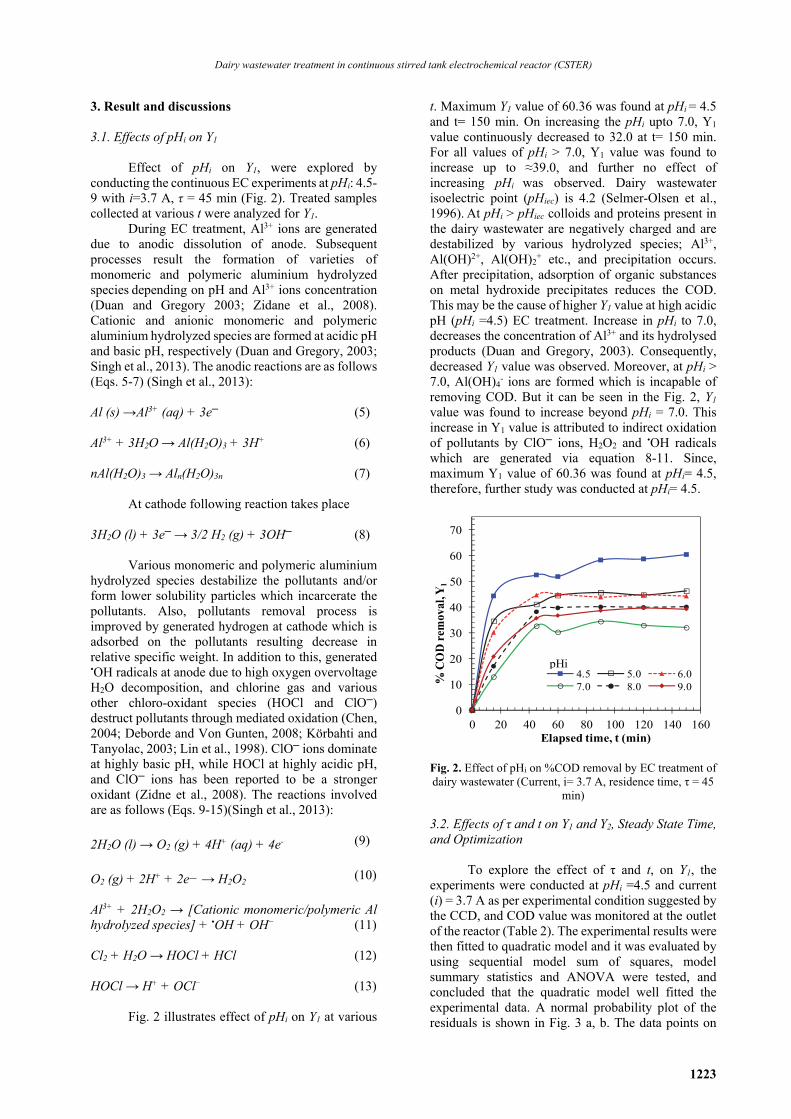
Effect of pHi on Y1, were explored by conducting the continuous EC experiments at pHi: 4.5-9 with i=3.7 A, τ = 45 min (Fig. 2). Treated samples collected at various t were analyzed for Y1.
During EC treatment, Al3+ ions are generated due to anodic dissolution of anode. Subsequent processes result the formation of varieties of monomeric and polymeric aluminium hydrolyzed species depending on pH and Al3+ ions concentration (Duan and Gregory 2003; Zidane et al., 2008). Cationic and anionic monomeric and polymeric aluminium hydrolyzed species are formed at acidic pH and basic pH, respectively (Duan and Gregory, 2003; Singh et al., 2013). The anodic reactions are as follows (Eqs. 5-7) (Singh et al., 2013): Al (s) →Al3+ (aq) + 3e─ (5) Al3+ + 3H2O → Al(H2O)3 + 3H+ (6) nAl(H2O)3 → Aln(H2O)3n (7)
At cathode following reaction takes place
3H2O (l) + 3e─ → 3/2 H2 (g) + 3OH─ (8)
Various monomeric and polymeric aluminium
hydrolyzed species destabilize the pollutants and/or form lower solubility particles which incarcerate the pollutants. Also, pollutants removal process is improved by generated hydrogen at cathode which is adsorbed on the pollutants resulting decrease in relative specific weight. In addition to this, generated
•OH radicals at anode due to high oxygen overvoltage H2O decomposition, and chlorine gas and various other chloro-oxidant species (HOCl and ClO─) destruct pollutants through mediated oxidation (Chen, 2004; Deborde and Von Gunten, 2008; Körbahti and Tanyolac, 2003; Lin et al., 1998). ClO─ ions dominate at highly basic pH, while HOCl at highly acidic pH, and ClO─ ions has been reported to be a stronger oxidant (Zidne et al., 2008). The reactions involved are as follows (Eqs. 9-15)(Singh et al., 2013):
2H2O (l) → O2 (g) + 4H+ (aq) + 4e- (9)
O2 (g) + 2H+ + 2e− → H2O2 (10) Al3+ + 2H2O2 → [Cationic monomeric/polymeric Al hydrolyzed species] + •OH + OH− (11) Cl2 + H2O → HOCl + HCl (12) HOCl → H+ + OCl− (13)
Fig. 2 illustrates effect of pHi on Y1 at various
t. Maximum Y1 value of 60.36 was found at pHi = 4.5 and t= 150 min. On increasing the pHi upto 7.0, Y1 value continuously decreased to 32.0 at t= 150 min. For all values of pHi > 7.0, Y1 value was found to increase up to ≈39.0, and further no effect of increasing pHi was observed. Dairy wastewater isoelectric point (pHiec) is 4.2 (Selmer-Olsen et al., 1996). At pHi > pHiec colloids and proteins present in the dairy wastewater are negatively charged and are destabilized by various hydrolyzed species; Al3+, Al(OH)2+, Al(OH)2
+ etc., and precipitation occurs. After precipitation, adsorption of organic substances on metal hydroxide precipitates reduces the COD. This may be the cause of higher Y1 value at high acidic pH (pHi =4.5) EC treatment. Increase in pHi to 7.0, decreases the concentration of Al3+ and its hydrolysed products (Duan and Gregory, 2003). Consequently, decreased Y1 value was observed. Moreover, at pHi > 7.0, Al(OH)4
- ions are formed which is incapable of removing COD. But it can be seen in the Fig. 2, Y1 value was found to increase beyond pHi = 7.0. This increase in Y1 value is attributed to indirect oxidation of pollutants by ClO─ ions, H2O2 and •OH radicals which are generated via equation 8-11. Since, maximum Y1 value of 60.36 was found at pHi= 4.5, therefore, further study was conducted at pHi= 4.5.
Fig. 2. Effect of pHi on %COD removal by EC treatment of dairy wastewater (Current, i= 3.7 A, residence time, τ = 45
min)
3.2. Effects of τ and t on Y1 and Y2, Steady State Time, and Optimization
To explore the effect of τ and t, on Y1, the
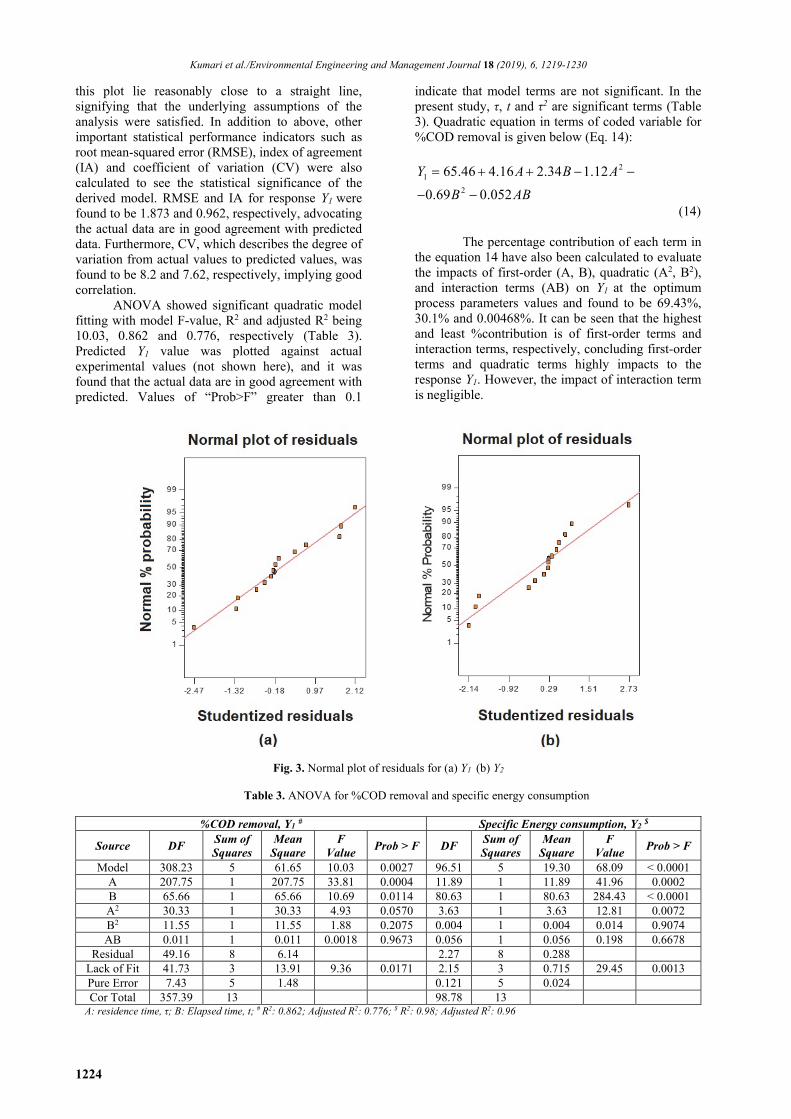
experiments were conducted at pHi =4.5 and current (i) = 3.7 A as per experimental condition suggested by the CCD, and COD value was monitored at the outlet of the reactor (Table 2). The experimental results were then fitted to quadratic model and it was evaluated by using sequential model sum of squares, model summary statistics and ANOVA were tested, and concluded that the quadratic model well fitted the experimental data. A normal probability plot of the residuals is shown in Fig. 3 a, b. The data points on
0
10
20
30
40
50
60
70
0 20 40 60 80 100 120 140 160
% C
OD
rem
oval
, Y1
Elapsed time, t (min)
4.5 5.0 6.07.0 8.0 9.0
pHi
Kumari et al./Environmental Engineering and Management Journal 18 (2019), 6, 1219-1230
1224
this plot lie reasonably close to a straight line, signifying that the underlying assumptions of the analysis were satisfied. In addition to above, other important statistical performance indicators such as root mean-squared error (RMSE), index of agreement (IA) and coefficient of variation (CV) were also calculated to see the statistical significance of the derived model. RMSE and IA for response Y1 were found to be 1.873 and 0.962, respectively, advocating the actual data are in good agreement with predicted data. Furthermore, CV, which describes the degree of variation from actual values to predicted values, was found to be 8.2 and 7.62, respectively, implying good correlation.
ANOVA showed significant quadratic model fitting with model F-value, R2 and adjusted R2 being 10.03, 0.862 and 0.776, respectively (Table 3). Predicted Y1 value was plotted against actual experimental values (not shown here), and it was found that the actual data are in good agreement with predicted. Values of “Prob>F” greater than 0.1
indicate that model terms are not significant. In the present study, τ, t and τ2 are significant terms (Table 3). Quadratic equation in terms of coded variable for %COD removal is given below (Eq. 14):
2
1
2
65.46 4.16 2.34 1.12
0.69 0.052
Y A B A
B AB
(14) The percentage contribution of each term in the equation 14 have also been calculated to evaluate the impacts of first-order (A, B), quadratic (A2, B2), and interaction terms (AB) on Y1 at the optimum process parameters values and found to be 69.43%, 30.1% and 0.00468%. It can be seen that the highest and least %contribution is of first-order terms and interaction terms, respectively, concluding first-order terms and quadratic terms highly impacts to the response Y1. However, the impact of interaction term is negligible.
Fig. 3. Normal plot of residuals for (a) Y1 (b) Y2
Table 3. ANOVA for %COD removal and specific energy consumption
%COD removal, Y1 # Specific Energy consumption, Y2 $
Source DF Sum of Squares
Mean Square
F Value
Prob > F DF Sum of Squares
Mean Square
F Value
Prob > F
Model 308.23 5 61.65 10.03 0.0027 96.51 5 19.30 68.09 < 0.0001 A 207.75 1 207.75 33.81 0.0004 11.89 1 11.89 41.96 0.0002 B 65.66 1 65.66 10.69 0.0114 80.63 1 80.63 284.43 < 0.0001 A2 30.33 1 30.33 4.93 0.0570 3.63 1 3.63 12.81 0.0072 B2 11.55 1 11.55 1.88 0.2075 0.004 1 0.004 0.014 0.9074 AB 0.011 1 0.011 0.0018 0.9673 0.056 1 0.056 0.198 0.6678
Residual 49.16 8 6.14 2.27 8 0.288 Lack of Fit 41.73 3 13.91 9.36 0.0171 2.15 3 0.715 29.45 0.0013 Pure Error 7.43 5 1.48 0.121 5 0.024 Cor Total 357.39 13 98.78 13
A: residence time, τ; B: Elapsed time, t; # R2: 0.862; Adjusted R2: 0.776; $ R2: 0.98; Adjusted R2: 0.96
Dairy wastewater treatment in continuous stirred tank electrochemical reactor (CSTER)
1225
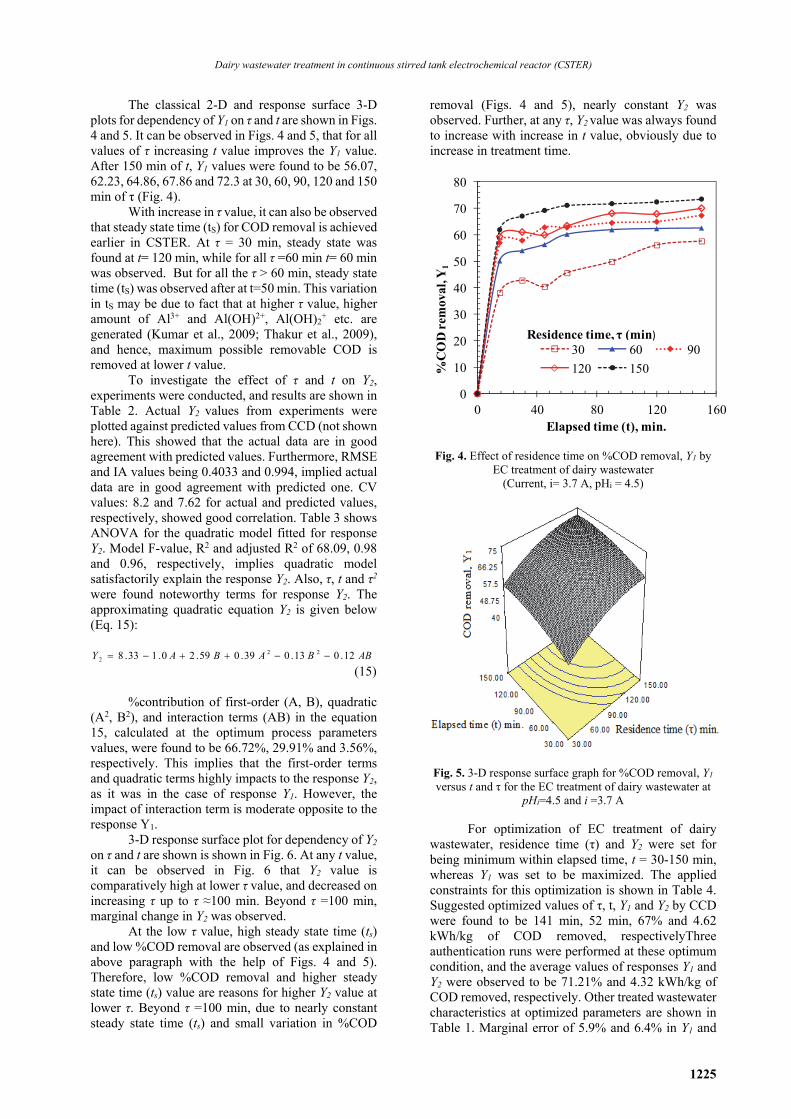
The classical 2-D and response surface 3-D
plots for dependency of Y1 on τ and t are shown in Figs. 4 and 5. It can be observed in Figs. 4 and 5, that for all values of τ increasing t value improves the Y1 value. After 150 min of t, Y1 values were found to be 56.07, 62.23, 64.86, 67.86 and 72.3 at 30, 60, 90, 120 and 150 min of τ (Fig. 4).
With increase in τ value, it can also be observed that steady state time (tS) for COD removal is achieved earlier in CSTER. At τ = 30 min, steady state was found at t= 120 min, while for all τ =60 min t= 60 min was observed. But for all the τ > 60 min, steady state time (tS) was observed after at t=50 min. This variation in tS may be due to fact that at higher τ value, higher amount of Al3+ and Al(OH)2+, Al(OH)2
+ etc. are generated (Kumar et al., 2009; Thakur et al., 2009), and hence, maximum possible removable COD is removed at lower t value.
To investigate the effect of τ and t on Y2, experiments were conducted, and results are shown in Table 2. Actual Y2 values from experiments were plotted against predicted values from CCD (not shown here). This showed that the actual data are in good agreement with predicted values. Furthermore, RMSE and IA values being 0.4033 and 0.994, implied actual data are in good agreement with predicted one. CV values: 8.2 and 7.62 for actual and predicted values, respectively, showed good correlation. Table 3 shows ANOVA for the quadratic model fitted for response Y2. Model F-value, R2 and adjusted R2 of 68.09, 0.98 and 0.96, respectively, implies quadratic model satisfactorily explain the response Y2. Also, τ, t and τ2 were found noteworthy terms for response Y2. The approximating quadratic equation Y2 is given below (Eq. 15):
ABBABAY 12.013.039.059.20.133.8 222
(15)
%contribution of first-order (A, B), quadratic
(A2, B2), and interaction terms (AB) in the equation 15, calculated at the optimum process parameters values, were found to be 66.72%, 29.91% and 3.56%, respectively. This implies that the first-order terms and quadratic terms highly impacts to the response Y2, as it was in the case of response Y1. However, the impact of interaction term is moderate opposite to the response Y1.
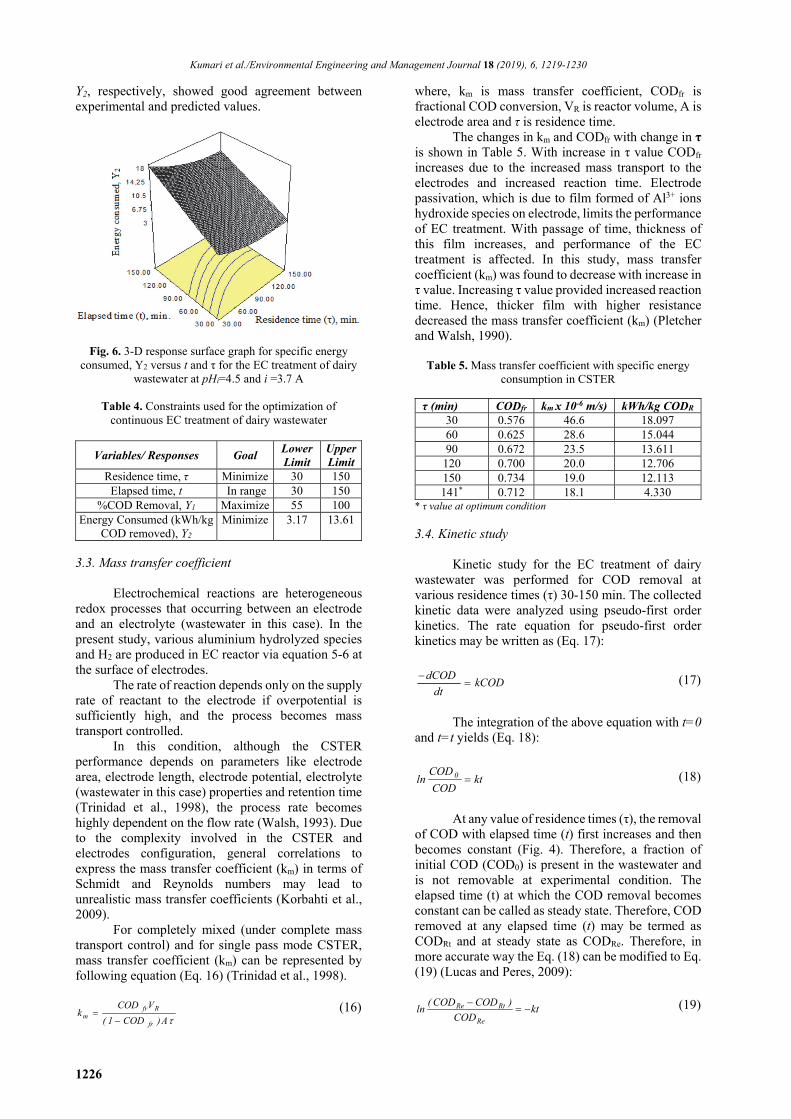
3-D response surface plot for dependency of Y2 on τ and t are shown is shown in Fig. 6. At any t value, it can be observed in Fig. 6 that Y2 value is comparatively high at lower τ value, and decreased on increasing τ up to τ ≈100 min. Beyond τ =100 min, marginal change in Y2 was observed.
At the low τ value, high steady state time (ts) and low %COD removal are observed (as explained in above paragraph with the help of Figs. 4 and 5). Therefore, low %COD removal and higher steady state time (ts) value are reasons for higher Y2 value at lower τ. Beyond τ =100 min, due to nearly constant steady state time (ts) and small variation in %COD
removal (Figs. 4 and 5), nearly constant Y2 was observed. Further, at any τ, Y2 value was always found to increase with increase in t value, obviously due to increase in treatment time.
Fig. 4. Effect of residence time on %COD removal, Y1 by EC treatment of dairy wastewater
(Current, i= 3.7 A, pHi = 4.5)
Fig. 5. 3-D response surface graph for %COD removal, Y1 versus t and τ for the EC treatment of dairy wastewater at
pHi=4.5 and i =3.7 A For optimization of EC treatment of dairy
wastewater, residence time (τ) and Y2 were set for being minimum within elapsed time, t = 30-150 min, whereas Y1 was set to be maximized. The applied constraints for this optimization is shown in Table 4. Suggested optimized values of τ, t, Y1 and Y2 by CCD were found to be 141 min, 52 min, 67% and 4.62 kWh/kg of COD removed, respectivelyThree authentication runs were performed at these optimum condition, and the average values of responses Y1 and Y2 were observed to be 71.21% and 4.32 kWh/kg of COD removed, respectively. Other treated wastewater characteristics at optimized parameters are shown in Table 1. Marginal error of 5.9% and 6.4% in Y1 and
0
10
20
30
40
50
60
70
80
0 40 80 120 160
%C
OD
rem
oval
, Y1
Elapsed time (t), min.
30 60 90
120 150
Residence time, τ (min)
Kumari et al./Environmental Engineering and Management Journal 18 (2019), 6, 1219-1230
1226
Y2, respectively, showed good agreement between experimental and predicted values.
Fig. 6. 3-D response surface graph for specific energy consumed, Y2 versus t and τ for the EC treatment of dairy
wastewater at pHi=4.5 and i =3.7 A
Table 4. Constraints used for the optimization of continuous EC treatment of dairy wastewater
Variables/ Responses Goal Lower Limit
Upper Limit
Residence time, τ Minimize 30 150 Elapsed time, t In range 30 150
%COD Removal, Y1 Maximize 55 100 Energy Consumed (kWh/kg
COD removed), Y2 Minimize 3.17 13.61
3.3. Mass transfer coefficient
Electrochemical reactions are heterogeneous
redox processes that occurring between an electrode and an electrolyte (wastewater in this case). In the present study, various aluminium hydrolyzed species and H2 are produced in EC reactor via equation 5-6 at the surface of electrodes.
The rate of reaction depends only on the supply rate of reactant to the electrode if overpotential is sufficiently high, and the process becomes mass transport controlled.
In this condition, although the CSTER performance depends on parameters like electrode area, electrode length, electrode potential, electrolyte (wastewater in this case) properties and retention time (Trinidad et al., 1998), the process rate becomes highly dependent on the flow rate (Walsh, 1993). Due to the complexity involved in the CSTER and electrodes configuration, general correlations to express the mass transfer coefficient (km) in terms of Schmidt and Reynolds numbers may lead to unrealistic mass transfer coefficients (Korbahti et al., 2009).
For completely mixed (under complete mass transport control) and for single pass mode CSTER, mass transfer coefficient (km) can be represented by following equation (Eq. 16) (Trinidad et al., 1998).
A)COD1(
VCODk
fr
Rfrm
(16)
where, km is mass transfer coefficient, CODfr is fractional COD conversion, VR is reactor volume, A is electrode area and τ is residence time.
The changes in km and CODfr with change in τ is shown in Table 5. With increase in τ value CODfr increases due to the increased mass transport to the electrodes and increased reaction time. Electrode passivation, which is due to film formed of Al3+ ions hydroxide species on electrode, limits the performance of EC treatment. With passage of time, thickness of this film increases, and performance of the EC treatment is affected. In this study, mass transfer coefficient (km) was found to decrease with increase in τ value. Increasing τ value provided increased reaction time. Hence, thicker film with higher resistance decreased the mass transfer coefficient (km) (Pletcher and Walsh, 1990).
Table 5. Mass transfer coefficient with specific energy consumption in CSTER
τ (min) CODfr km x 10-6 m/s) kWh/kg CODR
30 0.576 46.6 18.097 60 0.625 28.6 15.044 90 0.672 23.5 13.611
120 0.700 20.0 12.706 150 0.734 19.0 12.113 141* 0.712 18.1 4.330
* τ value at optimum condition
3.4. Kinetic study Kinetic study for the EC treatment of dairy
wastewater was performed for COD removal at various residence times (τ) 30-150 min. The collected kinetic data were analyzed using pseudo-first order kinetics. The rate equation for pseudo-first order kinetics may be written as (Eq. 17):
kCODdt
dCOD
(17)
The integration of the above equation with t=0
and t=t yields (Eq. 18):
ktCOD
CODln 0 (18)
At any value of residence times (τ), the removal
of COD with elapsed time (t) first increases and then becomes constant (Fig. 4). Therefore, a fraction of initial COD (COD0) is present in the wastewater and is not removable at experimental condition. The elapsed time (t) at which the COD removal becomes constant can be called as steady state. Therefore, COD removed at any elapsed time (t) may be termed as CODRt and at steady state as CODRe. Therefore, in more accurate way the Eq. (18) can be modified to Eq. (19) (Lucas and Peres, 2009):
ktCOD
)CODCOD(ln
Re
RtRe (19)
Dairy wastewater treatment in continuous stirred tank electrochemical reactor (CSTER)
1227
Above equation can be written as (Eq. 20):
)]ktexp(1[CODCOD ReRt (20)
Equation 20 was used to fit the experimental
data through nonlinear regression technique using Marquardt’s percent standard deviation (MPSD) error function (Marquardt, 1963) given by Eq. (19).
n
1i
2
exp,i,Rt
cal,i,Rtexp,i,Rt
pm COD
CODCOD
nn
1100MPSD (21)
In this equation, CODRt,i,exp and CODRt,i,cal are
the experimental and calculated values of COD removed for any value of elapsed time (t), respectively, and nm is the number of measurements, and np is the number of parameters in the model.
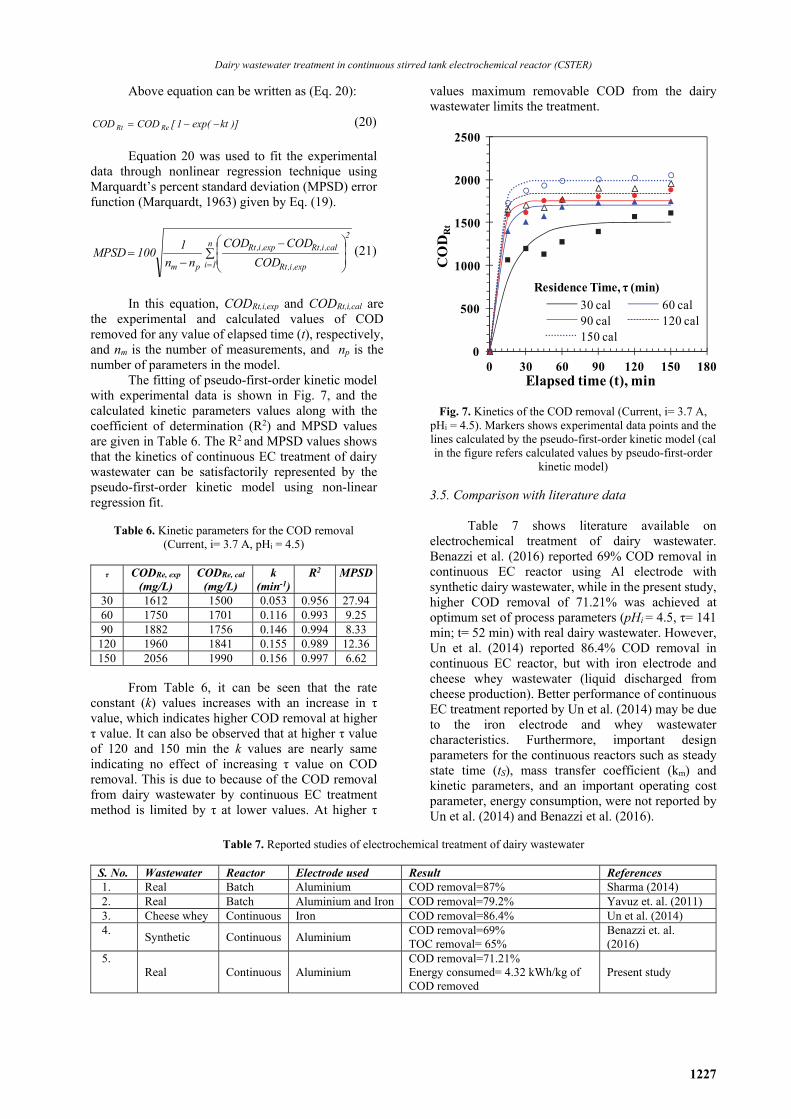
The fitting of pseudo-first-order kinetic model with experimental data is shown in Fig. 7, and the calculated kinetic parameters values along with the coefficient of determination (R2) and MPSD values are given in Table 6. The R2 and MPSD values shows that the kinetics of continuous EC treatment of dairy wastewater can be satisfactorily represented by the pseudo-first-order kinetic model using non-linear regression fit.
Table 6. Kinetic parameters for the COD removal (Current, i= 3.7 A, pHi = 4.5)
τ CODRe, exp
(mg/L) CODRe, cal
(mg/L) k
(min-1) R2
MPSD
30 1612 1500 0.053 0.956 27.94 60 1750 1701 0.116 0.993 9.25 90 1882 1756 0.146 0.994 8.33 120 1960 1841 0.155 0.989 12.36 150 2056 1990 0.156 0.997 6.62
From Table 6, it can be seen that the rate
constant (k) values increases with an increase in τ value, which indicates higher COD removal at higher τ value. It can also be observed that at higher τ value of 120 and 150 min the k values are nearly same indicating no effect of increasing τ value on COD removal. This is due to because of the COD removal from dairy wastewater by continuous EC treatment method is limited by τ at lower values. At higher τ
values maximum removable COD from the dairy wastewater limits the treatment.
Fig. 7. Kinetics of the COD removal (Current, i= 3.7 A, pHi = 4.5). Markers shows experimental data points and the lines calculated by the pseudo-first-order kinetic model (cal in the figure refers calculated values by pseudo-first-order
kinetic model)
3.5. Comparison with literature data Table 7 shows literature available on
electrochemical treatment of dairy wastewater. Benazzi et al. (2016) reported 69% COD removal in continuous EC reactor using Al electrode with synthetic dairy wastewater, while in the present study, higher COD removal of 71.21% was achieved at optimum set of process parameters (pHi = 4.5, τ= 141 min; t= 52 min) with real dairy wastewater. However, Un et al. (2014) reported 86.4% COD removal in continuous EC reactor, but with iron electrode and cheese whey wastewater (liquid discharged from cheese production). Better performance of continuous EC treatment reported by Un et al. (2014) may be due to the iron electrode and whey wastewater characteristics. Furthermore, important design parameters for the continuous reactors such as steady state time (tS), mass transfer coefficient (km) and kinetic parameters, and an important operating cost parameter, energy consumption, were not reported by Un et al. (2014) and Benazzi et al. (2016).
Table 7. Reported studies of electrochemical treatment of dairy wastewater
S. No. Wastewater Reactor Electrode used Result References 1. Real Batch Aluminium COD removal=87% Sharma (2014) 2. Real Batch Aluminium and Iron COD removal=79.2% Yavuz et. al. (2011) 3. Cheese whey Continuous Iron COD removal=86.4% Un et al. (2014) 4.
Synthetic Continuous Aluminium COD removal=69% TOC removal= 65%
Benazzi et. al. (2016)
5. Real Continuous Aluminium
COD removal=71.21% Energy consumed= 4.32 kWh/kg of COD removed
Present study
0
500
1000
1500
2000
2500
0 30 60 90 120 150 180
CO
DR
t
Elapsed time (t), min
30 cal 60 cal90 cal 120 cal150 cal
Residence Time, τ (min)
Kumari et al./Environmental Engineering and Management Journal 18 (2019), 6, 1219-1230
1228
In the present study, tS, km, k and specific
energy consumed at optimum parameters were studied and found to be 50 min, 18.1 x 10⁻⁶ m/s, 0.156 min-1 and 4.32 kWh/kg of COD removed. In comparison to continuous EC treatment, higher COD removal has been reported in batch EC reactor.
Sharma (2014) and Yavuz et al. (2011) reported 87% and 79.2% of COD removal in batch EC treatment. However, the removed COD in the present study was found to be 1994 mg/L, while it was only 930 mg/L and 1228 mg/L in studies reported by Sharma (2014) and Yavuz et al. (2011), respectively. Furthermore, experiments were also conducted at optimized set of process parameters (pHi = 4.5, τ= 141 min; t= 52min) to see the treatment performance without adding the NaCl.
The percentage of COD removal (Y1) and specific energy consumed (Y2) were observed very poor in comparison to the treatment with NaCl, being 30.2% and 25.13 kWh/kg of COD removed. 4. Conclusions
The following conclusions were drawn from the present study:
Effect of process parameters; pHi, residence time (τ) and elapsed time (t) on the %COD removal (Y1) and specific energy consumed (Y2) for real dairy wastewater by continuous EC process were studied and optimized successfully.
At optimum set of process parameters (pHi = 4.5, τ= 141 min; t= 52min) corresponding responses Y1 and Y2, advocated by RSM and actual experiments conducted, were 67% and 4.62; 71.21% and 4.32 kWh/kg of COD removed, respectively.
Both the mechanisms, electrocoagulation and electro-oxidation, were involved in removing COD. At highly acidic pHi values, Al3+ and various hydrolyzed species; Al(OH)2+, Al(OH)2
+ etc. removed COD by electrocoagulation method, while, at highly basic pHi, ClO─ ions, H2O2 and •OH radicals indirectly oxidized the COD.
Increased residence time (τ) reduced achieved steady state time (tS), and for all the τ > 60 min, steady state time (tS) was observed at t ≈50 min.
From the kinetic study, rate constant (k) was found to increase with increasing τ value. It was also observed that the COD removal is limited by τ at its lower values, while at higher τ values maximum removable COD limits the treatment.
From the disposal point of view, treated dairy wastewater will require further treatment by other physico-chemical and biological method to remove the remaining COD, BOD, TN and total solids.
Acknowledgement The authors would like to acknowledge Thapar University, Patiala, Punjab, India, for the financial support to conduct this research through Seed Grant Project programme under the grant TU/DORSP/57/708.
References Arvanitoyannis I.S., (2006), Current strategies for dairy
waste management: A review, Critical Reviews in Food Science and Nutrition, 46, 379-390.
Barman G., (2016), Max-min desirability function approach to optimize multiple response optimization problems by honey bee colony strategy, Journal of Computer and Mathematical Sciences, 7, 328-335.
Benazzi T.L., Di Luccio M., Dallago R.M., Steffens J., Mores R., Do Nascimento M.S., Krebs J., Ceni G., (2016), Continuous flow electrocoagulation in the treatment of wastewater from dairy industries, Water Science and Technology, 73, 1418-1425.
Bensadok K., Hanafi N.E., Lapicque F., (2011), Electrochemical treatment of dairy effluent using combined Al and Ti/Pt electrodes system, Desalination, 280, 244-251.
Borbón B., Oropeza-Guzman M.T., Brillas E., Sirés I., (2014), Sequential electrochemical treatment of dairy wastewater using Al and DSA-type anodes, Environmental Science and Pollution Research, 21, 8573-8584.
Castillo S., Zapico A., Doubrovine N., Lafforgue C., Fonade C., (2007), Study of a compact bioreactor for the in-line treatment of dairy wastewaters: case of effluents produced on breeding farms, Desalination, 214, 49-61.
Chen G., (2004), Electrochemical technologies in wastewater treatment, Separation and Purification Technology, 38, 11-41.
Chen W., Liu J., (2012), The possibility and applicability of coagulation-MBR hybrid system in reclamation of dairy wastewater, Desalination, 85, 226-231.
Deborde M., Von Gunten U., (2008), Reactions of chlorine with inorganic and organic compounds during water treatment- Kinetics and mechanisms: A critical review, Water Research, 42, 13-51.
Demirel B., Yenigun O., Onay T.T., (2005), Anaerobic treatment of dairy wastewaters: a review, Process Biochemistry, 40, 2583-2595.
Duan J., Gregory J., (2003), Coagulation by hrdrolysing metal salts, Advances in Colloid and Interface Science, 475, 100-102.
Frappart M., Akoum O., Ding L.H., Jaffrin M.Y., (2006), Treatment of dairy process waters modelled by diluted milk using dynamic nanofiltration with a rotating disk module, Journal of Membrane Science, 282, 465-472.
Grasshoff A., (1997), Fouling and Cleaning of Heat Exchanges, Bulletin of the IDF, IDF, Brussels, 328, 32-44.
Hepsen R., Kaya Y., (2012), Optimization of Membrane Fouling Using Experimental Design: An Example from Dairy Wastewater Treatment, Industrial & Engineering Chemistry Research, 51, 16074-16084.
Körbahti B.K., Tanyolac A., (2003), Continuous electrochemical treatment of phenolic wastewater, Water Research, 37, 1505-1514.
Körbahti B.K., Tanyolac A., (2009), Continuous electrochemical treatment of simulated industrial textile wastewater from industrial components in a tubular reactor, Journal of Hazardous Material, 170, 771-778.
Kumar M., Anto Ponselvan F.I., Malviya J.R., Srivastava V.C., Mall I.D., (2009), Treatment of bio-digester effluent by electrocoagulation using iron electrodes, Journal of Hazardous Material, 165, 345-352.
Dairy wastewater treatment in continuous stirred tank electrochemical reactor (CSTER)
1229
Kushwaha J.P., Srivastava V.C., Mall I.D., (2010a), Treatment of dairy wastewater by inorganic coagulants: parametric and disposal studies, Water Research, 44, 5867-5874.
Kushwaha J.P., Srivastava V.C., Mall I.D., (2010b), Organics removal from dairy wastewater by electrochemical treatment and residue disposal, Separation and Purification Technology, 76, 198-205.
Kushwaha J.P., Srivastava V.C., Mall I.D., (2010c), Treatment of dairy wastewater by commercial activated carbon and bagasse fly ash: Parametric, kinetic and equilibrium modelling, disposal studies, Bioresource Technology, 101, 3474-3483.
Kushwaha J.P., Srivastava V.C., Mall I.D., (2011a), An overview of various technologies for the treatment of dairy wastewaters, Critical Reviews in Food Science and Nutrition, 51, 442- 452.
Kushwaha J.P., Srivastava V.C., Mall I.D., (2011b), Studies on electrochemical treatment of dairy wastewater using aluminum electrode, AIChE Journal, 57, 2589-2598.
Lin S.H., Shyu C.T., Sun M.C., (1998), Saline wastewater treatment by electrochemical method, Water Research, 32, 1059-1066.
Lucas M.S., Peres J.A., (2009), Removal of COD from olive mill wastewater by Fenton s reagent: Kinetic study, Journal of Hazardous Material, 168, 1253-1259.
Maiti S., Mishra I.M., Bhattacharya S.D., Joshi J.K., (2011), Removal of oil from oil-in-water emulsion using a packed bed of commercial resin, Colloids and Surfaces A: Physicochemical and Engineering Aspects, 389, 291-298.
Marquardt D.W., (1963), An algorithm for least-squares estimation of nonlinear parameters, Journal of the Society for Industrial and Applied Mathematics, 11, 431-441.
Mohseni-Bandpi A., Bazari H., (2004), Biological treatment of dairy wastewater by sequencing batch reactor, Iranian Journal of Environmental Health Science and Engineering, 1, 65-69.
Myers R.H., Montgomery D.C., (1995), Response Surface Methodology: Process and Product Optimization Using Designed Experiments, John Wiley & Sons, Inc.: Hoboken, New Jersey.
Passeggi M., Lopez I., Borzacconi L., (2009), Integrated anaerobic treatment of dairy industrial wastewater and sludge, Water Science and Technology, 59, 501-506.
Pletcher D., Walsh F.C., (1990), Industrial Electrochemistry, 2nd Edition, Chapman and Hall, USA.
Qasim W., Mane A.V., (2013), Characterization and treatment of selected food industrial effluents by coagulation and adsorption techniques, Water Resources and Industry, 4, 1-12.
Rakić T., Kasagić-Vujanović I., Jovanović M., Jančić- Stojanović B., Ivanović D., (2014), Comparison of full factorial design, central composite design, and box-behnken design in chromatographic method development for the determination of fluconazole and its impurities, Analytical Letters, 47, 1334-1347.
Rao M., Bhole A.G., (2002), Removal of organic matter from dairy industry wastewater using low-cost adsorbents, Journal of Indian Chemical Engineering Section A, 44, 25-28.
Rusten B., Lundar A., Eide O., Odegaard H., (1993), Chemical pretreatment of dairy waste-water, Water Science and Technology, 28, 67-76.
Sangal V.K., Kumar V., Mishra I.M., (2013a), Optimization of a divided wall column for the separation of C4-C6 normal paraffin mixture using Box-Behnken design, Chemical Industries and Chemical Engineering Quarterly, 19, 107-119.
Sangal V.K., Mishra I.M., Kushwaha J.P., (2013b), Electrocoagulation of soluble oil wastewater: Parametric and kinetic Study, Separation Science and Technology, 48, 1062-1072.
Sangal V.K., Kumar V., Mishra I.M., (2014), Process parametric optimization of a divided wall distillation column, Chemical Engineering Communication, 201, 72-87.
Sarkar B., Chakrabarti P.P., Vijaykumar A., Kale V., (2006), Wastewater treatment in dairy industries - possibility of reuse, Desalination, 195, 141-152.
Selmer-Olsen E., Ratanweera H.C., Pehrson R., (1996), A novel treatment process for dairy wastewater with chitson produced from shrimp-shell waste, Water Science and Technology, 11, 33-40.
Sharma D., (2014), Treatment of dairy waste water by electro coagulation using aluminum electrodes and settling, filtration studies, International Journal of Chemical Technology and Research, 6, 591-599.
Singh S., Srivastava V.C., Mall I.D., (2013), Mechanism of Dye Degradation during Electrochemical Treatment, Journal of Physical Chemistry C, 117, 15229-15240.
Sirianuntapiboon S., Jeeyachok N., Larplai R., (2005), Sequencing batch reactor biofilm system for treatment of milk industry wastewater, Journal of Environmental Management, 76, 177-183.
Sundarapandiyan S., Raju G.B., Chandrasekaran B., Saravanan P., (2018), Removal of organic materials from tannery wastewater containing ammonia for reuse using electro-oxidation, Environmental Engineering and Management Journal, 17, 2157-2164.
Tchamango S., Nanseu-Njiki C.P., Ngameni E., Hadjiev D., Darchen A., (2010), Treatment of dairy effluents by electrocoagulation using aluminium electrodes, Science of the Total Environment, 408, 947-952.
Thakur C., Srivastava V.C., Mall I.D., (2009), Electrochemical treatment of a distillery wastewater: Parametric and residue disposal study, Chemical Engineering Journal, 148, 496-505.
Trinidad P., Walsh F., Gilroy D., (1998), Conversion expressions for electrochemical reactors which operate under mass transport controlled reaction conditions, Part I: Batch Reactor, PFR and CSTR, International Journal of Engineering Education, 14, 431-441.
Un U.T., Kandemir A., Erginel N., Ocal S.E., (2014), Continuous electrocoagulation of cheese whey wastewater: An application of Response Surface Methodology, Journal of Environmental Management, 146, 245-250.
Vourch M., Balannec B., Chaufer B., Dorange G., (2005), Nanofiltration and reverse osmosis of model process waters from the dairy industry to produce water for reuse, Desalination, 172, 245-256.
Vourch M., Balannec B., Chaufer B., Dorange G., (2008), Treatment of dairy industry wastewater by reverse osmosis for water reuse, Desalination, 219, 190-202.
Walsh F.C., (1993), A First Course in Electrochemical Engineering, The Electrochemical Consultancy, Romsey, UK.
Kumari et al./Environmental Engineering and Management Journal 18 (2019), 6, 1219-1230
1230
Wang M.Z., Cao W., Wu Y., Zhou H.D., Li B.M., Lu H.F., (2017), Electrochemical disinfection of effluents from poultry waste anaerobic digestion, Environmental Engineering and Management Journal, 16, 329-335.
Yavuz Y., Öcal E., Koparal A.S., Öǧütveren U.B., (2011), Treatment of dairy industry wastewater by EC and EF processes using hybrid Fe-Al plate electrodes, Journal
of Chemical Technology and Biotechnology, 86, 964-969.
Zidane F., Drogui P., Lekhlif B., Bensaid J., Blais J.F., Belcadi S., Kacemi K.E., (2008), Decolourization of dye-containing effluent using mineral coagulants produced by Electrocoagulation, Journal of Hazardous Material, 155, 153-163.