damage characterization of coal … sanire and isrm 6th international symposium on ground support in...
TRANSCRIPT

SAIMM, SANIRE and ISRM
6th
International Symposium on Ground Support in mining and civil engineering construction
Esther Kahlen
Page 369
DAMAGE CHARACTERIZATION OF COAL MEASURE ROCKS UNDER
UNIAXIAL COMPRESSION
Esther Kahlen and Michael Alber
Engineering Geology Group
Ruhr University Bochum, Germany
ABSTRACT
The identification of burst-prone rock layers is always difficult. By the application of
different testing techniques brittle rock layers in a mine in southwest Germany have been
identified. Especially the use of acoustic emission monitoring during uniaxial testing has
proven very useful. The combination of different fracture stages identified from stress-strain
diagrams and cumulative AE curves show differences in the fracture behavior of coal
measure rocks. A further interpretation of the acoustic emission data sets even allows
distinguishing between differently behaving rock types by AE signatures. The use of this
testing technique is a benefit to the identification of brittle rocks.
1. INTRODUCTION
Mining induced seismicity is a worldwide phenomenon associated with deep mining. In
southwest Germany the exploitation of Carboniferous coal deposits by the longwall mining
method extends up to 1500 m below surface. For several years the area is being monitored for
induced earthquakes that can be traced back to mining activities (Uhl et al. 2004). Recently
many seismic events with local magnitude ML> 2.0 have been observed. Common theories
such as published by Hasegawa et al. (1989) or Whittles et al. (2007) do not explain the
observed seismic events which have been located some 100 m above and 250 m in front of
the face. As the reason for these events is still unknown, a comprehensive mechanical testing
has been executed on samples from the vicinity of the seam. The goal of testing was to
identify brittle rocks that may be responsible for the seismic events.
The intention behind the laboratory testing was to find some properties that are common in
fast and violently failing rock supposedly representing the seismogenic strata. If possible,
these laboratory tests should be easy to carry out, be affordable and seismogenic rocks should
be easily recognizable. Towards this goal ultrasonic testing, uniaxial loading, and acoustic
emission recording were employed. This paper reports on some results of the research done to
date.
2 GEOLOGICAL SETTING
The Saar-Nahe Basin in SW Germany is an intermontane sedimentary basin filled with
fluvial and lacustrine Carboniferous and Permian sediments (Stollhofen1998). The mine,
situated at the southern rim of the basin, exploits hard coal from a depth of overburden of
some 1500 m. The original sedimentary cover was 2110 m thicker than at the present day and
SAIMM, SANIRE and ISRM
6th
International Symposium on Ground Support in mining and civil engineering construction
Esther Kahlen
Page 370
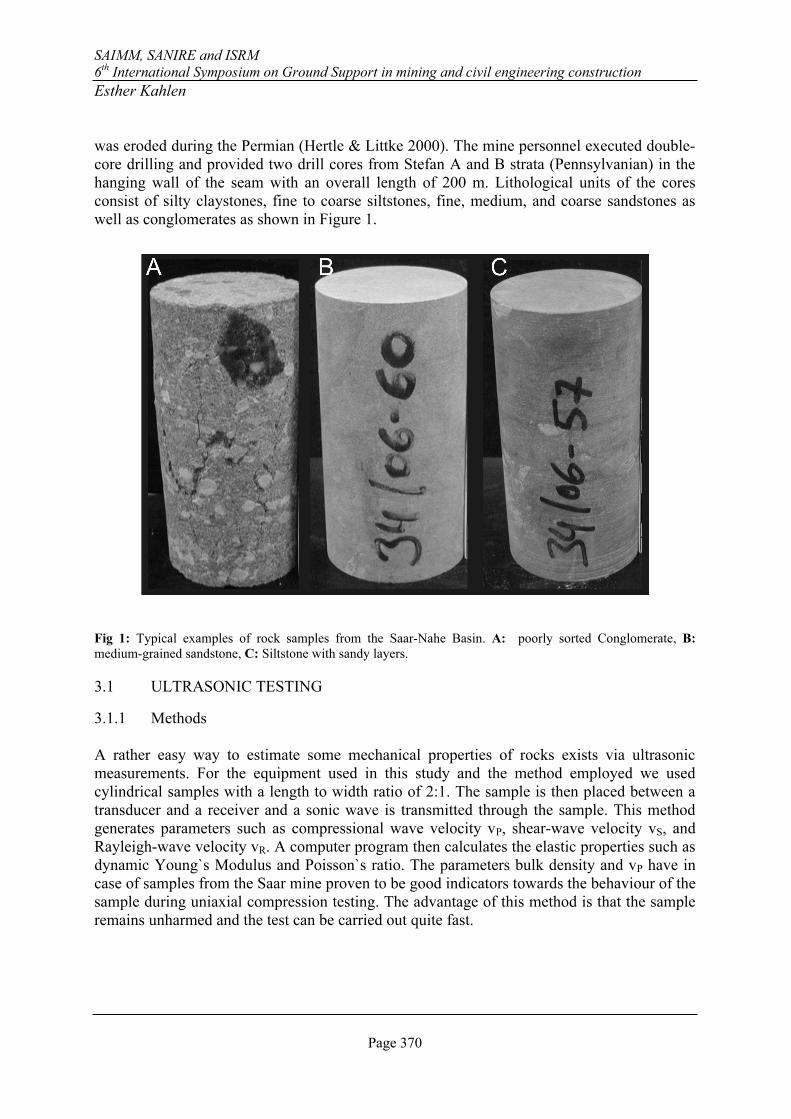
was eroded during the Permian (Hertle & Littke 2000). The mine personnel executed double-
core drilling and provided two drill cores from Stefan A and B strata (Pennsylvanian) in the
hanging wall of the seam with an overall length of 200 m. Lithological units of the cores
consist of silty claystones, fine to coarse siltstones, fine, medium, and coarse sandstones as
well as conglomerates as shown in Figure 1.
Fig 1: Typical examples of rock samples from the Saar-Nahe Basin. A: poorly sorted Conglomerate, B:
medium-grained sandstone, C: Siltstone with sandy layers.
3.1 ULTRASONIC TESTING
3.1.1 Methods
A rather easy way to estimate some mechanical properties of rocks exists via ultrasonic
measurements. For the equipment used in this study and the method employed we used
cylindrical samples with a length to width ratio of 2:1. The sample is then placed between a
transducer and a receiver and a sonic wave is transmitted through the sample. This method
generates parameters such as compressional wave velocity vP, shear-wave velocity vS, and
Rayleigh-wave velocity vR. A computer program then calculates the elastic properties such as
dynamic Young`s Modulus and Poisson`s ratio. The parameters bulk density and vP have in
case of samples from the Saar mine proven to be good indicators towards the behaviour of the
sample during uniaxial compression testing. The advantage of this method is that the sample
remains unharmed and the test can be carried out quite fast.

SAIMM, SANIRE and ISRM
6th
International Symposium on Ground Support in mining and civil engineering construction
Esther Kahlen
Page 371
3.1.2 Results
The dynamic parameters proved to be good indicators of how the rock will behave under
uniaxial loading. Especially bulk density, together with compressional wave velocity vP may
be used to delineate rock type of very brittle behavior and violent failure behavior. A trend
towards a group of very brittle behaving rocks which fail violently is discussed later.
However, the use of ultrasonic measurements assumes isotropic rock properties which are
often not the case with sedimentary rocks. In this case of coal measure rocks there exists
anisotropic features such as interlayering of fine-grained sandstones with siltstones and
similar. For those strongly anisotropic rocks the calculated dynamic Young`s Moduli are way
off the reasonable range due to the distorted travel paths of the emitted wave which led to
very low P- and S-wave results. Additionally, the dynamic Young`s Modulus calculated from
the dilatational wave was also far too low compared to the static one derived from the stress-
strain curve from uniaxial testing. The very brittle rocks with sometimes violent behavior in
the post peak area have some common rock properties as shown in Table 1. However, a few
anisotropic rocks with lower property values than those from Table 1 also showed very brittle
behavior.
Property Range of values
Bulk density ρ [g/cm³] 2,67-2,8
Compressive wave velocity vp [km/s] 4,5-5,3
Dynamic Young`s modulus E [GPa] 38-59
Static Young`s modulus E [GPa] 20,7-25,6
Uniaxial compressive strength σc [MPa] 65-116
Tab. 1: Summary of mechanical properties of very brittle rocks derived from different testing approaches.
3.2 UNIAXIAL TESTING
3.2.1 Methods
From the drill cores from the mine numerous cylindrical samples for compressive testing
were prepared following the ISRM suggested methods (ISRM 1981). Uniaxial compressive
testing is probably the most used method to determine mechanical properties of rocks. It is
however, time consuming, leads to the destruction of the sample and the properties strongly
depend on the loading system and loading method used.
Uniaxial testing was carried out with a servo-controlled MTS Test-Star system using a
TestStar IIm controller. The tests were executed according to the ISRM suggested method
(Fairhurst & Hudson 1999). The sample was first loaded under axial strain control with 10-5
mm/mm/s. One unloading cycle was carried out after the sample had reached the elastic phase
of deformation. After the reload, the control was switched to lateral strain with a rate of 10-5
mm/mm/s for better control of the possible fast and violent failure process in the post peak
area.

SAIMM, SANIRE and ISRM
6th
International Symposium on Ground Support in mining and civil engineering construction
Esther Kahlen
Page 372
3.2.2 Results
Some 90 rock samples consisting of claystones, siltstones, sandstones and conglomerates
have been tested, exhibiting very different failure behaviors. Few samples showed an
explosive behavior during the final moments of uniaxial testing. This rapid and often violent
loss of strength could not be avoided by the lateral strain control. This behavior is hitherto
termed very brittle and includes the following rock types:
(i) siltstones and fine grained sandstones,
(ii) interbedded sandstones with silt lenses and
(iii) a few of the medium grained sandstones.
It is assumed that the violent and sudden failure originated from thin and fine-grained
sedimentary layers within the samples. These layers react with a very small lateral strain upon
axial loading, thus prohibiting stable fracture propagation within the other layers. This
“internal confinement” led finally to the in a ductile transition. In contrast, the samples from
massive sandstone layers behaved all rather docile. Figure 2 shows the stress-strain curves of
a very brittle and a ductile rock specimen under axial compression in lateral strain control.
Fig. 2: Combined stress-strain diagram for two very differently behaving samples. Black line: Slow failing
conglomerate with a low Young`s modulus, undergoing severe deformation. Gray line: Fast failing brittle
siltstone with a noticeably higher Young´s modulus.
The fast failing brittle rocks showed high uniaxial compressive strength between 65 and
116 MPa. The modulus of elasticity of these sedimentary rocks range from 20.7-25.6 GPa.
About 10% of the tested specimen failed in a violent way.
SAIMM, SANIRE and ISRM
6th
International Symposium on Ground Support in mining and civil engineering construction
Esther Kahlen
Page 373
3.3 ACOUSTIC EMISSION MONITORING
3.3.1 Methods
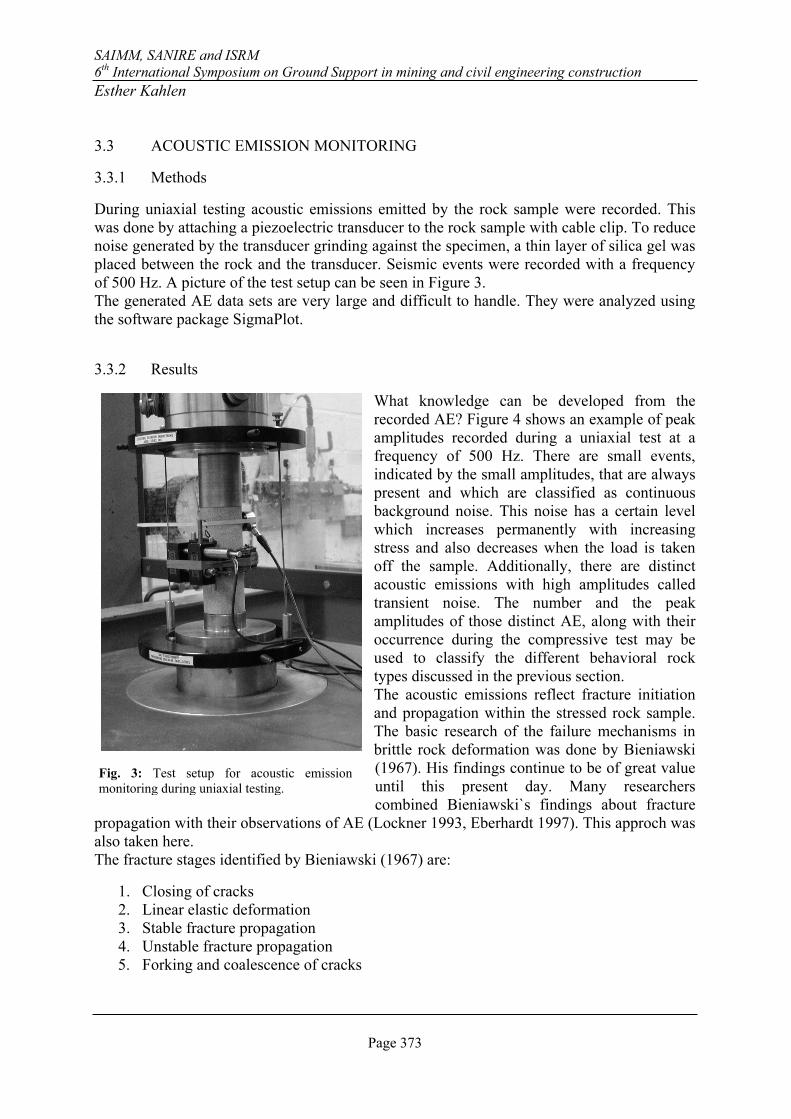
During uniaxial testing acoustic emissions emitted by the rock sample were recorded. This
was done by attaching a piezoelectric transducer to the rock sample with cable clip. To reduce
noise generated by the transducer grinding against the specimen, a thin layer of silica gel was
placed between the rock and the transducer. Seismic events were recorded with a frequency
of 500 Hz. A picture of the test setup can be seen in Figure 3.
The generated AE data sets are very large and difficult to handle. They were analyzed using
the software package SigmaPlot.
3.3.2 Results
What knowledge can be developed from the
recorded AE? Figure 4 shows an example of peak
amplitudes recorded during a uniaxial test at a
frequency of 500 Hz. There are small events,
indicated by the small amplitudes, that are always
present and which are classified as continuous
background noise. This noise has a certain level
which increases permanently with increasing
stress and also decreases when the load is taken
off the sample. Additionally, there are distinct
acoustic emissions with high amplitudes called
transient noise. The number and the peak
amplitudes of those distinct AE, along with their
occurrence during the compressive test may be
used to classify the different behavioral rock
types discussed in the previous section.
The acoustic emissions reflect fracture initiation
and propagation within the stressed rock sample.
The basic research of the failure mechanisms in
brittle rock deformation was done by Bieniawski
(1967). His findings continue to be of great value
until this present day. Many researchers
combined Bieniawski`s findings about fracture
propagation with their observations of AE (Lockner 1993, Eberhardt 1997). This approch was
also taken here.
The fracture stages identified by Bieniawski (1967) are:
1. Closing of cracks
2. Linear elastic deformation
3. Stable fracture propagation
4. Unstable fracture propagation
5. Forking and coalescence of cracks
Fig. 3: Test setup for acoustic emission
monitoring during uniaxial testing.

SAIMM, SANIRE and ISRM
6th
International Symposium on Ground Support in mining and civil engineering construction
Esther Kahlen
Page 374
These five fracture stages are somewhat difficult to identify when using stress strain curves of
the sedimentary rocks under investigation. Figure 5 shows axial stress vs. axial strain and
volumetric strain, respectively. Three fracture stages may be identified with these curves:
(i) closure of microcracks, denoted by the flat stress strain curve.
(ii) beginning of the linear elastic range during the tests, indicating stable facture
propagation, and
(iii) the onset of unstable fracture propagation as seen by the reversal of the slope of
the volumetric strain curve.
Fig. 4: Plot of peak amplitudes (dB) and axial stress (MPa) against run time recorded during a uniaxial test. The
figure shows all AE emitted during an uniaxial loading test.
It may be however difficult to establish those fracture stages depending on the test control
mode, the accuracy of the equipment used and on the rock type. The analyses of acoustic
emissions may be used for easier identification of some fracture stages. The compressive test
from Figure 5 is re-plotted in Figure 6 showing additionally the cumulative acoustic
emissions. Those are computed by counting the events with amplitudes higher than the
background noise and summing them up.

SAIMM, SANIRE and ISRM
6th
International Symposium on Ground Support in mining and civil engineering construction
Esther Kahlen
Page 375
Fig. 5: Axial stress vs. axial strain/volumetric strain for a medium grained sandstone. Three different stages in
fracture behaviour were identified as discussed in the text.
Fig. 6: Axial strain vs. cumulative AE curve and axial strain vs. axial stress. The three stages identified in figure
5 correlate well with the slope of the cumulative AE curve. In stage 1 (crack closure) a large amount of AE
occur, while in stage 2 (elastic region) only a few AE are emitted. With the beginning of stage 3 (unstable crack
growth) the amount of AE increases substantially.

SAIMM, SANIRE and ISRM
6th
International Symposium on Ground Support in mining and civil engineering construction
Esther Kahlen
Page 376
With this approach the following fracture stages may be more easily identified:
• Closure of microcracks causes numerous acoustic emissions. The amount of AE
emitted during this phase depends upon rock properties such as grain size and grain
contacts, bulk density (e.g. porosity) and vp.
• A stage, during which the deformation is purely elastic and no AE are recorded, is not
present with this rock.
• Stable fracture propagation with rather few AE may be clearly delineated from
cumulative AE plot. It will be shown later that the AE characteristics in this stage may
be used to generally classify different behavioral rock types.
• The beginning of unstable fracture propagation (Stage 4 after Bieniawski 1967) is
marked by an increase in AE. In some fine grained brittle rocks, especially siltstones,
the onset of this stage coincides with the peak strength and violent fast fracture
propagation leads to the disintegration of the sample.
From the analyses of the AE signatures of all 90 tests is was found that with slow failing
samples more acoustic emissions with low dB values occur than in fast failing ones. On the
other hand fast failing rocks exhibit some values with very high peaks which mark the
fracture process, e.g. stress drop from peak strength to some lower value. Generally, fast
failing samples exhibit less AE than slow failing ones.
These observations are schematically shown in Figures 7 and 8. Figure 7 shows for two
different rock types, a medium grained sandstone and a siltstone, the cumulative AE vs. axial
strain and axial stress vs. axial strain, respectively. The medium grained rock reacts upon
loading with many AE of mainly low amplitudes which occur throughout the test. This
indicates continuous fracture initiation and propagation so that the sample fails slowly and
non-violently. The fine grained siltstone shows after the initial closure of fracture few
acoustic emissions, indicating that few fractures are formed during the main part of the test.
Finally the stresses are released by a few fast propagating fractures which emit few AE with
high amplitudes.
Figure 8 depicts two histograms reflecting the frequency of the AE events ordered after their
amplitude. The slowly failing rock shows much more AE events, but only a few in the high
amplitude range over 30 dB. The fast failing siltstone has rather few AE events, but a
significant amount in the high amplitude range over 50 dB, reflecting the sudden release of
energy when failing violently. These findings may be used to delineate behavioral rock types
with help of the AE signatures of the different specimens.

SAIMM, SANIRE and ISRM
6th
International Symposium on Ground Support in mining and civil engineering construction
Esther Kahlen
Page 377
Fig. 7: Combined plot of stress strain-diagrams (dotted lines) and cumulative AE against axial strain (solid
lines) of two different samples. The two specimen have similar Young`s moduli, but showed completely
different failure behavior. Black lines: slow failing medium grained sandstone with many AE occuring during
the entire test. Gray lines: Very brittle siltstone with visibly less AE. Note that in the fast failing sample (gray)
no AE occur before the fracture.
Fig. 8: Histograms of peak amplitudes from two rock samples with significantly different AE. Black columns:
Medium grained sandstone specimen with an overall large number of low amplitudes and hardly any high
amplitudes. Gray columns: Brittle siltstone with a relatively small number of low peak amplitudes and a few
high amplitudes between 50 and 60 dB as result of the final fracture.

SAIMM, SANIRE and ISRM
6th
International Symposium on Ground Support in mining and civil engineering construction
Esther Kahlen
Page 378
4. CONCLUSION
What benefits have these results for ground control in a coal mine?
The tests show that some brittle rocks occur in the surrounding strata of the mining area and
that they are clearly identifiable by uniaxial testing. But it is also possible to identify a larger
range of possible dangerous rock layers by more easily determining parameters such as vp,
bulk density, and a dynamic modulus of elasticity, allowing therefore the mine management
to implement an inexpensive test program and to take counteractive measures.
The acoustic emission monitoring during the uniaxial testing is also a good indicator if the
samples tend to burst rather than to fail slowly. A classification of 3 fracture stages by the
cumulative curve of AE allows identification of the significant phases of the fracture process,
like unstable crack propagation. It is even possible to distinguish between different rock types
by cumulative AE patterns and peak amplitude histograms.
The very brittle rocks from the Saar-Nahe Basin tended to have no AE output before
imminent failure while slow failing ones tended to generate a fair amount of AE before
reaching their peak strength.
The use of acoustic emissions during uniaxial testing therefore represents therefore a great
step towards classification of damage characterization of coal measure rocks.
REFERENCES
BIENIAWSKI, Z.T. Mechanism of Brittle Fracture of Rock Part I, Int. J. Rock Mech. Min.
Sci. & Geomech. Abstr., 1967, Vol. 4, pp. 395-406.
EBERHARDT, E., STEAD, D.STIMPSON, D. & READ, R.S. Changes in acoustic event
properties with progressive fracture damage, Int. J. Rock Mech. Min Sci., 1997, 34(3-4),
Paper No.071B.
FAIRHURST, C.E. & HUDSON, J.A. Draft ISRM suggested method for the complete stress-
strain curve for intact rock in uniaxial compression, Int. J. Rock Mech. Min. Sci., 1999, Vol.
36(3), pp. 281-289.
HASEGAWA, H.S., WETMILLER, R.J., & GENDZWILL, D.J. Induced Seismiscity in
Mines in Canada – An Overview. , S.J. Gibowicz (ed.), Seismicity in Mines, 1989, pp. 421-
453.
HERTLE, M. & LITTKE, R. Coalification pattern and thermal modelling of the Permo-
Carboniferous Saar-Basin (SW-Germany). – Int. J. Coal Geol., 2000, 42:273-296.
ISRM Suggested Methods for Rock Characterization, Testing, and Monitoring, E.T. Brown
(Ed.), 1981, Pergamon, Oxford, 211p.
LOCKNER, D. The role of acoustic emission in the study of rock fracture., Int. J. Rock Mech.
Min. Sci. & Geomech. Abstr., 1993, Vol. 30(7), pp. 883-899.

SAIMM, SANIRE and ISRM
6th
International Symposium on Ground Support in mining and civil engineering construction
Esther Kahlen
Page 379
STOLLHOFEN, H. Facies architecture variations and seismogenic structures in the
Carboniferous-Permian Saar-Nahe Basin (SW Germany): Evidence for extension-related
transfer fault activity, Sedimentary Geology, 1998, Vol. 119, pp. 47-83.
UHL, O., POLYSOS, N., FRITSCHEN, R., LOSKE, B., SROKA, A. Seismologische und geologische
Untersuchungen der Erderschütterungen des Bergwerks Ensdorf. – Tagungsband zur 44.
Wissenschaftlichen Fachtagung des Deutschen Markscheider Vereins e.V., 2004, Bochum
(in German).
WHITTLES, D.N., REDDISH, D. J. & LOWNDES, I. S. The development of a coal
measure classification (CMC) and its use for prediction of geomechanical parameters. – Int.
J. Rock Mech. Min. Sci., 2007, Vol. 44(4), pp. 496-513.

SAIMM, SANIRE and ISRM
6th
International Symposium on Ground Support in mining and civil engineering construction
Esther Kahlen
Page 380