dapresy pro 2017 mid-year release pro 2017 mid-year... · technical release notes dapresy pro 2017...
TRANSCRIPT

www.dapresy.com Technical Release Notes Dapresy Pro 2017 Mid-Year Release Page 1 of 70
Dapresy Pro 2017 Mid-Year Release

www.dapresy.com Technical Release Notes Dapresy Pro 2017 Mid-Year Release Page 2 of 70
Index Dapresy Pro 2017 Mid-Year Release ............................................................................................................. 1
1 – Introduction ............................................................................................................................................ 5
2 - Overview .................................................................................................................................................. 6
3 – Storyteller and Form Updates ................................................................................................................. 9
3.1 New Layout Settings Panel & moved functions -show all slides, show PPT as slide background etc.
................................................................................................................................................................ 10
3.2 SVG Image Format Support............................................................................................................... 12
3.3 Adjustable Slide Size ......................................................................................................................... 12
3.3.1 Define the Slide Size - Report Level Setup ................................................................................. 13
3.3.2 Define the Slide Size - Slide Level Setup .................................................................................... 16
3.3.3 PPT Templates (.pot files) .......................................................................................................... 17
3.4 Device Filtering.................................................................................................................................. 17
3.4.1 Setup of Device Filter ................................................................................................................. 17
3.4.2 Fine-Tune the Ranges for Small, Medium and Large Screens .................................................... 18
3.4.3 Device Filtering Applied to Different User Roles ....................................................................... 19
3.5 PDF Export and Definition of Export Formats ................................................................................... 19
3.5.1 Storyteller................................................................................................................................... 19
3.5.2 Forms ......................................................................................................................................... 20
3.6 Slide Background Mode .................................................................................................................... 21
3.7 New Dynamic Text Items - Slide Number, Date, Slide Name, etc. .................................................... 22
3.8 Default Font ...................................................................................................................................... 23
3.9 “All” Option in Questions, Answers and Filter Boxes for Easier Setup and Maintenance ................ 23
3.10 Improved H-Filter Setup .................................................................................................................. 25
3.11 Significance Test Improvements in Storyteller Charts and Tables .................................................. 26
3.11.1 Perform Significance Test Between Series ............................................................................... 27
3.11.2 Hide Comparison Data Points .................................................................................................. 30
3.11.3 Visualize Significance Test Result with Icons ........................................................................... 31
3.11.4 Visualize Significance Test with Colored Cell Background ....................................................... 34

www.dapresy.com Technical Release Notes Dapresy Pro 2017 Mid-Year Release Page 3 of 70
3.11.5 Visualize Significance Test with Colored Values ...................................................................... 36
3.11.6 Second Set of Symbols - ↑/↓ ................................................................................................. 37
3.11.7 Definition for Starting Letter .................................................................................................... 38
3.11.8 New Significance Test; Norm/Population Significance Test .................................................... 40
4 Cross Table Tool 2.0 Updates ................................................................................................................... 45
4.1 Device Filtering.................................................................................................................................. 45
4.1.1 Setup Device Filtering ................................................................................................................ 45
4.2 Improved H-Filter Setup .................................................................................................................... 46
4.4 Visualize Significance Test with Colored Values ............................................................................... 46
4.3.1 Setup .......................................................................................................................................... 47
5 Document Archive 2.0 Updates ............................................................................................................... 49
5.1 Device Filtering.................................................................................................................................. 49
5.1.1 Setup Device Filtering ................................................................................................................ 49
5.2 Improved H-Filter Setup .................................................................................................................... 50
6 New Color Management Logic ................................................................................................................. 51
6.1 Color Template Library...................................................................................................................... 52
6.1.2 Create a New Color Template .................................................................................................... 53
6.1.3 Edit a Color Template ................................................................................................................. 61
6.1.4 Delete a Color Template ............................................................................................................ 61
6.2 Color Template in Project ................................................................................................................. 62
6.2.1 Select Template During Project Creation ................................................................................... 62
6.2.2 Change Template in Project ....................................................................................................... 63
6.2.3 Edit Color Template in Project ................................................................................................... 63
6.2.4 Export Color Template from Project Back to Library ................................................................. 64
6.3 Assigning a Placeholder to an Item (question, icon, text etc.) ......................................................... 64
6.3.1 Use of Categories in Charts ........................................................................................................ 65
6.4 Color template and Report template library .................................................................................... 66
7 Administration Pages Updates ................................................................................................................. 69
7.1 Variable Subset - Setting for Auto-Excluding New Meta Data .......................................................... 69

www.dapresy.com Technical Release Notes Dapresy Pro 2017 Mid-Year Release Page 4 of 70
7.2 Setup Improvements in Question Block-, Merged Variables- and Index Page to Automatically
Include Future Questions ........................................................................................................................ 70
7.2.1 Setup .......................................................................................................................................... 70

www.dapresy.com Technical Release Notes Dapresy Pro 2017 Mid-Year Release Page 5 of 70
1 – Introduction
This document describes new and improved features in the Dapresy Pro 2017 Mid-Year Release.
If you would like to know more about these features, please contact Dapresy Global Support at:
[email protected] and they will be able to assist you.
Best Regards,
Dapresy Team
Email: [email protected]
Telephone: + 46 (0)76 019 89 42

www.dapresy.com Technical Release Notes Dapresy Pro 2017 Mid-Year Release Page 6 of 70
2 - Overview The Dapresy Pro 2017 Mid-Year release contains many great improvements, which you can see in the
summary list slightly further down. Some of these key improvements are the ability to adjust the report
size to fit any device (smartphones, tablets, etc.), and the option to define in which device each report
will be shown. This will allow users to tailor make reports for all different device sizes!
A new color management logic has been added to improve efficiency when setting up projects. With this
new logic, you can use your own colors in the color palettes and also connect items to specific color
placeholders instead of setting a fixed color - this makes maintenance much easier.
Below is a list of all the new features that will improve your Dapresy Pro experience. Each of these
features are described in further detail throughout this document.
Storyteller and Form
A new “Layout settings” panel has been added. The new panel has a collection of layout-related
functions which were previously spread out in many different locations
SVG images are now supported in the image object
New support allows you to define the size of the report (the slide area) by selecting from
standard sizes such as small screen, A4, PPT4:3, PPT 16:9, or set a custom size
New option to set up “device filtering,” which allows you to select which device the report will
be shown on
New support for making PDF exports
New ability to define which export abilities will be available: PPT, Excel, PDF, and Print
A new background mode for creating your own slide backgrounds/headers/footers, etc.
Updates to the Dynamic Text function in the Text object that allow you to show slide number,
date, project names, etc.
New ability to define which font will be default in new objects
Improved hierarchical filter setup, a new ability to show all nodes (Including future nodes) in a
certain level or a certain branch
Improvements in charts and tables for selecting “All” items in answers, questions, and filter
boxes.
Improvements in the significance test functionality
o New ability to perform the significance test between series
o New ability to hide the comparison data points
o New ability to show the significance test result with icons from the Icon and Shape
library (only supported in tables)
o New ability to show the significance test result with colored cell backgrounds (only
supported in tables)

www.dapresy.com Technical Release Notes Dapresy Pro 2017 Mid-Year Release Page 7 of 70
o New ability to show the significance test result with colored values (only supported in
tables)
o A second set of symbols have been added so that by default you can now select if +/- or
↓/↑ will be used to indicate if a value is significant or not.
o New ability to define the starting letter (the letters are used to indicate to which value
another value has been tested against)
o A new type of significance test has been added - “Norm/Population Z test”
Cross Table Tool 2.0
New option to set up “device filtering,” which allows you to select which device the report will
be shown on
Improved hierarchical filter setup, and a new ability to show all nodes(including future nodes) in
a certain level or a certain branch
Visualize Significance Test with Colored Values
Document Archive 2.0
New option to set up “device filtering,” which allows you to select which device the report will
be shown on
Improved hierarchical filter setup, and a new ability to show all nodes(including future nodes) in
a certain level or a certain branch
New color management logic:
o New ability to use RGB and HSL codes when defining colors as a complement to Hex
codes
o New ability to define the colors shown in the color palette in the color picker
o A new Color template logic which includes “color placeholders.” Items such as
questions, icons, chart backgrounds, etc. can be connected to a color placeholder
instead of setting fixed colors which will dramatically improve setup and maintenance
Administration Pages
Improvements have been made in Question blocks, Indexes and Merged variables. The content
of these items can now be defined by code rules. This means that variables that are added to

www.dapresy.com Technical Release Notes Dapresy Pro 2017 Mid-Year Release Page 8 of 70
the project in the future can automatically be included in, for example, an Index or a Question
block
Note: When you are logged in as an Administrator, there are some general options available such as
Contact support, Distribute and Refresh page. These options were previously integrated in the “skin”
and could occasionally negatively affect the layout.
These administrative options have now been moved to a separate administration toolbar located at the
top of the page, see the example in the image below. The new toolbar is not affected by the skin
settings, therefore the options are always visible and displayed in the same position no matter what skin
is used. Just as before, these buttons are only shown for the Administrator users, so the Report users
cannot see the new toolbar at all.
The image below shows the new administrative toolbar for general options such as ‘Distribute’ and
‘Contact support.’
www.dapresy.com Technical Release Notes Dapresy Pro 2017 Mid-Year Release Page 9 of 70
3 – Storyteller and Form Updates The following improvements have been made in the Storyteller and Form report. Each of these are
described in detail further down.
A new “Layout settings” panel has been added. The new panel has a collection of layout-related
functions which were previously spread out in many different locations
SVG images are now supported in the image object
New support allows you to define the size of the report (the slide area) by selecting from
standard sizes such as small screen, A4, PPT4:3, PPT 16:9, or set a custom size
New option to set up “device filtering,” which allows you to select which device the report will
be shown on
New support for making PDF exports
New ability to define which export abilities will be available: PPT, Excel, PDF, and Print
A new background mode for creating your own slide backgrounds/headers/footers, etc.
Updates to the Dynamic Text function in the Text object that allow you to show slide number,
date, project names, etc.
New ability to define which font will be default in new objects
Improved hierarchical filter setup, and a new ability to show all nodes (including future nodes)
in a certain level or a certain branch
Improvements in charts and tables for selecting “All” items in answers, questions, and filter
boxes.
Improvements in the significance test functionality
o New ability to perform the significance test between series
o New ability to hide the comparison data points
o New ability to show the significance test result with icons from the Icon and Shape
library (only supported in tables)
o New ability to show the significance test result with colored cell backgrounds (only
supported in tables)
o New ability to show the significance test result with colored values (only supported in
tables)
o A second set of symbols have been added so that by default you can now select if +/- or
↓/↑ will be used to indicate if a value is significant or not.
o New ability to define the starting letter (the letters are used to indicate to which value
another value has been tested against)
o A new type of significance test has been added - “Norm/Population Z test”

www.dapresy.com Technical Release Notes Dapresy Pro 2017 Mid-Year Release Page 10 of 70
3.1 New Layout Settings Panel & moved functions -show all slides, show PPT
as slide background etc.
A new Layout Settings panel has been implemented in the Storyteller and Form setup. This collects all of
the settings pertaining to the layout and export formats. Some of the settings are new, such as the
ability to select export formats or support for defining slide size. However, the Layout Settings panel also
contains previously existing settings. The list below shows the existing settings which have been moved
into the new Layout panel.
Show all slides
Hide slide navigation
Show PPT template as slide background
Chart image quality settings
The new Layout Settings panel is located in the Layout tab, as shown below. All of the new settings are
described further down in this document.
The image below shows how to enter the Layout settings panel. Simply click the highlighted option.
The following images show the new locations of settings that were previously not in the Layout settings
panel.
The image below highlights the “Show all slides” option which was previously located in the “Change
storyteller” panel.

www.dapresy.com Technical Release Notes Dapresy Pro 2017 Mid-Year Release Page 11 of 70
The image below highlights the “Hide slide navigation” option which was previously located in the ribbon
menu of the Layout tab.
The image below highlights the “Show PPT template as slide background” option which was previously
located in the ribbon menu in the Layout tab.
The image below highlights the “Chart image quality” options which was previously located in the ribbon
menu of the Layout tab.

www.dapresy.com Technical Release Notes Dapresy Pro 2017 Mid-Year Release Page 12 of 70
3.2 SVG Image Format Support
SVG images can now be uploaded to Storyteller and Form reports via the Image object. The SVG format
is the preferred image format, as it is vector based which allows images to easily resize without
becoming blurry. The size of the SVG files is also significantly smaller compared to PNG and JPEG, which
results in better performance (faster loading time) as less data volumes needs to be transferred from
the server to the user.
3.3 Adjustable Slide Size
The size of the Storyteller and Form slide can now be adjusted per report to fit different needs. For
instance, a report can be adjusted to fit the PPT 16:9 format or can be customized for smartphones. The
slide size setting is made per report, though it can also be adjusted per individual slide.
Any of the standard formats can be used, or you can enter a custom slide size. The following standard
sizes are supported:
PPT 4:3 (960x720)
PPT 16:9 (1280x720)
A4 landscape (1123x796)
A4 portrait (796x1123)
Small screen format (350x500)
Note 1: No matter what format you are using, the same report functions, objects, and behavior are
applied to all. The only exception is the ability to make PPT exports, and these are only available if any of
the PPT formats are used.
Note 2: In the previous version of Dapresy Pro, it was possible to use an A4 format which was very
limited in terms of functionality. For example, it did not support charts at all. This legacy A4 report
format has been removed and has been replaced with the new A4 format which supports the same
functionality as the standard PPT 4:3 format. The old legacy format is still available for editing in the old
projects, but no new reports of the old A4 legacy reports can be created.
NOTE 3: Most of the existing skins/themes have been adjusted to the PPT 4:3 format, so they might
have a fixed width. Therefore, they may not look great if the reports are made wider than 960 pixels.
The skin named “Dapresy_v10.0”, which you have access to, is a Dapresy styled responsive skin which
looks good in all screen and report sizes. If you want to add your own responsive skin, then it can be
ordered via support.

www.dapresy.com Technical Release Notes Dapresy Pro 2017 Mid-Year Release Page 13 of 70
The three images below show how the navigation looks across different devices when the Dapresy_v10.0
skin is used. Desktop (large screen) to the left, Tablet (medium screen) in the middle, and Smartphone
(small screen) to the right.
3.3.1 Define the Slide Size - Report Level Setup
The report level slide size can be defined in the new Layout settings panel. The image below shows the
Report Format area in the Layout Settings panel. You can either select any of the standard formats (see
first image below), or enter a custom slide size (see second image below).
The image below shows the standard formats.

www.dapresy.com Technical Release Notes Dapresy Pro 2017 Mid-Year Release Page 14 of 70
The image below shows the Custom option. When Custom is selected, you will have to enter the desired
width and height of the report.
Note 1: When you create a new Storyteller or Form, then the default report size is PPT 4:3 if the skin
(theme) applied to the project has a PPT template in 4:3 format attached. If the skin has a PPT 16:3
template attached, then the default format becomes PPT 16:9. If the skin has both a 4:3 and a 16:9
template, then the default size becomes PPT 16:9. See chapter 3.3.3 for notes about the PPT template
files.
Note 2: The standard “Small screen format” uses the size 350x500 which fits most of the small screen
devices on the market. If you would like to see the different screen size options for different devices,
then just click on the information icon, as shown in the image below.

www.dapresy.com Technical Release Notes Dapresy Pro 2017 Mid-Year Release Page 15 of 70
Note 3: When importing a slide from another report or from the Report template library, then you will
have to choose if the original slide size or if the slide size of the current report will be used. If you apply
the slide size of the current report, then some objects might be placed outside the slide area (as shown
in the second image below). You will have to manually adjust the content so that all items fit in the slide
area.
The image below shows the information that appears if you import a slide with another format.

www.dapresy.com Technical Release Notes Dapresy Pro 2017 Mid-Year Release Page 16 of 70
The image below shows what happens when you import a slide with a bigger size than the size of the
current report. The left image shows a “Small screen format” report and the middle image shows a PPT
4:3 report. When the dashboard in the 4:3 report is imported into the Small screen format report, the
result looks like the far right image. The red boarder indicates the slide size, which shows that most of
the objects are now placed outside the slide area and need to be adjusted manually.
3.3.2 Define the Slide Size - Slide Level Setup
To change the size of a specific slide, you will have to enter the “Change slide size” panel (see images
further down). The size you define in this panel will only be applied to the current slide.
The image below shows how to enter the Change slide size panel.
The image below shows the Change slide size panel.
www.dapresy.com Technical Release Notes Dapresy Pro 2017 Mid-Year Release Page 17 of 70
Note: If the report will support PPT export, then we do not recommend changing the size of a particular
slide, because the exports might look bad. For PDF exports, it does not matter as each slide can have a
different size in the PDF export.
3.3.3 PPT Templates (.pot files)
Each skin/theme has a PPT 4:3 pot file attached. If you want to use the PPT 16:9 format, then the skin
needs a 16:9 .pot file attached. As always, PPT template file updates can be done via the file manager or
ordered via the support team.
Note: The pot files for 16:9 will have “_16_9” as a suffix in the file name (example:
template_2017_16_9.pot). All pot files that don’t have “_16_9” as a suffix are treated as 4:3 templates.
3.4 Device Filtering
A new “Device filtering” logic has been added that allows you to define what device size a report will be
shown in. A common use case could be to have two versions of the same dashboard, one version is
shown for Medium and Large screen sizes (usually tablets and desktops) and another version is shown
for small screen sizes (usually smartphones).
The Device filtering logic is supported in Storyteller, Form, Cross table tool 2.0 and Document Archive
2.0.
3.4.1 Setup of Device Filter
The device filter is set up in the new Layout Settings panel. To activate the filtering, enable the “Activate
device filtering” option, as shown in the image below. When the option is enabled, you can select which
screen sizes the report will be shown.
Note: The device filtering is disabled by default. This means that a report is shown in all devices until the
device filtering is activated.
The image below shows the setup of a device filter. The report in in the image will only appear when the
user uses a medium or a large screen device (usually tablets and desktops).

www.dapresy.com Technical Release Notes Dapresy Pro 2017 Mid-Year Release Page 18 of 70
3.4.2 Fine-Tune the Ranges for Small, Medium and Large Screens
By default, Dapresy categorizes the different screen sizes as shown in the list below.
Small: screen width <= 640 pixels
Medium: screen width between 641-960 pixels
Large: screen width >= 960 pixels
Small, medium and large are typically smartphones, tablets and desktops, but not always. Specifically,
tablets come in many different screen sizes. In the image below, you will see how the most common
tablets are treated based on the ranges above. As shown, most tablets are treated as medium screens
but the Apple iPad Pro and Microsoft Surface Pro 3 are treated as large screens while Asus Nexus 7 is
treated as a small screen size.

www.dapresy.com Technical Release Notes Dapresy Pro 2017 Mid-Year Release Page 19 of 70
These ranges for small, medium and large can be fine-tuned in the Project settings page if needed.
The image below shows the Project settings page where the ranges can be adjusted.
3.4.3 Device Filtering Applied to Different User Roles
The device filtering logic is slightly different for Administrators and Report users, as an Administrator
must be able to view and make the setup for small and medium screen reports on a desktop (a large
screen).
A Report user can only see the reports that will be shown based on the device size.
By default, An Administrator will see all reports when working on a desktop (large screen). The
device filtering is only applied when viewing the project through a small or medium size device.
As the administrator sees all reports when working on a desktop, a “Device filter” can be used to only
show all small reports, large reports, and so on. Using this Device filter allows for an easier overview of
the setup.
The image below shows the device filter which is located in the new administrative toolbar. The filter
only appears if any device filtering has been enabled in the project. The Device filter is also only shown
for Administrator users and not for Report users.
3.5 PDF Export and Definition of Export Formats
3.5.1 Storyteller
Previously, a Storyteller report could be exported to PPT, Excel, and print. The export to PPT and print
were always available, but Excel could be turned on or off.

www.dapresy.com Technical Release Notes Dapresy Pro 2017 Mid-Year Release Page 20 of 70
There is now a new option to export content to a PDF. Additionally, there are new settings to allow you
to turn each export format on or off, as shown in the image below. These settings are located in the new
Layout Settings panel, and PPT and print are now the default export options for new reports.
The image below shows where to set up the export formats in the Layout Settings panel.
Note 1: The PPT option is only available if the slide size formats are PPT 4:3 or PPT 16:9.
Note 2: When exporting to PPT, a PPT .pot (template) file is always used. This adds a first page, header,
footer, and a last page. This is different from the PDF export, because the PDF is just an export of what is
shown online and does not contain any additional first/last page or footers. If you want to add any slide
numbers or footers, then you can use the new “Slide background” logic described in chapter 3.6.
3.5.2 Forms
Previously, a Form report could only be printed. Now it can also be exported to PPT and PDF. Similar to
the Storyteller, you can also decide which export formats will be available. This setting is located in the
new Layout Settings panel, and PPT and print are now the default options for new Form reports.
The image below shows where to setup the export formats.

www.dapresy.com Technical Release Notes Dapresy Pro 2017 Mid-Year Release Page 21 of 70
Note 1: The PPT option is only available if some of the slide size formats are PPT 4:3 or PPT 16:9.
3.6 Slide Background Mode
A new “Slide background mode” has been added. This is used to add objects that will be shown on every
slide such as footers, logos or shapes that are used to color the slide background.
The background objects can be shown online and in exports, or just in exports. The latter option is best
used when you want a clean, online experience but want page numbers and footers in exported
documents.
You can access the slide background via the ribbon menu, as shown in the image below. The slide
background is always empty by default. All types of objects such as charts, images and text objects can
be used in the slide background. To close the background, simply click the button shown in the second
image below.
The image below shows how to enter the slide background.
The image below shows how to close the slide background.
By default, the slide background objects appear in both online and in exports. If you only want the
background objects to appear in exported files, then you can set this up in the Layout settings panel.

www.dapresy.com Technical Release Notes Dapresy Pro 2017 Mid-Year Release Page 22 of 70
The image below shows the option to select if you only want the slide background objects to appear in
exported files and not online. This setting is only available if the report contains objects that are in the
slide background.
3.7 New Dynamic Text Items - Slide Number, Date, Slide Name, etc.
The Dynamic text function in the Text box has recently been improved. You can now automatically add
project name, report name, slide name, slide number and today’s date to the page by using the Dynamic
text objects.
These items can for example easily be used in the slide background since you just need to add them
once to get the slide number, project name etc. into each page. These new items are also great to use
when creating slide footers to be stored in the Report template library, because you don’t need to make
any manual changes when importing them to a new project!
The first image below shows how to enter the dynamic text panel. The second image below shows the
dynamic text panel.

www.dapresy.com Technical Release Notes Dapresy Pro 2017 Mid-Year Release Page 23 of 70
3.8 Default Font
A new setting is available on the project level that allows you to change the default font. The font that
you select will be used by default in all new objects in the Storyteller and Form, making for a much more
efficient setup process.
You can select the default font in the Project settings page (as shown in the image below). When a new
font is selected, it will be applied to all new objects. However, you can also choose to change the font in
all of the existing objects. This option is available when you select a new font is selected.
You can also choose whether or not the default font will be applied to new objects that are imported
from the report template library. When this option is enabled, all objects imported from the report
template library will use the default font - no matter what font they had when the objects were added
to the library. This option is enabled by default.
The image below shows where the default font settings are located in the Project Settings page.
3.9 “All” Option in Questions, Answers and Filter Boxes for Easier Setup and
Maintenance
To better manage the maintenance process when new meta data is added to a project, there is a new
www.dapresy.com Technical Release Notes Dapresy Pro 2017 Mid-Year Release Page 24 of 70
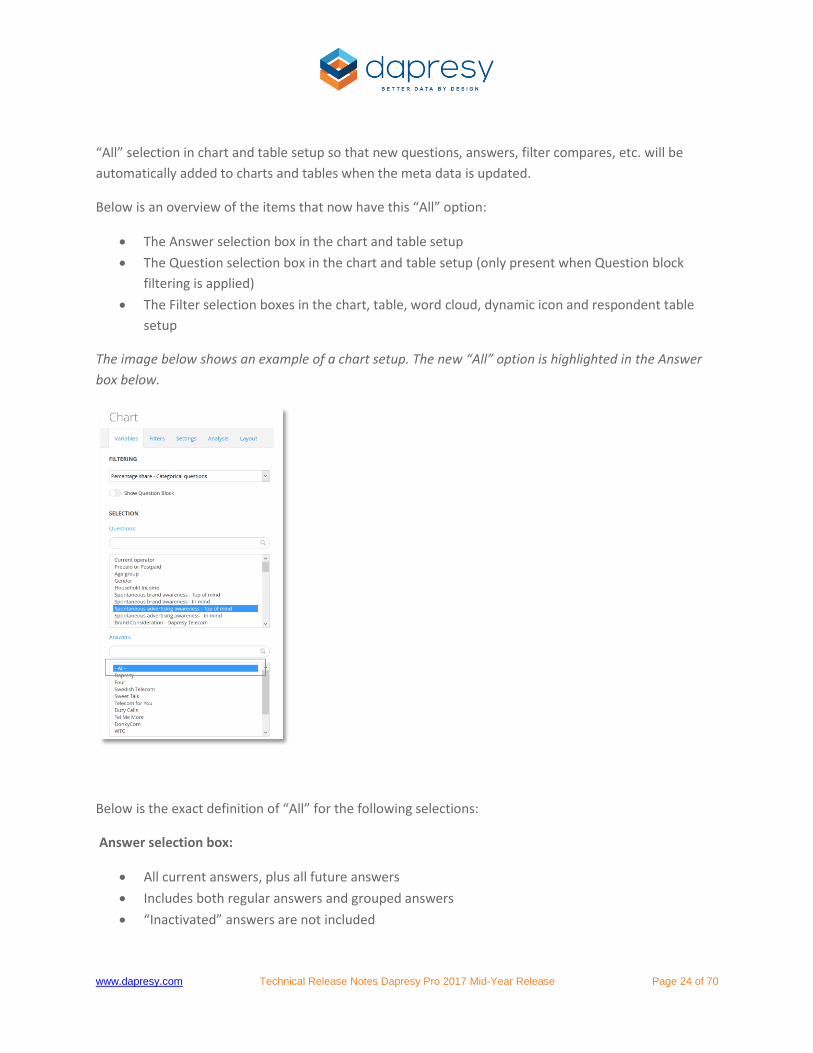
“All” selection in chart and table setup so that new questions, answers, filter compares, etc. will be
automatically added to charts and tables when the meta data is updated.
Below is an overview of the items that now have this “All” option:
The Answer selection box in the chart and table setup
The Question selection box in the chart and table setup (only present when Question block
filtering is applied)
The Filter selection boxes in the chart, table, word cloud, dynamic icon and respondent table
setup
The image below shows an example of a chart setup. The new “All” option is highlighted in the Answer
box below.
Below is the exact definition of “All” for the following selections:
Answer selection box:
All current answers, plus all future answers
Includes both regular answers and grouped answers
“Inactivated” answers are not included

www.dapresy.com Technical Release Notes Dapresy Pro 2017 Mid-Year Release Page 25 of 70
Question selection box:
All current questions, plus all future questions in the selected question block (the “All” option is
only available when Question block filtering is applied)
“Inactivated” questions are not included
Filter selection box:
All current answers in the selected filter, plus all future answers
Includes both regular answers and grouped answers
“Inactivated” answers are not included
3.10 Improved H-Filter Setup
The H-Filter setup in the Storyteller has been updated to handle future updates of the Hierarchical filter
in a more efficient way. Previously, you could manually pick which nodes would be shown in the report
or you could select the option “All nodes” which included all existing and future nodes. Two new options
have just been added: Show selected levels, and Show selected nodes + sub nodes. These are explained
in further detail below.
Based on the two new options, the following four options are now available in the H-Filter setup of a
report:
Show all nodes (existing option)
Show selected levels (new option)
Show selected nodes (existing option)
Show selected nodes+ child nodes (new option)
The image below shows the four options in the H-Filter setup panel.
New option 1: “Show selected levels”
All nodes in the selected level(s) are shown in the report (both the existing nodes and all future nodes).
www.dapresy.com Technical Release Notes Dapresy Pro 2017 Mid-Year Release Page 26 of 70
The image below shows an example of the setup. In the example below, all nodes in levels 3 and 4 are
shown in the report.
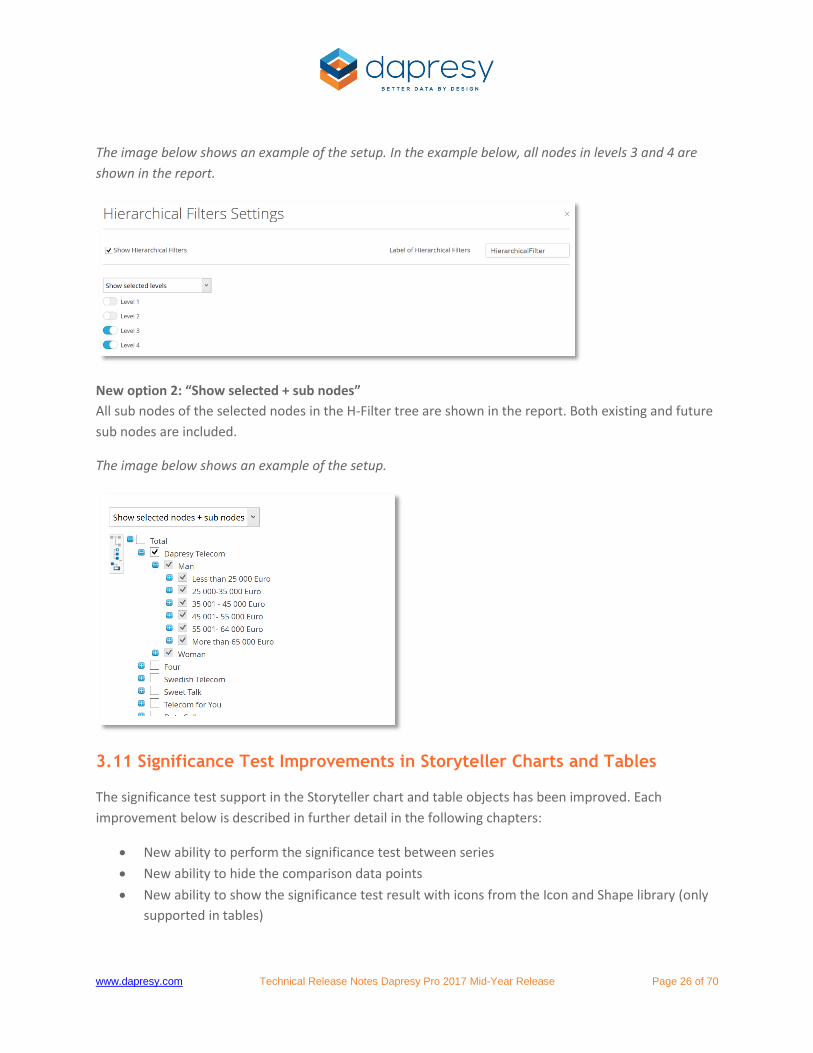
New option 2: “Show selected + sub nodes”
All sub nodes of the selected nodes in the H-Filter tree are shown in the report. Both existing and future
sub nodes are included.
The image below shows an example of the setup.
3.11 Significance Test Improvements in Storyteller Charts and Tables
The significance test support in the Storyteller chart and table objects has been improved. Each
improvement below is described in further detail in the following chapters:
New ability to perform the significance test between series
New ability to hide the comparison data points
New ability to show the significance test result with icons from the Icon and Shape library (only
supported in tables)

www.dapresy.com Technical Release Notes Dapresy Pro 2017 Mid-Year Release Page 27 of 70
New ability to show the significance test result with colored cell backgrounds (only supported in
tables)
New ability to show the significance test result with colored values (only supported in tables)
A second set of symbols have been added so that by default you can now select if +/- or ↓/↑
will be used to indicate if a value is significant or not.
New ability to define the starting letter (the letters are used to indicate to which value another
value has been tested against)
A new type of significance test has been added - “Norm/Population Z test”
3.11.1 Perform Significance Test Between Series
Previously, it was possible to run a significance test between data points that were in the same series in
a chart or table. Now, thanks to new support, you can run significance tests between series*.
*Series = The highlighted items in the image below.
Since the structure of data can be completely different between series, then a cell by cell comparison is
used when running significance test between series. This means that cell A1 in series 1 is compared to
cell A1 in series 2, and cell A2 in series 1 is compared to cell A2 in series 2, and so on and so forth.
Below is an example of a table that tests different series against each other.

www.dapresy.com Technical Release Notes Dapresy Pro 2017 Mid-Year Release Page 28 of 70
3.11.2.2 Setup
If a significance test is going to be run between two or more series, then all series have to use the same
calculation type. Either all series need to be “Mean –Categorical questions” or “Percentage share –
categorical questions.”
To setup a significance test between two or more series, just follow these two steps:
In the section “Test between,” select the “Series” option (see image below).
Note: This option is only available in the Main series. It is also only available if the chart/table
has multiple series and if all series are either “Mean –Categorical questions” or “Percentage
share – categorical questions”
Select how the series will be compared to each other in the “Comparison type” list. The same
options that you use when doing a regular significance test are available:
o All vs. all
o Previous data point
o Next data point
o First data point
o Last data point
Below you can see an example of each “Comparison type” option. The examples are based on a chart
containing three series: Series 1, Series 2 and Series 3.
Example 1: All Vs All
Cell A1 in series 1 is compared to A1 in series 2 and vice versa
Cell A1 in series 1 is compared to A1 in series 3 and vice versa
Cell A1 in series 2 is compared to A1 in series 2 and vice versa

www.dapresy.com Technical Release Notes Dapresy Pro 2017 Mid-Year Release Page 29 of 70
Example 2: Previous data point
Cell A1 in series 2 is compared to A1 in series 1
Cell A1 in series 3 is compared to A1 in series 2
Example 3: Next data point
Cell A1 in series 1 is compared to A1 in series 2
Cell A1 in series 2 is compared to A1 in series 3
Example 4: First data point
Cell A1 in series 2 is compared to A1 in series 1
Cell A1 in series 3 is compared to A1 in series 1
Example 5: Last data point
Cell A1 in Series 1 is compared to A1 Series 3
Cell A1 in Series 2 is compared to A1 Series 3
3.11.2.2.1 Comparison Logic
When running a significance test between series, the value comparison is done cell by cell. A1 in series 1
is compared to A1 in series 2, and A2 in series 1 is compared to A2 in series 2, and so on and so forth.
In a situation where one of the series has fewer cells than the other series, then the test will not run in
the cells that don’t have a corresponding cell in the comparison series. See examples below.
Example 1: All cells in series 1 have a corresponding cell in series 2. The yellow cell in series 1 is tested
against the yellow cell in series 2. The green cell in series 1 is tested against the green cell in series 2, and
so on.

www.dapresy.com Technical Release Notes Dapresy Pro 2017 Mid-Year Release Page 30 of 70
Example 2: The cell B2 in Series 1 has no value. Therefore, no test is applied to cell B2 in Series 2.
Example 3: The series 1 has 3 rows of data while series 2 only has 2 rows of data. No test is applied to the
values in row 3 in series 1.
3.11.2 Hide Comparison Data Points
A new setting allows you to hide the comparison data points when doing a significance test. The image
below shows an example, the result of the latest month is tested against the previous month (the +/-
signs indicating the significant difference from the previous month). The previous month’s results are
not shown in the table.
The image below shows results where comparison data points (previous month’s results) have been
hidden.
3.11.2.1 Setup
The setting to allow you to hide the comparison points is located in a dropdown list named “Comparison
behavior,” as shown in the image below. When the option “Hide comparison points” is selected, then all
the comparison points will become hidden.

www.dapresy.com Technical Release Notes Dapresy Pro 2017 Mid-Year Release Page 31 of 70
The image below shows the setting used to hide the comparison points.
Note: If “All vs all” is selected in the “Comparison type” list, then the “Hide comparison points” option
will not be available. Due to the nature of this function, it cannot be applied when all data points are
tested against all data points.
3.11.3 Visualize Significance Test Result with Icons
Previously, the significance test result in the table object was indicated with symbols such as +/- or
↑/↓. Now, you can visualize the significance test result with icons from the Icons and Shape library to
make your layouts more eye-catching and easier to read. The images below show a few examples.
The images below show a few typical examples where icons from the Icon and Shape library are used to
visualize the significance test result.

www.dapresy.com Technical Release Notes Dapresy Pro 2017 Mid-Year Release Page 32 of 70
3.11.3.1 Setup
To use icons to visualize the significance test result, follow these steps:
Select the option ”Icons” in the Visualization type list*

www.dapresy.com Technical Release Notes Dapresy Pro 2017 Mid-Year Release Page 33 of 70
Select the desired icons from the Icon and shape library (enter edit mode by clicking the icons)
Select the size of the icons in pixels
Select the position of the icons in the cell

www.dapresy.com Technical Release Notes Dapresy Pro 2017 Mid-Year Release Page 34 of 70
*Note: The significance test result can be visualized with icons when a value is tested against another
value. This option is not available when all values in the table are tested against each other, because it is
not possible to show multiple icons within the same cell.
3.11.4 Visualize Significance Test with Colored Cell Background
The significance test result in the table object can be displayed with colored cell backgrounds instead of
icons or symbols such as +/-. The image below shows an example of this.
The image below shows an example of a table that displays the significance test result with colored cell
backgrounds.
3.11.4.1 Setup
To use colored cell backgrounds to visualize the significance test, simply select the “Colored
backgrounds” option in the in the Visualization type list (see image below).
The image below shows the option to apply colored cell backgrounds.

www.dapresy.com Technical Release Notes Dapresy Pro 2017 Mid-Year Release Page 35 of 70
*Note: The significance test result can be visualized with colored cell backgrounds when a value is tested
against another value. This option is not available when all values in the table are tested against each
other.
The background colors for positive and negative results are defined in the Project settings page, as
shown in the image below.

www.dapresy.com Technical Release Notes Dapresy Pro 2017 Mid-Year Release Page 36 of 70
3.11.5 Visualize Significance Test with Colored Values
The significance test result in the table object can be shown with colored values rather than icons or
symbols such as +/-. The image below shows an example of this.
The image below shows an example of a table displaying the significance test result with colored values.
3.11.5.1 Setup
To use colored values to visualize the significance test, simply select the “Colored values” option in the
in the Visualization type list (see image below).
The image below shows the option to apply colored values.
*Note: The significance test result can be visualized with colored values when a value is tested against
another value. This option is not available when all values in the table are tested against each other.

www.dapresy.com Technical Release Notes Dapresy Pro 2017 Mid-Year Release Page 37 of 70
The value colors for positive and negative results are defined in the Project settings page, as shown in
the image below.
3.11.6 Second Set of Symbols - ↑/↓
A second set of symbols has just been added. By default, you can now select between +/- and ↓/↑ to
indicate if a value is significant or not. The +/- symbols can for example be used when comparing
segments (age groups, stores, gender, countries etc.) while the other set of symbols (↓/↑) can be used
when comparing time intervals (weeks, months etc.).
3.11.6.1 Setup
The symbols are defined in the Project settings page. You now have the ability to define two sets, then
you can select among these sets when setting up a chart or a table.
The image below shows the Project settings page. You can define the two sets of symbols in the
highlighted section.

www.dapresy.com Technical Release Notes Dapresy Pro 2017 Mid-Year Release Page 38 of 70
The image below shows the setup of a chart and a table. Here, you can select which set to be used.
Note: The Symbols dropdown list only appears if “Symbols” is selected in the Visualization type list.
3.11.7 Definition for Starting Letter
When running significance tests, you can now define a new starting letter for your comparisons (the
letters are used to indicate to which value another value has been tested against). Previously, a
lowercase “a” was always the starting letter. Now, you can select any starting letter whether lowercase
or capital.
It is useful to have the ability to select a starting letter when you have many table objects aligned next to
each other. From the report user view, this will look like one table. In these situations, it is not intuitive
to have the same letter in multiple places within the table. So, by selecting different starting letters, this
issue can be avoided.
The image below shows three different examples. The table on the left shows the old, default option
which uses “a” as the starting letter. The table in the middle uses “A” as the starting letter. And the table
on the right uses “G” as the starting letter.

www.dapresy.com Technical Release Notes Dapresy Pro 2017 Mid-Year Release Page 39 of 70
3.11.7.1 Setup
You can define the starting letter by simply choosing from the dropdown list, as shown in the image
below.
The image below shows how you can set up the starting letter.
Note: The option to select a starting letter will only appear when any of the following options are
selected in the “Comparison type” list:

www.dapresy.com Technical Release Notes Dapresy Pro 2017 Mid-Year Release Page 40 of 70
All vs All
First datapoint
Last datapoint
If any of the options below are selected, then you will not be able to set the starting letter. This is
because no letters are used with any of these options.
Next datapoint
Previous datapoint
3.11.8 New Significance Test; Norm/Population Significance Test
A new significance test formula, Norm/Population test, has been added to complement the current Two
independent sample Z test.
The “Norm/population test” is designed for testing survey calculated values against known population
values. This test is often referred to as a Population test. However, as long as the Norm value is treated
as a fixed value, then the test can be used to compare survey calculated values with Norms as well.
The new test has only been added to the Storyteller charts and tables, and has not been added to the
Cross Table Tool 2.0 since the setup is too complex in a “Do It Yourself” cross table tool.
The setup of the Norm/Population test in Storyteller charts/tables is more complex than the regular Two
independent sample Z test. This is because a survey calculated value (a percentage share or a mean
value of a categorical question) is tested against a Norm/Population value which often (or always) has
been imported to Dapresy Pro as numeric aggregated value stored in a numeric variable. This means
that the test has to be done across series in a chart or table as one series cannot show the results for
both categorical variables (survey result) and numeric variables (population/norm result).
3.11.1.1 Formulas
The next two chapters describe the formula of the new Norm/Population test.
3.11.1.1 Testing a Percentage Share Value Against a Norm/Population Value
The following input values are used in the formula:
p = norm value
x= test value (a % value)
n= base size* of x
q=100-p
*Note: The base size is weighted if the test value (x) is weighted.

www.dapresy.com Technical Release Notes Dapresy Pro 2017 Mid-Year Release Page 41 of 70
Formula:
Z=diff/se
o diff= ABS(p-x)
o se= √ (p x q / n)
Critical Values, n >100
The following critical values are used when the base size of the tested value is below 100.
Critical Values, n <=100
The list below shows the critical values used when the base size is above 100.
Note: Degrees of freedom = n (the base size of the test value)
Level Level Level
Level Level Level
Degrees of freedom 10% 5% 1%
Degrees of freedom 10% 5% 1%
1. 6.314 12.706 63.657
51. 1.675 2.008 2.676
2. 2.920 4.303 9.925
52. 1.675 2.007 2.674
3. 2.353 3.182 5.841
53. 1.674 2.006 2.672
4. 2.132 2.776 4.604
54. 1.674 2.005 2.670
5. 2.015 2.571 4.032
55. 1.673 2.004 2.668
6. 1.943 2.447 3.707
56. 1.673 2.003 2.667
7. 1.895 2.365 3.499
57. 1.672 2.002 2.665
8. 1.860 2.306 3.355
58. 1.672 2.002 2.663
9. 1.833 2.262 3.250
59. 1.671 2.001 2.662
10. 1.812 2.228 3.169
60. 1.671 2.000 2.660
11. 1.796 2.201 3.106
61. 1.670 2.000 2.659
12. 1.782 2.179 3.055
62. 1.670 1.999 2.657
13. 1.771 2.160 3.012
63. 1.669 1.998 2.656
14. 1.761 2.145 2.977
64. 1.669 1.998 2.655
15. 1.753 2.131 2.947
65. 1.669 1.997 2.654
16. 1.746 2.120 2.921
66. 1.668 1.997 2.652
17. 1.740 2.110 2.898
67. 1.668 1.996 2.651
18. 1.734 2.101 2.878
68. 1.668 1.995 2.650
19. 1.729 2.093 2.861
69. 1.667 1.995 2.649
20. 1.725 2.086 2.845
70. 1.667 1.994 2.648
21. 1.721 2.080 2.831
71. 1.667 1.994 2.647
22. 1.717 2.074 2.819
72. 1.666 1.993 2.646
23. 1.714 2.069 2.807
73. 1.666 1.993 2.645
24. 1.711 2.064 2.797
74. 1.666 1.993 2.644
25. 1.708 2.060 2.787
75. 1.665 1.992 2.643
26. 1.706 2.056 2.779
76. 1.665 1.992 2.642
27. 1.703 2.052 2.771
77. 1.665 1.991 2.641
28. 1.701 2.048 2.763
78. 1.665 1.991 2.640
29. 1.699 2.045 2.756
79. 1.664 1.990 2.640
30. 1.697 2.042 2.750
80. 1.664 1.990 2.639
31. 1.696 2.040 2.744
81. 1.664 1.990 2.638
32. 1.694 2.037 2.738
82. 1.664 1.989 2.637
33. 1.692 2.035 2.733
83. 1.663 1.989 2.636
34. 1.691 2.032 2.728
84. 1.663 1.989 2.636
35. 1.690 2.030 2.724
85. 1.663 1.988 2.635
36. 1.688 2.028 2.719
86. 1.663 1.988 2.634
37. 1.687 2.026 2.715
87. 1.663 1.988 2.634
38. 1.686 2.024 2.712
88. 1.662 1.987 2.633
39. 1.685 2.023 2.708
89. 1.662 1.987 2.632
40. 1.684 2.021 2.704
90. 1.662 1.987 2.632
41. 1.683 2.020 2.701
91. 1.662 1.986 2.631

www.dapresy.com Technical Release Notes Dapresy Pro 2017 Mid-Year Release Page 42 of 70
42. 1.682 2.018 2.698
92. 1.662 1.986 2.630
43. 1.681 2.017 2.695
93. 1.661 1.986 2.630
44. 1.680 2.015 2.692
94. 1.661 1.986 2.629
45. 1.679 2.014 2.690
95. 1.661 1.985 2.629
46. 1.679 2.013 2.687
96. 1.661 1.985 2.628
47. 1.678 2.012 2.685
97. 1.661 1.985 2.627
48. 1.677 2.011 2.682
98. 1.661 1.984 2.627
49. 1.677 2.010 2.680
99. 1.660 1.984 2.626
50. 1.676 2.009 2.678
100. 1.660 1.984 2.626
3.11.1.2 Test a Mean Value Against a Norm/Population Value
The following input values are used in the formula:
p= norm value
x= tested mean value
n= base size* of X
SE = Standard error* of X
S= Standard deviation* of X
*Note: The base size, the standard error, and the standard deviation are based on weighted values if the
test value (x) is weighted.
Formula
Z=diff/se
o Diff=ABS(p-x)
o SE= Standard Deviation / √ n
o S=
3.11.1.2 Setup
To run a Norm/Population test, the chart/table needs to have at least two series and one of the series
needs to use the “Mean – Categorical” calculation or the “Percentage share – categorical” calculation.
Follow these 3 steps to run the Population/Norm test:
Step 1 - Select “Norm/Population test” in Type dropdown list (shown in image below).
Note: Since the Norm/Population test can only be applied between series, this means it can only
be setup in the Main series.
www.dapresy.com Technical Release Notes Dapresy Pro 2017 Mid-Year Release Page 43 of 70
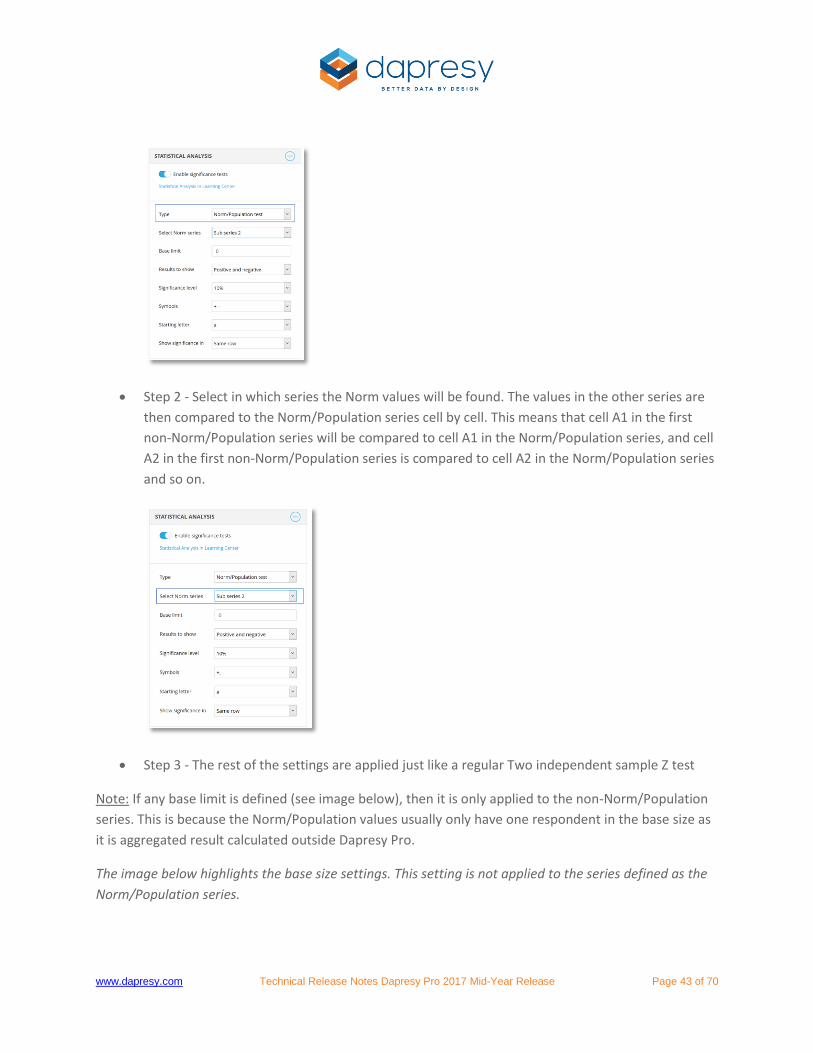
Step 2 - Select in which series the Norm values will be found. The values in the other series are
then compared to the Norm/Population series cell by cell. This means that cell A1 in the first
non-Norm/Population series will be compared to cell A1 in the Norm/Population series, and cell
A2 in the first non-Norm/Population series is compared to cell A2 in the Norm/Population series
and so on.
Step 3 - The rest of the settings are applied just like a regular Two independent sample Z test
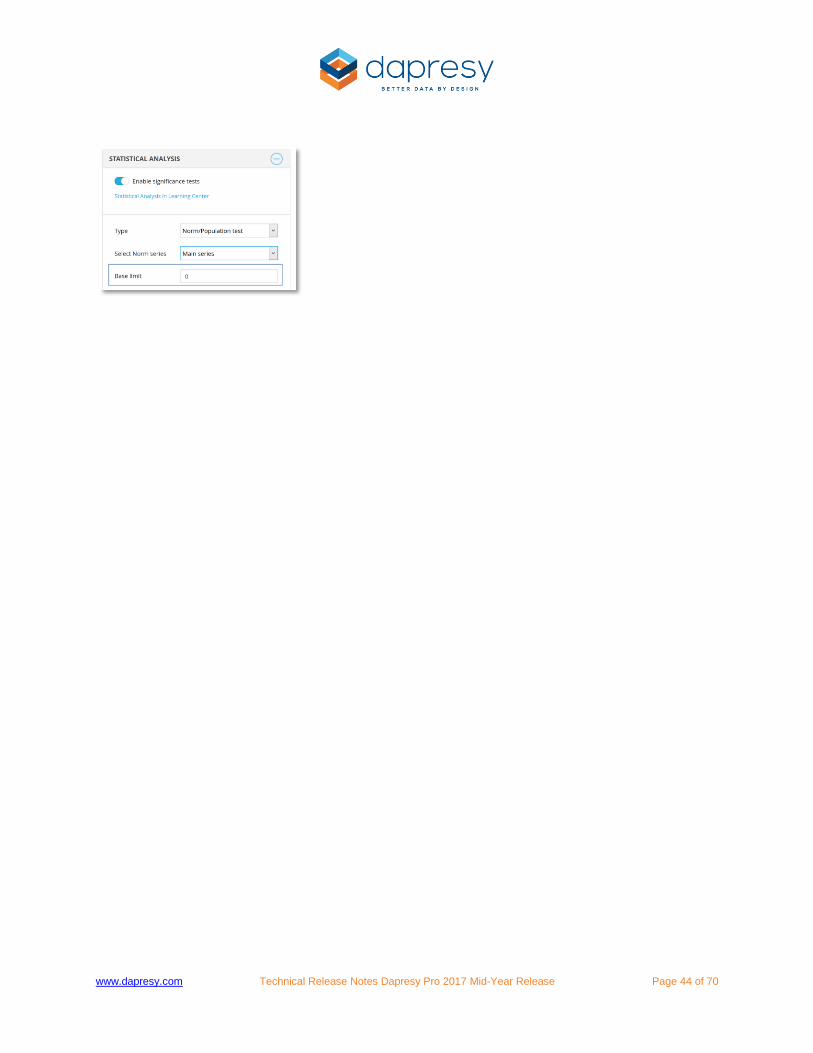
Note: If any base limit is defined (see image below), then it is only applied to the non-Norm/Population
series. This is because the Norm/Population values usually only have one respondent in the base size as
it is aggregated result calculated outside Dapresy Pro.
The image below highlights the base size settings. This setting is not applied to the series defined as the
Norm/Population series.
www.dapresy.com Technical Release Notes Dapresy Pro 2017 Mid-Year Release Page 44 of 70

www.dapresy.com Technical Release Notes Dapresy Pro 2017 Mid-Year Release Page 45 of 70
4 Cross Table Tool 2.0 Updates The following improvements have been made in the Cross table tool 2.0. Each of these is described in
detail further down.
New option to set up “device filtering,” which allows you to select which device the report will
be shown on
Improved hierarchical filter setup, and a new ability to show all nodes (including future nodes)
in a certain level or a certain branch
Visualize Significance Test with Colored Values
4.1 Device Filtering
The same “Device filtering” logic that has been added in the Storyteller and Form (see details in chapter
3.4) has been added in the Cross Table Tool 2.0. This new logic allows you to define the device sizes that
a Cross Table Tool 2.0 report will appear on. For example, you can choose to hide the cross table tool in
smartphones and tablets, but have it appear in desktops.
4.1.1 Setup Device Filtering
To set up the device filtering, just navigate to the Setup panel (as shown in the images below). To
activate the filtering, simply select the “Activate device filtering” option. Once this option is enabled,
you can select which screen sizes you would like the report to appear in.
Note: By default, the device filtering is disabled. This means that a report will be shown in all devices by
default.
The image below shows how you can setup the device filtering option in the Cross Table Tool 2.0. This
particular report will only appear when the user uses a medium or a large screen device (usually tablets
and desktops).

www.dapresy.com Technical Release Notes Dapresy Pro 2017 Mid-Year Release Page 46 of 70
4.2 Improved H-Filter Setup
The H-Filter setup has been improved so that future updates will be handled in a more efficient way.
Previously, you could manually pick which nodes you would like to show in the report, or you could
select the option “All nodes” which included all existing and future nodes. Two new options have been
added, “Show selected levels” and “Show selected nodes + sub nodes” to support other use cases. For
instance, you can use these options when you want to show all existing nodes and future nodes in a
specific branch or in a certain level.
This same functionality was also added in the Storyteller. See details in chapter 3.10.
4.4 Visualize Significance Test with Colored Values
The significance test result were previously shown with symbols such as +/- or with colored cell
backgrounds. A new setting allows you to visualize the results with colored values. The image below
shows an example of this.
The image below shows an example of a table displaying the significance test result with colored values.

www.dapresy.com Technical Release Notes Dapresy Pro 2017 Mid-Year Release Page 47 of 70
4.3.1 Setup
To use colored values to visualize the significance test, simply select the “Colored values” option in the
in the “Show result as” list (see image below).
The image below shows the option to apply colored values.

www.dapresy.com Technical Release Notes Dapresy Pro 2017 Mid-Year Release Page 48 of 70
*Note: The significance test result can be visualized with colored values when a value is tested against
another value. This option is not available when all values in the table are tested against each other.
The value colors for positive and negative results are defined in the Project settings page, as shown in
the image below.

www.dapresy.com Technical Release Notes Dapresy Pro 2017 Mid-Year Release Page 49 of 70
5 Document Archive 2.0 Updates The following improvements have been made in the Document Archive 2.0. Each of these is described in
detail further down.
New option to set up “device filtering,” which allows you to select which device the report will
be shown on
Improved hierarchical filter setup, and a new ability to show all nodes (including future nodes)
in a certain level or a certain branch
5.1 Device Filtering
The same “Device filtering” logic that was added in the Storyteller and Form (see details in chapter 3.4)
has been added in the Document Archive 2.0. This new device filter logic allows you to define what
device sizes a Document Archive 2.0 report will appear in.
5.1.1 Setup Device Filtering
To set up the device filtering, just navigate to the Setup panel (as shown in the images below). To
activate the filtering, simply select the “Activate device filtering” option. Once this option is enabled,
you can select which screen sizes you would like the report to appear in.
Note: By default, the device filtering is disabled. This means that a report will be shown in all devices by
default.
The image below shows how you can set up a device filter in the Document Archive 2.0. This particular
report will only appear when the user uses a medium or a large screen device (usually tablets and
desktops).

www.dapresy.com Technical Release Notes Dapresy Pro 2017 Mid-Year Release Page 50 of 70
5.2 Improved H-Filter Setup
The H-Filter setup has been improved so that future updates will be handled in a more efficient way.
Previously, you could manually pick which nodes you would like to show in the report, or you could
select the option “All nodes” which included all existing and future nodes. Two new options have been
added, “Show selected levels” and “Show selected nodes + sub nodes” to support other use cases. For
instance, you can use these options when you want to show all existing nodes and future nodes in a
specific branch or in a certain level.
This same functionality was also added in the Storyteller. See details in chapter 3.10.

www.dapresy.com Technical Release Notes Dapresy Pro 2017 Mid-Year Release Page 51 of 70
6 New Color Management Logic The color logic in Dapresy Pro has been significantly improved to save time during setup and
maintenance.
With this new update, you can adjust the colors in your color palette based on your needs. You can also
now use Hex codes, RGB or HSL values to select custom colors. The color picker also remembers the last
colors that were used, which makes it easier to reuse colors between objects.
The image below shows the updated color picker. As shown, you can now enter either the Hex, RGB or
the HSL code when entering a custom color.
Also, a brand new color template logic has been added to allow you to connect any item such as text
objects, icons, labels in charts, etc. to a “color placeholder” instead of setting a fixed color. For example,
all “headers” in a Storyteller report can be connected to a “header” color placeholder. This makes it very
easy to update the color of all the headers since you just need to update a single color placeholder
rather than multiple text objects.
These new color templates are created in a new Color Template library, and then a template is assigned
to each project.
The larger image below shows how you can setup a color template. The categories of the template are
shown on the left, and the options to edit colors, tags, sort order, etc. are made on the right. The smaller
image shows how the color placeholder appears in the color picker.

www.dapresy.com Technical Release Notes Dapresy Pro 2017 Mid-Year Release Page 52 of 70
Note: The ability to connect items to the color place holders and edit the colors of the color picker are
only supported if the project has a new color template. Since all existing project don’t have the new
color templates by default, the logic is not supported. If you want to use the new color template logic in
an old project, then see chapter 6.2.1.
The following chapters describe the new color logic in detail:
Chapter 6.1 explains how to create and maintain the color templates in the Color template
library
Chapter 6.2 explains how to import a color template to a project and how to make changes on a
project level
Chapter 6.3 explains how to use the color templates in a project, how to connect a question, a
text, an icon, etc. to a color placeholder
Chapter 6.4 explains how the Report Template library and the Color templates integrate with
each other
6.1 Color Template Library
In the Color template library, you create and edit the color templates that will be used in your projects.
There is no connection between the color templates in the project and the Color template library, so
changes in the library can be made without effecting any projects (and vice versa).
The new Color template library is located next to the old Color template library in the System/Misc. tab
(see image below). The old library screen has been renamed, and is now “Color template (Legacy).”

www.dapresy.com Technical Release Notes Dapresy Pro 2017 Mid-Year Release Page 53 of 70
The image below shows how to navigate to the Color template library.
In the Color template library page, you can create new templates and edit the existing ones.
The image below shows the Color template library page.
6.1.2 Create a New Color Template
A color template consists of several categories, and each category contains a number of color
placeholders. When creating a color template, a few categories are populated by default. Some of these
can be deleted while others are mandatory and cannot be deleted (read the explanation why some
categories cannot be deleted in chapter 6.4).
To create a new color template, click “Create new template” at the top of the page. A panel will then
appear where you can:
Name the template
Enter a comment: why it was created, etc. (optional)
Edit the colors of the desired color placeholders in the pre-defined categories and add new
colors to the pre-defined categories
Edit the sort order of the color placeholders
Edit the tags of the color placeholders
Create new categories
The image below shows the panel where you can create a color template. All categories are listed on the
left. The top one is the “Standard Palette” and shows the standard colors used by the color picker to set a

www.dapresy.com Technical Release Notes Dapresy Pro 2017 Mid-Year Release Page 54 of 70
fixed color for an item. The other categories contain the color placeholders that are used when an item
will be connected to the template.
Note: Remember to SAVE when you are done with all the changes. The Save button is located in the
lower right corner!
6.1.2.1 Edit a Color
To edit a color, simply click the corresponding color icon and edit the color in the color picker that
appears.

www.dapresy.com Technical Release Notes Dapresy Pro 2017 Mid-Year Release Page 55 of 70
The color picker can also be opened by double clicking directly on the desired color in the category list.
Note: Instead of setting a fixed color, you can link a color placeholder to another color placeholder. See
more details in the next chapter.
6.1.2.1.1 Create Links Between Color Placeholders
Instead of setting a fixed color for each color placeholder, you can create links between color
placeholders. This is very useful if several color placeholders will have the same or similar colors since
the links can also include color adjustments.
The image below shows an example of when links can be useful. The shown category shows the Scale 1-
7 color placeholders. Scale 1 has a fixed color while Scale 2 and a Scale 3 are linked to Scale 1. Pre-
defined color adjustments have been set to get lighter versions of the source color.

www.dapresy.com Technical Release Notes Dapresy Pro 2017 Mid-Year Release Page 56 of 70
The same goes for the green colors below. Scale 7 has a fixed color, while Scale 5 and 6 are linked to
Scale 7 with color adjustments. If the fixed color in Scale 1 is updated, then Scale 2 and Scale 3 will be
automatically updated and so on.
The image below shows a category where some colors have been linked. The Palette icon indicates that
the color is a source color while the brush icon indicates that the color is based of another color.
These kinds of links can also be created between the categories so that the Scale 1-5 category and Scale
1-3 category could also be linked to, for example, Scale 1 and Scale 7 in the Scale 1-7 category.
You can hover over the palette icon to see which color placeholders are linked to it. All linked colors are
rotated 45 degrees, as shown in the image below.

www.dapresy.com Technical Release Notes Dapresy Pro 2017 Mid-Year Release Page 57 of 70
To create a link, simply open the color picker of the desired color placeholder and enter the “link” tab. In
the link tab, select which category and color placeholder it should be linked to. If any color adjustments
need to be done, you can enter an adjusted HSL value (see image further down).
H=Hue
S= Saturation
L= lightness
The image below shows the link tab. In this case, the color placeholder is linked to the placeholder Scale
1 in the Scale 1-7 category. If you look at the Adjustment section, you will see that the new color will be
lighter since the Lightness value is increased by 20.
6.1.2.2 Add a New Color Placeholder
New colors can be added to a category by clicking the “New color” button (see image below). The new
color is white by default. A category can have an unlimited amount of colors.
The image below highlights the “New color” option.
www.dapresy.com Technical Release Notes Dapresy Pro 2017 Mid-Year Release Page 58 of 70
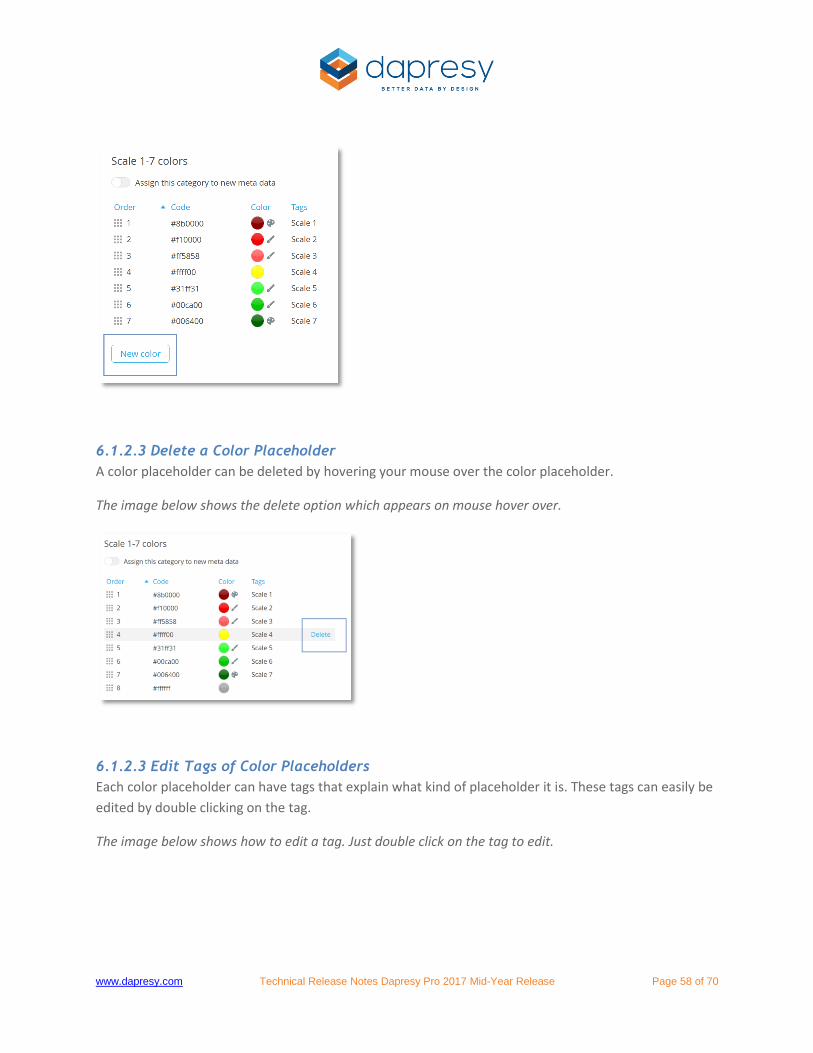
6.1.2.3 Delete a Color Placeholder
A color placeholder can be deleted by hovering your mouse over the color placeholder.
The image below shows the delete option which appears on mouse hover over.
6.1.2.3 Edit Tags of Color Placeholders
Each color placeholder can have tags that explain what kind of placeholder it is. These tags can easily be
edited by double clicking on the tag.
The image below shows how to edit a tag. Just double click on the tag to edit.

www.dapresy.com Technical Release Notes Dapresy Pro 2017 Mid-Year Release Page 59 of 70
6.1.2.4 Edit Sort Order of Color Placeholders
You can easily rearrange the sort order of the color placeholders within a category by entering the
desired sort order value or by dragging and dropping.
The image below shows the sort order edit field. Double click on the sort order value to open the edit
field.
The image below shows how you can drag and drop to change the sort order of the color placeholders.
To drag and drop a color placeholder, simply click the icon highlighted in the image below.

www.dapresy.com Technical Release Notes Dapresy Pro 2017 Mid-Year Release Page 60 of 70
6.1.2.5 Add New Category
A new category can be added by clicking the “New Category” button. A panel will open that will allow
you to enter the name and number of colors for the new category.
The “New Category” button is highlighted in the image below.
6.1.2.6 Select category to be assigned to new Meta data
When new Meta data is added to the project (via for example the data import, the compute variable
page, the grouped answer page etc.), the new meta data will use the colors from the “Standard palette”
category by default.
When setting up the color template, you can select if the colors will be picked from any other category.
The option to select the category that will be assigned to new meta data is shown in the image below.
The image below shows the option that can be enabled if the selected category will be assigned to new
meta data.

www.dapresy.com Technical Release Notes Dapresy Pro 2017 Mid-Year Release Page 61 of 70
6.1.3 Edit a Color Template
To edit an existing color template, just hover your mouse over the template that you would like to edit
in the Color Template list, and then click the Edit button. The edit process is the same as the creation
process, which you can read about in chapter 6.1.2.1 to 6.1.2.6.
The image below shows how to open a color template in edit mode.
6.1.4 Delete a Color Template
To delete a color template, simply hover your mouse over the template in the color template list and
click the “Delete” button that appears.
The image below shows how you can delete a color template.
Note: If you delete a color template, then the projects that use it will not be effected since there is no
connection between the color template in the projects and within the library.
www.dapresy.com Technical Release Notes Dapresy Pro 2017 Mid-Year Release Page 62 of 70
6.2 Color Template in Project
Each project has an assigned color template that is selected during the project creation. The template
can also be changed at a later time or updated.
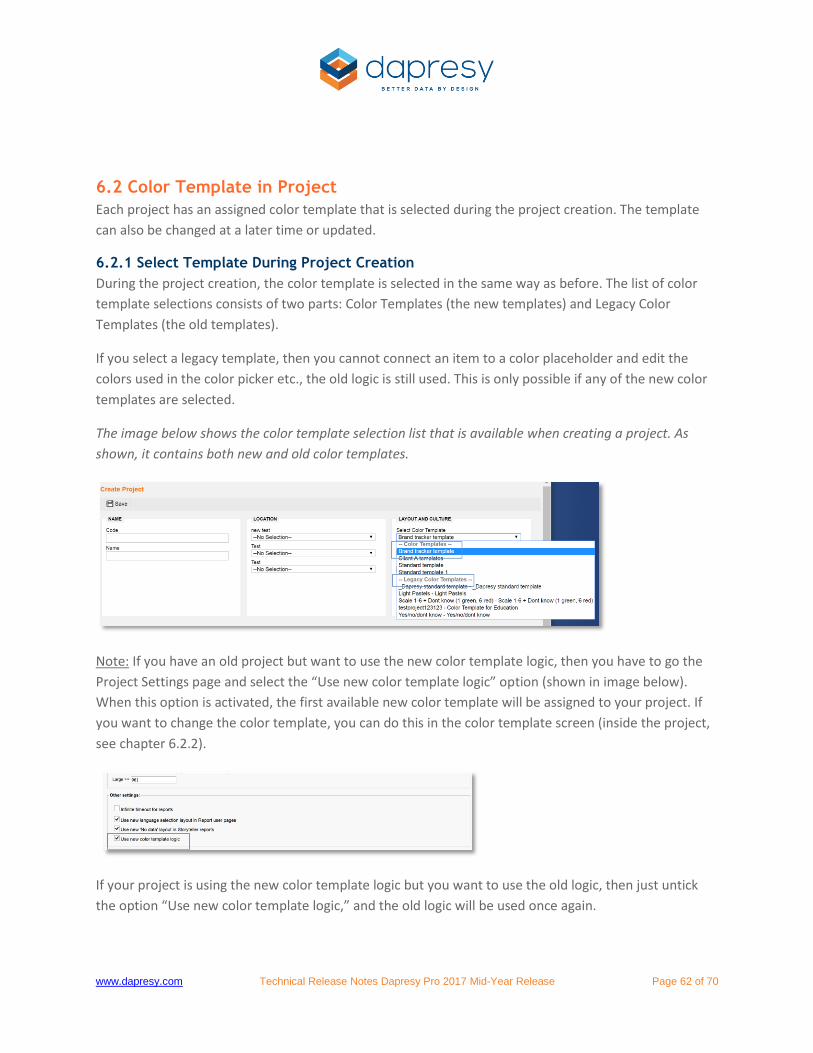
6.2.1 Select Template During Project Creation
During the project creation, the color template is selected in the same way as before. The list of color
template selections consists of two parts: Color Templates (the new templates) and Legacy Color
Templates (the old templates).
If you select a legacy template, then you cannot connect an item to a color placeholder and edit the
colors used in the color picker etc., the old logic is still used. This is only possible if any of the new color
templates are selected.
The image below shows the color template selection list that is available when creating a project. As
shown, it contains both new and old color templates.
Note: If you have an old project but want to use the new color template logic, then you have to go the
Project Settings page and select the “Use new color template logic” option (shown in image below).
When this option is activated, the first available new color template will be assigned to your project. If
you want to change the color template, you can do this in the color template screen (inside the project,
see chapter 6.2.2).
If your project is using the new color template logic but you want to use the old logic, then just untick
the option “Use new color template logic,” and the old logic will be used once again.

www.dapresy.com Technical Release Notes Dapresy Pro 2017 Mid-Year Release Page 63 of 70
6.2.2 Change Template in Project
If you want to change the color template in the project, simply go to the color template page and select
the “Import Color template” option (shown image below). When selecting this option, you can select a
new (or the same) Color template. This newly selected one will overwrite the existing template for the
project.
The image below shows the import color template option. Use this option to change the color template
of the project.
Note: If you import a new color template, then you will lose all changes that were made in the project. If
you created new color placeholders and new categories in this project, then these will be lost when the
new template is imported. If any items are connected to the deleted color placeholders/categories, then
these items will still have the same color but it will be a “fixed” color instead of a linked color.
6.2.3 Edit Color Template in Project
The colors, tags, number of colors, sort order, etc. can be updated in the project. All updates in the
project are only done on a project level so that the templates in the library will not be effected.
You can edit a color template in the color template page within the project. It is similar to editing in the
color template library. See chapter 6.1.2.1 to 6.1.2.6 for more details.
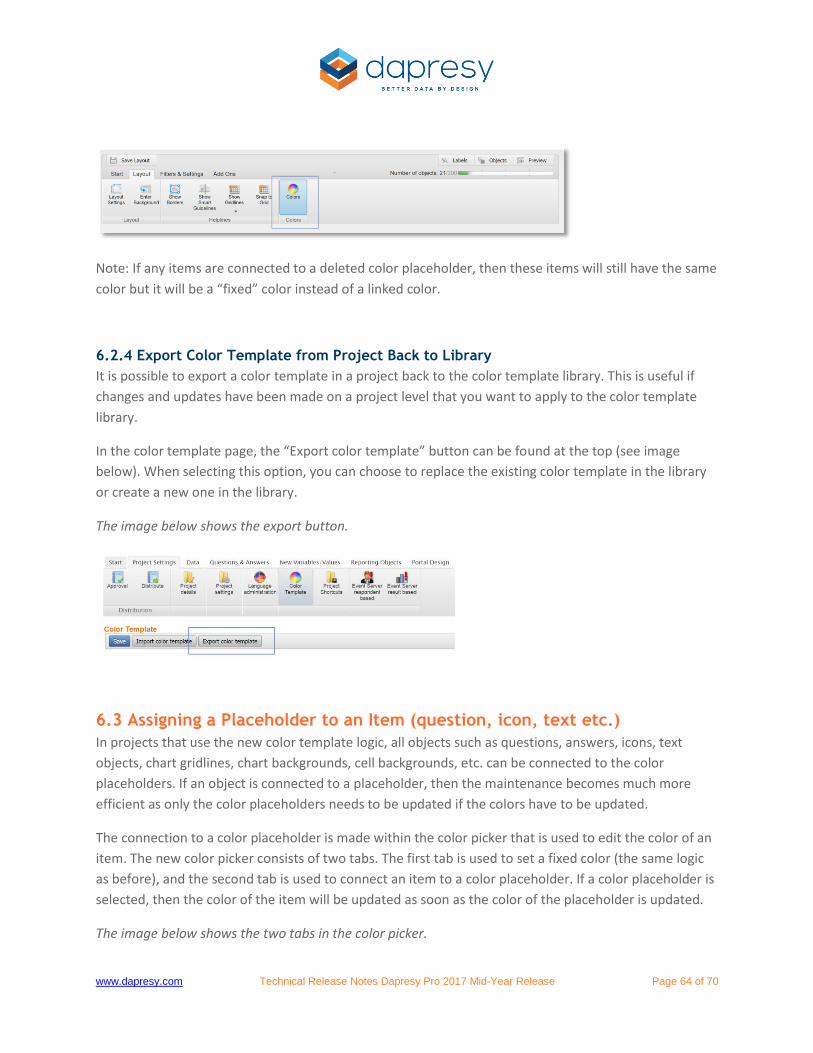
The used color template can also be edited directly from the Storyteller and the Form report by clicking
the Colors option in the ribbon menu, as shown in the image below.
The image below shows how to open the color template for editing in a Storyteller and Form report.
www.dapresy.com Technical Release Notes Dapresy Pro 2017 Mid-Year Release Page 64 of 70
Note: If any items are connected to a deleted color placeholder, then these items will still have the same
color but it will be a “fixed” color instead of a linked color.
6.2.4 Export Color Template from Project Back to Library
It is possible to export a color template in a project back to the color template library. This is useful if
changes and updates have been made on a project level that you want to apply to the color template
library.
In the color template page, the “Export color template” button can be found at the top (see image
below). When selecting this option, you can choose to replace the existing color template in the library
or create a new one in the library.
The image below shows the export button.
6.3 Assigning a Placeholder to an Item (question, icon, text etc.)
In projects that use the new color template logic, all objects such as questions, answers, icons, text
objects, chart gridlines, chart backgrounds, cell backgrounds, etc. can be connected to the color
placeholders. If an object is connected to a placeholder, then the maintenance becomes much more
efficient as only the color placeholders needs to be updated if the colors have to be updated.
The connection to a color placeholder is made within the color picker that is used to edit the color of an
item. The new color picker consists of two tabs. The first tab is used to set a fixed color (the same logic
as before), and the second tab is used to connect an item to a color placeholder. If a color placeholder is
selected, then the color of the item will be updated as soon as the color of the placeholder is updated.
The image below shows the two tabs in the color picker.

www.dapresy.com Technical Release Notes Dapresy Pro 2017 Mid-Year Release Page 65 of 70
In the systems, you can easily see if an item is connected to a color placeholder. In the image below, you
can see the icon that indicates if an item is connected to a color placeholder.
The image below shows the setup of an icon. In this case, the icon is connected to a color placeholder
instead of a fixed color which can be seen on the highlighted icon.
6.3.1 Use of Categories in Charts
When setting up a chart, you can choose the colors that will be applied to the series in the chart. If the
project uses the new color logic, then you can now select which category within the color template will
be used when the color source is “Color template”. As shown in the image below, a second dropdown
list appears when “Color Template” is selected in “Series color source.” This list shows all the available
categories.

www.dapresy.com Technical Release Notes Dapresy Pro 2017 Mid-Year Release Page 66 of 70
6.4 Color template and Report template library
If an object is linked to a color placeholder and the object is saved into the Report Template library, then
the link to the placeholder is saved as a part of the Report template. When the template is then
imported into a project, the colors will be picked from the color template of the current project. The
original colors will not be used. This means that an imported report template will immediately mimic the
look and feel based on the color template of the current project.
The images below show two examples. If the user imports a Report template that looks like the first
image below, then it could look like the second image after the import since the colors come from the
color placeholder of the current project.
The image below shows the template in the Report Template library.

www.dapresy.com Technical Release Notes Dapresy Pro 2017 Mid-Year Release Page 67 of 70
The image below shows the results after the import.
As mentioned in chapter 6.1.2, some of the categories in the color templates are mandatory and cannot
be deleted (but the colors of these can of course be updated to fit your needs). The purpose of having
these mandatory categories is so that Dapresy can fill the Report template library with predefined
report templates so that these objects have the correct colors from the beginning. This reduces a lot of
manual work and the need to correct the colors in the projects after an import from the Report
template library.
Note: If you have an object that is linked to, for example, color placeholder X in project A which is stored
in the report template library and then imported to project B (which does not have the color
placeholder X), then it will get the original color since the corresponding placeholder does not exist.
www.dapresy.com Technical Release Notes Dapresy Pro 2017 Mid-Year Release Page 68 of 70
To avoid these situations, we recommended that you only use the mandatory color
categories/placeholders when setting up a project if you want to save items into the Report template
library, as all these placeholders exist in all projects.
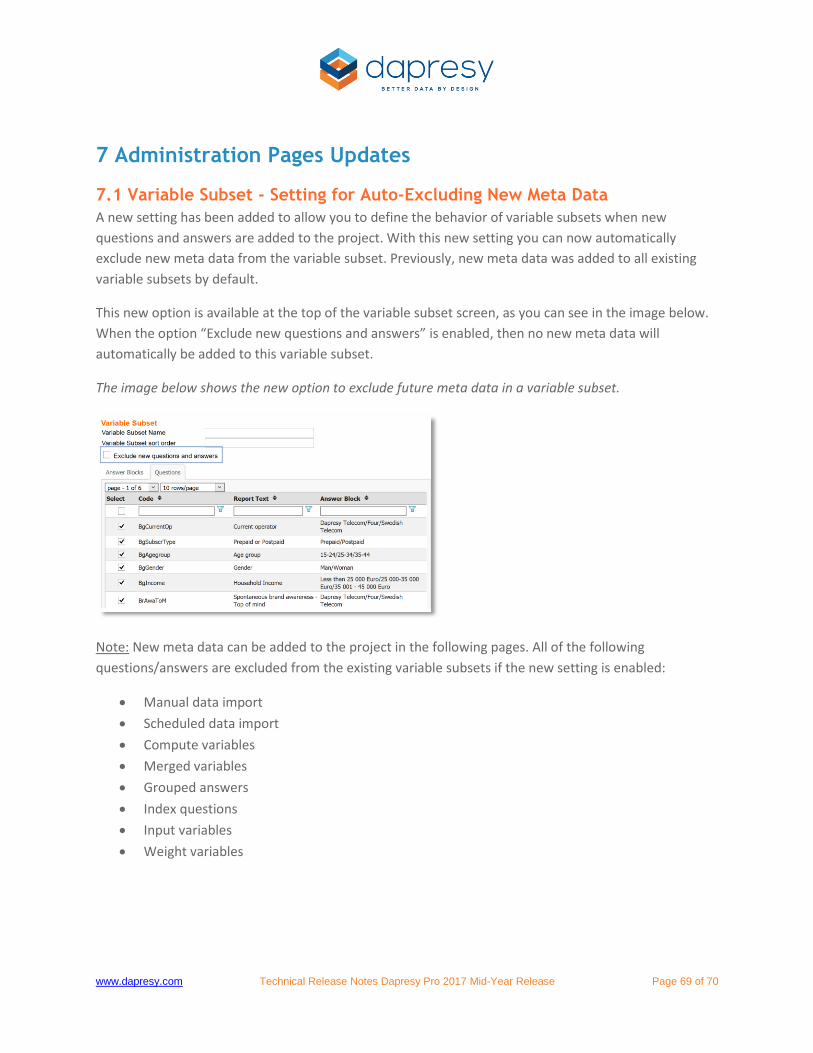
www.dapresy.com Technical Release Notes Dapresy Pro 2017 Mid-Year Release Page 69 of 70
7 Administration Pages Updates
7.1 Variable Subset - Setting for Auto-Excluding New Meta Data
A new setting has been added to allow you to define the behavior of variable subsets when new
questions and answers are added to the project. With this new setting you can now automatically
exclude new meta data from the variable subset. Previously, new meta data was added to all existing
variable subsets by default.
This new option is available at the top of the variable subset screen, as you can see in the image below.
When the option “Exclude new questions and answers” is enabled, then no new meta data will
automatically be added to this variable subset.
The image below shows the new option to exclude future meta data in a variable subset.
Note: New meta data can be added to the project in the following pages. All of the following
questions/answers are excluded from the existing variable subsets if the new setting is enabled:
Manual data import
Scheduled data import
Compute variables
Merged variables
Grouped answers
Index questions
Input variables
Weight variables
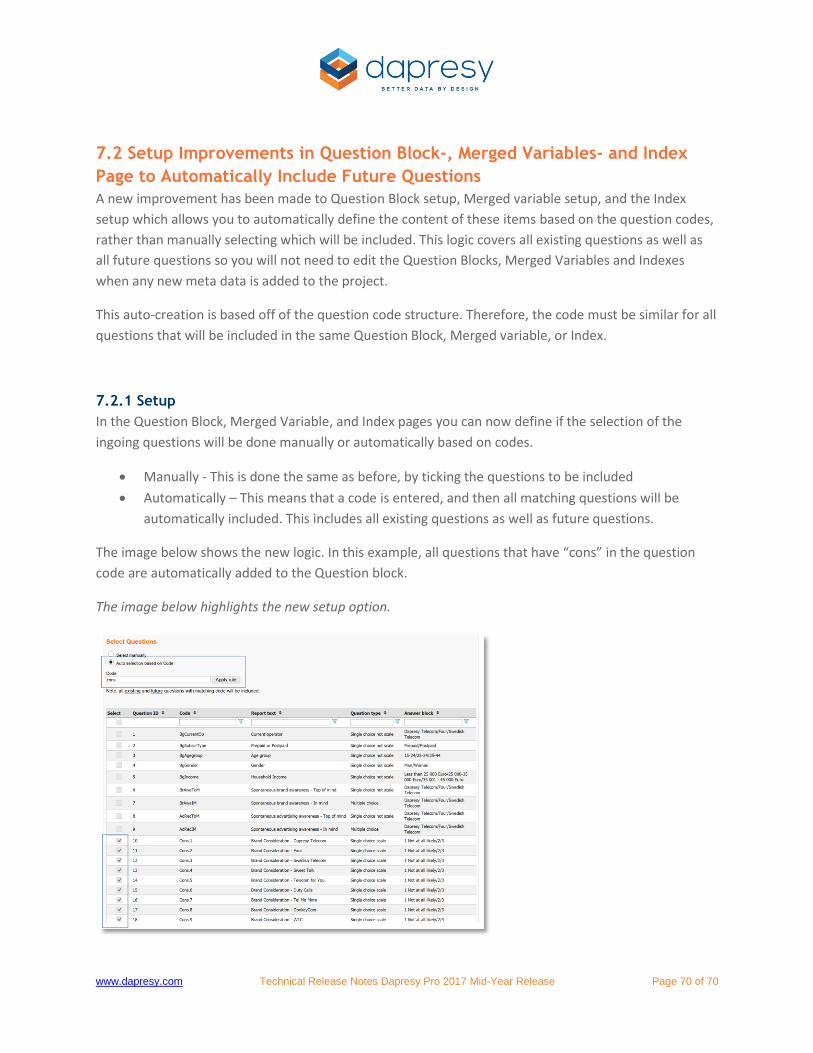
www.dapresy.com Technical Release Notes Dapresy Pro 2017 Mid-Year Release Page 70 of 70
7.2 Setup Improvements in Question Block-, Merged Variables- and Index
Page to Automatically Include Future Questions
A new improvement has been made to Question Block setup, Merged variable setup, and the Index
setup which allows you to automatically define the content of these items based on the question codes,
rather than manually selecting which will be included. This logic covers all existing questions as well as
all future questions so you will not need to edit the Question Blocks, Merged Variables and Indexes
when any new meta data is added to the project.
This auto-creation is based off of the question code structure. Therefore, the code must be similar for all
questions that will be included in the same Question Block, Merged variable, or Index.
7.2.1 Setup
In the Question Block, Merged Variable, and Index pages you can now define if the selection of the
ingoing questions will be done manually or automatically based on codes.
Manually - This is done the same as before, by ticking the questions to be included
Automatically – This means that a code is entered, and then all matching questions will be
automatically included. This includes all existing questions as well as future questions.
The image below shows the new logic. In this example, all questions that have “cons” in the question
code are automatically added to the Question block.
The image below highlights the new setup option.