daq software tools for the management of a multichannel ... software... · multichannel platform in...
TRANSCRIPT
Pedro Miguel Reis Pereira
DAQ software tools for the management of a
multichannel platform in hemodynamic studies
Dissertation submitted in partial fulfillment of the
requirements for the MSc degree in Biomedical Engineering
2013


DAQ software tools for the management of a
multichannel platform in hemodynamic studies
Scientific Advisors:
PhD Professor Carlos M. B. A. Correia
PhD João Manuel Rendeiro Cardoso
Scientific Supervisor:
MsC Vânia Maria Gomes de Almeida
Dissertation submitted to the Faculty of
Sciences and Technology of the University of
Coimbra in partial fulfillment of the
requirements for the MsC degree in
Biomedical Engineering


Para os meus pais,


i
Agradecimentos
Em primeiro lugar, gostaria de agradecer aos meus supervisores Prof. Dr. Carlos
Correia e Dr. João Cardoso por todo apoio dado ao longo deste ano e por me terem acolhido
neste fantástico grupo.
Um especial agradecimento à minha supervisora Vânia Almeida, por tudo o seu
incessante apoio e grande disponibilidade que sempre mostrou ao longo de todo o ano.
Aos meus colegas de trabalho Pedro Santos, Pedo Vaz, Mariana Sequeira e Neide com
quem partilhei o meu local de trabalho, um muito grande obrigado por tornarem aquele local
uma partilha de sabedoria.
Aos meus amigos e colegas de curso que acompanharam no meu percurso académico, e
tornaram estes últimos 5 anos, numa experiência fantástica. Aos meus amigos Beto, Fox,
David,Pina, Gondomar, Dani, Pacífico, Alzheimer, Margarida e Sara, que me acompanharam ao
longo deste magnífico percurso académico e com quem espero partilhar muitos mais sucessos
no futuro. A eles deixo o meu grande obrigado, pois sem eles ao meu lado tudo seria mais
difícil.
Um eterno obrigado à família, principalmente aos meus Pais e ao meu irmão, por todos
os sacrifícios e por toda ajuda que me deram durante estes últimos 5 anos. Sem eles nada disto
seria possível.
Obrigado a todos!

ii
iii
Abstract
Arterial stiffness assumes an important role as marker of cardiovascular diseases
(CVD), which according to the World Health Organization (WHO) are the leading cause of
death worldwide. The most studied parameters are the pulse wave velocity (PWV) and the
augmentation index (AIx). These parameters can be retrieved from the arterial pulse waveform
analysis.
A multichannel platform was assembled with four different modules, enabling the
measurement of various important hemodynamic parameters. The platform incorporates
electrocardiography (ECG), a photoplethysmography (PPG), arterial pressure waveform (APW)
analysis and pulse wave velocity (PWV) measurements. This system provides a more complete
cardiovascular condition assessment by the integration of several technologies and
methodologies used in the traditional clinical path of cardiovascular patients.
A graphical user interface (GUI) was developed in Matlab and integrated with a custom
database, allowing to acquire and to save data from all of the modules present on the
multichannel platform.
Primary studies were performed using the previous interface following a protocol for
two different acquisitions: one comprising the APW, ECG and PPG measurements and another
with the PWV, ECG and PPG measurements.
Studies from the heart rate variability derived from the PPG and the ECG from the same
acquisitions showed excellent results, which validates the reliability of the PPG and ECG
modules. Repeatability tests performed to the APW showed satisfactory results. Results
extracted from the second derivative of the photoplethysmogram waveform for vascular
assessment are in accordance with values found in literature.
Keywords : Arterial Stiffness, Multichannel platform, Hemodynamic parameters, Graphical
user interface.

iv

v
Resumo
A rigidez arterial é um óptimo marcador das doenças cardiovasculares, que de acordo
com a Organização Mundial da Saúde são uma das maiores causas de morte em todo o mundo.
Os parâmetros mais estudados são a velocidade de onda e o índice de aumentação. Estes
parâmetros podem ser obtidos através da análise da forma de onda.
A platforma multicanal foi construída com quatro módulos diferentes, permitindo medir
vários parâmetros hemodinâmicos importantes. A platforma encorpora um
electrocardiomógrafo, um fotopletismógrafo, um módulo para a análise da onda de pressão
arterial e um módulo para a medição da velocidade da onda de pulso. Este sistema providencia
uma avaliação mais completa da condição cardiovascular, através da integração de várias
tecnologias e metodologias usadas tradionalmente em rastreio clínico.
Uma interface gráfica foi desenvolvida em Matlab e integrada numa base de dados,
permitindo adquirir e gravar os dados de todos os módulos presentes na plataforma multicanal.
Foram relizados estudos primários usando a interface anterior, seguindo um protocolo
para duas diferentes acquisições: uma compreendendo a medição da forma da onda de pressão
arterial, o electrocardiomógrafo e do fotopletismografo, e outra com as medições da velocidade
da onda de pulso, do electrocardiomógrafo e do fotopletismógrafo.
Estudos da variabilidade do batimento cardíaco derivado do fotopletismograma e do
electrocardiograma para as mesma acquisições, mostraram excelentes resultados, o que
comprova a fiabilidade dos módulos do fotopletismógrafo e do electrocardiomógrafo. Testes de
repetibilidade realizados para a forma da onda de pressão arterial mostraram resultados
satisfatórios. Resultados extraídos pela segunda derivada da forma do fotopletismograma para
avaliação da rigidez arterial mostraram excelente concordância com os valores encontrados na
literatura.
Palavras-chave : Rigidez arterial, Platforma multicanal, Parâmetros hemodinamicos,
Interface gráfica.

vi

vii
Contents
Agradecimentos ............................................................................................................................. i
Abstract ........................................................................................................................................ iii
Resumo .......................................................................................................................................... v
Contents ....................................................................................................................................... vii
List of Figures ................................................................................................................................ xi
List of Tables ................................................................................................................................ xiii
Acronyms ...................................................................................................................................... xv
1. Introduction .......................................................................................................................... 1
1.1 Motivation ........................................................................................................................... 1
1.2 Previous work ...................................................................................................................... 2
1.3 Goals .............................................................................................................................. 3
1.4 Thesis contents .............................................................................................................. 3
2. Theoretical Background ........................................................................................................ 5
2.1 Cardiovascular system ......................................................................................................... 5
2.1.1 The heart ...................................................................................................................... 6
2.1.2 Common carotid artery ................................................................................................ 6
2.2 Arterial stiffness .................................................................................................................. 7
2.2.2 Proximal and distal arterial stiffness ............................................................................ 8
2.2.3 Arterial stiffness factors ............................................................................................... 8
2.2.3.1 Aging ...................................................................................................................... 9
2.3 Arterial pressure waveform ................................................................................................ 9
2.3.1 APW morphology ....................................................................................................... 10
2.3.1.1 Incident wave ...................................................................................................... 10
2.3.1.2 Reflected wave .................................................................................................... 11
2.3.2 APW types .................................................................................................................. 11
2.4 Noninvasive assessment of arterial stiffness .................................................................... 12
2.4.1 Pulse pressure ............................................................................................................ 12
2.4.2 Arterial compliance and distensibility ........................................................................ 12
2.4.3 Augmentation index ................................................................................................... 13
2.4.4 Pulse Wave Velocity ................................................................................................... 15
2.4.4.1 Regional pulse wave velocity .............................................................................. 16

viii
2.4.4.2 Local pulse wave velocity .................................................................................... 19
2.5 Photoplethysmogram ........................................................................................................ 20
2.5.1 Operation Principle of PPG ......................................................................................... 20
2.6 Electrocardiogram ............................................................................................................. 21
2.6.1 Cellular electrophysiology .......................................................................................... 21
2.6.2 PQRST complex .......................................................................................................... 22
2.7 Commercial devices for noninvasive of arterial stiffness assessment .............................. 22
3. Hardware ............................................................................................................................. 25
3.1 Multichannel platform ...................................................................................................... 25
3.1.1 Acquisitions system .................................................................................................... 26
3.1.2 Schematic ................................................................................................................... 27
3.3.1 Arterial pressure waveform module .......................................................................... 28
3.3.1.1 Piezoelectric sensor ............................................................................................. 28
3.3.1.2 Signal conditioning circuit ................................................................................... 29
3.3.2 Pulse wave velocity module ....................................................................................... 29
3.3.2.1 Double PZ Headed probe .................................................................................... 30
3.3.3 Photoplethysmography module ................................................................................. 31
3.3.4 Electrocardiogram and Synchronization module ....................................................... 32
3.4.4.1 Synchronization ................................................................................................... 33
3.3.4.2 Electrocardiogram ............................................................................................... 33
4. Interface .............................................................................................................................. 37
4.1 Interface - main menu ....................................................................................................... 37
4.1.2 Signals present on the multichannel platform ........................................................... 38
4.1.3 GUI signals display ...................................................................................................... 39
4.1.4 Save data acquired ..................................................................................................... 42
4.2 Database - Cardiocheck ..................................................................................................... 42
4.3 Inter – communication between GUIs .............................................................................. 45
5. Methodology ....................................................................................................................... 49
5.1 APW – Pulse Analyzer ........................................................................................................ 49
5.1.1 APW on set calculation............................................................................................... 49
5.1.2 Baseline noise removal .............................................................................................. 50
5.1.3 Morphological analysis ............................................................................................... 50
5.1.4 Pulse segmentation and normalization ...................................................................... 50
5.1.5 Spatial feature extraction ........................................................................................... 51

ix
5.2 Electrocardiogram ............................................................................................................. 51
5.3 Photoplethysmogram ........................................................................................................ 51
5.3.1 Calculation of onset, systolic peak and dicrotic notch ............................................... 52
5.3.2 Second derivative of the finger photoplethysmograph ............................................. 55
5.4 Multichannel platform acquisition .................................................................................... 57
6. Results and Discussion ........................................................................................................ 61
6.1 Results from acquisitions .................................................................................................. 61
6.1.1 Acquisition setup I ...................................................................................................... 61
6.1.2 Acquisition setup II ..................................................................................................... 62
6.1.3 Synchronization module ............................................................................................. 63
6.2 Hemodynamic signals analysis .......................................................................................... 64
6.2.1 APW analysis .............................................................................................................. 65
6.2.1.1 Subject characteristics ........................................................................................ 65
6.2.1.2 APW repeatability tests (agreement assessment) .............................................. 66
6.2.2 Electrocardiogram analysis ........................................................................................ 67
6.2.3 PPG analysis ................................................................................................................ 70
6.2.3.1 Algorithm for onset, SP and DN detection .......................................................... 71
6.2.3.2 Second derivative of the finger photoplethysmograph ...................................... 73
6.3 Inter-signals Studies .......................................................................................................... 74
6.3.1 Heart Rate Variability ................................................................................................. 74
6.3.1.1 Correlation Studies .............................................................................................. 75
6.3.1.1.1 Time-domain analysis ................................................................................... 75
6.3.1.1.2 - Non-linar analysis – Poincaré plot .............................................................. 78
6.3.1.2 Agreement assessments – Bland-Altmand tests ................................................. 80
6.3.1.3 Discussion of HRV ................................................................................................ 82
6.3.2 SDPTG for arterial stiffness assessment ..................................................................... 84
7. Conclusion and Future Work ............................................................................................... 85
7.1 Conclusion ......................................................................................................................... 85
7.2 Future Work ...................................................................................................................... 86
8. References ............................................................................................................................... 87

x

xi
List of Figures
Figure 1 - Cross section of the human heart with the course of the blood flow. Taken from [27].
....................................................................................................................................................... 5
Figure 2 - Arteries of the neck and head. Taken from [30]. .......................................................... 7
Figure 3 - Propagation of the ABP through the arterial tree – “Amplification phenomenon” [34].
....................................................................................................................................................... 8
Figure 4 -The arterial pressure waveform as a result of the sum between the incident and the
reflected pressure wave. Adapted from [40]. ............................................................................. 10
Figure 5- APW classification according to Murgo el al., where Pi is the inflection point, SP is the
systolic pressure and DW is the dicrotic wave [39]. ................................................................... 11
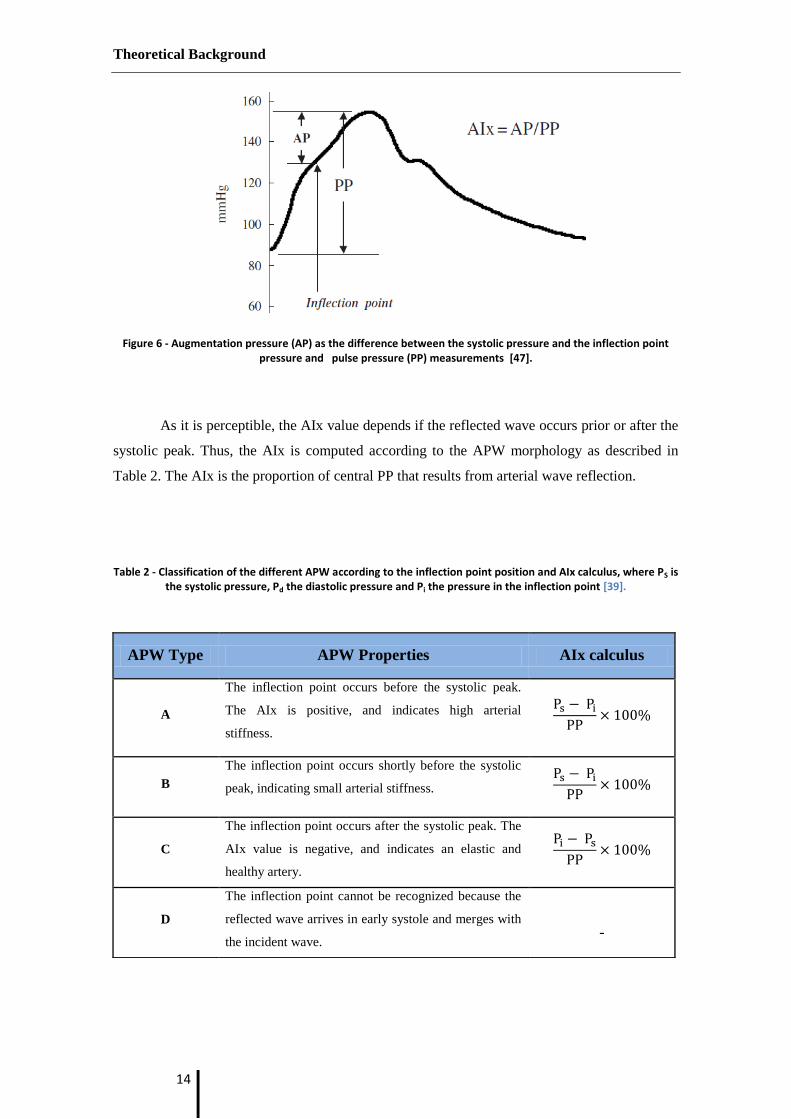
Figure 6 - Augmentation pressure (AP) as the difference between the systolic pressure and the
inflection point pressure and pulse pressure (PP) measurements [47]. .................................. 14
Figure 7 - Different method to measure the path length [56] .................................................... 17
Figure 8- Measurement of carotid-femoral PWV [56]. ............................................................... 18
Figure 9 - Transit time measure with an ECG as reference [61]. ................................................ 19
Figure 10 - Absorbed and transmitted light in pulse oximetry [25]. ........................................... 21
Figure 11 - One cycle of a typical ECG signal [67]. ...................................................................... 22
Figure 12 - Multichannel Platform. (A) Power Supply; (B) APW module; (C) ECG probe
integrated with synchronization module; (D) PWV module; (E) PPG module; (F) NIdaq-6210 . 26
Figure 13 - DAQ -NI USB 6210 ..................................................................................................... 27
Figure 14 – Schematic of the Multichannel Platform ................................................................. 27
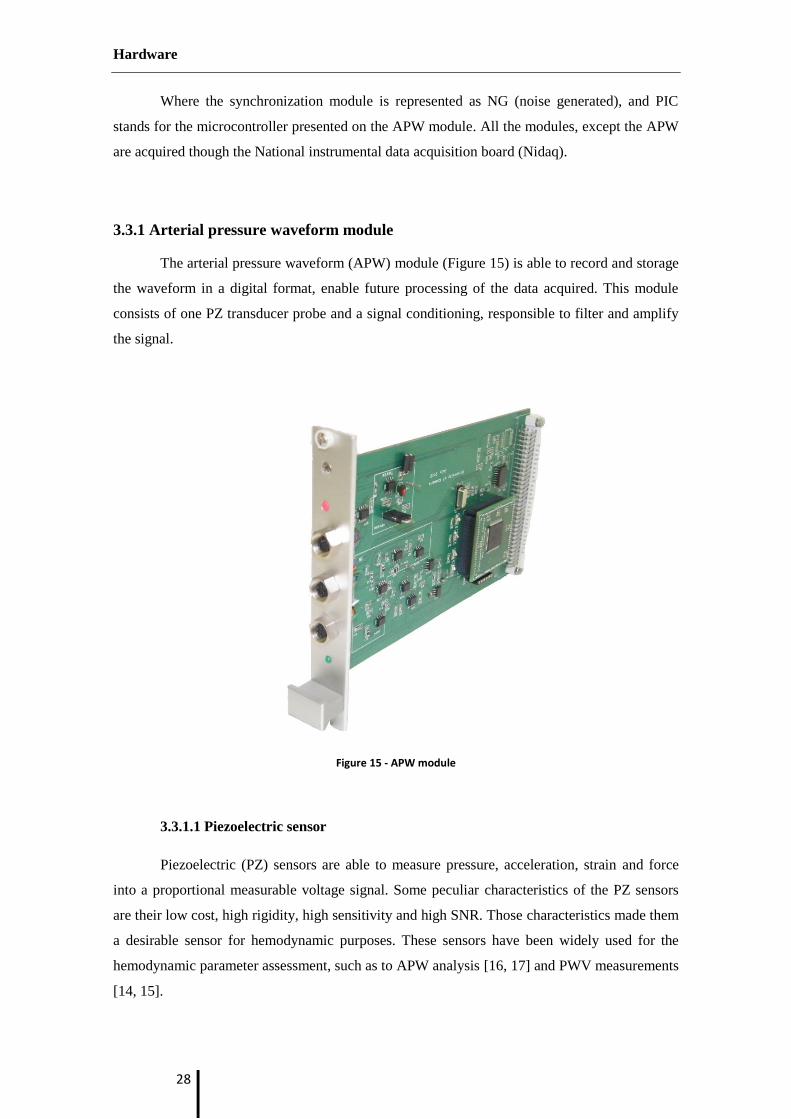
Figure 15 - APW module ............................................................................................................. 28
Figure 16 - PZ sensor. (A) Probe elements in cut, (1) mushroom - shaped interface, (2) PZ disc
sensor and (3) printed circuit board (PCB). (B) Outer upper view of the single headed PZ probe
[16]. ............................................................................................................................................. 29
Figure 17 - PWV module. ............................................................................................................ 30
Figure 18 - Double headed probe. (1) Thin film PZ sensors. ....................................................... 30
Figure 19 - PPG module. .............................................................................................................. 31
Figure 20 - Schematic of the hardware on the PPG. ................................................................... 32
Figure 21 - ECG and synchronization module. ............................................................................ 33
Figure 22 - Proper placement of the limb electrodes for a 3-lead ECG [69]. .............................. 34
Figure 23 - Biopac® disposable Ag-AgCl electrodes [67]. ............................................................ 35
Figure 24 - Graphical user interface of the multichannel platform. The GUI has the following
filed: (1) signals to acquire, (2) signal to display, (3) start/stop/save the acquisition and (4)
display window. ........................................................................................................................... 37
Figure 25 - Demonstration of the Popup feature developed. ..................................................... 38
Figure 26 - Example of signals exhibit. ........................................................................................ 41
Figure 27 - Example of an acquisition file. .................................................................................. 42
Figure 28 - Cardiocheck main menu appearance. ....................................................................... 43
Figure 29 - Cardiocheck Patient Window : personal window tab. (A) tab selection, (B) personal
info fields, (C) patient Edit/Save and Cancel buttons, (D) main menu button. .......................... 44

xii
Figure 30 - Cardiocheck Acquisition window. (A) institution select pop-up; (B) Operator select
pop-up; (C) place of acquisition pop-up; (D) Patient select pop-up and its basic information ; (E)
proceed to multichannel platform GUI; (F) main menu button. ................................................ 45
Figure 31 - Communication between the Multichannel Platform GUI and APW Pulse Analyzer
Module. ....................................................................................................................................... 46
Figure 32 - Examples of artefacts present on the PPG due to: movement (a), finger tremor (b),
bout of coughing (c) and breathing parttern (deep gasp or yawn) (d) [19]. ............................... 52
Figure 33 - ABP waveform and its 1st order derivative [74]. ....................................................... 53
Figure 34 – Flowchart of the algorithm to detect the Onset, Peak Systolic and Dicrotic Notch.
Adapted from [74]. ...................................................................................................................... 54
Figure 35- Photoplethysmogram waveform and its derivatives [79]. ........................................ 55
Figure 36 - Flowchart to determine the waves from SDPTG....................................................... 56
Figure 37 – The two different acquisitions set up. ...................................................................... 58
Figure 38- Acquisition setup I. ..................................................................................................... 61
Figure 39 - Acquisition setup II. .................................................................................................. 62
Figure 40- Synchronization acquired from NI and PIC. ............................................................... 64
Figure 41 - Bland-Altman AIx plot between week the first 2 week and the last 2 weeks. ......... 67
Figure 42 - Raw ECG signal. ......................................................................................................... 68
Figure 43- Digital Signal Conditioning. ........................................................................................ 68
Figure 44 - Example of R wave detection .................................................................................... 69
Figure 45 - Comparison of a median filter and a low pass filter ................................................. 71
Figure 46 - Example of the waveform analysis based the delineator algorithm presented by Li
et al. [74]. .................................................................................................................................... 72
Figure 47 - Second Derivative of PPG and A,B,C,D,E waves. ....................................................... 73
Figure 48 - Cardiac beat-to-beat interval extracted from PPG and ECG signals. RRI - R-R
intervals, PPI P-P intervals. .......................................................................................................... 74
Figure 49 - Time domain regression analysis of the average of RRIs and PPIs. .......................... 76
Figure 50 - Time domain regression analysis of the standard deviation of the NN from RRIs and
PPIs. ............................................................................................................................................. 76
Figure 51 - Time domain regression of the RMSSD of RRIs and PPIs. ......................................... 77
Figure 52 - Time domain linear regression analysis of pRR50 of RRIs and PPIs. ......................... 77
Figure 53 - HRV Poincaré plot from one subject. ........................................................................ 78
Figure 54 - PPV Poincaré plot from one subject. ........................................................................ 79
Figure 55 - Linear regression of SD1 from Poncaré plot derived from RRI and PPI. ................... 79
Figure 56 - Linear regression of SD2 from Poncaré plot derived from RRI and PPI. ................... 80
Figure 57 - Bland-Altman agreement analysis between NN from ECG and PPG. ....................... 81
Figure 58 - Bland-Altman analysis between SD ratios derived from ECG and PPG. ................... 82
Figure 59 - Histogram with Gaussian of D/A values for the 79 acquisitions. .............................. 84

xiii
List of Tables
Table 1- Factors that affect arterial stiffness [9]. .......................................................................... 9
Table 2 - Classification of the different APW according to the inflection point position and AIx
calculus, where PS is the systolic pressure, Pd the diastolic pressure and Pi the pressure in the
inflection point [39]. .................................................................................................................... 14
Table 3 - Devices and methods used for arterial stiffness measurements and wave reflections
[9]. ............................................................................................................................................... 23
Table 4 - Power supply requirements for each modules ............................................................ 25
Table 5 - Signals acquired through the multichannel platform. ................................................. 39
Table 6 - Signals displayed on the Interface. ............................................................................... 40
Table 7 - Test group characterization (mean ± standard deviation). .......................................... 66
Table 8 - Evaluation of the algorithm to detect R wave on the ECG signal ................................ 70
Table 9 - Evaluation of the algorithm to detect the Onset, SP and DN based on Li et al. .......... 72

xiv

xv
Acronyms
ABP Arterial Blood Pressure
AIx Augmentation Index
APW Arterial Pressure Waveform
AU Arbitrary Units
BMI Body Mass Index
CCA Common Carotid Artery
CVD Cardiovascular Diseases
DAQ Data Acquisition
DBP Diastolic Blood Pressure
DN Dicrotic Notch
DW Dicrotic Wave
ECG Electrocardiogram
FN False Negative
FP False Positive
GEI Electronics and Instrumentation Group
GUI Graphic User Interface
HEE Human Expertise Engineer
HR Heart Rate
HRV Heart Rate Variability
LVET Left Ventricular Ejection Period
LPWV Local Pulse Wave Velocity
MCU Microcontroller Unit
MRSSD Mean Squared Differences of Successive Interpulse Intervals
NI National Instruments®
Nidaq National Instrumental Data Acquisition Board
NN Mean Interpulse Interval
PCB Printed Circuit Board

xvi
Pi Point of Inflection
pNN50 Proportiion of Sucessive Interpulse Intervals which exceeds the 50 ms
PPI Peak-to-Peak Intervals
PPG Photoplethysmogram
PPV Pulse Pressure Variability
PVC Polyvinyl Cloride
PWV Pulse Wave Velocity
PZ Piezoelectric
RMSE Lowest Root Mean Square
RPWV Regional pulse wave velocity
RRI RR Intervals
SBP Systolic Blood Pressure
SD1 Short Term Beat-to-Beat Variability
SD2 Long Term Beat-to-Beat Variability
SDNN Standard Deviation of the Interpulse Intervals
SDPTG Second Derivative of the finger Photoplethysmograph
SNR Signal-to-Noise Ratio
SP Systolic Peak
S/H Sample-and-Hold Circuit
TP True Positive
TT Transit Time
WHO World Health Organization

Introduction
1
1. Introduction
1.1 Motivation
According to the World Health Organization, cardiovascular diseases (CVD) are one of
the major death causes in the world. In 2008, an estimated 17.3 million people have died from
CVD representing 30% of all global deaths and it has been predicted that the CVD mortality
will increase up to 23,6 millions in 2030 [1]. There are some devices capable of detecting CVD
factors, but they are quite expensive and hard to expertise. Therefore, the development of a
simple, reliable and noninvasive methods is fundamental for the early detection of arterial
stiffness, within therapeutic intervention can be a major beneficial [2].
Arterial stiffness (lack of elasticity) has been investigated as a good tracker of CVD,
such as hypertension, atherosclerosis, coronary heart disease and stroke [3, 4]. Over the past
years, more attention has been paid to arterial stiffness, where many studies proven arterial
stiffness as an independent predictor of all-cause and cardiovascular mortality in hypertensive
patients, in elderly people and in patients with end-stage renal disease for CVD diagnosis [5-
12].
The more used noninvasive methods to assess the arterial stiffness is the arterial
pressure waveform (APW) analysis, which can comprises parameters such as augmentation
index (AIx) and pulse wave velocity (PWV). A few years ago, it was reported an acquisition
technique using piezoelectric (PZ) sensors to acquire APW. This technique revealed a good
performance in consequence of the high signal-to-noise ratio (SNR) as well as a high sensitivity
in in vivo acquisitions [13]. In the last years, several prototypes based on this technology were
also developed in Electronics and Instrumentation Group (GEI), namely: a double headed probe
(DB) for the estimation of the local pulse wave velocity [14, 15] and a suitable single-headed
PZ probe for measure the APW at the carotid artery [16, 17].
Another developments also included the development of a photoplethysmogram module
[18]. This simple device measures blood volume changes at peripheral sites. Nevertheless, a
large number of physiological parameters can be derived from it. Heart rate variability, vascular
assessment, blood saturation and cardiac output measurements are some examples of his
applications in health care [19].
All these modules were incorporated in a single platform – The multichannel platform,
where it was also of interest to implement an electrocardiogram (ECG) module. This module, so
often used in health care intuitions, gives important information about the heart activity. The
ECG can also be used for PWV measurements, where the ECG is used as a time reference.

Introduction
2
Although the invasive methods to access the central pulse pressure are accurate and
precise, it is an expensive and painful method. The multichannel platform has the potential to
extract important information regarding the cardiovascular conditions of the patients, through
the noninvasive acquisition of different parameters. Thus, the multichannel platform can be a
great advance in hemodynamic assessment, and its applications are widespread, where full
characterization of the patients can be done according to the parameters acquired.
1.2 Previous work
The hemodynamic condition assessment has an important role at GEI, where many
methods based on different recent technologies have been developed with the same goal –the
noninvasive hemodynamic assessment.
Studies reporting the use of electromechanical-based technologies as a solution for
pulse wave non-invasive assessment have been presented [9, 20]. A project led on GEI using PZ
showed good agreement between values obtained of the PWV and the augmentation index (AIx)
with the literature [21]. Subsequently, the PZ sensors were studied and then new PZ probes -
single and double headed - were developed for APW and PWV acquisitions, respectively. Great
advances have been made over the past years, whether on the development of algorithms
capable of extract important information from the APW acquisitions, whether on the hardware
developements [16, 17, 22, 23] . The PZ double headed probe used for measure the PWV has
also been widely characterized on test bench. It was demonstrated a good performance on these
tests [14, 15]. Afterwards, validation tests were also performed in pre-clinical trials, where it
was also found the best algorithm to measure the PWV from the pressure signals [24].
Another important device previously developed, was a photoplethysmographic (PPG)
probe for arterial blood pressure (ABP) assessment at peripheral sites [25].
The present work is a continuity of various projects developed at GEI, where the main
concern of this project was to incorporate all of them in one single platform, allowing the
noninvasive assessment of important physiological measurements. Moreover, all the modules
incorporated can be acquired at the same time. Each of the modules can give important
information about the cardiovascular condition, being possible the correlation of different
retrieved hemodynamic parameters.

Introduction
3
1.3 Goals
This project has as goal the development of DAQ software tools for the management of
the modules that integrate the multichannel platform. The validation of the work is
accomplished by a set of hemodynamic studies that comprise the synchronized data acquisition.
1.4 Thesis contents
This dissertation is divided in seven chapters. In the first chapter (Introduction) the
motivation of this thesis, the goals and a short overview of the previous work is presented.
Finally, the chapter-by-chapter structure of the entire thesis is briefly explained.
In the second chapter (Theoretical Background) it is presented the main concepts of
the cardiovascular system, arterial stiffness and its factors, the main methods for noninvasive
arterial assessment are also explained. The main concepts of the electrocardiography and the
photoplesmography are also here described.
The third chapter (Hardware) focuses on all the previously developed hardware present
on the multichannel platform.
In the fourth chapter (Interface), the Graphic User Interface (GUI) used to acquire the
signal presented on the multichannel platform is explained, where some details are briefly
described. The existence of the database -Cardiocheck – is also referred.
The fifth chapter (Methodology) focuses on all the procedures to extract information
from the data is fully explained. Here, the protocol made for the validation tests and the APW,
PPG and ECG signal analysis are described.
The sixth chapter (Results and Discussion) is directed to the presentation and
discussion of the results obtained from the validation test on group of the multichannel platform.
An example of the two different acquisitions setup is demonstrated. A study using the PPG as a
surrogate of the ECG regarding the heart rate variability assessment is exhaustive presented and
discussed. The evaluation of the algorithms for the ECG and PPG is subject of study. A study
regarding the second derivative of the PGG is performed.
In seventh and last chapter (Conclusion and Future Work), finals remarks from the
developed work are done. Suggestions of possible studies and features to be developed in the
future work are presented.

Introduction
4

Theoretical Background
5
2. Theoretical Background
2.1 Cardiovascular system
The cardiovascular system is composed by the heart, blood and vessels. The heart takes
place as the pumping station of the cardiovascular, where the blood is the working fluid which
travels along a complex branching configuration of blood vessels. This working system enables
the exchange of energy, momentum and products between cells and their surrounding
environment, by keeping the blood flow at an appropriate value [26]. Figure 1 shows a cross
section of the human heart.
Figure 1 - Cross section of the human heart with the course of the blood flow. Taken from [27].

Theoretical Background
6
2.1.1 The heart
The main function of the heart is to pump blood into and through vessels to and from all
parts of the body. The heart has four chambers. The upper chambers are called the left and right
atria, and the lower chambers are designated as the left and right ventricles. Septa, a muscle
wall, separate the heart in two sides, the left heart and right heart, where each has an atrium and
a ventricle. The atrium receives the blood and pump it into their respective ventricle, while the
ventricle is responsible to pump the blood to the lungs (right ventricle) or remainder part of the
body (left ventricle) [28].
There are four valves which regulate the blood flow on heart and restrict the blood
flowing backwards[28]:
The tricuspid valve controls blood flow between the right atrium and right
ventricle;
The pulmonary valve controls blood flow from the right ventricle into the
pulmonary arteries, where it will be oxygenated;
The mitral valve regulates blood flow from the left atrium into the left ventricle;
The aortic valve lets the oxygen-rich blood go through the aorta, and there to the
rest of the body expect the lungs.
The right ventricle functions at low- pressures (< 40 mmHg gauge) because of the
anatomic proximity of the lugs to the lungs. Thus, the right ventricle does not have to work hard
to pump the blood to the lungs. On the other hand left ventricle works at high pressures (up to
140 mmHg gauge or even more) to ensure the blood flow is driven on whole systemic
circulation [26].
2.1.2 Common carotid artery
The major source of blood to head, neck and brain is given by the left and right
common carotid artery (CMA). Both common carotid arteries bifurcate into internal and
external carotid arteries. The left and right common carotid artery has the same course, however
they have different origins. The left common carotid arises from the aortic arch in the superior
mediastinum, while the right common carotid originates in the neck from the brachiocephalic
artery [29].
In the Figure 2 can be seen the arteries present on the head and neck.

Theoretical Background
7
Figure 2 - Arteries of the neck and head. Taken from [30].
2.2 Arterial stiffness
The heart pumps the blood into the arterial system in a series of strong bursts. The
arterial walls have to stand the pressure caused by the injected blood from the left ventricle
causing distension and contraction for a proper functioning of all the cardiovascular system.
Arterial stiffness measures the lack of elasticity within the arterial wall, providing
important information about the properties of the wall material independent of the geometry [9,
31, 32]. Nowadays, arterial stiffness has been strongly related with the development of CVD [5-
12].
Arterial stiffness increases the velocity at which the pulse wave travels through the
vessels. It is responsible to cause a premature return of the reflected waves in late systole,
increasing the systolic blood pressure (SBP), and subsequently the central pulse pressure (PP).
Thus, the load on the ventricle is raised, reducing ejection fraction, which increases the
myocardial oxygen demand [6, 31, 32]. Another reason for the increase of the SBP is due to the
lack of distensibility and elasticity of stiffer arteries. Stiffer arteries cannot accommodate the
ejected blood by left ventricle, and for the same stroke volume, this result in an increase of the
SBP and central PP [33].
Theoretical Background
8
2.2.2 Proximal and distal arterial stiffness
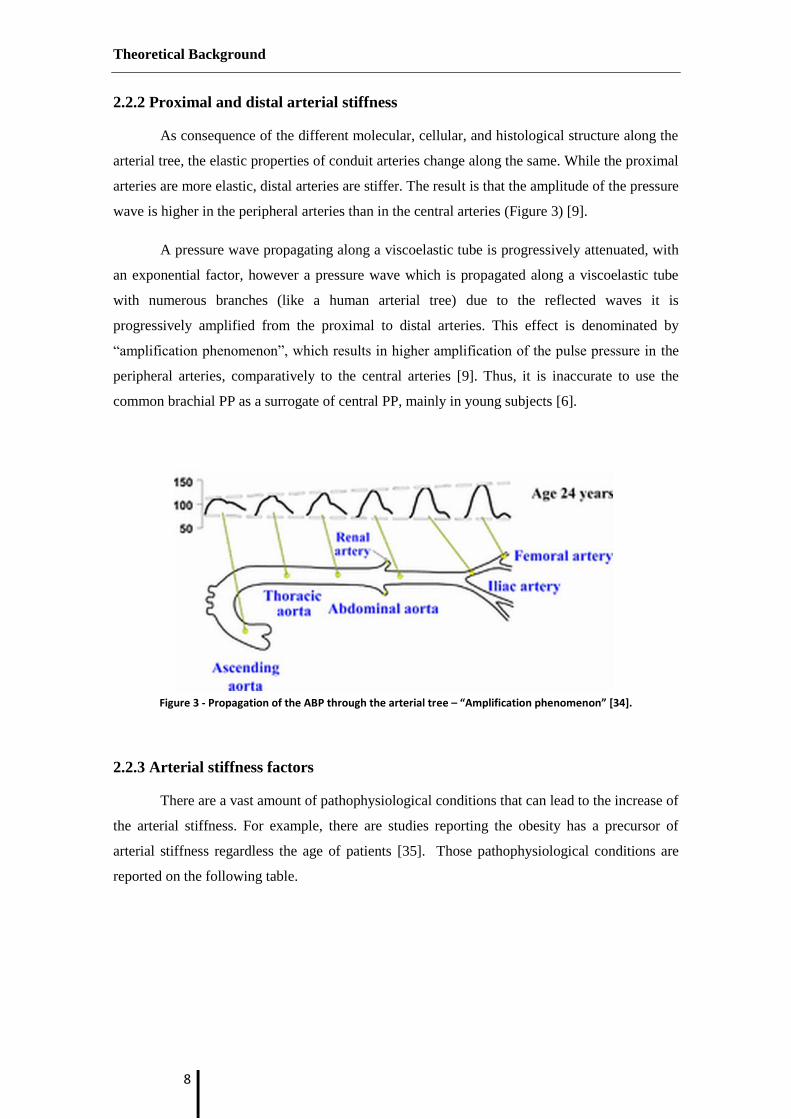
As consequence of the different molecular, cellular, and histological structure along the
arterial tree, the elastic properties of conduit arteries change along the same. While the proximal
arteries are more elastic, distal arteries are stiffer. The result is that the amplitude of the pressure
wave is higher in the peripheral arteries than in the central arteries (Figure 3) [9].
A pressure wave propagating along a viscoelastic tube is progressively attenuated, with
an exponential factor, however a pressure wave which is propagated along a viscoelastic tube
with numerous branches (like a human arterial tree) due to the reflected waves it is
progressively amplified from the proximal to distal arteries. This effect is denominated by
“amplification phenomenon”, which results in higher amplification of the pulse pressure in the
peripheral arteries, comparatively to the central arteries [9]. Thus, it is inaccurate to use the
common brachial PP as a surrogate of central PP, mainly in young subjects [6].
Figure 3 - Propagation of the ABP through the arterial tree – “Amplification phenomenon” [34].
2.2.3 Arterial stiffness factors
There are a vast amount of pathophysiological conditions that can lead to the increase of
the arterial stiffness. For example, there are studies reporting the obesity has a precursor of
arterial stiffness regardless the age of patients [35]. Those pathophysiological conditions are
reported on the following table.

Theoretical Background
9
Table 1- Factors that affect arterial stiffness [9].
Ageing Risk Factores CVD
Other physiological conditions Obesity Coronary heart disease
Low birth weight Smoking Congestive heart failure
Menopausal status Hypertension Fatal stroke
Lack of physical activity Hypercholesterolaemia Primarily non – CVD
Genetic background Impaired glucose tolerance End – stage renal disease
Parental history of hypertension Metabolic syndrome Moderate chronic kidney
disease
Parental history of diabetes Diabetes type 1 and 2 Rheumatoid arthritis
Parental history of myocardial infarction Hyperhomocyteinaemia Systemic vasculitis
Genetic polymorphisms High C – Reactive Protein
(CRP) Systemic lupus erythematosus
2.2.3.1 Aging
Age is one major causes of arterial stiffness. In normal aging process peripheral
muscular arteries changes are minimal. However, in large arteries age has a great influence,
which can be accelerated by coexisting cardiovascular risk factors, like hypertension and
diabetes.
The longstanding arterial pulsation is responsible by changes on the structural matrix
proteins, collagen, and elastin in the arterial, disrupting of muscular attachments and causing
elastin fibers to fatigue and fracture. Accumulation of advanced glycation end-products on the
proteins alters their physical properties, calcium deposition are others causes which results in
arterial stiffness [33]. The major contribute for arterial stiffness is the progressive elastic fiber
degeneration [9, 33, 36].
2.3 Arterial pressure waveform
The APW morphology contains important key points that allow the hemodynamic
parameters assessment. Nowadays, many methods are used to acquire the APW, invasive
methods like catheterization, and lately, noninvasive such as applanation tonometry or PZ
probes [37].
The APW can be measured at central or peripheral level. The central level is preferable
for the APW acquisition, since central level, like ascending aorta, surrogates the true load
imposed to central large artery walls and left ventricle. For measurements at peripheral levels,
such as radial, brachial or femoral artery, for the same pressure the APW has a different pulse

Theoretical Background
10
pressure and wave shape than the APW acquire on the central level, due to changes in arterial
elasticity and dimensions along the arterial tree (Figure 3). However, the relation between
central and peripheral pressure can be quantified and it can be used a transfer function to
reconstruct aortic waveform [38]. Carotid and central arteries have similar waveforms, thus a
measurement at carotid arteries is desirable since it does not need to use a transfer function.
These leads to an increases the data precision, even though, it requires a higher degree of
technical expertise [39].
2.3.1 APW morphology
The APW is composed by two types of waves: a forward travelling incident wave,
resulted by the ejected blood by the left ventricle during systole, and the backward reflected
wave from the periphery, caused by arterial tree branch points or sites of impedance mismatch
[36, 37].
Figure 4 -The arterial pressure waveform as a result of the sum between the incident and the reflected pressure
wave. Adapted from [40].
2.3.1.1 Incident wave
The capacitive of the ascending aorta, which receives the blood pumped by the left
ventricle, gives origin to an incident wave [38]. Thus, the characteristics of the incident wave
rely on the left ventricular ejection and stiffness of the aorta [36].
There are two points of interest in the incident wave: the systolic peak (SP) and the
diroctric wave (DW), also called incisura. The SP is the point of highest pressure of the APW,
while the DW is the result of the closure of the aortic valve. DW is commonly used to determine
the left ventricular ejection period (LVET) parameter [38, 41].

Theoretical Background
11
2.3.1.2 Reflected wave
The blood injected pump by the left ventricle towards the peripheral arteries, finds
bifurcations on its path, which blocks its flow, causing a reflection of the PP which travels back
to the heart [42]. However, due to the gradual increase of stiffness and decrease in size from the
central to the peripheral arteries, wave reflections do not just occur at specific sites of
impedance mismatch, but are continuously and diffusely generated all along the arterial tree
[31]. The characteristics of the backward reflected wave are influenced by the distance to
reflections sites and the reflection coefficients and elastic properties of the arterial tree [36].
The sum of the reflected wave with the incident wave induces a momentary rise of the
pressure on APW – the point of inflection (Pi).
2.3.2 APW types
Murgo et al. (1986) proposed a APW classification based on his morphology [43],
where the morphology is determined by the reflected wave location. This classification
considers four different waveform types, as depicted in Figure 5.
Time (ms)
Am
plit
ud
e (a
.u)
Time (ms)
Am
plit
ud
e (a
.u)
Time (ms)
Am
plit
ud
e (a
.u)
Time (ms)
Am
plit
ud
e (a
.u)
Type A Waveform Type B Waveform
Type C Waveform Type D Waveform
SPPI
DW
SP
DW
SP PI
DW
SP
PIDW
Figure 5- APW classification according to Murgo el al., where Pi is the inflection point, SP is the systolic pressure and DW is the dicrotic wave [39].
Theoretical Background
12
2.4 Noninvasive assessment of arterial stiffness
Arterial stiffness can be quantified through different hemodynamic parameters. The
measurement of arterial stiffness gives relevant information about the cardiovascular risk of the
patients.
In this section it will be discussed the most used parameters for arterial stiffness
assessment.
2.4.1 Pulse pressure
Pulse pressure (PP) is simply the difference between systolic and diastolic pressure. It is
a valuable marker for arterial stiffness and is an independent predictor of cardiovascular risk in
general population [44]. PP is determined by the interaction of cardiac factors (stroke volume
and ejection time) and vascular factors (arterial stiffness and arterial wave reflections) [37]. It is
known that PP increases with advanced age [45].
PP is commonly measured at the cuff brachial artery using a sphygmomanometer.
However, this measurement does not always accurately reflects the true central PP, since there
is an amplification of the pressure along the arterial tree, which constitutes a potential source of
error [31, 32, 38, 39]. Nevertheless, there are numerous studies reporting the brachial PP as
good marker of arterial stiffness for elderly people (more than 50 years old) [46, 47]. The
accuracy of the brachial PP for elderly people occurs due to the decrease of differences between
carotid and brachial PP for these populations [48]. This can be explained by the decrease of
pulse wave amplification over the age [37, 47].
2.4.2 Arterial compliance and distensibility
To record these hemodynamic parameters it is necessary a device capable to record the
maximum and minimum arterial diameter, such as a magnetic resonance imaging (MRI) or an
ultrasound. The use of ultrasound has the disadvantages of the limited resolution, which can be
a problem to detect small changes in vessel diameter, and it is technique hard to expertise [37].
Arterial compliance (C) traduces the elastic properties of the arteries and it is defined as
the change in volume for a given pressure, reflecting the change in artery diameter caused by
left ventricular ejection. The arterial distensibility (D) is proportional to arterial compliance (as
we can see on the equation below), and is the quotient of the C by the initial volume.

Theoretical Background
13
(2.1)
(2.2)
with ∆A is pulse cross-sectional area (∆A = As - Ad), where As stand for systolic cross-
sectional are and Ad for diastolic cross-sectional area [39].
Reduced arterial compliance and distensibility is a consequence of loss of arterial
elasticity.
2.4.3 Augmentation index
Augmentation index (AIx) is frequently considered to be an index of arterial stiffness,
and thus, a predictor of cardiovascular risk [36, 49]. AIx measures the contribution of the
reflected wave relative to the total APW, and is equal to the difference between the second and
first peaks as a percentage of PP [39]. The Figure 6 illustrates how the AIx can be retrieved by
the APW.
Many factors influences AIx, such age, PWV, traveling distance of pressure waves
(body height) and reflective properties of the arterial system [44, 50]. AIx is also influenced by
blood pressure, and more importantly, by heart rate [51]. The AIx is determined by the
following equation:
(2.3)
Where AP stands for augmentation pressure, and P1 and P2 are the first and second
pressure peaks, respectively.
Theoretical Background
14
Figure 6 - Augmentation pressure (AP) as the difference between the systolic pressure and the inflection point pressure and pulse pressure (PP) measurements [47].
As it is perceptible, the AIx value depends if the reflected wave occurs prior or after the
systolic peak. Thus, the AIx is computed according to the APW morphology as described in
Table 2. The AIx is the proportion of central PP that results from arterial wave reflection.
Table 2 - Classification of the different APW according to the inflection point position and AIx calculus, where PS is
the systolic pressure, Pd the diastolic pressure and Pi the pressure in the inflection point [39].
APW Type APW Properties AIx calculus
A
The inflection point occurs before the systolic peak.
The AIx is positive, and indicates high arterial
stiffness.
B
The inflection point occurs shortly before the systolic
peak, indicating small arterial stiffness.
C
The inflection point occurs after the systolic peak. The
AIx value is negative, and indicates an elastic and
healthy artery.
D
The inflection point cannot be recognized because the
reflected wave arrives in early systole and merges with
the incident wave.
-
Theoretical Background
15
The AIx of the APW type D (Table 2) cannot be calculated, since the inflection point is
not visible. The APW type D can occur for young people, where the reflected wave coincides
with the diastolic pressure, but also for elderly subjects, where the reflected wave arrives earlier
overlapping with the systolic pressure [47].
Typically, AIx is negative in healthy young people, but with aging, AIx becomes
increasingly positive, due to significance change in the APW morphology. Several studies
reported the relationship of AIx with ageing, where AIx becomes higher with the aging process
[36, 52, 53].
In some recent studies AIx has predicted mortality for patient with a normal PWV (less
than 11 m/s), which highlights the importance of assessing arterial wave reflection, over than
the pulse wave velocity (PWV) [54].
2.4.4 Pulse Wave Velocity
Pulse wave velocity (PWV) is the speed at which the APW generated by cardiac
contraction travels from aorta through the arterial tree, and so, a higher coefficient of arterial
stiffness corresponds to higher PWV values [55].
While AIx is an indirect surrogate of arterial stiffness, PWV is a direct measure of
arterial stiffness and also the most used technique for arterial stiffness assessment. PWV is
simple, reproducible and robust noninvasive technique. Several studies have reported PWV as
an independent predictor of CVD [9, 54, 56, 57]. However, PWV increases with an increase in
blood pressure, which can be lead to less accurate values of PWV [47].
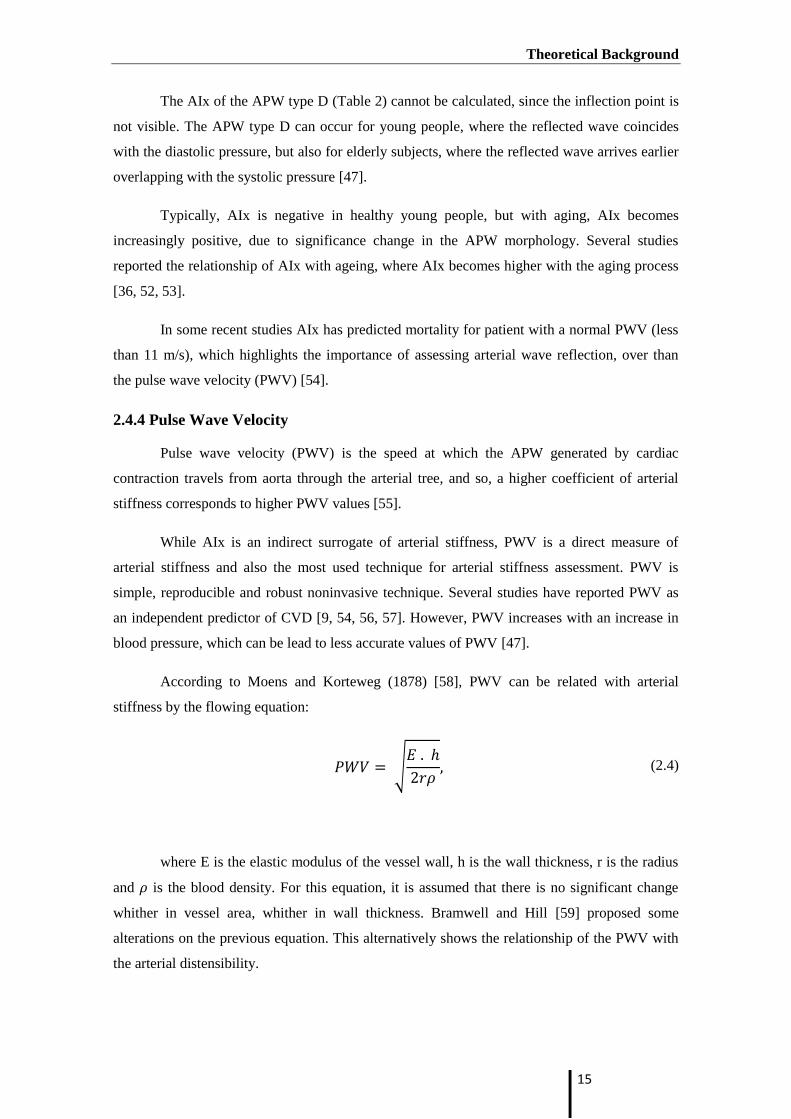
According to Moens and Korteweg (1878) [58], PWV can be related with arterial
stiffness by the flowing equation:
√
(2.4)
where E is the elastic modulus of the vessel wall, h is the wall thickness, r is the radius
and is the blood density. For this equation, it is assumed that there is no significant change
whither in vessel area, whither in wall thickness. Bramwell and Hill [59] proposed some
alterations on the previous equation. This alternatively shows the relationship of the PWV with
the arterial distensibility.

Theoretical Background
16
√
√
(2.5)
where P is the pressure, V is the volume, is the blood density, D the volume
distensibility of the arterial segment and dP . V / dV stands for volume elasticity.
PWV depends on geometric (h and r) and elastic (D) properties of arteries, as the
previous equation shows. Thus, since the arterial tree varies along (as mention in Section 2.2.2)
the PWV will also have different standard values for each site.
Practical PWV assessment, as described in the following equation, is defined by the
distance between the two sites and the time delay (Δt) between the two pressure waves recorded
in arterial system. This two measurement sites should lie on a peripheral artery that can be
palpated from the body surface [47]. The distance is determined on the body’s surface between
the recording sites, which can lead to inaccurate PWV measures, since it does not correspond to
the real distance [56].
(2.6)
many arterial segments have been used in literature , such as, radial-tibial, brachial-
ankle, carotid-radial, brachial-radial and femoral-tibia, but the most commonly used and
considered as the “gold-standard” is carotid-femoral segment [9, 40]. The carotid-femoral is the
best surrogate of the aortic PWV, which has high clinical value for evaluation of the arterial
stiffness. Aortic PWV values greater than 13 m/s represents a strong predictor of cardiovascular
mortality in hypertension [60, 61].
2.4.4.1 Regional pulse wave velocity
Regional pulse wave velocity (RPWV) measurement is when PWV is acquire over a
long segment of the arterial tree with different mechanical characteristics (elasticity, wall
thickness and diameter) [40]. The RPWV results in an average PWV over a long arterial
segment often composed both from elastic and muscular arteries, and therefore, it is not as
accurate as the local pulse wave velocity [62].
To measure the RPWV it is needed to calculate the transit time (TT) and the distance
between the two sites, where the devices are placed.
Currently, different methods are used to calculate the arterial tree segment distance,
such as depicted in Figure 7[9, 56].

Theoretical Background
17
Measure the distance between the measurement sites on the surface body (Ldirect);
Subtract the distance from carotid location to the sterna notch with the distance
between sterna notch and femoral artery site of measurement (Lsub).
Figure 7 - Different method to measure the path length [56]
Although the first method is simpler, the second method is a more accurately approach
to the real distance, since it takes in count that carotid and femoral pulses waves travel in
opposite directions [62]. Therefore, the second method is preferable between both.
Nevertheless, there is not yet a precise method to calculate the distance, due to the trajectory and
curvature of vessels in the arterial tree [56].
There are many methods used to measure TT, but most of them are based on the same
principle: to detect a characteristic point of the wave over the two sites recorded.
As the wave travels through the arterial system, its waveform is changed because of the
differences in arterial wall properties along the path. Thus, the characteristic time-point used to
identify the reference of the wave can be shifted to a different position within the waveform,
which results in inaccurate estimation of the TT [62]. There are many references point on the
pulse wave, such as, the systolic upstroke also known as ‘foot’ point or the SP. The systolic

Theoretical Background
18
upstroke is more commonly desirable to be chosen among all the references points, since it is
hardly affected by the wave reflections, enabling a more accurately measure of the TT [56, 62].
The Figure 8 shows an example the measurement of the carotid-femoral PWV.
Figure 8- Measurement of carotid-femoral PWV [56].
Another method to calculate the TT is to gate the separated recordings to a fixed point
in the cardiac, usually the R wave of the ECG (as it is described on Figure 9) [37, 54].

Theoretical Background
19
Figure 9 - Transit time measure with an ECG as reference [61].
2.4.4.2 Local pulse wave velocity
In contrast with RPWV, the local pulse wave velocity (LPWV) is measured over a short
segment of an artery. As mention on the equation 5 there is an relationship between LPWV and
distensibility. Therefore, it is possible to determine the LPWV from a local distensibility
measurement (through assessment of local pulse pressure and diameter) [40]. Another way, to
measure the LPWV is from a simultaneous measurement of APW by two sensors at close
positions. Where, the distance between the two sensors is known and the TT is measured by the
time delay between the two recorded waves [61, 63].
An advantage of LPWV regarding the arterial stiffness at common carotid artery, is that
it measures the only PWV of common carotid artery, whereas the RPWV measures the average
PWV along a segment with different proprieties. Thus, LPWV gives relevant information about
the local arterial condition, however, because it is calculated by short the distance between two
recordings sites, it has a greater absolute error in determining the TT [9, 37].
A new technology based on PZ sensors have recently been reported for LPWV
assessment [14, 15].

Theoretical Background
20
2.5 Photoplethysmogram
The photoplethysmogram (PPG) is a simple and low-cost optical technique used to
detect blood volumes changes in microvascular bed of tissues, like the arteries at the finger.
PPG has various applications in various physiological conditions, such as vascular assessment,
clinical physiological monitoring and automatic function study [64].
2.5.1 Operation Principle of PPG
PPG is compounded by a light source to illuminate the tissue and a light detector that
measures the transmitted or reflected light [64].
To detect the changes in volume a wavelength in the visible (red) and near infrared (IR)
is used. At these wavelength spectrum one of the main absorbers of light in this spectrum is the
haemoglobin, which has two modes: oxyhaemoglobin ( and reduced haemoglobin (
[64]. Thus, the attenuation of light at the tissue is given by the following equation:
[ ( ( ] [Equation 2.7]
where, IL is the minimal light intensity received (occurs at systole), IH is the maximal
received light received (occurs at the end of diastole), ( is the extinction coefficient or
absorptivity of the medium for a particular wavelength, is the concentration of the absorbing
substance, is the change in optical path length during the cardiac cycle (Figure 10) [25]. A
more detailed explication and the demonstration on the previous equation was presented by
Santos, P. [25].
Volume at blood vessels is constantly changing, due to the heart’s activity. In systole,
the blood is ejected by the ventricles though the arteries trees causing an increase in blood
pressure and consequently an increase in volume at blood vessels. Then during diastole, the
blood returns again to the heart leading to a decrease in blood pressure and volume in the blood
vessels. This blood volume variance alters the amount of light which is detected at the detector
of the PPG [64].
Theoretical Background
21
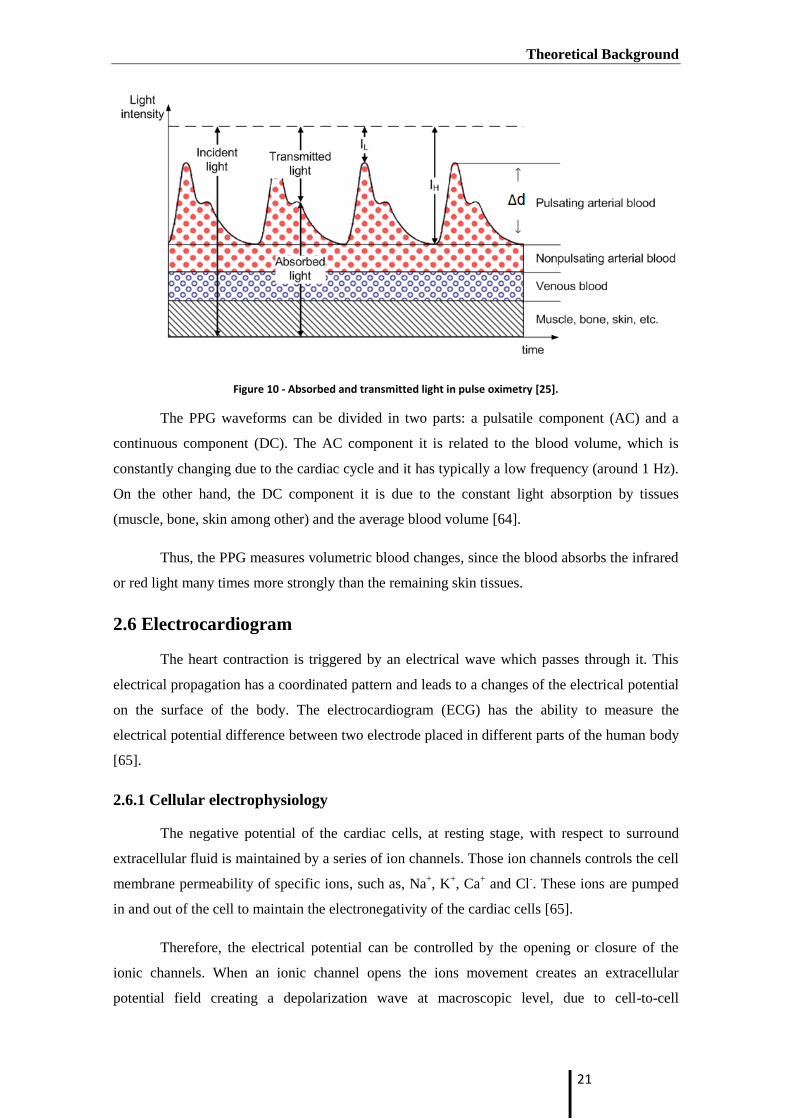
Figure 10 - Absorbed and transmitted light in pulse oximetry [25].
The PPG waveforms can be divided in two parts: a pulsatile component (AC) and a
continuous component (DC). The AC component it is related to the blood volume, which is
constantly changing due to the cardiac cycle and it has typically a low frequency (around 1 Hz).
On the other hand, the DC component it is due to the constant light absorption by tissues
(muscle, bone, skin among other) and the average blood volume [64].
Thus, the PPG measures volumetric blood changes, since the blood absorbs the infrared
or red light many times more strongly than the remaining skin tissues.
2.6 Electrocardiogram
The heart contraction is triggered by an electrical wave which passes through it. This
electrical propagation has a coordinated pattern and leads to a changes of the electrical potential
on the surface of the body. The electrocardiogram (ECG) has the ability to measure the
electrical potential difference between two electrode placed in different parts of the human body
[65].
2.6.1 Cellular electrophysiology
The negative potential of the cardiac cells, at resting stage, with respect to surround
extracellular fluid is maintained by a series of ion channels. Those ion channels controls the cell
membrane permeability of specific ions, such as, Na+, K
+, Ca
+ and Cl
-. These ions are pumped
in and out of the cell to maintain the electronegativity of the cardiac cells [65].
Therefore, the electrical potential can be controlled by the opening or closure of the
ionic channels. When an ionic channel opens the ions movement creates an extracellular
potential field creating a depolarization wave at macroscopic level, due to cell-to-cell

Theoretical Background
22
propagation of the electrical event. However, when ionic channels closes, this ionic flow is
interrupted and the membrane potential returns return to its resting stage (repolarization). The
cardiac cycle is initiated by the cardiac cell depolarization, also known as P wave [65].
2.6.2 PQRST complex
The P wave is the first wave of the ECG and represents the spread of the electrical
impulse through the atrial musculature (depolarization). This electrical impulse is then
conducted from the atria through the A-V node and the His-Porjinje system. Then, the ventricles
are excited and they contract forming the most important complex in ECG, the QRS, where Q
wave is the initial downward deflection, R wave is the initial upward deflection and S wave is
the terminal downward deflection. The last wave is known as the T wave as represents the
ventricular repolarization [66]. In the following figure it is possible to observe all the previously
compounds described.
Figure 11 - One cycle of a typical ECG signal [67].
2.7 Commercial devices for noninvasive of arterial stiffness assessment
Currently, several non-invasive methods are used for vascular stiffness assessment.
While, local and regional arterial stiffness can measured directly at various sites along the
arterial tree, systemic arterial stiffness can only be estimated from models of circulations [9].
The main features of devices and methods currently used according to Laurent et. al
(2006) are described on the following table:

Theoretical Background
23
Table 3 - Devices and methods used for arterial stiffness measurements and wave reflections [9].
Device Methods Measuring site
Local Stiffness
WallTrack® Echotracking CCAb,CFA,BA
NIUS® Echotracking RA
Artlab® Echotracking CCAb,CFA, BA
Various vascular
ultrasound systems
MRI device
Echotracking
Cine-MRI
CCAb,CFA, BA
Ao
Regional Stiffness
Complior® Mechanotransducer Aortic PWVa
Sphygmocor® Tonometer Aortic PWVa
Walltrack® Echotracking Aortic PWVa
Artlab® Echotracking Aortic PWVa
Ultrasound Systems Doppler probes Aortic PWVa
Systemic Stiffness
(waveform shape
analysis)
Area method Diastolic dexay
HDI PW CR-2000® Modif. Windkessel
SV/PP Stroke volume and
pulse pressure
Wave Reflections
Sphygmocor® AIx All superficial arteries
Pulse Tracer® Finger
photoplethysmography
Finger
Ao, aorta; CCA, common carotid artery; CFA, common femoral artery; BA, brachial artery; RA, radial artery; SV/PP, stroke volume/ pressure.
a Aorta, carotid-femoral, also carotid-femoral and femoro-tibial PWV
b All superficial arteries, including particularly those mentioned

Theoretical Background
24

Hardware
25
3. Hardware
3.1 Multichannel platform
The Multichannel Platform has incorporated four modules for hemodynamic
assessments and one other dedicated to the synchronization mechanism. There is also a data
acquisition board (DAQ) and a power supply +12V in it. The 12V from the battery is used to
supply others stages from the different modules (see Table 4).
Table 4 - Power supply requirements for each modules
Module Power
ECG module +5V / -5V
APW module +3.3 V, +5V/-5V
PWV
PPG
+15V / -15V
+3.3 V, +5V/-5V
Nidaq Power Supply +5V
The multichannel platform integrates the following modules:
The arterial pressure wave (APW) module for pulse wave contour analysis
developed for CCA measurements (Figure 12 - B).
The electrocardiogram (ECG) module to record the hearts activity. At this module
is also couple a synchronization module to determine the delay between the
modules which receives the data through a RS232 connection and the modules
which data is transmitted through the NI6210 DAQ module (Figure 12 – C).
The pulse wave velocity (PWV) module for local pulse wave velocity assessment
at CCA (Figure 12 – D).
A photoplethysmography (PPG) module to acquire the blood volume pulse at the
peripheral arteries (Figure 12 – E).
NI6210 DAQ module (Figure 12 – F).

Hardware
26
Figure 12 - Multichannel Platform. (A) Power Supply; (B) APW module; (C) ECG probe integrated with synchronization module; (D) PWV module; (E) PPG module; (F) NIdaq-6210
3.1.1 Acquisitions system
On the acquisition system there are two different of acquisitions module: the APW
acquisition module (PIC33FJ256GP710) and a dedicated data acquisition board (DAQ) module.
The APW acquisition module is efficiently capable of acquire the pulses from the
subject and to send the data acquired to the laptop by a RS232 connection with a sample rate of
1 kHz. However, the others modules (such as the ECG, PPG or PWV) need a dedicated module
- the DAQ module - to send the data acquired to the PC through a USB cable.
The DAQ used was a National Instruments® (NI) NI6210 (Figure 13) with 16 analog
inputs, 16-bit resolution and it can sample up to 250 kS/s. The data acquisition and analysis was
done using Matlab – a powerful instrumentation and analysis programming language for PCs.
All the signals were sampled at 20 kHz [68].

Hardware
27
Figure 13 - DAQ -NI USB 6210
3.1.2 Schematic
The current set up of the BUS lines of the Multichannel Platform is presented on the
Figure 14.
4 12 14 40 42 44 46 48 50 52 54 56 58
GN
D
62 642
3 11 13 39 41 43 45 47 49 51 53 55 57
GN
D
61 631
...
...
...
...
GN
D
...
...
ANALOGIC INPUTS
ANALOGIC INPUTS
+15V
+15V
-15V
-15V
-5V +5V
+5V-5V
+3.3V
+3.3V
APW NG PIC PPG ECG PWV NG NI
Legend
Figure 14 – Schematic of the Multichannel Platform
Hardware
28
Where the synchronization module is represented as NG (noise generated), and PIC
stands for the microcontroller presented on the APW module. All the modules, except the APW
are acquired though the National instrumental data acquisition board (Nidaq).
3.3.1 Arterial pressure waveform module
The arterial pressure waveform (APW) module (Figure 15) is able to record and storage
the waveform in a digital format, enable future processing of the data acquired. This module
consists of one PZ transducer probe and a signal conditioning, responsible to filter and amplify
the signal.
Figure 15 - APW module
3.3.1.1 Piezoelectric sensor
Piezoelectric (PZ) sensors are able to measure pressure, acceleration, strain and force
into a proportional measurable voltage signal. Some peculiar characteristics of the PZ sensors
are their low cost, high rigidity, high sensitivity and high SNR. Those characteristics made them
a desirable sensor for hemodynamic purposes. These sensors have been widely used for the
hemodynamic parameter assessment, such as to APW analysis [16, 17] and PWV measurements
[14, 15].

Hardware
29
The single PZ probe used on APW (Figure 16) is compounded by one PZ transducer
bonded to a plastic block that supports bending under normal use. A mushroom interface was
assembled over the PZ element.
Figure 16 - PZ sensor. (A) Probe elements in cut, (1) mushroom - shaped interface, (2) PZ disc sensor and (3) printed circuit board (PCB). (B) Outer upper view of the single headed PZ probe [16].
A study executed by Almeida el al (2011) proved that a pointy probe, which contacts
directly with the sensor, has best performance over a flat and an intermediate probe. The pointy
probe selected showed the lowest root mean square (RMSE) variance among all the three PZ
probes [16].
3.3.1.2 Signal conditioning circuit
The signal conditioning circuit architecture consists of three main parts: a power supply
module, a first amplifying stage and a processing module. The power supplied via an USB cable
is connected to a personal computer. In the first amplifying stage, an active differentiator mode
amplifier amplifies the raw signal. Afterwards in the processing module, a peak detector with a
timer is used to extract the reference time signal associated to the signal peak [16]. Due to the
nature of the signal obtained, which is a time derivative of the physiological signal, it must,
therefore, be integrated by a Microchip® (Chandler, Arizona, USA) dsPIC33 microcontroller.
3.3.2 Pulse wave velocity module
The pulse wave velocity (PWV) module (Figure 17) allows the assessment of two
signals: the derivate of the pressure waveform (obtained by the piezo-electric effect – the PZ
signal) and the arterial blood pressure waveform (integrated PZ signal). Those signals are
recorded and saved in a digital format, allowing future data processing.

Hardware
30
Figure 17 - PWV module.
This module consists of one double headed PZ probe transducer probe within a signal
conditioning, responsible to filter and amplify the signal.
3.3.2.1 Double PZ Headed probe
Figure 18 - Double headed probe. (1) Thin film PZ sensors.
The PZ probe is a double headed probe, which consists of two circular-shaped PZ
sensors (MURATA 7BB-12-9 Sounder, 12mm of diameter), placed 23mm apart. This new
conception of a thin film PZ was assembled regardless the previous mushroom-shaped PVC,

Hardware
31
since it is more manageable. This characteristic was desirable, because of the difficult to place
the double PZ sensor over the CCA [14, 15]. The same setup of PZ sensor were also referred in
literature for hemodynamic assessments [20].
A RJ45 connector allows connecting the double PZ sensor to the multichannel platform.
3.3.3 Photoplethysmography module
The photoplethysmography (PPG) module (Figure 19) is able to connect a PPG probe
and it is also setup for use of accelerometers. The accelerometers have important role to prevent
the distortion of the PPG signal due to the movement of the subject.
Figure 19 - PPG module.
The PPG system has five important modules (Figure 20): LED driver, photodetection,
sample-and-hold, transimpedance and an low pass filter.

Hardware
32
LED DRIVER
ON
OFF
ON
OFF
RED
INFRARED
PHOTOPLETHYSMOGRAPHPROBE
RED
INFRARED
+
-
RED
INFRARED
Sample
&
Hold
TRANSIMPEDANCESAMPLE & HOLD
RED
Time (s)
Am
plitu
de (
V)
INFRARED
Am
plitu
de (
V)
Time (s)
LOW PASS FILTER
Figure 20 - Schematic of the hardware on the PPG.
The photoplethysmographic module employs two wavelengths red and infrared. The
PGG was assembled with those two wavelengths, useful to oxygen saturation measurements.
Due to the existence of only one photodetector, the two LEDs are used in opposite phase. Thus
when the red is ON, the infrared is OFF and vice-versa. A microcontroller unit (MCU) defines
which LED is ON and which is OFF, thus, just one LED is polarized each time. Those LEDs are
supplied with a constant current source, maintaining a constant brightness [18].
Within the finger probe, the LEDs emit a beam on the finger, which it is detected by a
silicon photodiode on opposite side of the LEDs. This photodiode is coupled with a
transimpedance, to convert the light received by the photodiode into a voltage proportional to
the light received [18].
The LEDs used have different optical power and the extinction coefficients of the
involved tissues are different for both, and so it is convenient separate the two signals.
Therefore, a sample-and-hold ciruit (S/H) was used. The function of S/H is to sample the
voltage of the analogue signal and then hold that voltage for a certain period of time. An S/H is
compounded by a circuit with an input voltage buffer, an interrupt, a capacitor and an output
buffer. [18].
Then, after the signals being separated by the S/H, it is possible to filter the signal in
order to remove some undesirable components, typically noise. This noise is a high filter, and
so, to remove it a low-pass filter with a cutoff frequency of 20 Hz was implemented. This filter
also helped to prevent aliasing. For more details about the PPG hardware see P. Santos [25].
3.3.4 Electrocardiogram and Synchronization module
The module illustrated in the Figure 21 has both components the ECG and the
Synchronization.

Hardware
33
Figure 21 - ECG and synchronization module.
3.4.4.1 Synchronization
Since the communication from all modules is not the same, a synchronization module
was developed to determine the delay between the acquisitions made through the two different
DAQs. The synchronization module is a simple noise generated which is then amplified. Both
DAQs acquired this signal in order to know the shift between both DAQs. By matching the
signal acquired from the two different DAQs it is possible to measure the time delay between,
and put the same reference time on the signals acquired by the different DAQs.
3.3.4.2 Electrocardiogram
The ECG signal is acquired through the Nidaq (Figure 14). Afterwards the signal is
record and storage in a digital format, allowing future data processing.
The configuration used for the ECG was a three leads. On this configuration, three
electrodes are placed on the surface of the body, one on each arm and the last one on the left leg,
forming the triangles of Einthoven. The ECG records the voltage difference between any two

Hardware
34
electrodes. And so, on this configuration it is possible to form three different leads (Figure 22)
[26].
Figure 22 - Proper placement of the limb electrodes for a 3-lead ECG [69].
LEAD I = VLEFF ARM – VRIGHT ARM
LEAD II = VLEFT LEG – VRIGHT ARM
LEAD III = VLEFT LEG – VLEFT ARM
The Biopac® disposable Ag-AgCl electrodes (EL503) (Figure 23) were the electrodes
chosen for the ECG acquisitions. This type of electrodes is appropriate for short-term
recordings, because of their peculiar characteristics. They are high chloride and pre-gelled
electrodes with a circular contact area diameter of 10 mm, a backing diameter of 35 mm [70].
These electrodes convert the ionic current flow over the surface of the body to the electron flow
of the metallic wire.

Hardware
35
Figure 23 - Biopac® disposable Ag-AgCl electrodes [67].
In order to remove some noise on the ECG it was implemented a low pass filter with a
cutoff frequency of 106 Hz.

Hardware
36

Interface
37
4. Interface
4.1 Interface - main menu
A graphical user interface (GUI) was developed in order to record, visualize and store
all signals presented on the multichannel platform. This Interface was developed in Matlab®
and it was assembled to be as simple and intuitive as possible.
1
2
3
4
Figure 24 - Graphical user interface of the multichannel platform. The GUI has the following filed: (1) signals to acquire, (2) signal to display, (3) start/stop/save the acquisition and (4) display window.
First the operator must select the signal to acquire (Figure 24 -1). Currently, the
multichannel is prepared to have fours distinctive probes: APW, PWV, ECG and PPG, such as
described in chapter 3. The communication of the APW module is made through a RS232
converter connected to the PC by a USB port, while all the others (PWV, ECG and PPG) are
acquired by a USB port through the NI6210 module.
All the setup is made automatically when the operator chooses the signal. The APW is
acquired at a sample rate of 1 kHz. On the other hand, the signals acquired through the NIDaq
are acquired with a sample rate of 20 kHz. This discrepancy of sample rates is required by the
PWV module. The PWV measurements require a high sample rate, since the two PZ sensors are
placed apart with a small distance. Therefore, an accurate PWV computation, which is on order
of 10m/s, requires a high sample rate.
The interface enables to acquire one signal but not to show if the operator so desires. On
the checkbox it is selected the signal to record and on the pop menu (Figure 24 – 2) it is selected

Interface
38
the signals to visualize. Whenever a signal is selected to be acquired on the checkbox it is
added the signal as option on the popup menu (Figure 25). This simple feature allows
decreasing the time needed to setup the interface for the acquisition.
Figure 25 - Demonstration of the Popup feature developed.
The scheme on the Figure 25 shows the automatic setup of the popup menu for one
acquisition by steps. From step 1 until the step 3 the user is selecting the signals to acquire and
the GUI automatically selected signals by order on the various popup menus. Nevertheless,
when the user unselect one signal to acquire (step 4 on Figure 25), the GUI delete this option
from the popup menu and maintain the others options selected. This function was implemented
on the GUI for the Multichannel platform to shorter the time needed to set up the GUI to
acquire the signals, since commonly the signals that the user wants to acquire, also wants to see
them.
4.1.2 Signals present on the multichannel platform
The ECG is composed by one only signal, whereas the PPG has two signals, one for the
wavelength (red and infrared). For each PZ sensor there are two signals the PZ signal (derivate
of the pressure waveform) and the integrated PZ signal (the ABP waveform). Since the PWV
probe has two PZ sensors and the APW only one, the PWV acquisition results in four signals
whereas the APW signal results in two signals. Because of the time shift between the APW and
the others signals, caused by different medium of communication, a synchronization signal was
added allowing to quantify the time shift between them. The synchronization signal is recorded

Interface
39
when an acquisition when two probes are selected, where mandatorily one of them is the APW.
The following table resumes all the signals which can be acquired through the multichannel
platform.
Table 5 - Signals acquired through the multichannel platform.
DAQ Probe Signals
PIC APW
Pressure waveform derivate
Integrated PZ signal
Synchronization Noise generated
NIDaq
ECG ECG signal
PPG Red wavelength
Infrared wavelength
PWV
PZ1 - Pressure waveform derivate
PZ1 - Integrated PZ signal
PZ2 - Pressure waveform derivate
PZ2 - Integrated PZ signal
Synchronization Noise generated
4.1.3 GUI signals display
In order to have a bigger temporal resolution, during the acquisition of the multiple
signals only the last 5 seconds of each signal are displayed. Otherwise the signal would be
continuously compressed into the window size (Figure 24 - 4), which leads also to a decrease in
the time resolution. This option also saves the graphical resources of the laptop, since it only has
to display the last 5 seconds of the signal, while the others part of the data is stored in the
system.
Another issue about the signals display is related with the amplitude resolution. The
amplitude resolution of the signal will be lower as more signals are acquired, since the size of
the window panel to display the signal is limited. Nevertheless, only some signals are displayed
for each probe when they are selected (Table 6).

Interface
40
Table 6 - Signals displayed on the Interface.
Probe Signals Displayed
APW Pressure waveform derivate
Integrated PZ signal
PWV PZ1 - Integrated PZ signal
PZ2 - Integrated PZ signal
ECG ECG signal
PPG Infrared wavelength
For the APW is it shown the differential and the integrated signal of the PZ, whereas for
the PWV the two integrated signals from both PZ of the double PZ sensor. The ECG has only
one signal, which is displayed, and the PPG is only shown the infrared wavelength, since both
wavelengths for visualization purpose have the same relevance.
In the Figure 26 is possible to observe different acquisition and to see how the graphs
are displayed and the amplitude resolution changes according to how many signals are
displayed.

Interface
41
Figure 26 - Example of signals exhibit.
The popup menu which takes focus on the previous figure defines which signal will be
displayed in the interface. It is demonstrated four different cases of acquisition. On case 1, in
accordance with Table 6 for the ECG probe, just one signal is displayed. However, on case 2,
even though just one probe is selected, it displayed two signals. The two signals showed are
relative to the integrated PZ signal for the two PZ sensors presented on the PWV probe. Others
cases are represented on the figure above, where the signals displayed are order by the order
selected on the pop menu.
Assuming that the PWV and the APW probes are not acquired at the same time, the
interface displayed a total maximum of four signals. Therefore, the lowest amplitude resolution
is represented in Figure 26 on the fourth case.

Interface
42
4.1.4 Save data acquired
After the operator stops the acquisition it can store the data into the database. It was set
a default folder to save all the files. The data, is then stored in a mat file with the name given by
the operator.
Figure 27 - Example of an acquisition file.
In Figure 27 it is possible to see the data is stored on the laptop on the .mat file, where it
has all the data recorded during the acquisition. The files ‘R’, ‘Rn’, ‘t_R’, ‘t_Rn’ corresponding
to the APW probe, whereas the ‘dadosNI’ is the file containing all the data acquired from the
NIDaq (Table 5). Moreover, the file “dadosNI” has in it a file called “channels”, which labels
all signals stored from the acquisition into the dadosNI.data matrix. Thus, according to the
“channels” the first column corresponds to the ECG signal, the second and third column is the
infrared and red wavelength of the PPG, respectively. The last column corresponds to the
synchronization signal.
4.2 Database - Cardiocheck
The previously GUI for the multichannel platform was incorporated into a database –
Cardiocheck – developed by Pedro Santos [71]. A database is a collection of programs that
manages the database structure, and enables the storage of the data, as well as the access to it. A
presence of a database is essential for efficient validation tests, since it simplifies the
organization and management of the acquisitions recorded.

Interface
43
The GUI of the database was developed on Matlab and uses the MySQL to store and
manage the information on the database. On this database it is possible to insert patients and
operators, change the personal information of the patients, among several others functions. In
the Figure 28 is possible to observe the main menu of the Cardiocheck database.
Figure 28 - Cardiocheck main menu appearance.
From this main menu is possible to execute different actions. Nevertheless, it will be
briefly explained the steps needed to perform an acquisition.
The first step, if the subject still does not exist in the database, is to insert the patient
personal data on the database at Figure 29.

Interface
44
Figure 29 - Cardiocheck Patient Window : personal window tab. (A) tab selection, (B) personal info fields, (C) patient Edit/Save and Cancel buttons, (D) main menu button.
On this window it is type important information concerning the patients, such as age,
height, weight. On the ‘Clinical History’ tab it is included important clinical information, such
as: diabetes, cardiovascular disease, smoking habits, among other important information
regarding clinical history. This information may be useful in formulation a diagnosis or to
segment patients by these conditions in order to extract new health indicators through for
example data mining techniques.
Afterwards, the acquisition procedure is initiated, where first some information about
the acquisition must be selected (Figure 30) and then finally the acquisitions are made through
the multichannel platform GUI developed (Figure 24).

Interface
45
Figure 30 - Cardiocheck Acquisition window. (A) institution select pop-up; (B) Operator select pop-up; (C) place of acquisition pop-up; (D) Patient select pop-up and its basic information ; (E) proceed to multichannel platform
GUI; (F) main menu button.
On the acquisition window first is selected the Institution (A), the operator (B) and the
place (C) where the acquisition is going to be done and by whom. Then, the second part is
regarding the patient, where it is selected one patient from the database, and important
physiological parameters must be acquired (Systolic Pressure, Diastolic Pressure and Heart
Rate). Then, by pressing the button ‘E’ it goes directly to the multichannel platform (Figure 24)
where the acquisition data takes place.
4.3 Inter – communication between GUIs
When the GUI of the multichannel platform is performing an APW acquisition it is
possible to inter-communication between the current GUI and with the APW Pulse Analyzer
(Figure 31).

Interface
46
Figure 31 - Communication between the Multichannel Platform GUI and APW Pulse Analyzer Module.
This is a small improvement, and however, as a big importance for the acquisition
procedures. This small feature enables to check during the acquisition of the acquired APW
signal, if after the correct processing is possible to correctly extract the features points. Thus,
another acquisition can be done, if due to internal or external factors the APW has poor quality,
mainly dependent to the experience of operators.
As it is possible to see on the Figure 31 the button “Analyzer Pulses” shows up, which
is responsible to transfer the previously acquired data to the APW Pulse Analyzer Module.

Interface
47
Then, on the APW Pulse Analyzer Module just by clicking on the “Transfer from RS232” it is
possible to visualize and process the raw APW signal to check the quality of it.

Interface
48
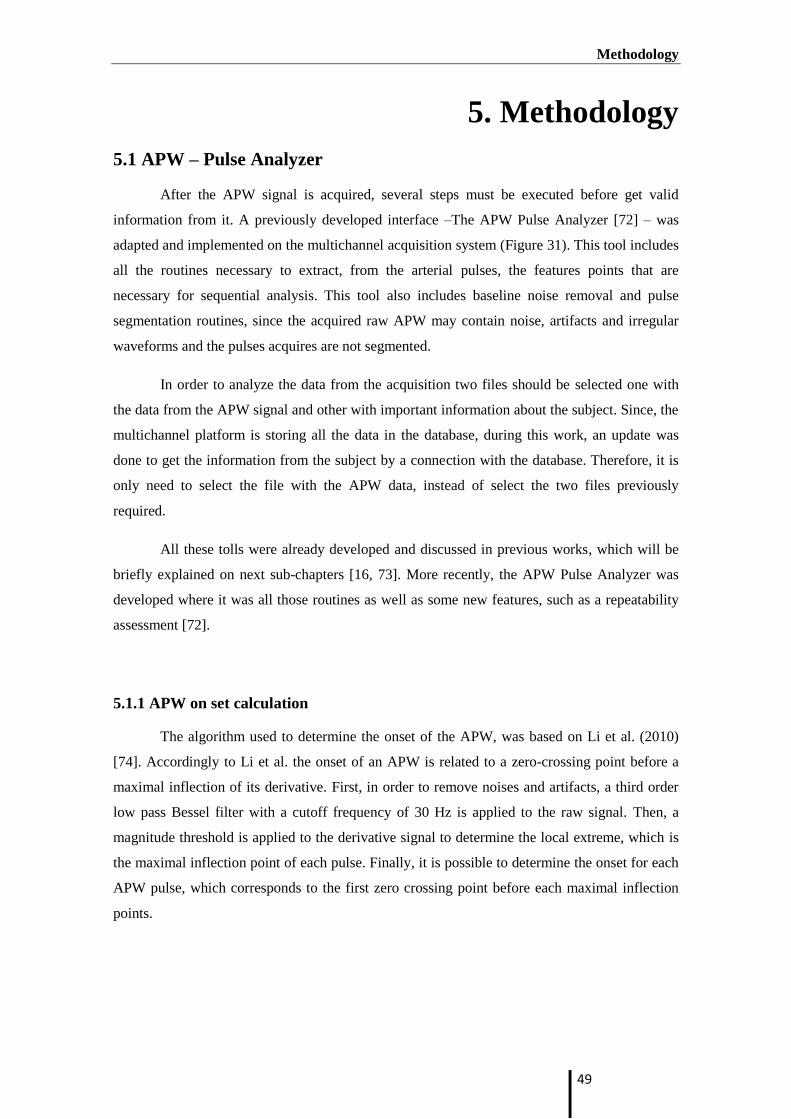
Methodology
49
5. Methodology
5.1 APW – Pulse Analyzer
After the APW signal is acquired, several steps must be executed before get valid
information from it. A previously developed interface –The APW Pulse Analyzer [72] – was
adapted and implemented on the multichannel acquisition system (Figure 31). This tool includes
all the routines necessary to extract, from the arterial pulses, the features points that are
necessary for sequential analysis. This tool also includes baseline noise removal and pulse
segmentation routines, since the acquired raw APW may contain noise, artifacts and irregular
waveforms and the pulses acquires are not segmented.
In order to analyze the data from the acquisition two files should be selected one with
the data from the APW signal and other with important information about the subject. Since, the
multichannel platform is storing all the data in the database, during this work, an update was
done to get the information from the subject by a connection with the database. Therefore, it is
only need to select the file with the APW data, instead of select the two files previously
required.
All these tolls were already developed and discussed in previous works, which will be
briefly explained on next sub-chapters [16, 73]. More recently, the APW Pulse Analyzer was
developed where it was all those routines as well as some new features, such as a repeatability
assessment [72].
5.1.1 APW on set calculation
The algorithm used to determine the onset of the APW, was based on Li et al. (2010)
[74]. Accordingly to Li et al. the onset of an APW is related to a zero-crossing point before a
maximal inflection of its derivative. First, in order to remove noises and artifacts, a third order
low pass Bessel filter with a cutoff frequency of 30 Hz is applied to the raw signal. Then, a
magnitude threshold is applied to the derivative signal to determine the local extreme, which is
the maximal inflection point of each pulse. Finally, it is possible to determine the onset for each
APW pulse, which corresponds to the first zero crossing point before each maximal inflection
points.

Methodology
50
5.1.2 Baseline noise removal
Before extract any features from a signal is fundamental to ensure the signals is clean of
noise. Moreover, if the noise is not correctly removed it will lead to results with no clinical
value, since there are not reliable. The baseline can be caused by electrical fluctuations, slow
motions of the neck attached PZ probe, and motions artifacts due to patients breathing or by
cough.
Although, the PZ probe has a real time baseline elimination based on a consistent
baseline restorer [16], a baseline fit algorithm for baseline wander removal was also
implemented to guarantee the validity of the APW signal. This algorithm determines the
baselines index, which match to the onset and offset of each APW pulse. A baseline fit is
interpolated from the baseline indexes points. Thus, a vertical adjustment for each sample
between two successive baseline indexes is done, by matching those baseline point index to zero
amplitude [73].
5.1.3 Morphological analysis
The morphological analysis is one important parameter, which must be carefully
studied, since motion artifacts due to voluntary or involuntary movements of the subject lead to
changes in APW volume. Those events are not associated with normal APW acquired in resting
conditions, and so, it is important to remove the APW pulses which are affected from those
artifacts. This algorithm measures the mean APW and the RMSE between the mean APW pulse
and every individual pulse. Ultimately a criterion is used to evaluate each pulse by wide
variations in amplitude and width pulse to flag and remove all APW pulse, which match at least
one of the abnormality criteria [73].
5.1.4 Pulse segmentation and normalization
At this stage the processed APW beats should be erased of any time of noise which can
corrupt any result. Then, the signal is segmented into individual pulses, and it is normalized to
scale heterogeneous, so that their morphology can be appropriately compared. Morphological
characteristics is the only parameter analyzed from the APW signal, since the acquired APW is
not calibrated [73].

Methodology
51
5.1.5 Spatial feature extraction
Several characters points can be extracted from each individual APW pulse. Almeida et
al. (2011) [23] proposed a method for spatial feature extraction, where diverse APW
characteristics points are determined, enabling to classy the APW type and to establish other
parameters, which could have relevant clinical value in the future.
5.2 Electrocardiogram
In ECG, the P wave is related with the atria depolarization, and so, it does not represent
any mechanical event from a physiological point view. Therefore, it does not have any value for
APW analysis. Actually, the most interesting wave in ECG is the R wave, since it represents the
physical contraction of the ventricles. Moreover, studies requested the R wave to be a time
reference, in order to either determine more accurately the regional and local PWV [37, 54, 61],
or for heart variability assessment [75-77] only the R wave from the QRS complex is needed.
Thereby, an algorithm with a high precision and sensitive to the R wave detection is desirable.
To detect the R wave from the QRS complex it was a used an algorithm based on Pan
and Tompkins [78]. This algorithm is based in three different types of processing stages: linear
digital filtering, nonlinear transformation and a decision rule algorithm. The algorithm is
compounded by band-pass filter, a derivative and a moving window integrator (linear digital
filters) and amplitude squaring (nonlinear transformation) and a thresholds rule (decision rule
algorithm).
5.3 Photoplethysmogram
Over the past years, it has been paid more interest in PPG in a wide range of clinical
measurements, because of his prosperous potential in those areas. Furthermore, PPG is a
reliable, low cost, simple to use and noninvasive method. These unique characteristics of the
PPG make him an ideal instrument to be used worldwide. The PPG can providing information
related to blood pressure, arterial compliance, heart rate variability, neurology, cardiac output,
respiration and detecting arterial disease [19].
However, PPG signal is very susceptible to external factors. Motion artifacts,
respiration, ambient light are one of the most common factors that affect the quality of the PPG
signal (Figure 32). Thus, signal processing techniques are required to ensure the absence of
noise on the PPG signal [19].
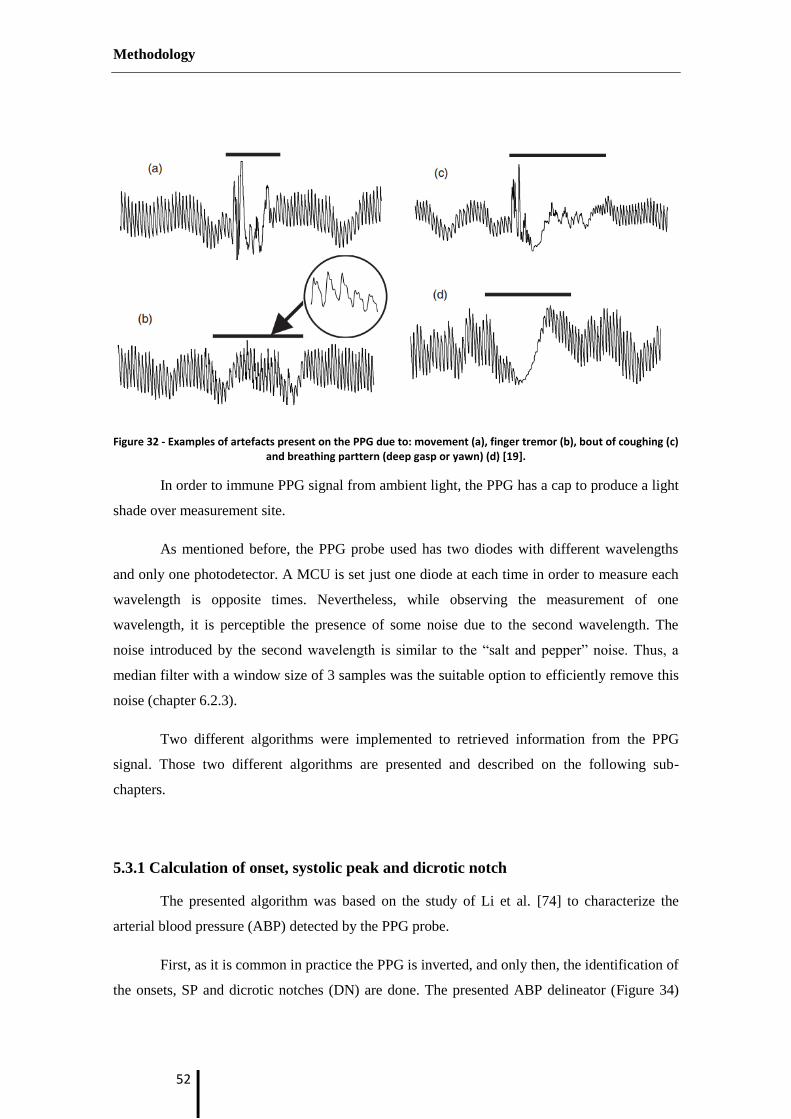
Methodology
52
Figure 32 - Examples of artefacts present on the PPG due to: movement (a), finger tremor (b), bout of coughing (c) and breathing parttern (deep gasp or yawn) (d) [19].
In order to immune PPG signal from ambient light, the PPG has a cap to produce a light
shade over measurement site.
As mentioned before, the PPG probe used has two diodes with different wavelengths
and only one photodetector. A MCU is set just one diode at each time in order to measure each
wavelength is opposite times. Nevertheless, while observing the measurement of one
wavelength, it is perceptible the presence of some noise due to the second wavelength. The
noise introduced by the second wavelength is similar to the “salt and pepper” noise. Thus, a
median filter with a window size of 3 samples was the suitable option to efficiently remove this
noise (chapter 6.2.3).
Two different algorithms were implemented to retrieved information from the PPG
signal. Those two different algorithms are presented and described on the following sub-
chapters.
5.3.1 Calculation of onset, systolic peak and dicrotic notch
The presented algorithm was based on the study of Li et al. [74] to characterize the
arterial blood pressure (ABP) detected by the PPG probe.
First, as it is common in practice the PPG is inverted, and only then, the identification of
the onsets, SP and dicrotic notches (DN) are done. The presented ABP delineator (Figure 34)

Methodology
53
suggest by Li et al. [74] is based on a combination of ABP waveforms analysis with the first-
order derivative (Figure 33) and some logical decisions.
Figure 33 - ABP waveform and its 1st
order derivative [74].
The onset of an ABP waveform is related with the zero-crossing point before a maximal
inflection, while the SP is related with the zero-crossing point after a maximal inflection
(Figure 33) [74].
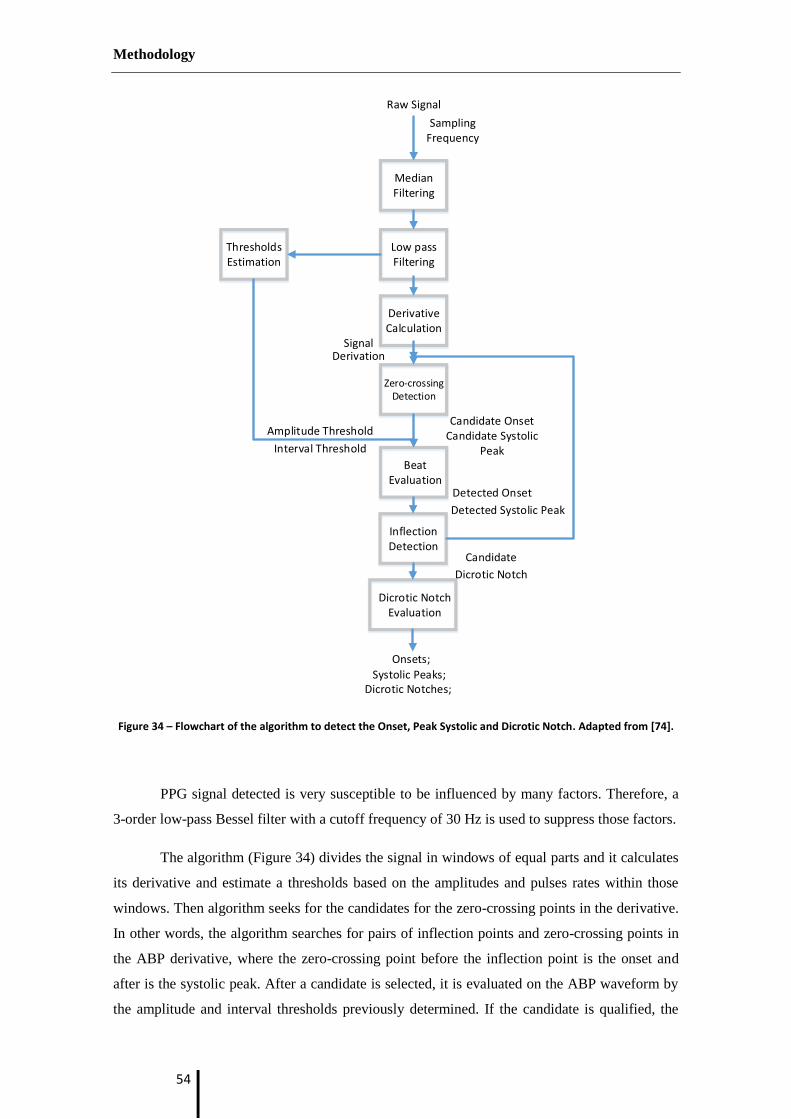
Methodology
54
Figure 34 – Flowchart of the algorithm to detect the Onset, Peak Systolic and Dicrotic Notch. Adapted from [74].
PPG signal detected is very susceptible to be influenced by many factors. Therefore, a
3-order low-pass Bessel filter with a cutoff frequency of 30 Hz is used to suppress those factors.
The algorithm (Figure 34) divides the signal in windows of equal parts and it calculates
its derivative and estimate a thresholds based on the amplitudes and pulses rates within those
windows. Then algorithm seeks for the candidates for the zero-crossing points in the derivative.
In other words, the algorithm searches for pairs of inflection points and zero-crossing points in
the ABP derivative, where the zero-crossing point before the inflection point is the onset and
after is the systolic peak. After a candidate is selected, it is evaluated on the ABP waveform by
the amplitude and interval thresholds previously determined. If the candidate is qualified, the
Dicrotic NotchEvaluation
InflectionDetection
Zero-crossingDetection
BeatEvaluation
MedianFiltering
DerivativeCalculation
ThresholdsEstimation
Low passFiltering
Detected Onset
Detected Systolic Peak
SignalDerivation
Amplitude Threshold
Interval Threshold
Candidate OnsetCandidate Systolic
Peak
Candidate
Dicrotic Notch
Onsets;
Dicrotic Notches;
Raw Signal
Sampling Frequency
Systolic Peaks;
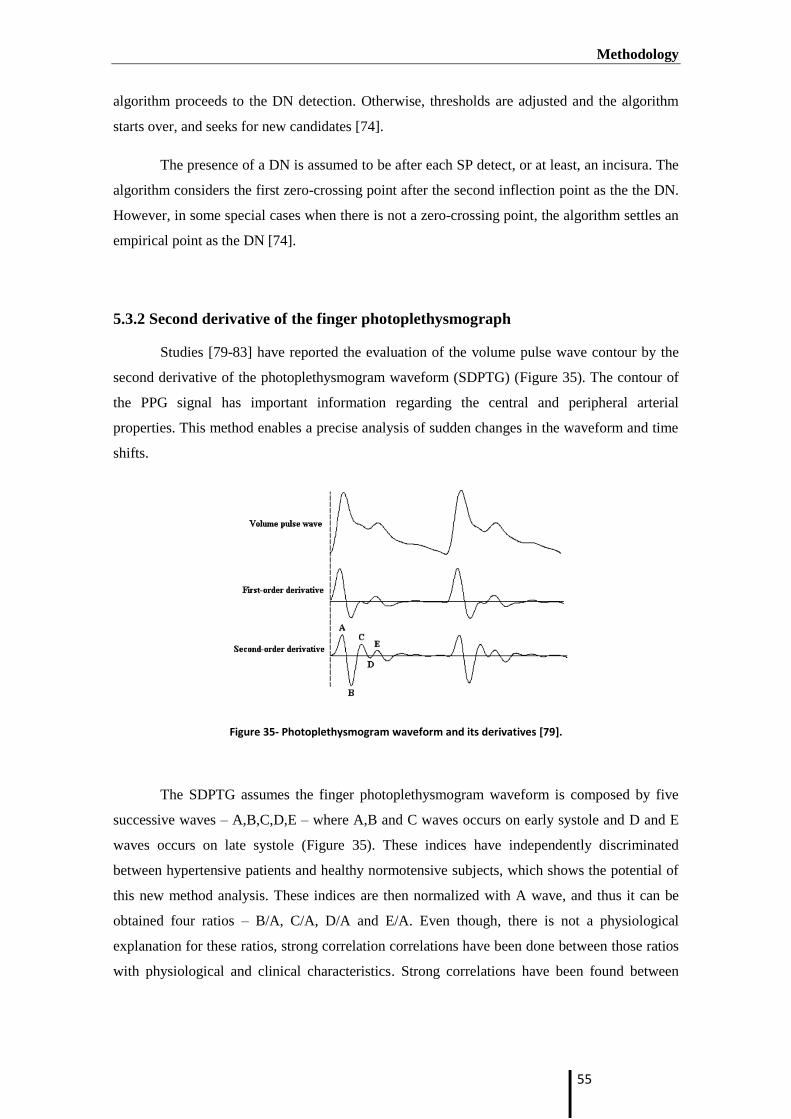
Methodology
55
algorithm proceeds to the DN detection. Otherwise, thresholds are adjusted and the algorithm
starts over, and seeks for new candidates [74].
The presence of a DN is assumed to be after each SP detect, or at least, an incisura. The
algorithm considers the first zero-crossing point after the second inflection point as the the DN.
However, in some special cases when there is not a zero-crossing point, the algorithm settles an
empirical point as the DN [74].
5.3.2 Second derivative of the finger photoplethysmograph
Studies [79-83] have reported the evaluation of the volume pulse wave contour by the
second derivative of the photoplethysmogram waveform (SDPTG) (Figure 35). The contour of
the PPG signal has important information regarding the central and peripheral arterial
properties. This method enables a precise analysis of sudden changes in the waveform and time
shifts.
Figure 35- Photoplethysmogram waveform and its derivatives [79].
The SDPTG assumes the finger photoplethysmogram waveform is composed by five
successive waves – A,B,C,D,E – where A,B and C waves occurs on early systole and D and E
waves occurs on late systole (Figure 35). These indices have independently discriminated
between hypertensive patients and healthy normotensive subjects, which shows the potential of
this new method analysis. These indices are then normalized with A wave, and thus it can be
obtained four ratios – B/A, C/A, D/A and E/A. Even though, there is not a physiological
explanation for these ratios, strong correlation correlations have been done between those ratios
with physiological and clinical characteristics. Strong correlations have been found between
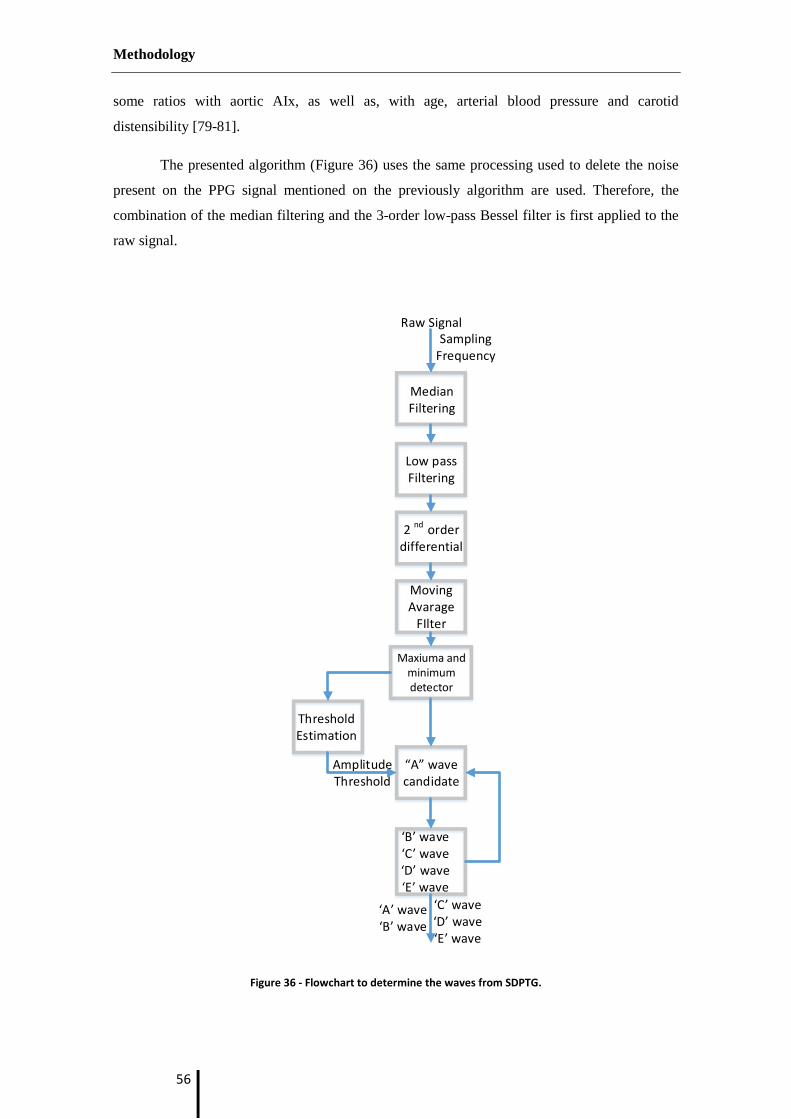
Methodology
56
some ratios with aortic AIx, as well as, with age, arterial blood pressure and carotid
distensibility [79-81].
The presented algorithm (Figure 36) uses the same processing used to delete the noise
present on the PPG signal mentioned on the previously algorithm are used. Therefore, the
combination of the median filtering and the 3-order low-pass Bessel filter is first applied to the
raw signal.
Figure 36 - Flowchart to determine the waves from SDPTG.
MedianFiltering
Low passFiltering
‘A’ wave‘B’ wave
‘C’ wave‘D’ wave‘E’ wave
Raw SignalSampling
Frequency
2 nd orderdifferential
Moving Avarage
FIlter
Maxiuma and minimumdetector
ThresholdEstimation
Amplitude Threshold
“A” wave candidate
‘B’ wave‘C’ wave‘D’ wave‘E’ wave

Methodology
57
However, the differential function of second order amplifies any noise present in the
sample. Thus, a higher degree of processing the data is required. Thus, a moving average filter
is applied after the differential function, to guarantee the total absent of noise on the sample
analyzed.
Then, maximum and minimum of the 2nd
differential order are calculated. The threshold
is set as a percentage of the maximum previously detected. By the application of this threshold
the algorithm seeks for A wave candidates. If a B,C,D and E waves are successfully determined
on a threshold interval, the pulse is stored. Otherwise, the algorithm skips the current pulse and
goes for the next A candidate. The threshold interval is considered to be the time between to
current and the next A wave candidates.
5.4 Multichannel platform acquisition
In this primary studies carried to evaluate the performance of the multichannel platform
twenty and three volunteers (9 females and 14 males), aged between 19 and 28 years old were
included. On this group were carried out 287 different acquisitions.
Before the proceedings for the various acquisitions through the multichannel platform
all subjects gave informal consent after full explanation of the purpose, the used procedures and
the risks inherent to the acquisitions. All acquisitions included additional data about the subjects
was recorded. Therefore, before it each acquisition it was registered the: age, gender, weight,
height, body mass index (BMI) smoking habits and diabetes history for each subject. With an
automatic digital oscillometric sphygmomanometer (Omron M6 Confort, Kyoto, Japan) the
SBP, DBP and HR values were also measured and saved on the database.
The patient acquisition protocol was based on the three different condition
standardizations for hemodynamic assessment of Laurent et al., Van Bortel et al. and
Boutouyrie et al. [9, 56, 84]. The full explanation of the procedure is very important to avoid
any the surprise effect which can influence the acquisition data. All the subjects on this study
were healthy volunteers, in others words, all subjects had no documented history of
cardiovascular disorders.
Subjects remained quiet on their bed on a supine position, and were advised not neither
to speak, to couch or to sleep. Acquisitions were made at similar time of the day, and in a
controlled room temperature (22-23 ºC). It was also ensured that patient has not drunk any
alcoholic drink or smoked within a time line of 3 hours before the acquisition. The acquisitions
were made all by the same operator. A period rest of 10 minutes was done preceded to the

Methodology
58
acquisitions, in an attempt to get BP, cardiac function, and vasomotor tone as close to basal
resting conditions as possible. At least 2 or 3 acquisitions of more than 60 seconds were made
per subjects, where all must be relative equal.
The double PZ sensor and the PZ probe could not be acquired at the same time, because
of the limited area over the neck. Thus, two different acquisitions were made: one globing the
single PZ sensor (Probe 1 in Figure 37), the ECG and ultimately the PPG, and another where it
was used the double PZ sensor instead of the single PZ sensor (Probe 2 in Figure 37) with the
ECG and PPG.
Figure 37 – The two different acquisitions set up.

Methodology
59
The PPG sensor is placed were set on the indicator finger of the left arm. The ECG as
explained previously (chapter 3.3.4.2) it is placed one electrode one the right and left arm and
another on the left leg. The sensor of the PZ (both single and double headed) is placed over the
left CCA. However, while the PZ single headed sensor is held by a collar to clench the sensor in
the neck of the patient, the double PZ sensor must be hold by the operator. Thus, the double PZ
sensor was hold the by the operation during the acquisition. This aspect turns harder to expertise
double headed probe, requiring a high degree of expertise.

Methodology
60

Results and Discussion
61
6. Results and Discussion
In this chapter, some of the results obtained will be presented and discussed. The studies
carried out were attended to correlate the various signals acquired during the validation tests of
the multichannel platform.
6.1 Results from acquisitions
Since both PZ probe could not be placed at the same time over the CCA, two different
acquisitions were performed as illustrated on Figure 37.
6.1.1 Acquisition setup I
Figure 38- Acquisition setup I.
On the acquisition setup I the ECG, PPG and APW modules were used. In Figure 38 are
represented the acquired signals for a one healthy subject. On the APW signal it is possible to

Results and Discussion
62
visualize a point of interest, the point inflection (Pi), which is the result of the sum of the
reflected wave with the forward wave (signaled on the APW signal in the Figure 38).
Two observations can be done from a simple look at the signals. The first one is the late
Pi, which occurs after the systolic peak, as it is normal from healthy subjects. Another important
remark, it is the extinction of the Pi on the PPG signals, which although it measures the arterial
blood pressure (ABP) at peripheral site, due the “amplification phenomenon” this point is lost
along the artery tree. Nevertheless, the APW signal is acquired noninvasively at the carotid
artery, which has a pressure similar to the central pressure, and thus, turns the APW signals a
better choice to measure the central pulse pressure. However, the techinique of the APW (PZ
sensors) requires a high degree of expertise, which, limits the possibility to use this technique as
a widepread diagonises technique for CVD. The PPG compared to the APW in terms of ABP
has the advantage of being easy to use and it has a big amount of information which can be
retrived from it.
6.1.2 Acquisition setup II
The Figure 39 demonstrates the signals acquired from the second acquisition.
Figure 39 - Acquisition setup II.

Results and Discussion
63
The difference to the acquisition setup I is the use of the PWV module instead of the
APW module, since both modules could not be acquired at the same time. The PWV acquired
from the double PZ sensor has the arterial pressure waveform from two different PZ placed at a
fixed known distance. Thus, measuring the time the blood flow takes to travels between the two
PZ sensors – the TT - it is possible to determine the local PWV from the subject at the carotid
artery. The TT is measured by the difference of a characteristic point of the pressure waveform
over the two sites recorded. On the zoomed figure it is possible to observe the signal recorded
from the PZ 1 and the PZ 2, where is marked the PZ maximum with a vertical line on both PZ
signals, which corresponds to the maximum upstroke rise. The TT is determined by the time
difference from those lines.
The example on the previous figure uses the maximum upstroke rise as the point
reference to determine the TT. However, the best reference point to measure the PWV is the
upstroke, since it is hardly affected by the wave reflections. The SP was used on this example,
since it is more evident to explain how the PWV can be measured from these two PZ signals
recorded at a distance known.
From this acquisition it is possible to use the most accurate method to measure the
PWV. This method uses the ECG signal, where the R-wave used as a time reference to calculate
the PWV.
6.1.3 Synchronization module
On the multichannel platform are implemented two different DAQ, the NI and PIC
(used on APW acquisition). Signals acquired from different DAQ will not be synchronized in
time, and may have different acquisitions rates. The use of a synchronization channel to
determine the time delay between the DAQ is fundamental. On case of the acquisition which
uses the two different DAQs the use of the synchronization is necessary. The Figure 40
illustrates the synchronization signal acquired from the two different DAQ boards presented on
the multichannel platform, the NI and PIC.

Results and Discussion
64
Figure 40- Synchronization acquired from NI and PIC.
Synchronization signal is a random signal (white noise) which is then acquired from
both DAQ (dsPIC and NI6210). Applying an algorithm based on cross-correlation on the
synchronization channel from each DAQ it is possible to determine the time delay. Thus, it is
possible to put a common temporal reference in all signals acquired from the different DAQ.
6.2 Hemodynamic signals analysis
The first step to do any analysis is to retrieve valid information from the signals
acquired during the data collected. Therefore, the implementation of a valid algorithm is
fundamental. On this section it will be present and discussed some results obtained by the
application of the processing algorithms.
Algorithms for the APW signals used will not be discussed since it was already been
extensively analyzed and discussed on earlier studies, where it was proven their efficiency to
retrieve valid information [72, 73].

Results and Discussion
65
6.2.1 APW analysis
6.2.1.1 Subject characteristics
In this section the parameters values for the group of studied subjects is presented
(Table 7), as mean ± SD. Those values where retrieved from APW acquired during the
acquisitions setup I (Figure 38) and from the general information regarding the subject. All this
parameters can be found on the database – Cardiocheck.
Observing the Table 7 is possible to confirm that all the volunteers gather on this
validation test have values of SBP (<130mmHg) and DBP (<84mmHg) considered normal, with
no indices cardiovascular diseases [85]. Despite the high variability existence on the AIx values,
the negative AIx is included in the margins of error for each subject. This also confirms the
presence of typical healthy values, since negative AIx is related with no arterial stiffness, which
is an indicator of CVD.
On this study it was only included the subjects for that it was possible to retrieve valid
information from APW probe on both weeks of acquisition. If a number considerable of pulse
was not detected on the APW Pulse Analyzer, this subject was excluded from the repeatability
assessment.
We can observe a very homogenous group of test with similar characteristics, such as a
low range of age (19 years old to 29 years old) and with similar BMI (body mass index).
However, the aim of this primary studies is focused to validate the multichannel platform,
where this group of test is enough.
In the Table 7 is noticeable big standard deviation of the AIx measured on the
acquisition. Although, the algorithms used to calculate could lead to some increase of the
variability in the AIx, another important, which must be mentioned is the operator. Even
though, the acquisition were always made by same operator the probe has a high degree of
expertise. Primary acquisitions were done by the operator to practice the placement of the PZ
sensor over the CCA. However some variability can be influence by the operator, which realizes
better acquisition on the last acquisitions in comparison with the first acquisitions, since the
operator has low experience.

Results and Discussion
66
Table 7 - Test group characterization (mean ± standard deviation).
Su
bje
ct #
Gen
der
Ag
e
Hei
gh
t (c
m)
Wei
gh
t (K
g)
BM
I
HR
(b
pm
)
SB
P (
mm
Hg
)
DB
P (
mm
Hg
)
SP
t (
ms)
Pi t (
ms)
AIx
(%
)
n
1 F 20 156 45 18.5 80±5 107±6 68±4 142.8±40.6 187.3±33.6 -7.1±9.3 297
2 M 22 179 74 23.1 61±5 117±8 65±2 128.7±27.6 215.5±57.3 -21.9±15.8 356
3 F 23 169 52 18.2 80±5 102±7 68±11 134.1±34.0 163.6±55.0 -1.7±19.7 184
4 M 22 175 68 22.2 56±10 124±8 65±2 144.7±24.9 196.1±48.0 -8.6±18.5 108
5 M 23 175 73 23.8 59±2 125±4 74±1 142.8±7.3 111.0±61.2 26.1±27.8 124
6 F 22 165 54 19.8 86±8 125±2 83±1 186.1±36.5 188.1±78.7 8.5±20.6 152
7 M 19 180 67 20.7 83±7 125±1 67±1 119.2±13.5 222.8±30.6 -37.5±10.7 164
8 F 23 160 50 19.5 89±26 111±11 84±6 227.3±45.2 149.0±30.8 14.2±14.5 248
9 M 28 172 60 20.3 89±34 106±27 67±4 128.1±11.9 200.5±41.3 -20.4±14.3 183
10 M 24 173 69 23.1 76±33 106±19 64±7 176.2±65.9 171.6±51.9 5.5±22.5 232
11 F 22 161 49 18.9 82±6 106±7 71±5 167.8±51.4 51.2±60.2 12.0±24.4 129
6.2.1.2 APW repeatability tests (agreement assessment)
As mentioned on chapter 5.4 all the acquisitions were done on the same period of the
day. The protocol for the acquisition was elaborated to make the acquisition under the same
conditions, to test the variability of the information acquired in an interval of time. Therefore,
all external factors must be avoided, in order to prevent the influence of other factors than the
variability of the probe.
The Figure 41displays a Bland – Altmand AIx plot of two measurements: on the first
and second week and another realized on the third and fourth weeks.
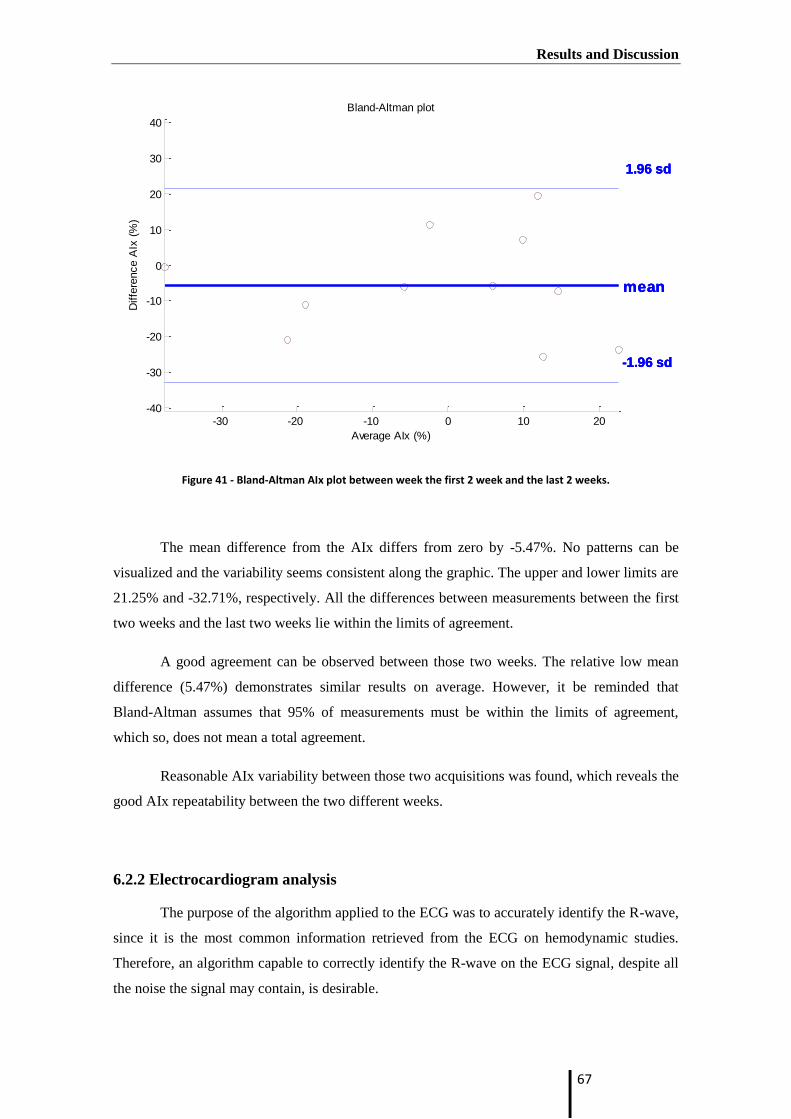
Results and Discussion
67
Figure 41 - Bland-Altman AIx plot between week the first 2 week and the last 2 weeks.
The mean difference from the AIx differs from zero by -5.47%. No patterns can be
visualized and the variability seems consistent along the graphic. The upper and lower limits are
21.25% and -32.71%, respectively. All the differences between measurements between the first
two weeks and the last two weeks lie within the limits of agreement.
A good agreement can be observed between those two weeks. The relative low mean
difference (5.47%) demonstrates similar results on average. However, it be reminded that
Bland-Altman assumes that 95% of measurements must be within the limits of agreement,
which so, does not mean a total agreement.
Reasonable AIx variability between those two acquisitions was found, which reveals the
good AIx repeatability between the two different weeks.
6.2.2 Electrocardiogram analysis
The purpose of the algorithm applied to the ECG was to accurately identify the R-wave,
since it is the most common information retrieved from the ECG on hemodynamic studies.
Therefore, an algorithm capable to correctly identify the R-wave on the ECG signal, despite all
the noise the signal may contain, is desirable.
-30 -20 -10 0 10 20-40
-30
-20
-10
0
10
20
30
40
Bland-Altman plot
Average AIx (%)
Diffe
rence A
Ix (
%)
1.96 sd
-1.96 sd
mean
1.96 sd
-1.96 sd
mean
1.96 sd
-1.96 sd
mean

Results and Discussion
68
The ECG can be corrupted by artifacts with both origins, physiological and non-
physiological. The most common artifact present or the ECG is due to the power-line
interference, which is a sinusoidal wave with a frequency of 50 Hz. Other artifacts present on
the ECG signal includes muscle noise, electrode motion, baseline wander and T waves with
frequency similar to QRS complexes [26, 78]. In the Figure 42 is possible to see the raw signal
acquired through the multichannel platform.
Figure 42 - Raw ECG signal.
The description of the algorithm based on Pan and Tompkins [78] is illustrated in the
Figure 43.
Figure 43- Digital Signal Conditioning.
The application of a band-pass filter with cutoff frequency from 0.25 to 40 Hz on the
ECG signal has the goal to reduce the noise caused by muscle, the 50 Hz interference, baseline
wander and T-wave interference. The band-pass filter increases the signal-to-noise ratios of the
signal. Afterwards, the signal is differentiated providing important information regardless the
QRS complex.
11 11.5 12 12.5 13-0.5
0
0.5
1
1.5
2
Time (s)
Am
plit
ud
e (
Vo
lts)
ECG - Raw Signal
11 11.5 12 12.5 13-1
-0.5
0
0.5
1
Am
plit
ud
e (
Vo
lts)
Output of differentiator
11 11.5 12 12.5 130
0.5
1
Am
plit
ud
e (
Vo
lts)
Output of squaring process
11 11.5 12 12.5 130
0.5
1
Time (s)
Am
plit
ud
e (
Vo
lts)
Result of moving-window integration

Results and Discussion
69
The square process emphasizes the high frequencies, in other words, it intensifies the
slope of the frequency response of the derivative. This process is fundamental to ensure there is
no false positive caused by T waves with high frequency, which have a similar slope as the QRS
complex.
The last filter to extract fiducial points is a moving-window integrator. The output of
this step gives information about the slope and width of the QRS complex. The QRS complex
corresponds is based on the duration of the rising edge (width), allowing to distinguish the peak
of the R wave from others maximal slopes [78].
Then the threshold equal to a fraction of the maximum ECG amplitude is applied to the
result of the moving-window integration. This threshold identifies the position of the R point.
The R point will be the maximum point calculated on the relevant window on the filtered ECG
with the moving-window integration.
The Figure 44 is the result of the application of the algorithm to the acquisition
represented on the Figure 42.
Figure 44 - Example of R wave detection
Nevertheless, before the information by the application of algorithms developed to the
ECG signal, an evaluation of the performance of the ECG algorithm must be done. Therefore,
the results of the identification of the R waves by the algorithm were visualized and inspected
by a human expertise engineer (HEE). When the algorithm correctly calculates the R wave it is
classified as true positive (TP), and as false positive (FP) when the algorithm incorrectly
identify a R wave. On the other hand, when the algorithm does not identify the R wave in an
ECG cycle it is classified as a false negative (FN).
From those values – TP, FP and FN – is possible to determine the sensitivity, positive
predicted value or precision rate (P+) and error of the algorithm by the following equations:
11 11.5 12 12.5 13-0.5
0
0.5
1
1.5
2
Time (s)
Am
plit
ud
e (
Vo
lts)
ECG - signal

Results and Discussion
70
Equation 8
Equation 9
Equation 10
Where sensitivity relates to the algorithm capability to identify the R wave, and
precision rate measure the proportion of times the R wave are correctly identify by the
algorithm. The Table 8 shows the results obtained for the performance evaluation.
Table 8 - Evaluation of the algorithm to detect R wave on the ECG signal
N# of cycles TP FP FN P+
(%) Error (%) Sensitivity (%)
R wave 3257 3213 42 2 98.71 1.35 99.94
Forty random acquisitions made through the multichannel platform were chosen for the
evaluation test. A total of 3257 cycles were within those acquisitions. The present algorithm
demonstrates a high sensitivity and precision rate and a low error. This results made on a
considerable sample test confirms the good performance of the ECG to retrieve the R wave
from the ECG signal. The results obtained are according to the expected since the R-wave is the
easier wave to detect. Nevertheless, it is the wave with more importance for hemodynamic
studies as mentioned on chapter 5.2.
6.2.3 PPG analysis
In the PPG analysis, it was observed a noise signal. This may be produced by the
interference of the second wavelength diode. A solution presented to solve this problem, since it
has a similar behavior of a “salt and pepper” noise, is to apply a median filter (Figure 45).

Results and Discussion
71
Figure 45 - Comparison of a median filter and a low pass filter
The Figure 45 represents the raw signal PPG after applying a butter low pass filter
(LPF) with a cutoff frequency of 30 Hz and a median filter with size 3. Taking a close
observation on the figure above is possible to affirm that the suitable choice is the median filter.
The median filter perfectly eliminates the noise wanted without distorting the raw signal, while
the LPF despite it also eliminates the noise it changes the form of the raw, which it is
inconvenient.
Moreover, the raw PPG signal is almost imperceptible, since it relies precisely on the
PPG signal filtered by the median filter. This fact suggests the choice the median filter as the
most efficient filter to remove this noise.
After removing this precise noise from the signal the application of the processing
algorithms can be correctly done.
6.2.3.1 Algorithm for onset, SP and DN detection
As explained on the chapter 5.3.1 the goal of delineator algorithm based on Li et al. [74]
is to detect the onset, SP and DN from the PPG. The detection of these points is based on the
first order derivative of the PPG signal. In the Figure 46 is possible to observe an example of the
application of the delineator to an acquisition measured through the multichannel platform.

Results and Discussion
72
Figure 46 - Example of the waveform analysis based the delineator algorithm presented by Li et al. [74].
By a simple observation of this example, it can be seen the onset represented by black
triangles and the SP marked as green squares are correctly identified on this example. However,
the DN represented as purple circles does not have such good performance as the identification
of the previously onset and SP points. Nevertheless, an evaluation of the performance of the
implemented delineator algorithm based on Li et. al [74] is presented on the Table 9.
Table 9 - Evaluation of the algorithm to detect the Onset, SP and DN based on Li et al.
TP FP FN P+
(%) Error (%) Sensitivity (%)
Onset 1301 20 6 98.50 2.47 99.54
SP 1293 28 6 97.88 2.57 99.54
DN 990 331 6 74.94 25.51 99.40
The procedure of the evaluation was the same as the evaluation for the ECG signal
(Table 8). Although, fewer acquisitions were selected to evaluate, it is still a reasonable number
for a test sample. A total of 17 random acquisitions, with a total of 1327 pulses, were selected
among all the data presented on the database.
The onset and SP detection had similar results. They presented a good accuracy and
sensitivity, with a low error. However, the results for DN detection are not as promising as the
previous points. The DN detection showed a error more than 25%, which is relative high value.

Results and Discussion
73
Therefore, improvements of the detection of the DN must be done. Nonetheless, this point (DN)
has only importance for subjects with heart valve diseases.
6.2.3.2 Second derivative of the finger photoplethysmograph
Takazawa et al. studied which application could the SDPTG waveform have in clinical
areas. It was confirmed the useful of SDPTG to evaluate the vascular aging [82].
The Figure 47 represents the application of the algorithm explained on the chapter 5.3.2
to PPG signal. Two graphics can be observed. In the first graphic is the PPG signal, while the
second graphic is the SDPTG of the first graphic, where five waves (A,B,C and D waves) are
detected.
57 57.5 58 58.5 59 59.5 60
-1.95
-1.9
-1.85
-1.8
-1.75
-1.7
x 10-5
Time (s)
Am
plit
ud
e (
V)
PPG signal - Infrared
57 57.5 58 58.5 59 59.5 60
-2
-1
0
1
2
3
x 10-10 Second derivative
Time (s)
Arb
itra
ry U
nits (
AU
)
A wave
B wave
C wave
D wave
E wave
SDPTG
Figure 47 - Second Derivative of PPG and A,B,C,D,E waves.
These five waves characterize the contour of the SDPTG waveform. The identification
all of those points is fundamental to analyze the SDTPG waveform. Thus, the algorithm only
saves the pulses, where all five waves are identified. In the Figure 47 are represented three
pulses, where on the second pulse the algorithm had skip it, because it did not detect all the
fives within that interval.

Results and Discussion
74
After all waves are detected, the weight ratios of all waves respective to the A wave are
calculated and saved.
6.3 Inter-signals Studies
This sub-section will reveal two performed studies. These two studies have as goal to
use more than one signal acquired through the multichannel platform and to retrieve some
clinical value from them.
6.3.1 Heart Rate Variability
The heart rate variability (HRV) is an indicative of the automatic regulation of the heart
rate (HR). Currently, the main method to extract the HRV signal is to acquire the ECG signal
and apply an appropriate QRS detection algorithm to locate the R wave and its peak, and
thereby find the RR intervals (RRI). However, the ECG signals has methodological problems to
record and analyze, which motivated a search of alternative methods to measure the HRV.
Recent studies have suggested the possibility to use the PPG signal as a surrogate of the ECG to
determine the HRV, since it also reflects the cardiac rhythm. The peak-to-peak interval (PPI)
variability was showed a high correlation with the RRI of the signal [75-77].
The Figure 48 shows how the RRI and PPI are extracted from the ECG and PPG
signals, respectively.
Figure 48 - Cardiac beat-to-beat interval extracted from PPG and ECG signals. RRI - R-R intervals, PPI P-P intervals.
To prove the feasibility of the PPG to measure the HRV the PPI values from PPG and
RRI values from ECG were compared. For this study one hundred and twenty five different

Results and Discussion
75
acquisition (n=125), with a total of 10312 beats, were used as the sample test. The HRV is
determined by the RRI from ECG, while the pulse pressure variability (PPV) was determined by
the PPI from the PPG.
Firstly, it was applied the algorithm on the data in order to get the R points on the ECG
and the SP on the PPG. Even though, the SP and R wave detection had a good accuracy (Table
8 and Table 9), it is vital to ensure that all the points are being properly detected by the
algorithms, since any false points (FN or FP) can corrupt the results. Thus, all of the RRI and
PPI time series underwent with an initial automated editing process before a careful manual
editing performed by visual inspection.
6.3.1.1 Correlation Studies
On this chapter it is presented two different approaches: a time domain analysis and a
non-linear analysis.
6.3.1.1.1 Time-domain analysis
Regarding the time domain of the HRV and the PPV, it is calculated four different
parameters:
the mean interpulse interval (mean NN) - Figure 49;
the standard deviation of the interpulse intervals (SDNN) - Figure 50;
the square root of the mean squared differences of successive interpulse
intervals (MRSSD) - Figure 51;
and finally, the proportion of difference of successive interpulse intervals which
exceeds the 50 ms, also known as pNN50 - Figure 52.

Results and Discussion
76
Figure 49 - Time domain regression analysis of the average of RRIs and PPIs.
The average of PPI and RRI shows a high correlation coefficient, close to a 1 (r=0.99).
As we can see from the equation it has a proportion of almost 1:1, which is the expected. On the
figure it is perceptible a large quantity of points within a small area, endures high correlations
between the two variables.
Figure 50 - Time domain regression analysis of the standard deviation of the NN from RRIs and PPIs.
As the previously correlation, the SDNN between the RRI and PPI has a slight lower
coefficient, but still high (r=0.9555). Nevertheless, it is possible to see some discrepancies
mainly for low standard deviations (0.02-0.06 seconds). Those differences can have some
influence by deviations of the algorithms.
y = 0,99988x + 0,00003 R² = 0,99999
0,5
0,6
0,7
0,8
0,9
1
1,1
1,2
1,3
1,4
0,5 0,7 0,9 1,1 1,3 1,5
PPI - meanNN(s)
RRI - meanNN (s)
y = 0,9555x + 0,0052 R² = 0,9539
0
0,02
0,04
0,06
0,08
0,1
0,12
0,14
0,16
0 0,02 0,04 0,06 0,08 0,1 0,12 0,14 0,16
PP - SDNN (s)
RRI - SDNN (s)

Results and Discussion
77
Figure 51 - Time domain regression of the RMSSD of RRIs and PPIs.
As is the case of average of the RRI and PPI, the RMSSD between the RRI and PPI also
has a strongly coefficient correlation of r =0.9999.
Figure 52 - Time domain linear regression analysis of pRR50 of RRIs and PPIs.
The last study in time domain is the pNN50(%). The pNN50(%) is obtained counting
the number of successive NN differences which exceeds the 50 ms, and then divide that
number from the total number of intervals on that acquisition. The coefficient correlation of
pNN50(%) between the RRIs and the PPIs is the lowest from all the time domain parameters (r=
0.9148). Nevertheless, it is still considerable a good correlation between the pNN50(%) derived
from the PPG and from the ECG.
y = 1,0003x - 0,0422 R² = 0,9999
0
10
20
30
40
50
60
0 10 20 30 40 50 60
PPI -RMSSD (ms)
RRI - RMSSD (ms)
y = 0,8919x + 5,9671 R² = 0,9148
0
10
20
30
40
50
60
70
80
90
0 20 40 60 80 100
PPI - pNN50(%)
RRI -pNN50(%)

Results and Discussion
78
While is a great source of error. Because the acquisition times are relatively low, small
differences in the PPG and ECG has big impact on the overall of the sample, because it
represents a larger proportion than if the time acquisition were longer. The time duration of 90
seconds per acquisition was chosen, because it set as a good time for CVD analysis. However,
for HRV analysis longer duration should be done. Nevertheless, the results obtained were good.
6.3.1.1.2 - Non-linar analysis – Poincaré plot
One of the most used technique for nonlinear HRV analysis is the Poincaré plot. It is
obtained by simply plot each intervals against the previously one. The Figure 53 and Figure 54
represent the Poincaré Plot derived by the HRV and the PPV, respectively.
Figure 53 - HRV Poincaré plot from one subject.
650
700
750
800
850
900
650 700 750 800 850 900
RRI (n+1) (ms)
RRI (n) (ms)
SD1 = 23,4 ms SD2 = 49,5 ms

Results and Discussion
79
Figure 54 - PPV Poincaré plot from one subject.
From this plot two nonlinear parameters can be extracted the short term beat-to-beat
variability (SD1) and the long term beat-to-beat variability (SD2). SD1 is the standard deviation
of projection of the Poincaré plot on the line perpendicular to the line identify (y=-x), while SD2
is the standard deviation of the Poincaré plot on the line of identify (y=x) [86].
Figure 55 and Figure 56 shows the correlation between the SD1 and SD2 retrieved by
the HRV and PPV.
Figure 55 - Linear regression of SD1 from Poncaré plot derived from RRI and PPI.
650
700
750
800
850
900
650 700 750 800 850 900
PPI (n+1) (ms)
PPI (n) (ms)
y = 0,9323x + 6,7142 R² = 0,8732
0
20
40
60
80
100
120
0 20 40 60 80 100 120
PPI - SD1 (ms)
RRI - SD1 (ms)
SD1 = 25,0 ms SD2 = 50,2 ms

Results and Discussion
80
Figure 56 - Linear regression of SD2 from Poncaré plot derived from RRI and PPI.
A high correlation coefficient is observed between the HRV and the PPV for the
nonlinear parameters SD2 (r=0.9809), while a lower correlation coefficient is seen for the SD1
parameter (r=0.8732). In the Figure 55 it can be clearly be seen some points with a big
discrepancy to the regression line. This fact can be explained by the existence of some
imprecision on the detection of the R and the SP. These fluctuations from the algorithm have
bigger influence in short beats. This theory is endorsed by the result of SDNN showed on Figure
50.
On the other hand, the SD2 which represents the long term beat-to-beat variability
derived by the PPG and ECG does not have the same problem, since some small imprecisions of
the algorithms is very small relative to duration of the pulse.
6.3.1.2 Agreement assessments – Bland-Altmand tests
On this section it will be showed the results of the Bland-Altman plots about the
NN and the SD ratio. The limits are considered to be 1.96 of the standard deviation of
differences between the two samples, which corresponds to a confidence agreement of 95%.
Figure 57 displays a Bland – Altmand of NN intervals extracted from the ECG and the
PPG.
y = 0,9708x + 4,0256 R² = 0,9809
0
50
100
150
200
250
0 50 100 150 200 250
PPI - SD2 (ms)
RRI - SD2 (ms)

Results and Discussion
81
Figure 57 - Bland-Altman agreement analysis between NN from ECG and PPG.
The mean difference from the NN intervals showed was 0.0835% with the upper and
lower limits of 0.892 % and -0.725% respectively. The difference between NN intervals derived
by the PPG and the ECG presented low mean difference value (0.0835), which does not have
clinical significance. The explanation can by the different nature of the ECG and PPG.
Only nine out of one hundred and twenty-five (7.2%) of the differences between
measurements does not lie within the limits of agreement, which represents a relatively good
agreement between the NN differences. No patterns can be visualized, and variability is
consistent.
One reported non-linear parameter commonly extracted by the Poincaré plot for HRV
analysis is the ratio between SD1 and SD2, denominated as SD ratio [86]. Figure 58 displays a
Bland-Altman of the differences of SD ratios derived from PPG and ECG.

Results and Discussion
82
Figure 58 - Bland-Altman analysis between SD ratios derived from ECG and PPG.
The mean difference is of -0.0634% and the upper and lower limits are 0.184% and
0.311% respectively.
The differences between the two measurements, which lie within the limits of
agreement is 92,8% of those differences. All the differences out of the limit are under the low
limit of agreement.
6.3.1.3 Discussion of HRV
Both Bland-Altman plots (Figure 57 and Figure 58) show a low mean difference (6.34%
and 8.35%) which indicates small discrepancies between the parameters extracted from the PPG
and ECG. Moreover, the two Bland-Altman plots revealed a relative agreement between the two
measurements of the NN intervals and the SD ratios with 92.8% of differences in both plots
within the limits of agreements. This 92.8% of the differences is related to 95% of agreement,
since the Bland – Altman assumes this value as the percentage of measurements which must be
within to calculate his limits.

Results and Discussion
83
On both studies there is the same number of points outside of the range, which can
suggest about the reliability of those acquisitions which could have been included by mistake
into the sample test. If it is the case, it has decreased the level of agreement, which is still high,
but it should be in fact bigger.
Nevertheless, a relative good agreement between the differences measurements of the
NN intervals and the SD ratios is present on the Bland-Altman plots. Furthermore, the time
domain and non-linear (Poincaré plot) parameters showed highs correlations coefficients, some
of them almost 1. These results confirm fact the HRV can be reliably estimated from the PPG
based on the PP intervals (PPV) in healthy subjects at rest, as some studies have already
reported [75-77].
In order to ensure the PPG has valid method to measure the HRV, more studies need to
me performed, since all this studies have been done in controlled ambient and only healthy
subjects at rest. The correlation between HRV parameters derived from the ECG and PPG
should be done with a wide range of age and with different healthy conditions. As the PPG
measures the oscillations in blood volume at peripheral arteries, they are delayed in relation to
the ECG. This delay depends on velocity which the flow blood takes from the heart to the
recorded placed (TT). However, PTT shows beat-to-beat variations, which can be a great source
of error in the measurement of the pulse intervals, and thereby can influence the HRV
parameters derived by the PPG [87]. Nevertheless, the PTT variation is minimal in healthy
subjects at rest, and thus, makes the measurement of HRV parameters reliable under these
conditions, as suggested by the obtained results. More studies must be carried out in different
conditions to evaluate the feasible to use the PPV as a surrogate of the HRV.
This method to measure the HRV has an important clinical value, since the PPG
waveform can be easily recorded form the finger and will allow to avoid all the procedures
needed to place the electrodes when an ECG is recorded. Moreover, PPG besides being very
easy to record, it is also comfortable to the patient and thereby is suitable for long term studies.
PPG is very sensible to motion artifacts. However, an integration of accelerometers into
the PPG enables to quantify the displacement of the sensor during the acquisition, and thus
correct the PPG signal. This couple with the variety of signals which can be extracted from the
PPG, such as blood oxygenation, ventilator rate and vascular assessments, makes it an ideal
sensor for ambulatory acquisitions.

Results and Discussion
84
6.3.2 SDPTG for arterial stiffness assessment
Arterial stiffness can be assessed by the PPG using the second derivative of the finger
photoplethysmograph (SDPTG) [79, 81, 88]. From all the ratio derived by this method D/A has
the highest coefficient of correlation with the arterial stiffness index [88].
AIx retrieved from the APW also gives important information about arterial stiffness
condition, where positive AIx values are associated with essential hypertension.
A comparison was performed for each subject between the AIx and D/A values derived
from the APW and PPG, respectively. Nevertheless, no conclusive results were obtained from
our test group. The reason which can explain this fact is the presence of a very homogeneous
group of test and due to the variability of the AIx derived from the APW.
Nevertheless, the mean values obtained for D/A on the eighteen subjects for a total of
79 different acquisitions was -0.21 which is in accordance to values in literature [81]. This
suggests the values of D/A derived from the SDPTG were correctly extracted by the algorithm
described on chapter 5.3.2 (Figure 36).
Figure 59 - Histogram with Gaussian of D/A values for the 79 acquisitions.
-0.45 -0.4 -0.35 -0.3 -0.25 -0.2 -0.15 -0.1 -0.05 00
2
4
6
8
10
12
14
D/A
Fre
quency
µ = - 0.21

Conclusion and Future Work
85
7. Conclusion and Future Work
7.1 Conclusion
The main goal of this thesis was the development of a DAQ software able to display
and save all current modules present on the multichannel platform. The developed GUI was
incorporated into a database – Cardiocheck – enabling an easy storage and management of all
the data acquired through the multichannel platform and also general information about the
subjects. The database also has general information about the subject, which may be important
for the development of new methods of diagnosis. An additional synchronization signal was
added to the multichannel platform due to the existence of two DAQs.
All acquired signals through the multichannel platform are in same time reference.
Therefore, comparison between information about one parameter from different signals can be
done. For example, it can be compared information for vascular aging assessment through the
PPG and the APW.
The processing tools previously developed for the APW signals – APW Pulse Analyzer
Module - were implemented in the GUI of the multichannel platform, allowing to check the
quality of the APW signals at the time of the acquisition. An update was done to the APW Pulse
Analyzer Module to communicate to the database and extract important information regarding
the subject, once a file is selected for analysis.
An algorithm for the ECG analysis and a delineator algorithm for the PPG signal were
also implemented and tested on the signals acquired. Both algorithms showed to be efficient in
detecting the R wave in the case of the ECG signal, and the onset and the SP for the PPG signal.
Improvements still need to be done to detect the DN, since it was verified a relative high error.
A new method for the analysis of PPG based on SDPTG was developed and
implemented. However, since the acquired group of volunteers had very homogenous
parameters, no relevant studies could be done in order to reveal the potential of this method.
A study performed to the use of PPV derived from the PPG as a surrogate of the ECG
for HRV assessment, showed promising results at least for conditions equal to the acquisitions
made. This relationship between the PPV and the HRV is in accordance to the literature, which
validates the ECG and PPG acquired through the multichannel platform.
In the repeatability tests for the APW the Bland – Altman plots showed good agreement
between weeks.

Conclusion and Future Work
86
7.2 Future Work
It is crucial to develop a single GUI gathering all the tools and algorithms in order to
retrieve important hemodynamic parameters from the signals present on the multichannel
platform. This improvement will enable the extraction of hemodynamic parameters from the
data present on the database in an easy, simple and reproducible way. Moreover, the automatic
extraction of general information regarding the subject can be done through the implementation
of the feature of communication with the database.
The enlargement of the current database is of high priority. The acquisition should be
done at a large scale with a wide range of ages and different CVD conditions.
The development of a new algorithm to measure the AIx derived from the PPG should
also be of interest. Then, comparison trials from the augmentation index derived both by the
PPG and APW with results from a “gold-standard” device to evaluate and demonstrate the
reliability of the PPG and APW.
Study the vascular aging assessment through different hemodynamic parameters, such
as the SDPTG aging index, the AIx and the PWV.
Perform the same studies carried out to evaluate the PPG as a surrogate of the ECG for
HRV assessment under different conditions. Test the reliability to use the PPG for HRV
assessment in ambulatory cases will avoid all the methodologies to setup the ECG.
An exhaustive data mining with all hemodynamic parameters should be done with the
purpose of studying new classification algorithms in order to find new diagnosis methods of the
early detection of cardiovascular complications.

References
87
8. References
1. Mendis, S., P. Puska, and B. Norrving, Global atlas on cardiovascular disease
prevention and control. 2011: World Health Organization.
2. Franklin, S., Blood pressure and cardiovascular disease: what remains to be
achieved? Journal of hypertension. Supplement: official journal of the
International Society of Hypertension, 2001. 19(3): p. S3.
3. Arnett, D.K., G.W. Evans, and W.A. Riley, Arterial stiffness: a new
cardiovascular risk factor? Am J Epidemiol, 1994. 140(8): p. 669-82.
4. Weber, T., et al., Arterial stiffness, wave reflections, and the risk of coronary
artery disease. Circulation, 2004. 109(2): p. 184-9.
5. Mattace-Raso, F.U., et al., Arterial stiffness and risk of coronary heart disease
and stroke: the Rotterdam Study. Circulation, 2006. 113(5): p. 657-63.
6. Laurent, S., et al., Aortic stiffness is an independent predictor of all-cause and
cardiovascular mortality in hypertensive patients. Hypertension, 2001. 37(5): p.
1236-1241.
7. Boutouyrie, P., et al., Aortic stiffness is an independent predictor of primary
coronary events in hypertensive patients a longitudinal study. Hypertension,
2002. 39(1): p. 10-15.
8. Blacher, J., et al., Carotid arterial stiffness as a predictor of cardiovascular and
all-cause mortality in end-stage renal disease. Hypertension, 1998. 32(3): p.
570-574.
9. Laurent, S., et al., Expert consensus document on arterial stiffness:
methodological issues and clinical applications. Eur Heart J, 2006. 27(21): p.
2588-605.
10. Blacher, J., et al., Impact of aortic stiffness on survival in end-stage renal
disease. Circulation, 1999. 99(18): p. 2434-9.
11. Meaume, S., et al., Aortic pulse wave velocity predicts cardiovascular mortality
in subjects >70 years of age. Arterioscler Thromb Vasc Biol, 2001. 21(12): p.
2046-50.
12. Laurent, S., et al., Aortic stiffness is an independent predictor of fatal stroke in
essential hypertension. Stroke, 2003. 34(5): p. 1203-1206.
13. McLaughlin, J., et al., Piezoelectric sensor determination of arterial pulse wave
velocity. Physiol Meas, 2003. 24(3): p. 693-702.
14. Pereira, H.C., et al., Characterization of a double probe for local pulse wave
velocity assessment. Physiological Measurement, 2010. 31(11): p. 1449.

References
88
15. Pereira, H.C., et al. Double Headed Probe for Local Pulse Wave Velocity
Estimation-A New Device for Hemodynamic Parameters Assessment. in
BIODEVICES. 2011.
16. Almeida, V., et al., Piezoelectric probe for pressure waveform estimation in
flexible tubes and its application to the cardiovascular system. Sensors and
Actuators A: Physical, 2011. 169(1): p. 217-226.
17. Almeida, V., et al. A cardiac signal monitoring and processing system. in
Bioengineering (ENBENG), 2011. ENBENG 2011. 1st Portuguese Meeting in.
2011. IEEE.
18. Santos, P., et al. Photoplethysmographic logger with contact force and
hydrostatic pressure monitoring. in Bioengineering (ENBENG), 2013 IEEE 3rd
Portuguese Meeting in. 2013. IEEE.
19. Allen, J., Photoplethysmography and its application in clinical physiological
measurement. Physiological measurement, 2007. 28(3): p. R1.
20. Clemente, F., P. Arpaia, and P. Cimmino, A piezo-film-based measurement
system for global haemodynamic assessment. Physiol Meas, 2010. 31(5): p. 697-
714.
21. Ferreira, E.S.B., Assessment of hemodynamic parameters. 2008.
22. Vieira, J.A.P., Algorithmo development for physiological signals analysis and
cardiovascular disease diagnosis-a data mining approach. 2011.
23. Almeida, V., et al. Hemodynamic Features Extraction from a New Arterial
Pressure Waveform Probe. in BIOSIGNALS. 2011.
24. Relvas, V.P.S., Hemodynamic parameters assessment: Characterization of a
new piezoectric probe. 2011.
25. Santos, P., Photoplethysmographic logger with contact force and hydrostatic
pressure monitoring, Universidade de Coimbra, Setembro 2009.
26. Bronzino, J.D., The biomedical engineering handbook. 2. Vol. 2. 2000: CRC
press.
27. http://www.texasheartinstitute.org/HIC/Anatomy/anatomy2.cfm, accessed on 1st
August 2013.
28. Publishing, B.E. and K. Rogers, The Cardiovascular System. 2010: Britannica
Educational Pub.
29. Standring, S., Gray's Anatomy: The Anatomical Basis of Clinical Practice. 2008:
Elsevier Health Sciences UK.

References
89
30. http://www.texasheartinstitute.org/HIC/Anatomy/head.cfm, accessed on 1st
August 2013.
31. Nichols, W.W. and M.F. O'Rourke, McDonald's blood flow in arteries:
theoretical, experimental, and clinical principles. 2011: CRC Press.
32. Cheung, Y.F., Arterial stiffness in the young: assessment, determinants, and
implications. Korean Circ J, 2010. 40(4): p. 153-62.
33. Schiffrin, E.L., Vascular stiffening and arterial compliance. Implications for
systolic blood pressure. Am J Hypertens, 2004. 17(12 Pt 2): p. 39S-48S.
34. http://www.clinsci.org/cs/116/0273/cs1160273f02.gif, accessed on 8th
August
2013.
35. Nemes, A., et al., Obesity is associated with aortic enlargement and increased
stiffness: an echocardiographic study. The international journal of
cardiovascular imaging, 2008. 24(2): p. 165-171.
36. Nichols, W.W., Clinical measurement of arterial stiffness obtained from
noninvasive pressure waveforms. American Journal of Hypertension, 2005. 18:
p. 3S-10S.
37. Mackenzie, I.S., I.B. Wilkinson, and J.R. Cockcroft, Assessment of arterial
stiffness in clinical practice. QJM, 2002. 95(2): p. 67-74.
38. Avolio, A.P., M. Butlin, and A. Walsh, Arterial blood pressure measurement
and pulse wave analysis—their role in enhancing cardiovascular assessment.
Physiological measurement, 2010. 31(1): p. R1.
39. Almeida, V.M.G.d., Hemodynamic parameters assessment: an improvement of
methodologies. 2009.
40. Segers, P., et al., Limitations and pitfalls of non-invasive measurement of
arterial pressure wave reflections and pulse wave velocity. Artery Research,
2009. 3(2): p. 79-88.
41. O'Rourke, M.F., et al., Clinical applications of arterial stiffness; definitions and
reference values. Am J Hypertens, 2002. 15(5): p. 426-44.
42. Van Bortel, L.M., S.J. Vermeersch, and P. Segers, Arterial waveform and
central blood pressure: the complex links between large and small arteries.
Artery Research, 2010. 4(4): p. 118-121.
43. Murgo, J.P., et al., Aortic input impedance in normal man: relationship to
pressure wave forms. Circulation, 1980. 62(1): p. 105-16.
44. London, G.M., et al., Arterial wave reflections and survival in end-stage renal
failure. Hypertension, 2001. 38(3): p. 434-8.

References
90
45. Franklin, S.S., et al., Hemodynamic patterns of age-related changes in blood
pressure. The Framingham Heart Study. Circulation, 1997. 96(1): p. 308-15.
46. Franklin, S.S., et al., Does the relation of blood pressure to coronary heart
disease risk change with aging? The Framingham Heart Study. Circulation,
2001. 103(9): p. 1245-1249.
47. Hirata, K., M. Kawakami, and M.F. O'Rourke, Pulse wave analysis and pulse
wave velocity: a review of blood pressure interpretation 100 years after
Korotkov. Circ J, 2006. 70(10): p. 1231-9.
48. Kohara, K., et al., Effect of reflection of arterial pressure on carotid circulation
in essential hypertension. Am J Hypertens, 1999. 12(10 Pt 1): p. 1015-20.
49. Nürnberger, J., et al., Augmentation index is associated with cardiovascular risk.
Journal of hypertension, 2002. 20(12): p. 2407-2414.
50. Lemogoum, D., et al., Validity of pulse pressure and augmentation index as
surrogate measures of arterial stiffness during beta-adrenergic stimulation.
Journal of hypertension, 2004. 22(3): p. 511-517.
51. Williams, B. and P.S. Lacy, Impact of Heart Rate on Central Aortic Pressures
and HemodynamicsAnalysis From the CAFE (Conduit Artery Function
Evaluation) Study: CAFE-Heart Rate. Journal of the American College of
Cardiology, 2009. 54(8): p. 705-713.
52. Kelly, R., et al., Noninvasive determination of age-related changes in the human
arterial pulse. Circulation, 1989. 80(6): p. 1652-9.
53. Cameron, J.D., B.P. McGrath, and A.M. Dart, Use of radial artery applanation
tonometry and a generalized transfer function to determine aortic pressure
augmentation in subjects with treated hypertension. Journal of the American
College of Cardiology, 1998. 32(5): p. 1214-1220.
54. Oliver, J.J. and D.J. Webb, Noninvasive assessment of arterial stiffness and risk
of atherosclerotic events. Arterioscler Thromb Vasc Biol, 2003. 23(4): p. 554-
66.
55. Lee, H.Y. and B.H. Oh, Aging and arterial stiffness. Circ J, 2010. 74(11): p.
2257-62.
56. Boutouyrie, P., et al., Assessment of pulse wave velocity. Artery Research, 2009.
3(1): p. 3-8.
57. Hansen, T.W., et al., Prognostic value of aortic pulse wave velocity as index of
arterial stiffness in the general population. Circulation, 2006. 113(5): p. 664-
670.
58. Korteweg, D., Ueber die Fortpflanzungsgeschwindigkeit des Schalles in
elastischen Röhren. Annalen der Physik, 1878. 241(12): p. 525-542.

References
91
59. Bramwell, J.C. and A.V. Hill, The velocity of the pulse wave in man.
Proceedings of the Royal Society of London. Series B, Containing Papers of a
Biological Character, 1922. 93(652): p. 298-306.
60. Blacher, J., et al., Aortic pulse wave velocity as a marker of cardiovascular risk
in hypertensive patients. Hypertension, 1999. 33(5): p. 1111-1117.
61. Solà, J., S.F. Rimoldi, and Y. Allemann, Ambulatory monitoring of the
cardiovascular system: the role of pulse wave velocity. New Developments in
Biomedical Engineering, 2010: p. 391-424.
62. Hermeling, E., et al., Measurement of local pulse wave velocity: effects of signal
processing on precision. Ultrasound in medicine & biology, 2007. 33(5): p. 774-
781.
63. Rabben, S.I., et al., An ultrasound-based method for determining pulse wave
velocity in superficial arteries. J Biomech, 2004. 37(10): p. 1615-22.
64. Allen, J., Photoplethysmography and its application in clinical physiological
measurement. Physiol Meas, 2007. 28(3): p. R1-39.
65. Reisner, A.T., G.D. Clifford, and R.G. Mark, The physiological basis of the
electrocardiogram. 2007.
66. Wnek, G.E. and G.L. Bowlin, Encyclopedia of Biomaterials and Biomedical
Engineering. 2008: Informa Healthcare USA.
67. http://www.biopac.com/disposable-electrode-100, accessed on 6th
August 2013.
68. 6210, D.s.N.-U., http://sine.ni.com/nips/cds/print/p/lang/pt/nid/203223.
69. http://www.medicine.mcgill.ca/physio/vlab/cardio/setup.htm, accessed on 10th
August 2013.
70. PRODUCT SHEET Biopac® Systems, I.,
http://www.biopac.com/Product_Spec_PDF/EL500%20Series.pdf.
71. Santos, P., Development of a database - Cardiocheck - report , 2013.
72. Borba, J., Validation of non – invasive electromechanical sensors for cardiac
monitoring, Universidade de Coimbra, 2012.
73. Vieira, J., Algorithm development for physiological signals analysis and
cardiovascular disease diagnosis – A data mining approach, Universidade de
Coimbra, 2011;.
74. Li, B.N., M.C. Dong, and M.I. Vai, On an automatic delineator for arterial
blood pressure waveforms. Biomedical Signal Processing and Control, 2010.
5(1): p. 76-81.

References
92
75. Lu, G., et al., A comparison of photoplethysmography and ECG recording to
analyse heart rate variability in healthy subjects. J Med Eng Technol, 2009.
33(8): p. 634-41.
76. Selvaraj, N., et al., Assessment of heart rate variability derived from finger-tip
photoplethysmography as compared to electrocardiography. Journal of medical
engineering & technology, 2008. 32(6): p. 479-484.
77. Bolanos, M., H. Nazeran, and E. Haltiwanger. Comparison of heart rate
variability signal features derived from electrocardiography and
photoplethysmography in healthy individuals. in Engineering in Medicine and
Biology Society, 2006. EMBS'06. 28th Annual International Conference of the
IEEE. 2006. IEEE.
78. Pan, J. and W.J. Tompkins, A real-time QRS detection algorithm. IEEE Trans
Biomed Eng, 1985. 32(3): p. 230-6.
79. Korpas, D., J. Halek, and L. Dolezal, Parameters describing the pulse wave.
Physiol Res, 2009. 58(4): p. 473-9.
80. Millasseau, S.C., et al., Contour analysis of the photoplethysmographic pulse
measured at the finger. Journal of hypertension, 2006. 24(8): p. 1449-1456.
81. Simek, J., et al., Second derivative of the finger arterial pressure waveform: an
insight into dynamics of the peripheral arterial pressure pulse. Physiological
research, 2005. 54(5): p. 505.
82. Takazawa, K., et al., Assessment of vasoactive agents and vascular aging by the
second derivative of photoplethysmogram waveform. Hypertension, 1998. 32(2):
p. 365-70.
83. Gonzalez, R., et al. Photoplethysmographic augmentation index as a non
invasive indicator for vascular assessments. in 4th European Conference of the
International Federation for Medical and Biological Engineering. 2009.
Springer.
84. Van Bortel, L.M., et al., Clinical applications of arterial stiffness, Task Force
III: recommendations for user procedures. Am J Hypertens, 2002. 15(5): p. 445-
52.
85. Perk, J., et al., European Guidelines on cardiovascular disease prevention in
clinical practice (version 2012) The Fifth Joint Task Force of the European
Society of Cardiology and Other Societies on Cardiovascular Disease
Prevention in Clinical Practice (constituted by representatives of nine societies
and by invited experts) Developed with the special contribution of the European
Association for Cardiovascular Prevention & Rehabilitation (EACPR).
European heart journal, 2012. 33(13): p. 1635-1701.
86. Piskorski, J. and P. Guzik, Filtering poincare plots. Computational methods in
science and technology, 2005. 11(1): p. 39-48.

References
93
87. Drinnan, M.J., J. Allen, and A. Murray, Relation between heart rate and pulse
transit time during paced respiration. Physiological measurement, 2001. 22(3):
p. 425.
88. Kaibe, M., et al., Arterial stiffness index: A new evaluation for arterial stiffness
in elderly patients with essential hypertension. Geriatrics & Gerontology
International, 2002. 2(4): p. 199-205.