dartmouth college superdarn radarssuperdarn.thayer.dartmouth.edu/downloads/radar...these radars are...
TRANSCRIPT

Dartmouth College SuperDARN Radars
Under the guidance of Thayer School professor Simon Shepherd, a pair of backscatter radars were constructed in thedesert of central Oregon over the Summer and Fall of 2010. These radars are funded by the National Science Foun-
dation (NSF) and are part of an internationally funded global network of radars known as the Super Dual AuroralRadar Network (SuperDARN). There are more than 27 SuperDARN radars currently operating in the northern and
southern hemispheres.
Each radar in the SuperDARN network is operated and maintained independently by the principle investigator (PI)of the given radar. Professor Shepherd is the PI for the two radars in Oregon.

Radar Description
A SuperDARN radar consists of two arrays of antennas; a main array that transmits and receives radio waves and an
interferometer array that only receives transmissions. Each of the Oregon radar main arrays consists of 16 separateantennas and is ∼715 feet long. The overall footprint of the two radars is ∼20 acres.
View along East Main array during construction. Vis-
ible are aluminum poles, which support the antenna
wires and provide tension along the array; Kevlar guying
cables; conducting antenna and reflector wires; garage
door springs; and a deep, narrow trench where the coax-
ial cables carrying the RF signals are to be buried.
Plan view of radar site. Red dots indicate locations of
antenna poles for the westward-looking radar and blue
dots indicate those for the eastward-looking radar. Guy-
ing ground-anchor points are shown as ×s and a build-
ing, which houses computers and electronics, is located
in the center of the two arrays.
Radar Description
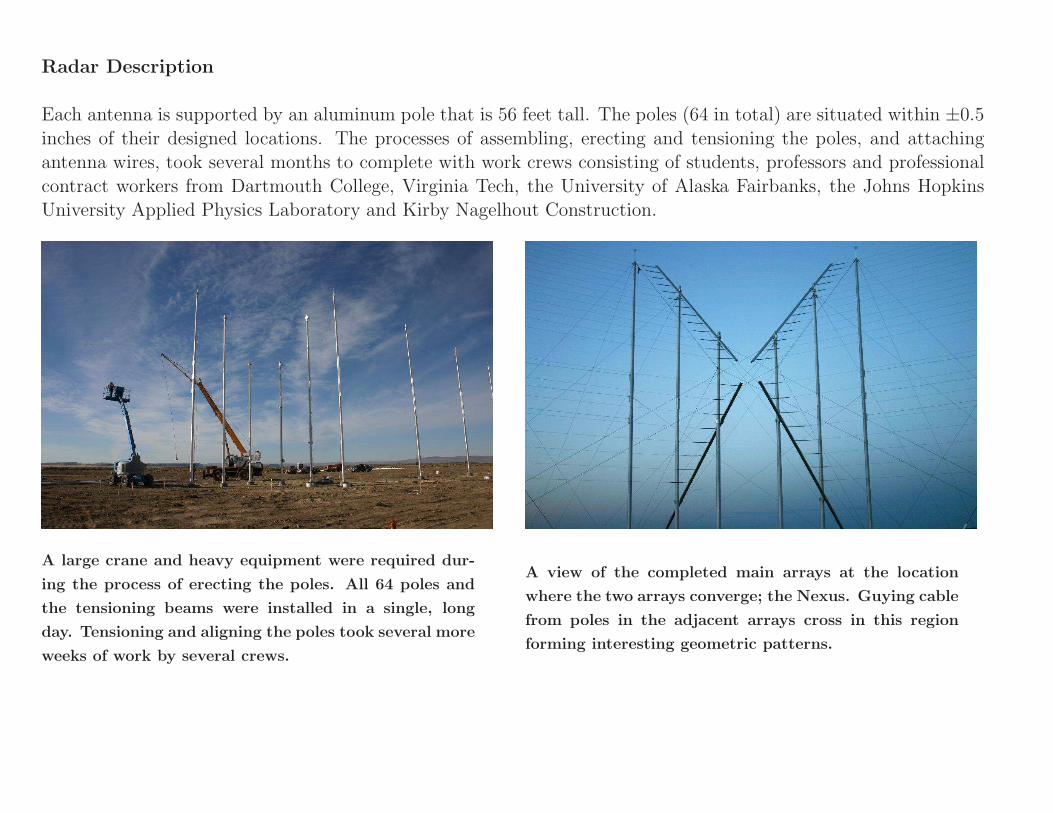
Each antenna is supported by an aluminum pole that is 56 feet tall. The poles (64 in total) are situated within ±0.5
inches of their designed locations. The processes of assembling, erecting and tensioning the poles, and attachingantenna wires, took several months to complete with work crews consisting of students, professors and professional
contract workers from Dartmouth College, Virginia Tech, the University of Alaska Fairbanks, the Johns HopkinsUniversity Applied Physics Laboratory and Kirby Nagelhout Construction.
A large crane and heavy equipment were required dur-
ing the process of erecting the poles. All 64 poles and
the tensioning beams were installed in a single, long
day. Tensioning and aligning the poles took several more
weeks of work by several crews.
A view of the completed main arrays at the location
where the two arrays converge; the Nexus. Guying cable
from poles in the adjacent arrays cross in this region
forming interesting geometric patterns.
Radar Description
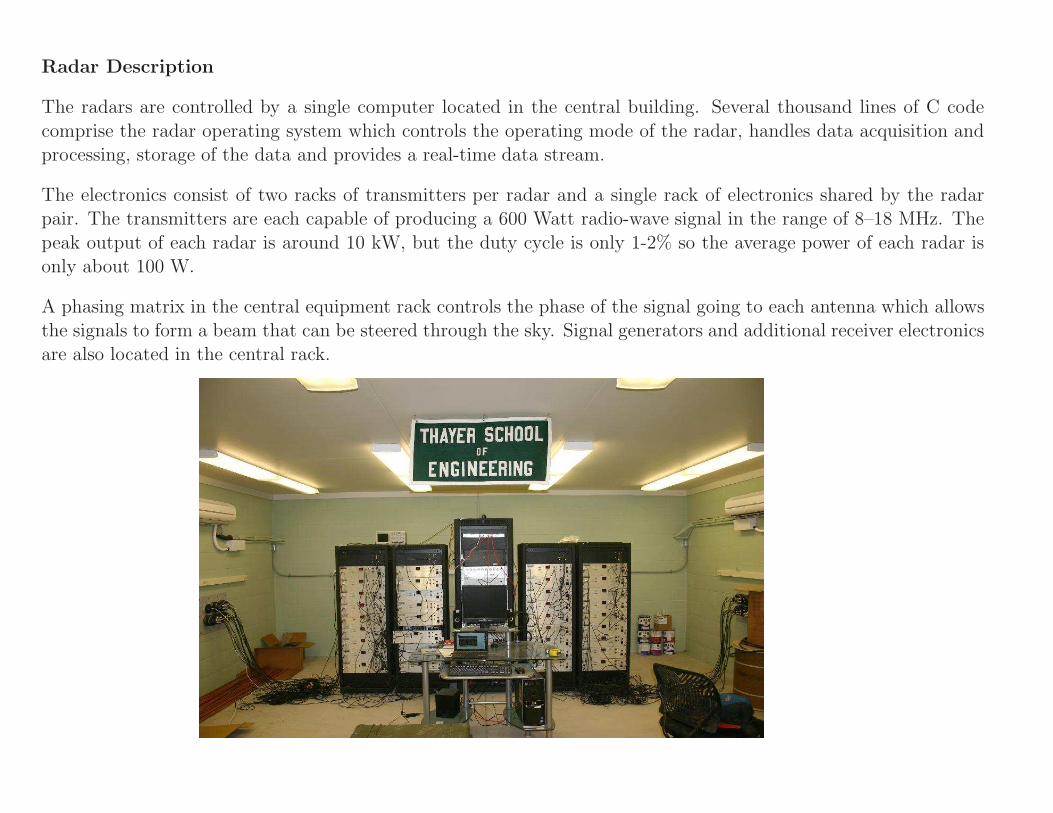
The radars are controlled by a single computer located in the central building. Several thousand lines of C code
comprise the radar operating system which controls the operating mode of the radar, handles data acquisition andprocessing, storage of the data and provides a real-time data stream.
The electronics consist of two racks of transmitters per radar and a single rack of electronics shared by the radarpair. The transmitters are each capable of producing a 600 Watt radio-wave signal in the range of 8–18 MHz. The
peak output of each radar is around 10 kW, but the duty cycle is only 1-2% so the average power of each radar isonly about 100 W.
A phasing matrix in the central equipment rack controls the phase of the signal going to each antenna which allowsthe signals to form a beam that can be steered through the sky. Signal generators and additional receiver electronicsare also located in the central rack.
Radar Operation
During normal operation, pulses of radio waves are transmitted from each radar in a direction forward of the an-
tenna arrays. The signal travels up into the Earth’s ionosphere where it refracts (bends). A portion of the signal isreflected from irregularities in the density of the ionosphere and travels back to the radar where they are sensed bythe antenna elements. If the irregularities are moving they induced a Doppler shift in the frequency of the returning
(backscattered) signal. By comparing the backscattered signal to the transmitted signal it is possible to determinethe speed at which the plasma is moving. The basic principle is the same as that used by weather radar to detect
motions of the atmosphere.
Because the radar signal is electronically steerable and radio waves can propagate several thousand kilometers from
the radar, it is possible to measure the plasma drift in the ionosphere over a large region. The standard operatingmode is to scan the radar over 24 beam-directions every minute providing a continuous picture of the plasma motion
in front of the radar.
Radio-wave propagation is complicated by the degree of variability in the structure and composition of the iono-
sphere. Several modes of backscatter are observed by SuperDARN radars. The primary mode is known as 1
2-hop
backscatter where the signal travels up into the F -layer of the ionosphere and reflected back to the radar. Measure-
ments of the plasma drift over 1000 km from the radar are possible with this mode. Measurements at further rangesare possible with 11
2-hop backscatter, where the signal bounces off the ground and back up to the ionosphere before
making the return trip, or a more complicated ducting between the different layers that can form in the ionosphere.
The other primary mode of propagation is known as ground or sea scatter. In this mode the radio-wave is reflected
off the ionosphere and back to the ground or sea at large distances from the radar where it then reflects back alongthe same path to the radar. This 1-hop mode can be especially strong over the ocean where surface roughness can
strongly reflect the signal. Although this mode is generally considered as interference it is possible to detect verticalmotion of the ionosphere at a distance halfway between the radar and the ground/sea scatter location. Detection ofatmospheric waves propagating in and through this region are possible. When the ground or sea is especially efficient
at reflecting the signal it is possible to detect 2- and 3-hop scatter where the wave continues to reflect back and forthbetween the Earth’s surface and the ionosphere and travelling many thousands of kilometers from the radar and back.

3−hopsea scatter
2−hopsea scatter
2−hopground scatter
Oregon radars 1−hopground scatter
scattermeteor
sub−auroral polarization streamsea scatter1−hop
Backscatter from the Oregon radar pair (cvw and cve) showing a strong westward flow channel across Canada. This
feature know as a sub-auroral polarization stream (SAPS) and is observed by the Oregon radars during geomagnetically
disturbed periods. Backscatter at close ranges to the radars is likely from meteor trails or the E-region. 1-, 2- and 3-hop
sea scatter is observed in the most westward looking beams of cvw and the first two hops in the most eastward looking
beams of cve.

Space Weather Monitoring
SuperDARN radars are monostatic systems and are therefore only capable of measuring the plasma motion in the
line-of-sight (LOS) direction of the radar beams. In order to measure the true motion of the plasma pairs of radarsare overlapped thereby giving complementary views of the plasma motion. This overlap is where the ’D’, for dual, inSuperDARN comes from. The ’A’, for auroral, comes from the location of the first set of radars. The auroral region
is an oval shape near the magnetic poles where energy stored in the magnetosphere (the region around the Earthwhere the Earth’s magnetic field dominates) is released and travels into the ionosphere along converging magnetic
field-lines and gives rise to the beautiful light displays known as the aurora. The auroral zone is normally locatedabove 60 degrees magnetic latitude, which is the latitude of one band of SuperDARN radars that stretch from Fin-
land across northern Europe and Canada all the way to Alaska.
The real strength of SuperDARN radar network is that while each radar is maintained and operated by PIs through-out the world, each radar conforms to a common operation schedule and data format. By working in this cooperativemode the data from all the radars can be combined together to provide a synoptic map of the plasma motion in
the Earth’s polar regions. Because plasma motion is driven by electric fields that are communicated along magneticfield-lines, the motion of the plasma in the ionosphere provides a view of the motion of plasma in the larger magne-
tosphere. This view allows scientists to study the electromagnetic coupling between the solar wind and the Earth’smagnetosphere. For this reason the network of SuperDARN radars is an important and unique tool in the study of
space weather and space climatology.
One aspect of space weather that is of particular interest is the response of the magnetosphere-ionosphere system
during geomagnetic storms; disturbances in the geospace environment that are caused by explosions on the surface ofthe Sun which expel mass and energy that travel through interplanetary space and impact the Earth’s magnetosphere.
During these storms the auroral region, and the zone of plasma motion or convection, moves equatorward. To viewthis expanded convection zone radars must be situated at latitudes further from the Earth’s magnetic poles. The
Oregon radars are located at such latitudes and are part of a second layer of radars that extend the coverage of theauroral radars to lower latitudes so that they can make observations of plasma motion during geomagnetic storms.

Space Weather and Climatology
450
-15
-3
-3
-3
3
.mrg
m/s
450
-39
-27
-15
-15
-3
-3-3
-3
-3
3
3
15
27
.mrg
m/s
Maps of the convecting plasma shown for a period of low and high geomagnetic activity. The strength of convection
is shown by colored telltales that indicate flow direction and speed according to the color-scale. Contours indicate the
electric potential associated with the plasma motion. The strength of the electric potential is 35 kV and 72 kV for the quiet
and disturbed period, respectively, indicating a stronger coupling to the solar wind in the latter case. The importance of
the mid-latitude radars, such as those in Oregon, can be seen in the disturbed period as convection expands equatorward
of 60 degrees magnetic latitude where the first layer of SuperDARN radars is located.