(dat311) large-scale genomic analysis with amazon redshift
TRANSCRIPT

© 2015, Amazon Web Services, Inc. or its Affiliates. All rights reserved.
Aaron Friedman, PhD, Human Longevity Bioinformatics
Christopher Crosbie, AWS Solutions Architect
October 2015
DAT311
Large-Scale Genomic Analysis with
Amazon Redshift

TGATGATGAAGACATCAGCATTGAAGGGCTGAGAACACATCCCGGGGCCGACT
TCCCGACGGCGGCAATCATTAACGGTCGTCGCGGTATTGAAGAAGCTTACCTT
ACGGTCGCGGCAAGGTGTATATCCGCGCTCGCGCAGAAGTGGAAGTTGACGCCACCGGTTCGTGAAACCATTATCGTCCACGAAATTCCGTATCAGGTAAACAAAGCGCGCCTGATCGAGAAGATTGCGAACTGGTAAAGAAAGCCGTGAAGGCATCAACGCATGCTCGGTGAAAACTGCTAAAGCTCGCCATCGTGCTCAATATCCTTGAAGCATTAGCCGTGGCGCTGGCAACATCGACCCGATCATCGAACTGATCCGTCATGCGCCGACCGCTCAACTGGATCTGCGTTTGCAGAAACTGACCGGTCTTGAGCACGACCACCGGTTCGTGAAACCATTATCGTCCACGAAATTCCGTATCAGGTAAACAAAGCGCGCCTGATCGAGAAGATTGCGAACTGGTAAAGAAAGCCGTGAAGGCATCAACGCATGCTCGGTGAAAACTGCTAAAGCTCGCCATCGTGCTCAATATCCTTGAAGCATTAGCCGTGGCGCTGGCAACATCGACCCGATCATCGAACTGATCCGTCATGCGCCGACCGCTCAACTGGATCTGCGTTTGCAGAAACTGACCGGTCTTGAGCACGAAAACTGCTCGACGAATACAAAGAGCTGCTGGAAATCAGATCGCGAACTGTTGCTATTCTTGGTAAGCGCCGATCGTCTGATGAAATGACCGTGAACCGCACATCGGTGAAAACGCTACGTTAAAGTATCACCCGCTTGAAATGACCGTGAA

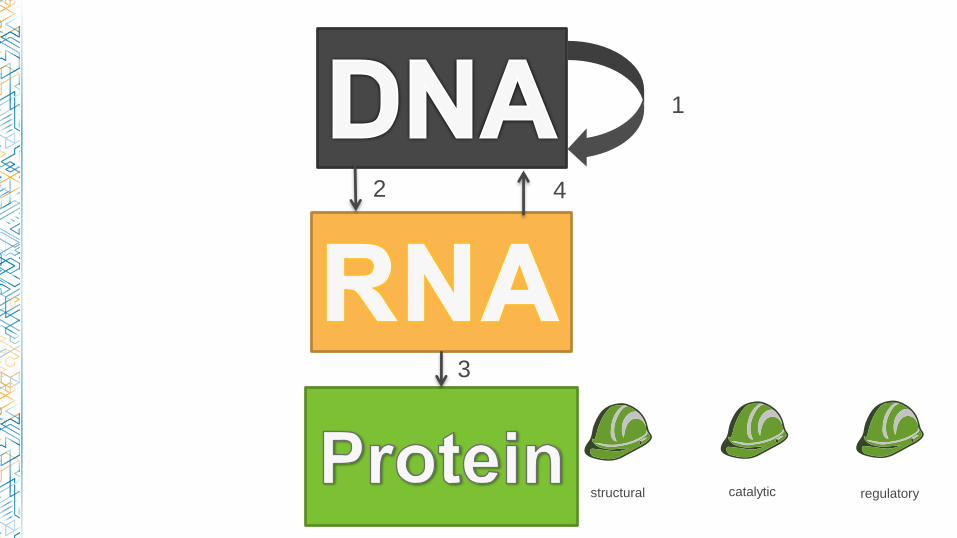
Biology 101 -The basic unit of life is the cell
-Genetic information is encoded by DNA
-Information is transcribed into RNA
-A gene is now usually defined as a specific sequence of DNA
-The entire corpus of information needed to produce and
operate the cells of an organism is approximately the genome

Biology 101
-The basic unit of life is the cell
Processor
-Genetic information is encoded by DNA
Byte code
-Information is transcribed into RNA
Assembly language
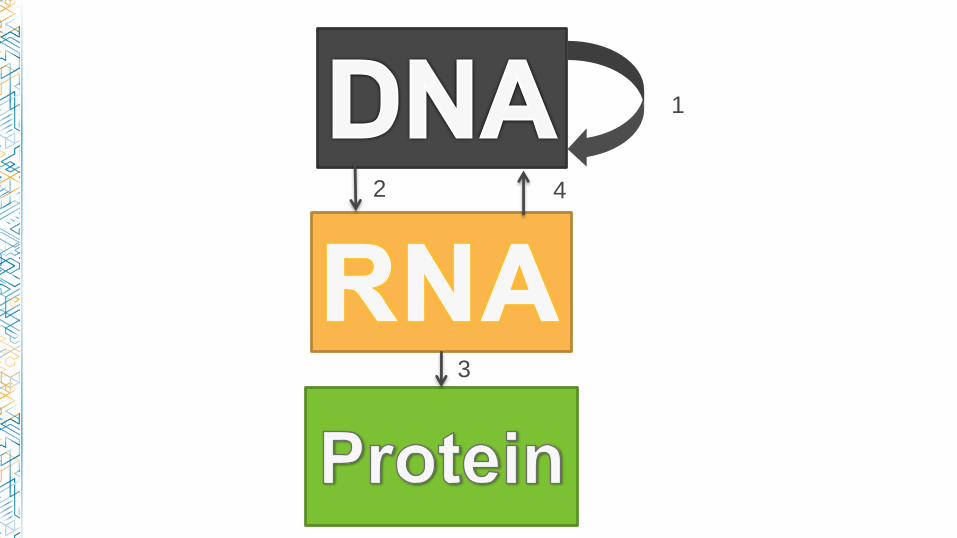
1
2
3
4
1
2
3
4
structural catalytic regulatory
DNA is not immutable

ACAGATACAGTCCGATCCATTTTCGGACTAGCATAGCATCTGACTG
hg19:
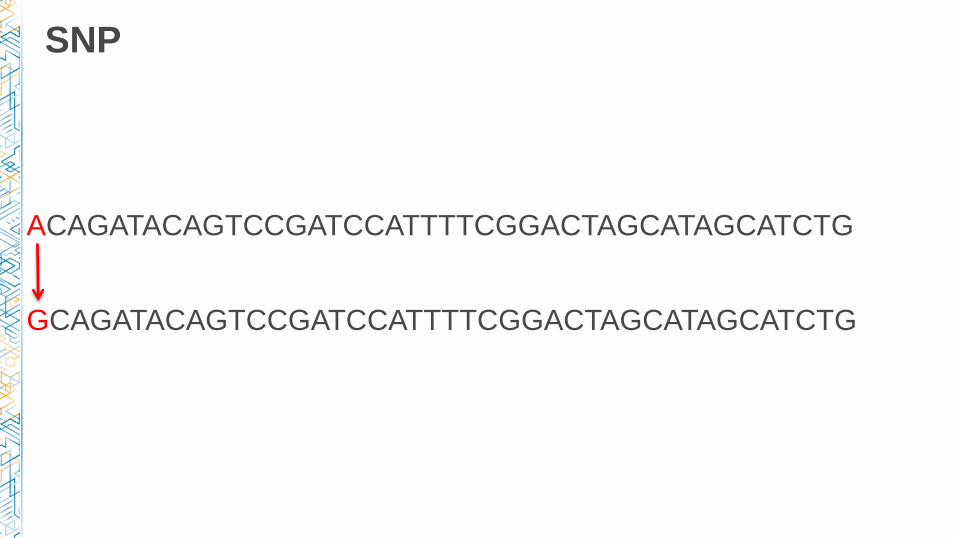
ACAGATACAGTCCGATCCATTTTCGGACTAGCATAGCATCTG
SNP
GCAGATACAGTCCGATCCATTTTCGGACTAGCATAGCATCTG

ACAGATACAGTCCGATCCATTTTCGGACTAGCATAGCATCTG
Duplication
GCAGATACAGATACAGTCCGATCCATTTTCGGACTAGCATAGCATCTG

ACAGATACAGTCCGATCCATTTTCGGACTAGCATAGCATCTG
Deletion
GCAGATACAGATACAGTCCGATC[]GGACTAGCATAGCATCTG

ACAGATACAGTCCGATCCATTTTCGGACTAGCATAGCATCTG
Insertion
GCAGATACAGATACAGTCCGATC[]GGACTAGCAAAAATAGCATCTG

ACAGATACAGTCCGATCCATTTTCGGACTAGCATAGCATCTG
Inversion
GCAGATACAGATACAGTCCGATC[]GGACTAGCAAAAATATACGCTG

Exon (coding) vs Intron (non-coding)
GCAGATACTCCCGACGGCAGATACGGCAATCAGTCCGATCATTAACGGTCGTC
GCGGTATTGAAGAAGCTTACCTACGGTCGCGGCAAGGTGTATATCCGCGCTC
GCGCAGAAGTGGAAGTTGACGCCACCGGTTCGTGAAACCATTATCGTCCACG
AAATTCCGTATCAGGTAAACAAAGCGCGCCTGATCGAGAAGATTGCGAACTGG
GACTAGCGTAAAGAAAGCCGTGAAGGCATCAACGCATGCTCGGTGAAAACTG
CTAAAGCTCGCCATCGTGCTCAATATCCTTGAAGCATTAGCCGTGGCGCTGGC
AACATCGACCCGATCATCGAACTGATCCGTCATGCGCCGACCGCTCAACTGG
ATCTGCGTTTGCAGAAACTGACCGGTCTTGAGCACGAAAACTGCTCGACGAA
TACAAAGAGCTGCTGGAAATCAAAAAGATCGCGAACTGTTGCTATTCTTGGTA
AGCGCCGATCGTCTGATGAAATGACCGTGAACCGCCAACAGCGCAGACATCG
GTGAAAACGCTACGTTAAAGTATCATATACGCTGACCCGCT
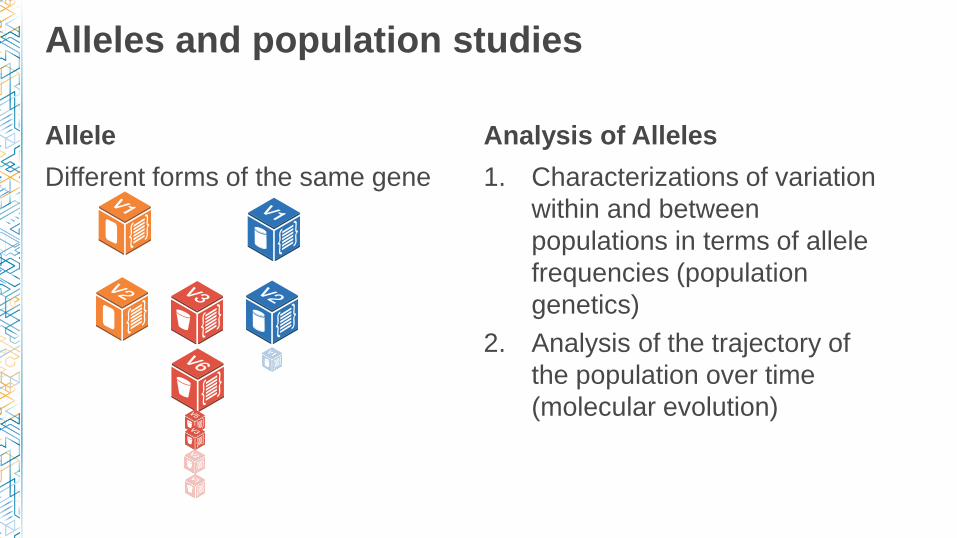
Allele
Different forms of the same gene
Alleles and population studies
Analysis of Alleles
1. Characterizations of variation
within and between
populations in terms of allele
frequencies (population
genetics)
2. Analysis of the trajectory of
the population over time
(molecular evolution)

Variant call format
http://vishuo.com/new/wp-content/uploads/2014/01/8.png

Fast, simple, petabyte-scale data warehousing for less than $1,000/TB/Year
Amazon Redshift
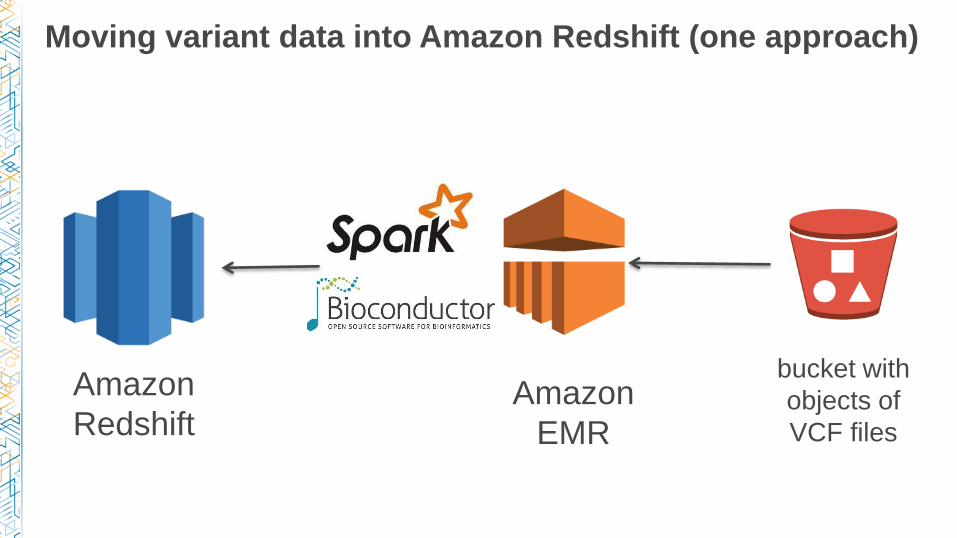
Moving variant data into Amazon Redshift (one approach)
bucket with
objects of
VCF files
Amazon
EMR
Amazon
Redshift

Using R and Bioconductor for Amazon Redshift load
#The VariantAnnotation package
library(VariantAnnotation)
Vcf <- readVcf(TabixFile(vcf_file), “hg19”, parms)
#put this VCF into standard R data frame
Variant_df <- fixed(vcf)
(variant_df)
http://tinyurl.com/qz7lhxo
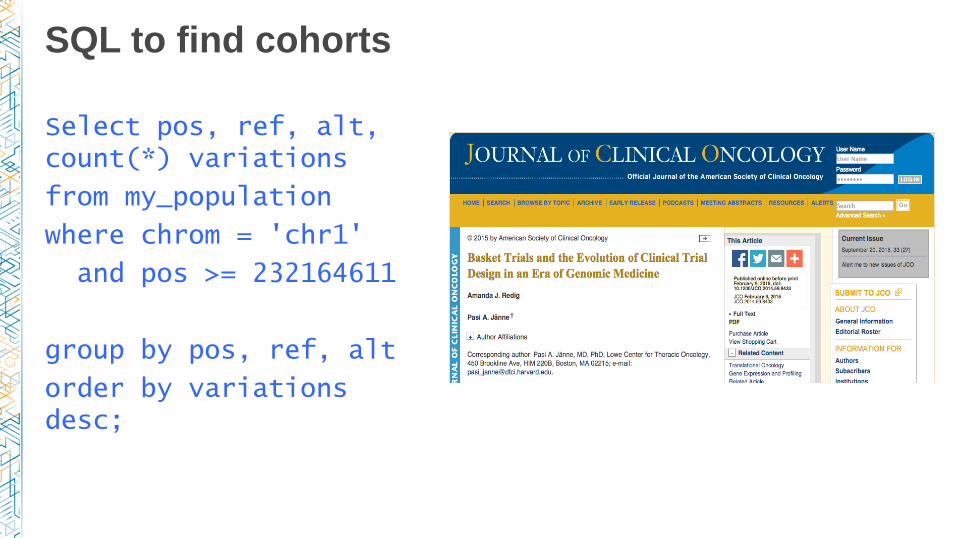
SQL to find cohorts
Select pos, ref, alt, count(*) variations
from my_population
where chrom = 'chr1'
and pos >= 232164611
group by pos, ref, alt
order by variations desc;

Other Amazon Redshift features

New SQL functions
We add SQL functions regularly to expand the query capabilities of Amazon Redshift
Added 25+ window and aggregate functions since launch, including:
• LISTAGG
• APPROXIMATE_COUNT
• DROP IF EXISTS, CREATE IF NOT EXISTS
• REGEXP_SUBSTR, _COUNT, _INSTR, _REPLACE
• PERCENTILE_CONT, _DISC, MEDIAN
• PERCENT_RANK, RATIO_TO_REPORT
We’ll continue iterating but also want to enable you to write your own
Scalar user-defined functions
You can write UDFs using Python 2.7
Comes with Pandas, NumPy, and SciPy pre-installed
• You can also import your own libraries for even more flexibility

Scalar UDF example
CREATE FUNCTION f_pvalue
(alpha float, x_bar float, test_val float, sigma float, n float)
RETURNS float
IMMUTABLE AS $$
import scipy.stats as st
import math as math
z = (x_bar – test_val) / (sigma / math.sqrt(n))
return st.norm.cdf(z)
$$ LANGUAGE plpythonu;
1 [1,1] [1,2] [1,3] [1,4]
2 [2,1] [2,2] [2,3] [2,4]
3 [3,1] [3,2] [3,3] [3,4]
4 [4,1] [4,2] [4,3] [4,4]
1 2 3 4
prod_id
cust_id
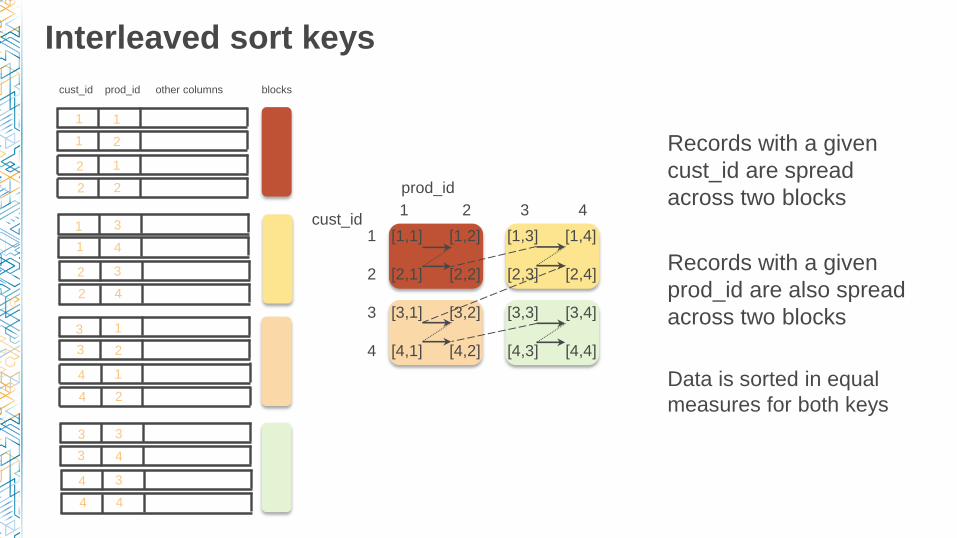
Interleaved sort keys
Records with a given
cust_id are spread
across two blocks
Records with a given
prod_id are also spread
across two blocks
Data is sorted in equal
measures for both keys
1
1
2
2
2
1
2
3
3
4
4
4
3
4
3
1
3
4
4
2
1
2
3
3
1
2
2
4
3
4
1
1
cust_id prod_id other columns blocks
Leveraging Amazon Redshift
for genomic insights
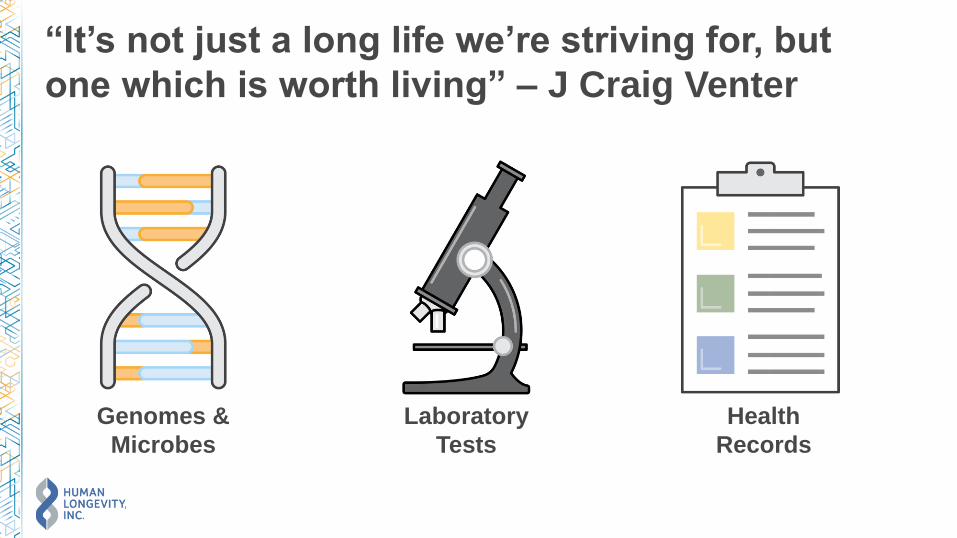
“It’s not just a long life we’re striving for, but
one which is worth living” – J Craig Venter
Genomes &
Microbes
Laboratory
Tests
Health
Records

Some of our customers
Pharma
Biotech
Hospitals
Insurance
Internal R&D

Our team
Bioinformatics
Aaron Friedman
Jason Knight
Jason Piper
Software Eng
Ryan Ulaszek
Alexey Volochenko
Rafael Zuniga
DevOps
John Dorman
Michael Miller
Software Quality
Bruce Baiden
Michael Wibbeke
Addt’l Key Players
Bryan Coon
Chad Garner
Marina Mironer
Mi Hyun Song

The problem
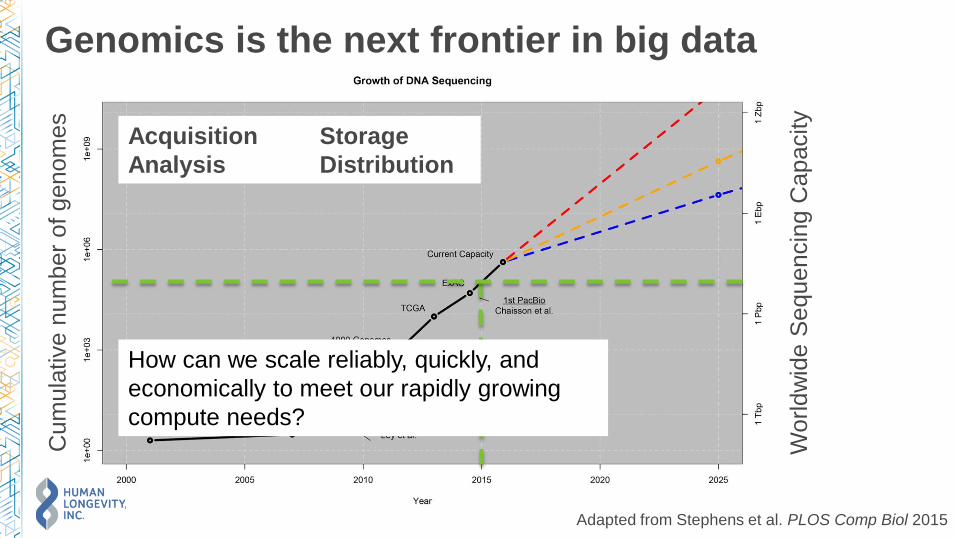
Genomics is the next frontier in big data
Adapted from Stephens et al. PLOS Comp Biol 2015
Acquisition Storage
Analysis Distribution
How can we scale reliably, quickly, and
economically to meet our rapidly growing
compute needs?
Cum
ula
tive n
um
ber
of genom
es
Wo
rld
wid
e S
equ
en
cin
g C
ap
acity

Some of our requirements
High-throughput processing of samples
Secure data storage and analysis
Query PBs of data in near real-time
Reliable and repeatable deployments
Store PBs of data with disaster recovery
EC2
SWF
Optimized Instances
CloudTrail
IAM
Trusted Advisor
S3
EMR
Amazon Redshift
CloudFormation
OpsWorks
S3
Amazon Glacier

Throughput is critical for our analysis
Raw
Sequence
Data
Demultiplex FASTQs Alignment/VC
Alignment/VC
gVCF.gz
Alignment/VC gVCF.gz
gVCF.gz
5GB
5GB
5GB
650GB 80 GB (8)
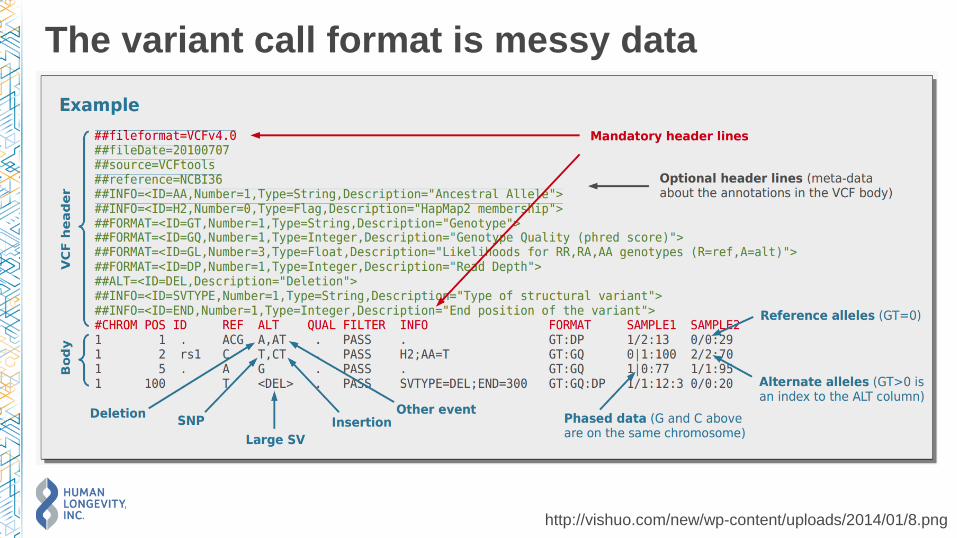
The variant call format is messy data
http://vishuo.com/new/wp-content/uploads/2014/01/8.png
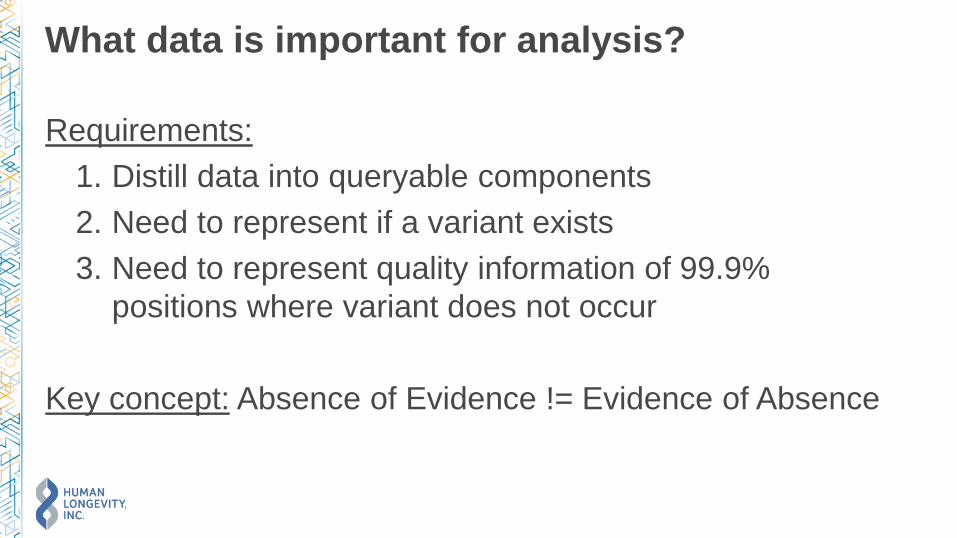
What data is important for analysis?
Requirements:
1. Distill data into queryable components
2. Need to represent if a variant exists
3. Need to represent quality information of 99.9%
positions where variant does not occur
Key concept: Absence of Evidence != Evidence of Absence

ETL + Denormalization
gVCF Extract Tables Variants
Quality Info
300M
records/sample
4.5M
records/sample
Genome
Annotation DB
Explode Ranges
and Denormalize

Why Amazon Redshift: scaling for table growth
0
5E+13
1E+14
1.5E+14
2E+14
2.5E+14
3E+14
3.5E+14
1 10 100 1000 10000 100000 1000000
Nu
mb
er
of
Rec
ord
s
Number of Samples
Variants Table Low Quality Table
1
1000
1000000
1E+09
1E+12
1E+15
1 10 100 1000 10000 100000 1000000
Nu
mb
er
of
Rec
ord
s
Number of Samples
Variants Table Quality Info Table
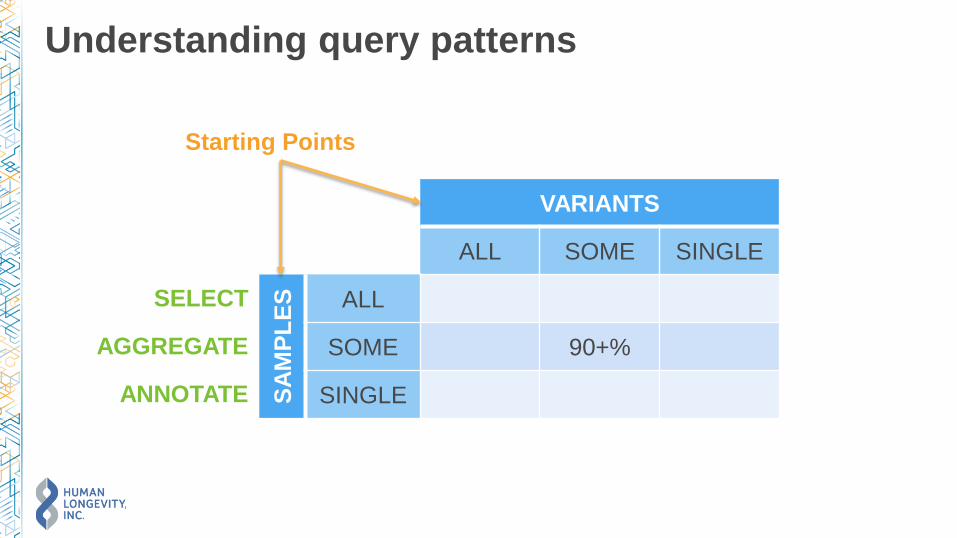
Understanding query patterns
VARIANTS
ALL SOME SINGLE
SA
MP
LE
S ALL
SOME 90+%
SINGLE
Starting Points
SELECT
AGGREGATE
ANNOTATE
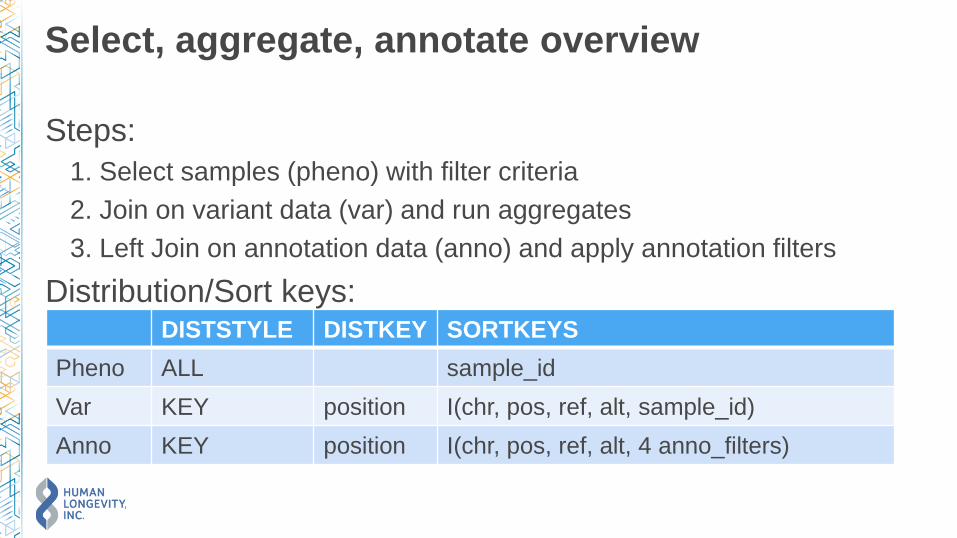
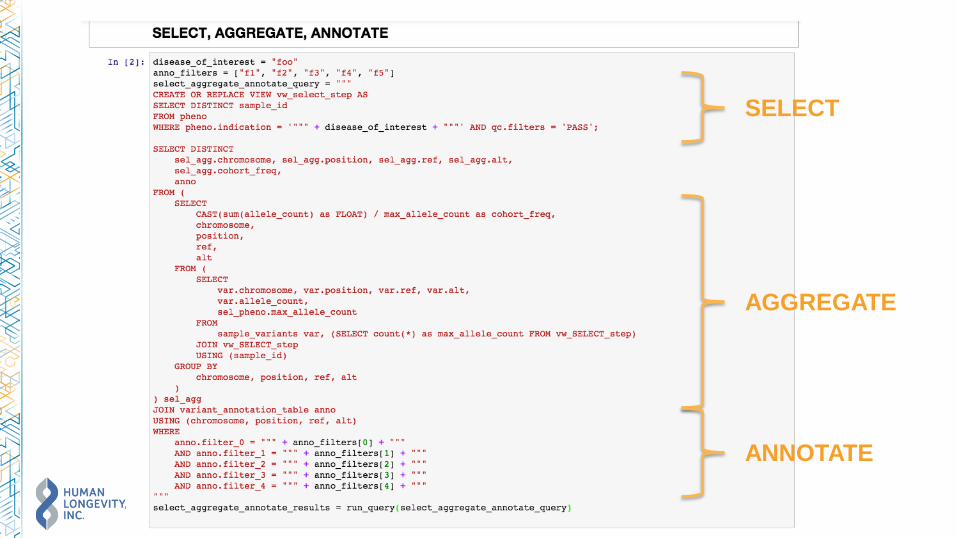
Select, aggregate, annotate overview
Steps:
1. Select samples (pheno) with filter criteria
2. Join on variant data (var) and run aggregates
3. Left Join on annotation data (anno) and apply annotation filters
Distribution/Sort keys:DISTSTYLE DISTKEY SORTKEYS
Pheno ALL sample_id
Var KEY position I(chr, pos, ref, alt, sample_id)
Anno KEY position I(chr, pos, ref, alt, 4 anno_filters)

Select, aggregate, annotate questions
Given a set of samples, which variants:
• Are frequency differences compared to a control?
• Are in regions of known high quality?
• Have specific known characteristics?
• In specific regions
• Previously associated with outcomes
• Predicted to cause specific changes
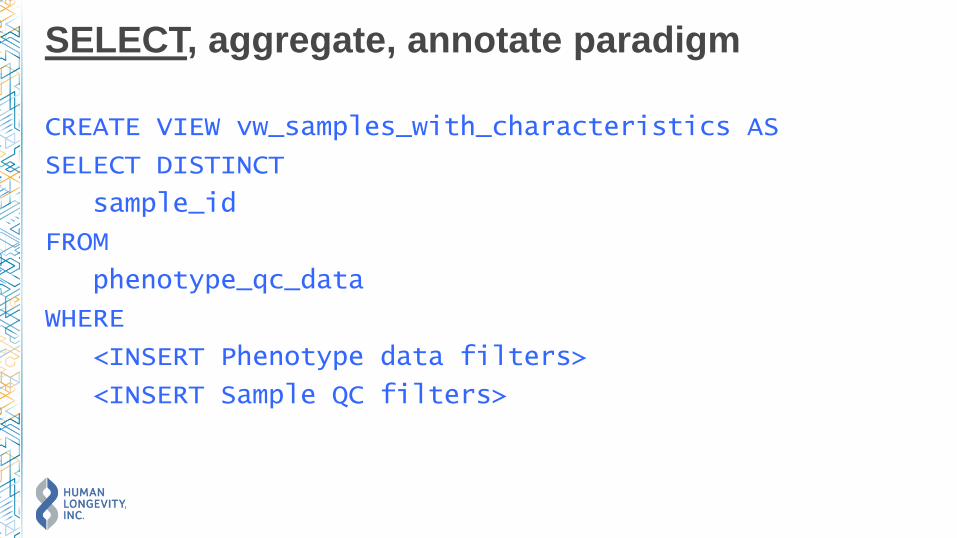
SELECT, aggregate, annotate paradigm
CREATE VIEW vw_samples_with_characteristics AS
SELECT DISTINCT
sample_id
FROM
phenotype_qc_data
WHERE
<INSERT Phenotype data filters>
<INSERT Sample QC filters>

Select, AGGREGATE, annotate paradigm
CREATE VIEW vw_frequencies AS
SELECT
var.cpra_key,
sum(var.allele_count)/(2*ns.num_samples) as freq
FROM
sample_variants var, (select count(*) from vw_samples_with_characteristics) ns
INNER JOIN vw_samples_with_characteristics sam
ON var.sample_id = sam.sample_id
GROUP BY cpra_key

Select, aggregate, ANNOTATE paradigm
CREATE VIEW vw_annotated_cohort AS
SELECT
var.cpra_key, var.freq, anno.*
FROM
vw_frequencies freq
INNER JOIN annotation_table anno
USING (cpra_key)
WHERE <Insert annotation filter criteria>
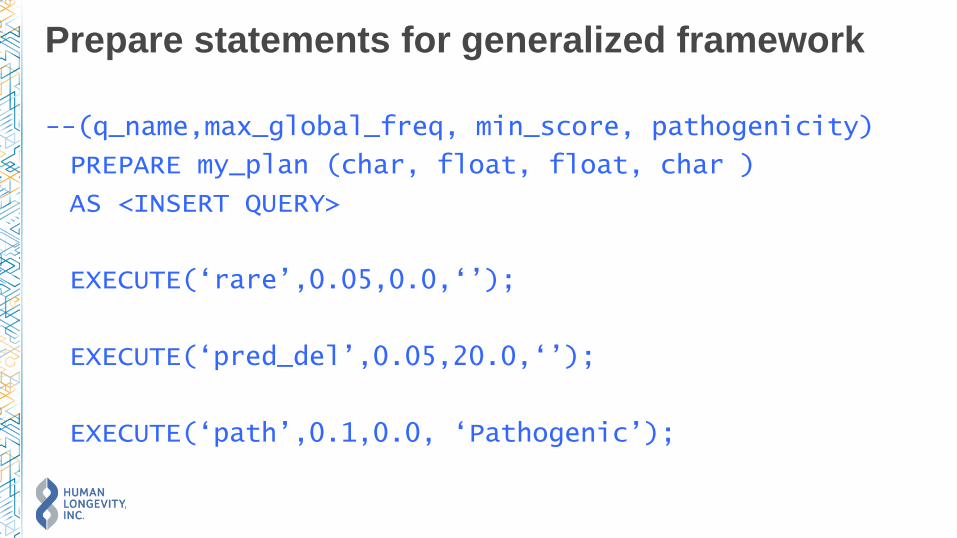
Prepare statements for generalized framework
--(q_name,max_global_freq, min_score, pathogenicity)
PREPARE my_plan (char, float, float, char )
AS <INSERT QUERY>
EXECUTE(‘rare’,0.05,0.0,‘’);
EXECUTE(‘pred_del’,0.05,20.0,‘’);
EXECUTE(‘path’,0.1,0.0, ‘Pathogenic’);
Extending analysis: IPython

OpsWorks simplifies deployment

Can replace prepare
statements
SELECT
AGGREGATE
ANNOTATE

Looking ahead…

4X Cost Overhead!
Streamlining ingress

Modifying our ETL
gVCF(s) Extract Tables Variants
Quality Info Genome
Annotation DB
Convert
SampleID to
TimeID
Updated
Sample-
Time Table
Genome
Annotation DB
(switch sortkeys)

UDFs

To conclude
• Amazon Redshift has allowed us to quickly scale to
analyzing thousands of genomes
• Amazon Redshift fits very well with the common query
patterns in genomics
• Do more work up front
• Explode out ranges in ETL
• Denormalize as much as possible to reduce joins
• Formatting to eliminate batch inserts is advantageous
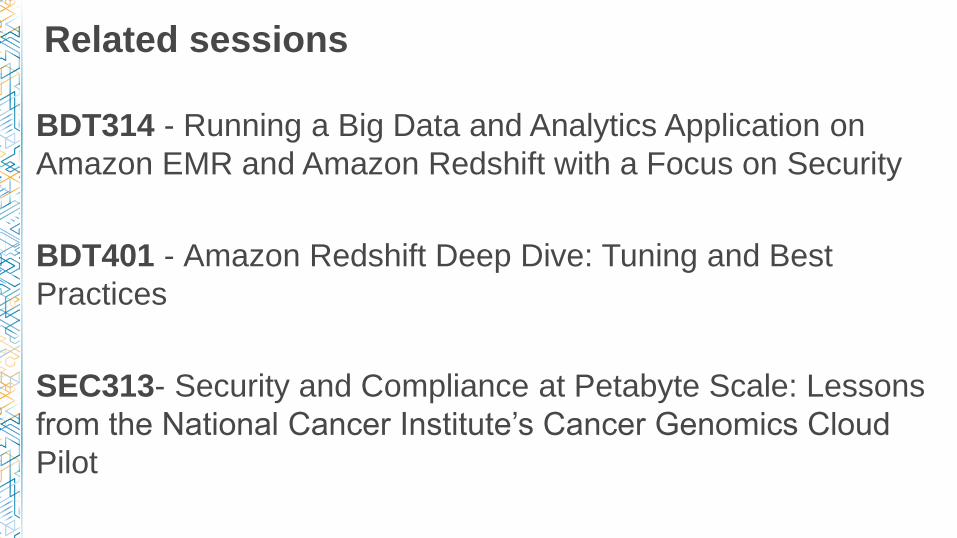
Related sessions
BDT314 - Running a Big Data and Analytics Application on
Amazon EMR and Amazon Redshift with a Focus on Security
BDT401 - Amazon Redshift Deep Dive: Tuning and Best
Practices
SEC313- Security and Compliance at Petabyte Scale: Lessons
from the National Cancer Institute’s Cancer Genomics Cloud
Pilot
Thank you!
Remember to complete
your evaluations!