data analysis and probability - national center for … · 2008-12-03 · of techniques for...
TRANSCRIPT
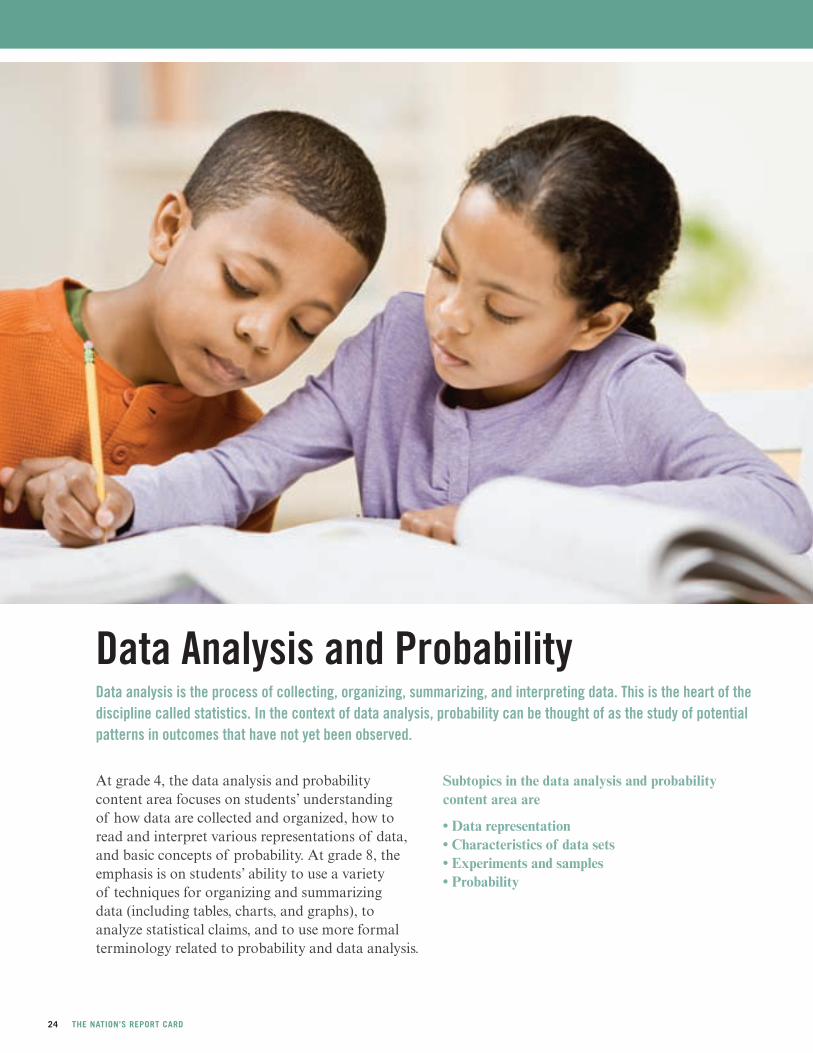
At grade 4, the data analysis and probability content area focuses on students’ understanding of how data are collected and organized, how to read and interpret various representations of data, and basic concepts of probability. At grade 8, the emphasis is on students’ ability to use a variety of techniques for organizing and summarizing data (including tables, charts, and graphs), to analyze statistical claims, and to use more formal terminology related to probability and data analysis.
Data Analysis and ProbabilityData analysis is the process of collecting, organizing, summarizing, and interpreting data. This is the heart of the discipline called statistics. In the context of data analysis, probability can be thought of as the study of potential patterns in outcomes that have not yet been observed.
Subtopics in the data analysis and probability content area are
• Data representation • Characteristics of data sets • Experiments and samples • Probability
24 THE NATION’S REPORT CARD
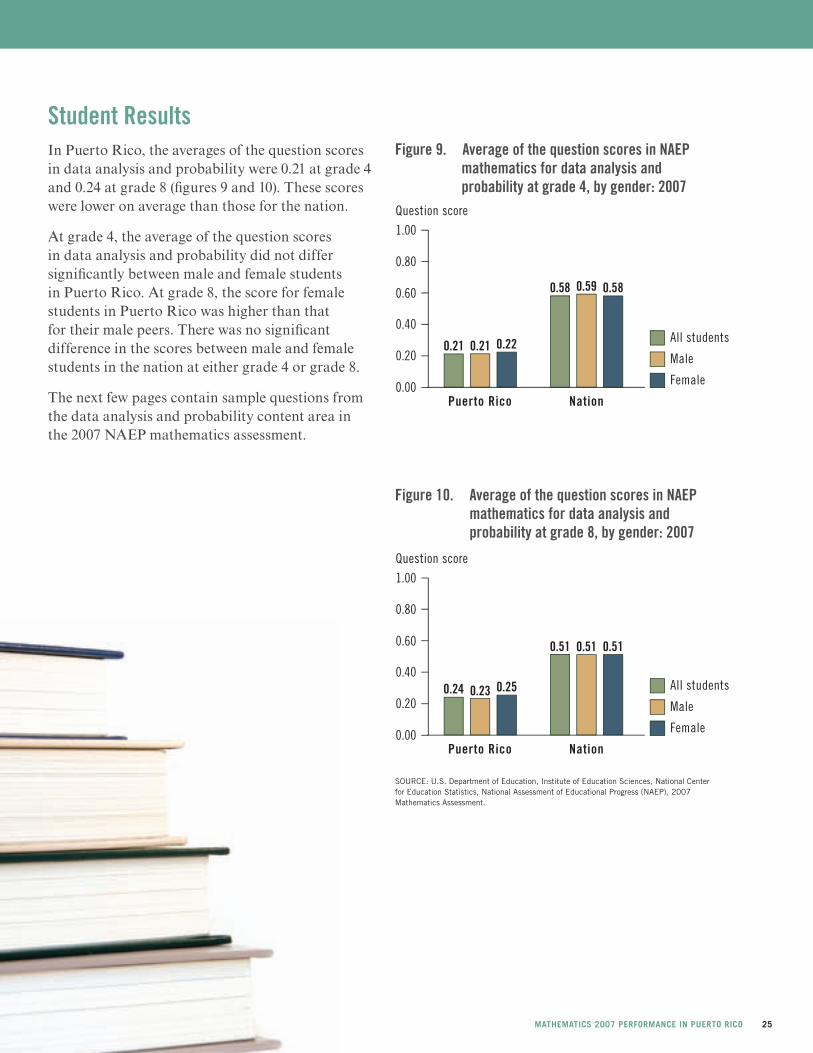
Student ResultsIn Puerto Rico, the averages of the question scores in data analysis and probability were 0.21 at grade 4 and 0.24 at grade 8 (figures 9 and 10). These scores were lower on average than those for the nation.
At grade 4, the average of the question scores in data analysis and probability did not differ significantly between male and female students in Puerto Rico. At grade 8, the score for female students in Puerto Rico was higher than that for their male peers. There was no significant difference in the scores between male and female students in the nation at either grade 4 or grade 8.
The next few pages contain sample questions from the data analysis and probability content area in the 2007 NAEP mathematics assessment.
Figure 9. Average of the question scores in NAEP mathematics for data analysis and probability at grade 4, by gender: 2007
0.21 0.21
Puerto Rico
0.22
0.58
Nation
0.59 0.58
All students
Male
Female
0.80
1.00
0.60
0.40
0.20
Question score
0.00
Figure 10. Average of the question scores in NAEP mathematics for data analysis and probability at grade 8, by gender: 2007
SOURCE: U.S. Department of Education, Institute of Education Sciences, National Center for Education Statistics, National Assessment of Educational Progress (NAEP), 2007 Mathematics Assessment.
0.24 0.23
Puerto Rico
0.25
0.51
Nation
0.51 0.51
All students
Male
Female
0.80
1.00
0.60
0.40
0.20
Question score
0.00
MATHEMATICS 2007 PERFORMANCE IN PUERTO RICO 25
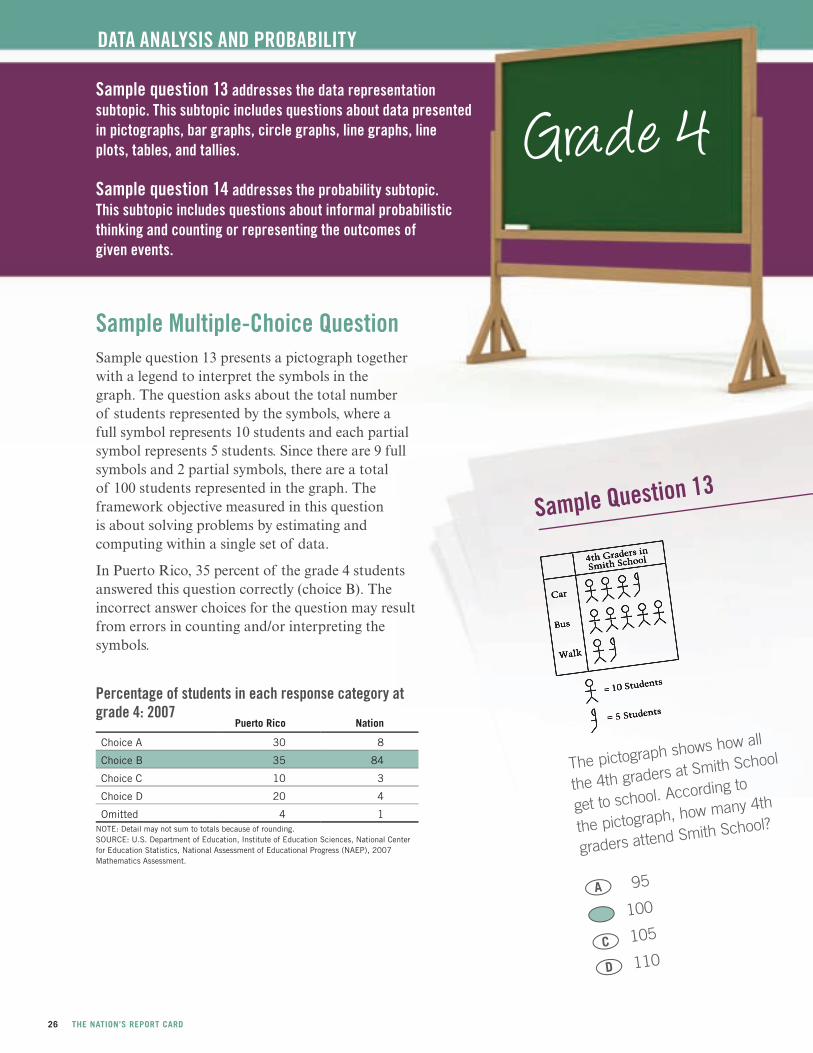
Grade 4Sample question 13 addresses the data representation subtopic. This subtopic includes questions about data presented in pictographs, bar graphs, circle graphs, line graphs, line plots, tables, and tallies. Sample question 14 addresses the probability subtopic. This subtopic includes questions about informal probabilistic thinking and counting or representing the outcomes of given events.
The pictograph shows how all
the 4th graders at Smith School
get to school. According to
the pictograph, how many 4th
graders attend Smith School?
Sample Question 13
Car
Bus
Walk
4th Graders in
Smith School
10 Students
5 Students
A
C
D
95
100
105
110
Sample Multiple-Choice QuestionSample question 13 presents a pictograph together with a legend to interpret the symbols in the graph. The question asks about the total number of students represented by the symbols, where a full symbol represents 10 students and each partial symbol represents 5 students. Since there are 9 full symbols and 2 partial symbols, there are a total of 100 students represented in the graph. The framework objective measured in this question is about solving problems by estimating and computing within a single set of data.
In Puerto Rico, 35 percent of the grade 4 students answered this question correctly (choice B). The incorrect answer choices for the question may result from errors in counting and/or interpreting the symbols.
DATA ANALYSIS AND PROBABILITY
NOTE: Detail may not sum to totals because of rounding.SOURCE: U.S. Department of Education, Institute of Education Sciences, National Center for Education Statistics, National Assessment of Educational Progress (NAEP), 2007 Mathematics Assessment.
Percentage of students in each response category at grade 4: 2007
Puerto Rico Nation
Choice A 30 8
Choice B 35 84
Choice C 10 3
Choice D 20 4
Omitted 4 1
26 THE NATION’S REPORT CARD
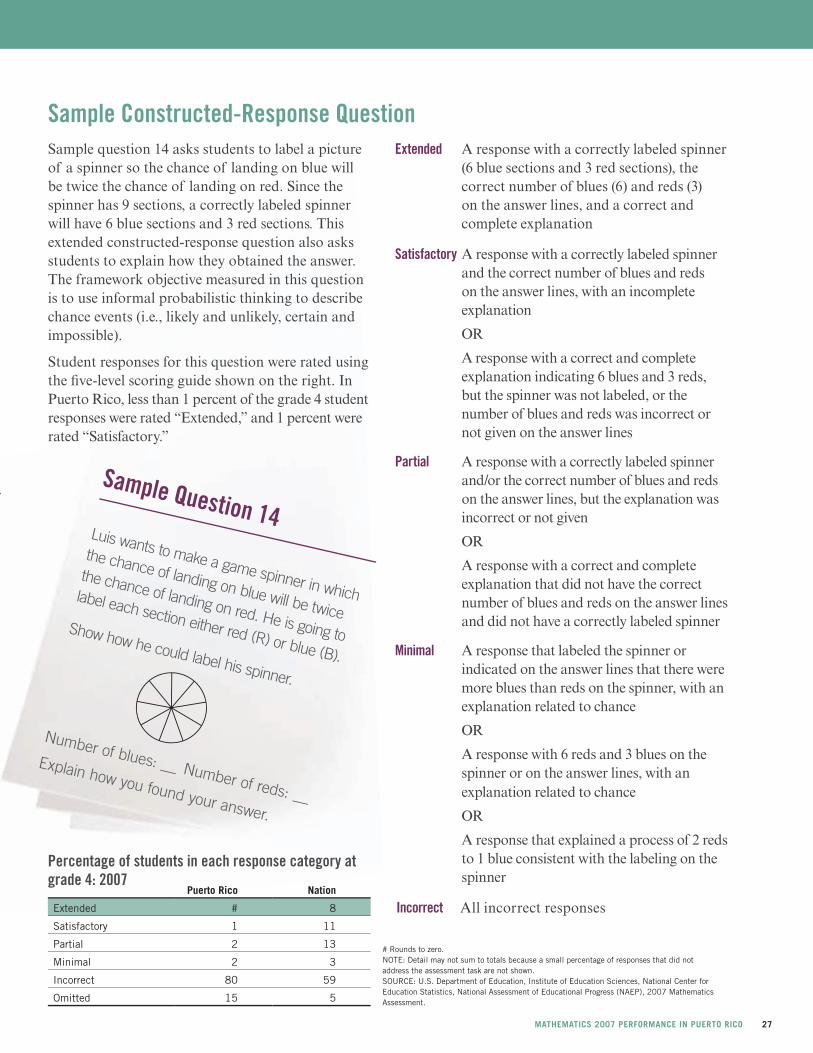
Sample Question 14Luis wants to make a game spinner in which
the chance of landing on blue will be twice
the chance of landing on red. He is going to
label each section either red (R) or blue (B).
Show how he could label his spinner.
Number of blues: __ Number of reds: __
Explain how you found your answer.
Sample question 14 asks students to label a picture of a spinner so the chance of landing on blue will be twice the chance of landing on red. Since the spinner has 9 sections, a correctly labeled spinner will have 6 blue sections and 3 red sections. This extended constructed-response question also asks students to explain how they obtained the answer. The framework objective measured in this question is to use informal probabilistic thinking to describe chance events (i.e., likely and unlikely, certain and impossible).
Student responses for this question were rated using the five-level scoring guide shown on the right. In Puerto Rico, less than 1 percent of the grade 4 student responses were rated “Extended,” and 1 percent were rated “Satisfactory.”
Extended A response with a correctly labeled spinner (6 blue sections and 3 red sections), the correct number of blues (6) and reds (3) on the answer lines, and a correct and complete explanation
Satisfactory A response with a correctly labeled spinner and the correct number of blues and reds on the answer lines, with an incomplete explanation
OR
A response with a correct and complete explanation indicating 6 blues and 3 reds, but the spinner was not labeled, or the number of blues and reds was incorrect or not given on the answer lines
Partial A response with a correctly labeled spinner and/or the correct number of blues and reds on the answer lines, but the explanation was incorrect or not given
OR
A response with a correct and complete explanation that did not have the correct number of blues and reds on the answer lines and did not have a correctly labeled spinner
Minimal A response that labeled the spinner or indicated on the answer lines that there were more blues than reds on the spinner, with an explanation related to chance
OR
A response with 6 reds and 3 blues on the spinner or on the answer lines, with an explanation related to chance
OR
A response that explained a process of 2 reds to 1 blue consistent with the labeling on the spinner
Incorrect All incorrect responses
# Rounds to zero.NOTE: Detail may not sum to totals because a small percentage of responses that did not address the assessment task are not shown.SOURCE: U.S. Department of Education, Institute of Education Sciences, National Center for Education Statistics, National Assessment of Educational Progress (NAEP), 2007 Mathematics Assessment.
Sample Constructed-Response Question
Percentage of students in each response category at grade 4: 2007
Puerto Rico Nation
Extended # 8
Satisfactory 1 11
Partial 2 13
Minimal 2 3
Incorrect 80 59
Omitted 15 5
MATHEMATICS 2007 PERFORMANCE IN PUERTO RICO 27
Sample Question 15
D
B
APictographCircle graphLine graphBox-and-whisker plot
Stem-and-leaf plot
E
Which of the following types of
graph would be best to show the
change in temperature recorded
in a city every 15 minutes over a
24-hour period?
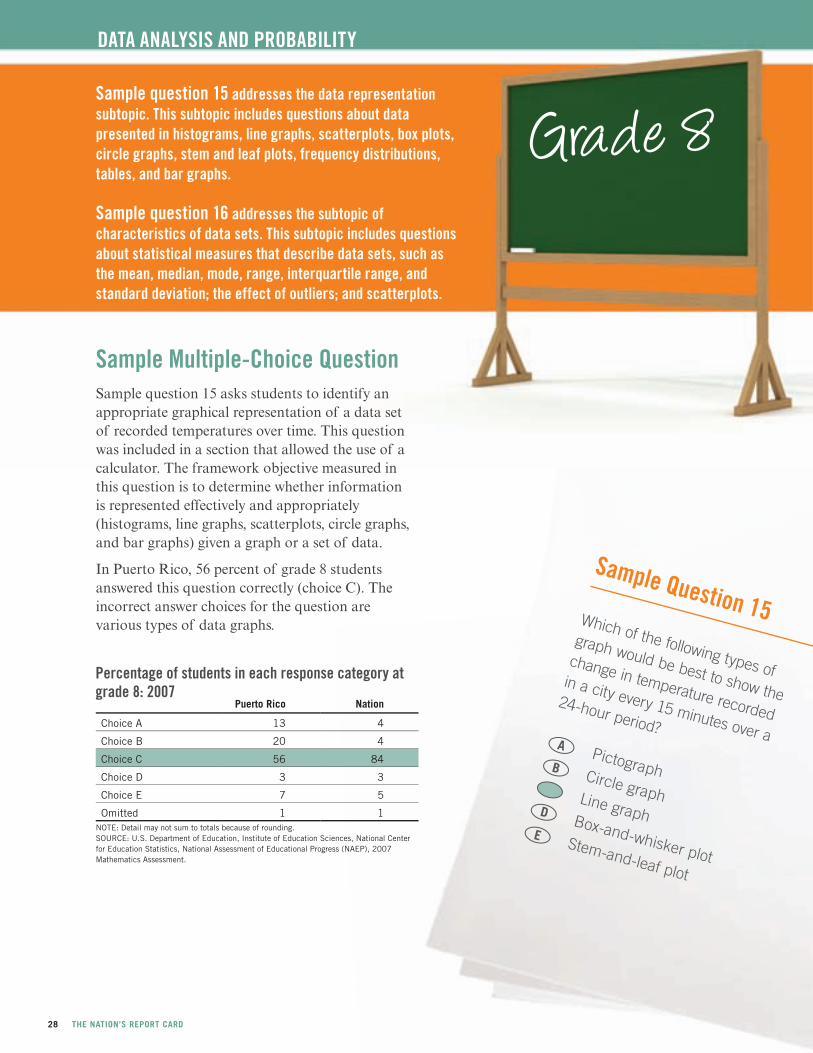
Grade 8Sample question 15 addresses the data representation subtopic. This subtopic includes questions about data presented in histograms, line graphs, scatterplots, box plots, circle graphs, stem and leaf plots, frequency distributions, tables, and bar graphs. Sample question 16 addresses the subtopic of characteristics of data sets. This subtopic includes questions about statistical measures that describe data sets, such as the mean, median, mode, range, interquartile range, and standard deviation; the effect of outliers; and scatterplots.
Sample Multiple-Choice QuestionSample question 15 asks students to identify an appropriate graphical representation of a data set of recorded temperatures over time. This question was included in a section that allowed the use of a calculator. The framework objective measured in this question is to determine whether information is represented effectively and appropriately (histograms, line graphs, scatterplots, circle graphs, and bar graphs) given a graph or a set of data.
In Puerto Rico, 56 percent of grade 8 students answered this question correctly (choice C). The incorrect answer choices for the question are various types of data graphs.
DATA ANALYSIS AND PROBABILITY
NOTE: Detail may not sum to totals because of rounding.SOURCE: U.S. Department of Education, Institute of Education Sciences, National Center for Education Statistics, National Assessment of Educational Progress (NAEP), 2007 Mathematics Assessment.
Percentage of students in each response category at grade 8: 2007
Puerto Rico Nation
Choice A 13 4
Choice B 20 4
Choice C 56 84
Choice D 3 3
Choice E 7 5
Omitted 1 1
28 THE NATION’S REPORT CARD
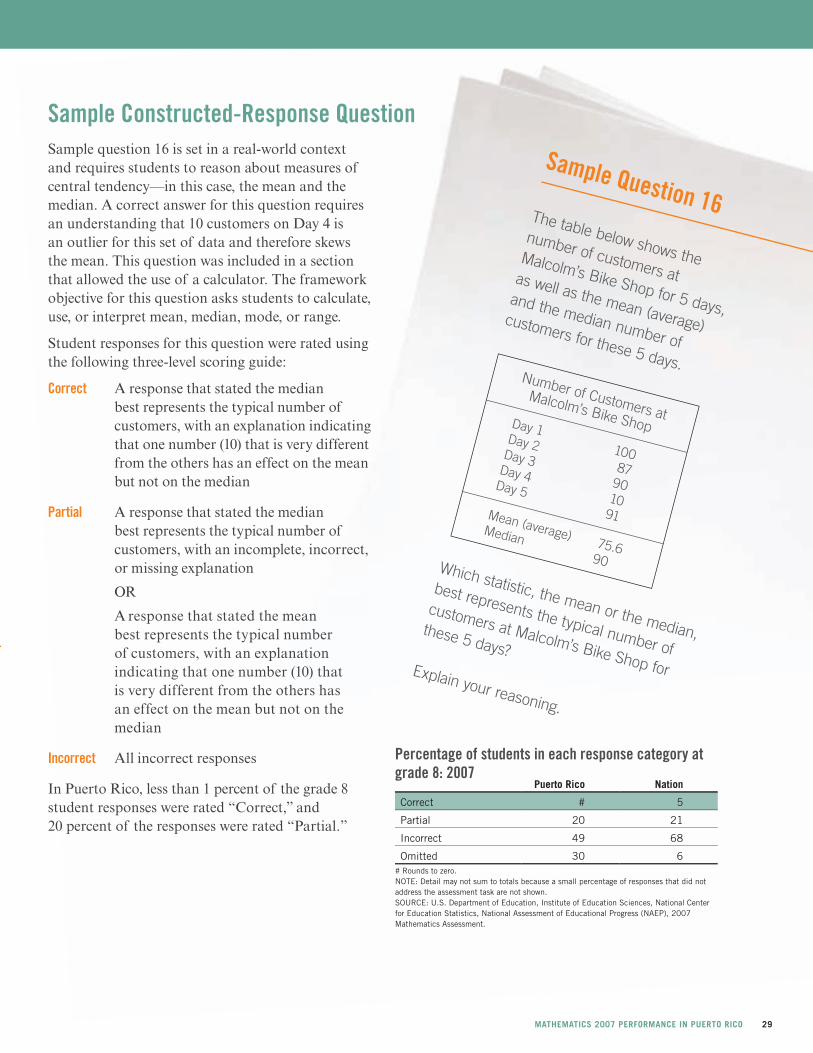
Sample question 16 is set in a real-world context and requires students to reason about measures of central tendency—in this case, the mean and the median. A correct answer for this question requires an understanding that 10 customers on Day 4 is an outlier for this set of data and therefore skews the mean. This question was included in a section that allowed the use of a calculator. The framework objective for this question asks students to calculate, use, or interpret mean, median, mode, or range.
Student responses for this question were rated using the following three-level scoring guide:
Correct A response that stated the median best represents the typical number of customers, with an explanation indicating that one number (10) that is very different from the others has an effect on the mean but not on the median
Partial A response that stated the median best represents the typical number of customers, with an incomplete, incorrect, or missing explanation
OR
A response that stated the mean best represents the typical number of customers, with an explanation indicating that one number (10) that is very different from the others has an effect on the mean but not on the median
Incorrect All incorrect responses
In Puerto Rico, less than 1 percent of the grade 8 student responses were rated “Correct,” and 20 percent of the responses were rated “Partial.”
Sample Question 16The table below shows the
number of customers at Malcolm’s Bike Shop for 5 days,
as well as the mean (average)
and the median number of
customers for these 5 days.
Which statistic, the mean or the median,
best represents the typical number of
customers at Malcolm’s Bike Shop for
these 5 days?Explain your reasoning.
Sample Constructed-Response Question
Number of Customers atMalcolm’s Bike Shop
Day 1
100
Day 2
87
Day 3
90
Day 4
10
Day 5
91
Mean (average) 75.6
Median
90
Percentage of students in each response category at grade 8: 2007
# Rounds to zero.NOTE: Detail may not sum to totals because a small percentage of responses that did not address the assessment task are not shown.SOURCE: U.S. Department of Education, Institute of Education Sciences, National Center for Education Statistics, National Assessment of Educational Progress (NAEP), 2007 Mathematics Assessment.
Puerto Rico Nation
Correct # 5
Partial 20 21
Incorrect 49 68
Omitted 30 6
MATHEMATICS 2007 PERFORMANCE IN PUERTO RICO 29
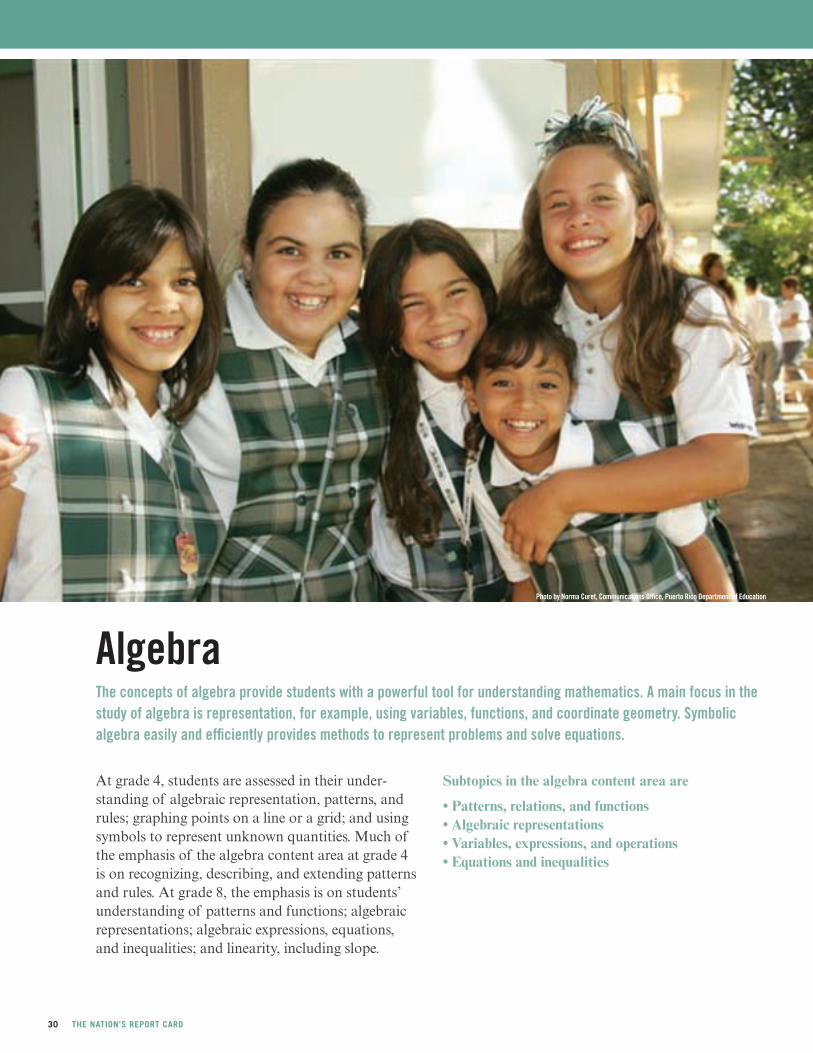
At grade 4, students are assessed in their under-standing of algebraic representation, patterns, and rules; graphing points on a line or a grid; and using symbols to represent unknown quantities. Much of the emphasis of the algebra content area at grade 4 is on recognizing, describing, and extending patterns and rules. At grade 8, the emphasis is on students’ understanding of patterns and functions; algebraic representations; algebraic expressions, equations, and inequalities; and linearity, including slope.
AlgebraThe concepts of algebra provide students with a powerful tool for understanding mathematics. A main focus in the study of algebra is representation, for example, using variables, functions, and coordinate geometry. Symbolic algebra easily and efficiently provides methods to represent problems and solve equations.
Subtopics in the algebra content area are • Patterns, relations, and functions • Algebraic representations • Variables, expressions, and operations • Equations and inequalities
Photo by Norma Curet, Communications Office, Puerto Rico Department of Education
30 THE NATION’S REPORT CARD
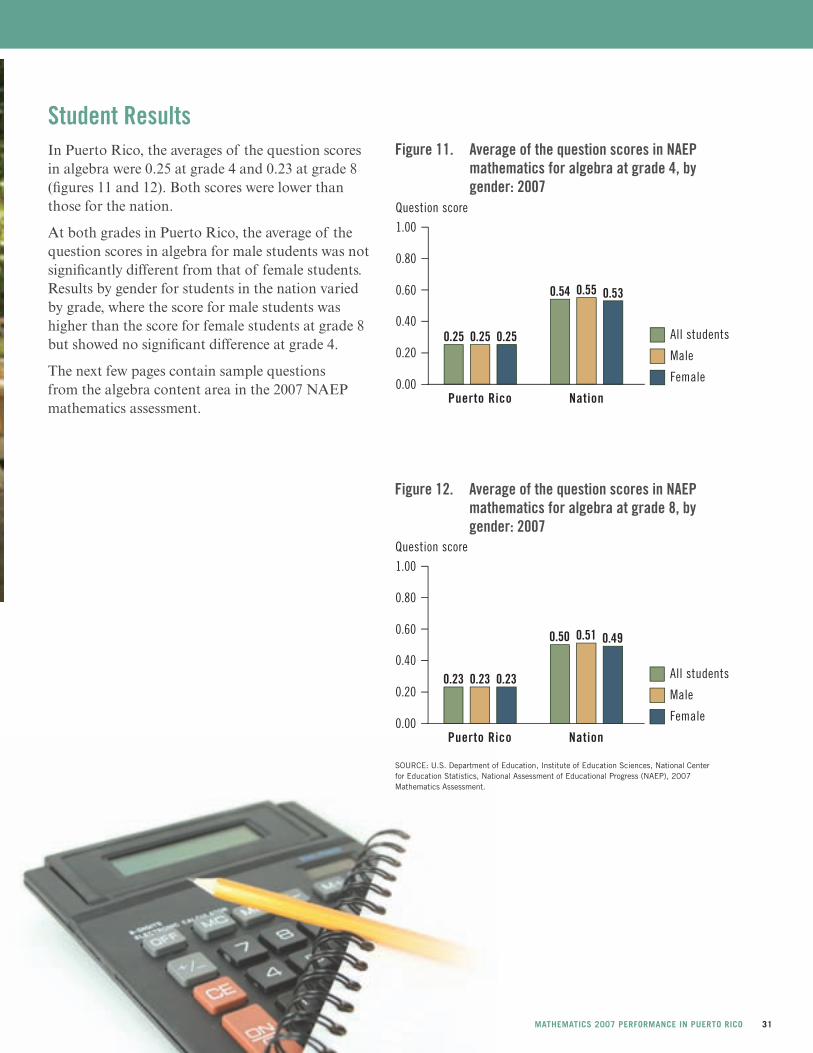
Student ResultsIn Puerto Rico, the averages of the question scores in algebra were 0.25 at grade 4 and 0.23 at grade 8 (figures 11 and 12). Both scores were lower than those for the nation.
At both grades in Puerto Rico, the average of the question scores in algebra for male students was not significantly different from that of female students. Results by gender for students in the nation varied by grade, where the score for male students was higher than the score for female students at grade 8 but showed no significant difference at grade 4.
The next few pages contain sample questions from the algebra content area in the 2007 NAEP mathematics assessment.
Figure 11. Average of the question scores in NAEP mathematics for algebra at grade 4, by gender: 2007
Figure 12. Average of the question scores in NAEP mathematics for algebra at grade 8, by gender: 2007
SOURCE: U.S. Department of Education, Institute of Education Sciences, National Center for Education Statistics, National Assessment of Educational Progress (NAEP), 2007 Mathematics Assessment.
0.25 0.25
Puerto Rico
0.25
0.54
Nation
0.55 0.53
All students
Male
Female
0.80
1.00
0.60
0.40
0.20
Question score
0.00
0.23 0.23
Puerto Rico
0.23
0.50
Nation
0.51 0.49
All students
Male
Female
0.80
1.00
0.60
0.40
0.20
Question score
0.00
MATHEMATICS 2007 PERFORMANCE IN PUERTO RICO 31
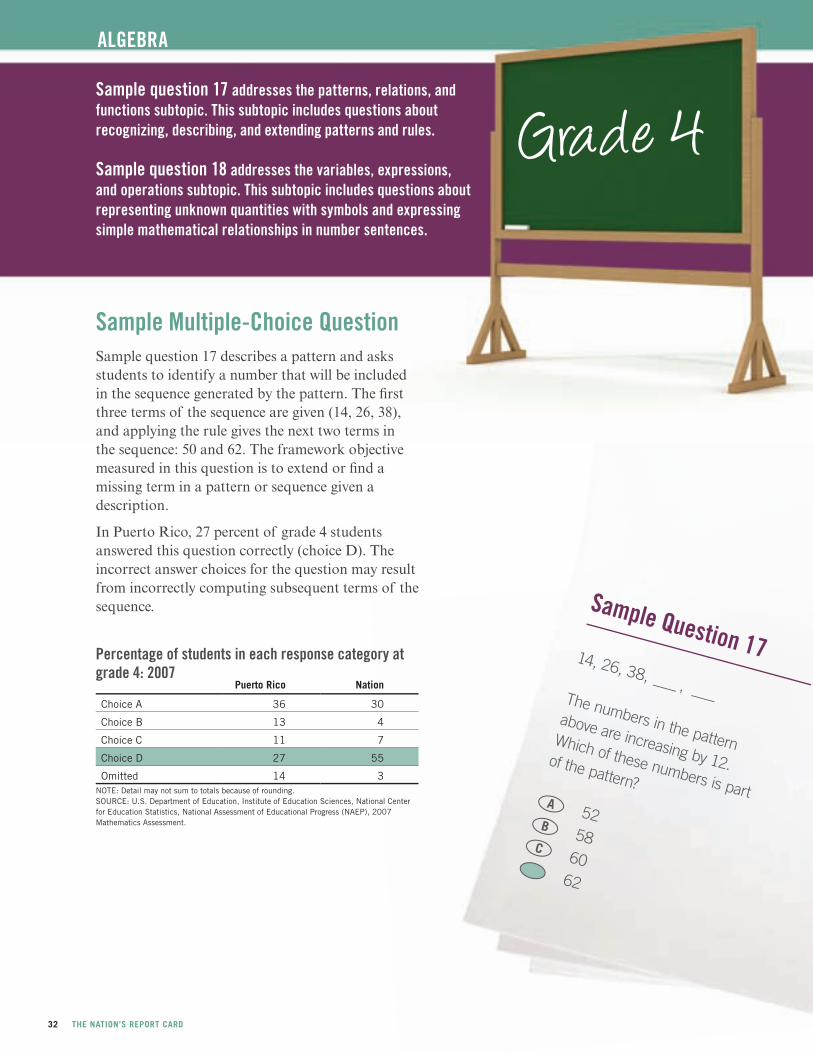
Sample Multiple-Choice QuestionSample question 17 describes a pattern and asks students to identify a number that will be included in the sequence generated by the pattern. The first three terms of the sequence are given (14, 26, 38), and applying the rule gives the next two terms in the sequence: 50 and 62. The framework objective measured in this question is to extend or find a missing term in a pattern or sequence given a description.
In Puerto Rico, 27 percent of grade 4 students answered this question correctly (choice D). The incorrect answer choices for the question may result from incorrectly computing subsequent terms of the sequence.
B
A
C
5258
6062
Sample Question 1714, 26, 38, ___ , ___The numbers in the pattern
above are increasing by 12.
Which of these numbers is part
of the pattern?
Grade 4Sample question 17 addresses the patterns, relations, and functions subtopic. This subtopic includes questions about recognizing, describing, and extending patterns and rules. Sample question 18 addresses the variables, expressions, and operations subtopic. This subtopic includes questions about representing unknown quantities with symbols and expressing simple mathematical relationships in number sentences.
ALGEBRA
Percentage of students in each response category at grade 4: 2007
NOTE: Detail may not sum to totals because of rounding.SOURCE: U.S. Department of Education, Institute of Education Sciences, National Center for Education Statistics, National Assessment of Educational Progress (NAEP), 2007 Mathematics Assessment.
Puerto Rico Nation
Choice A 36 30
Choice B 13 4
Choice C 11 7
Choice D 27 55
Omitted 14 3
32 THE NATION’S REPORT CARD
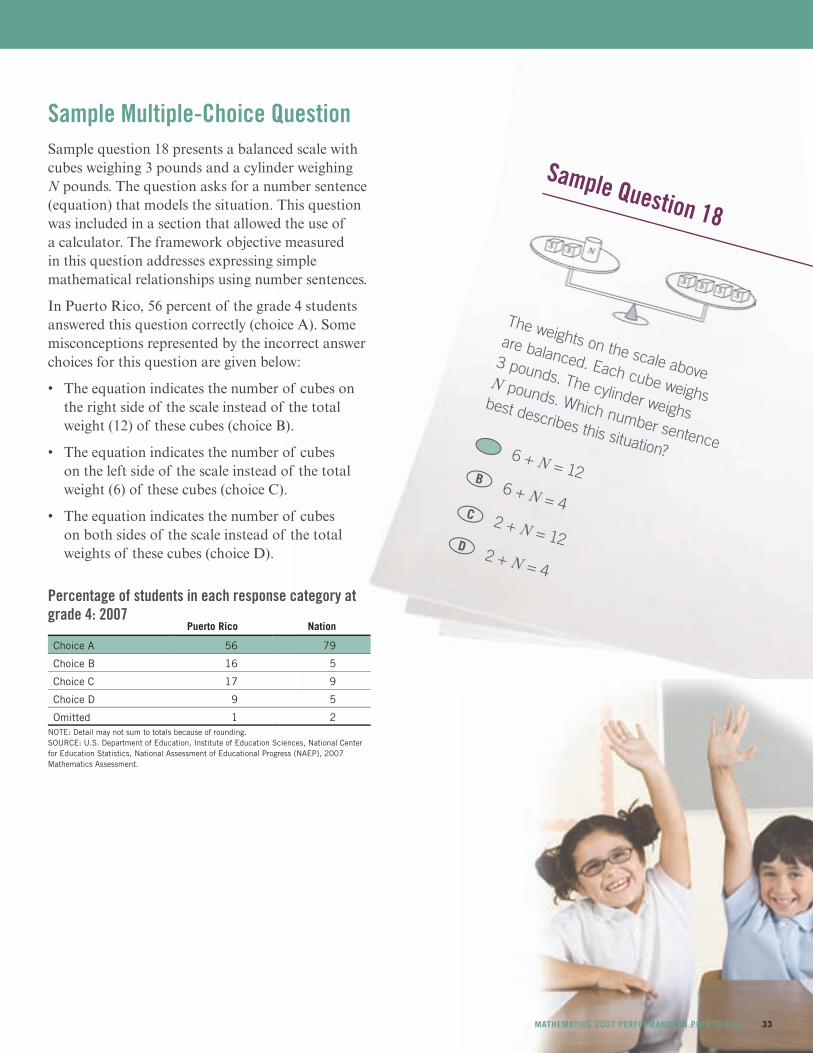
Sample question 18 presents a balanced scale with cubes weighing 3 pounds and a cylinder weighing N pounds. The question asks for a number sentence (equation) that models the situation. This question was included in a section that allowed the use of a calculator. The framework objective measured in this question addresses expressing simple mathematical relationships using number sentences.
In Puerto Rico, 56 percent of the grade 4 students answered this question correctly (choice A). Some misconceptions represented by the incorrect answer choices for this question are given below:
• Theequationindicatesthenumberofcubesonthe right side of the scale instead of the total weight (12) of these cubes (choice B).
• Theequationindicatesthenumberofcubeson the left side of the scale instead of the total weight (6) of these cubes (choice C).
• Theequationindicatesthenumberofcubeson both sides of the scale instead of the total weights of these cubes (choice D).
NOTE: Detail may not sum to totals because of rounding.SOURCE: U.S. Department of Education, Institute of Education Sciences, National Center for Education Statistics, National Assessment of Educational Progress (NAEP), 2007 Mathematics Assessment.
Percentage of students in each response category at grade 4: 2007
Sample Question 18
B
C
6 + N = 126 + N = 4
2 + N = 122 + N = 4
The weights on the scale above
are balanced. Each cube weighs
3 pounds. The cylinder weighs
N pounds. Which number sentence
best describes this situation?
Sample Multiple-Choice Question
D
Puerto Rico Nation
Choice A 56 79
Choice B 16 5
Choice C 17 9
Choice D 9 5
Omitted 1 2
MATHEMATICS 2007 PERFORMANCE IN PUERTO RICO 33
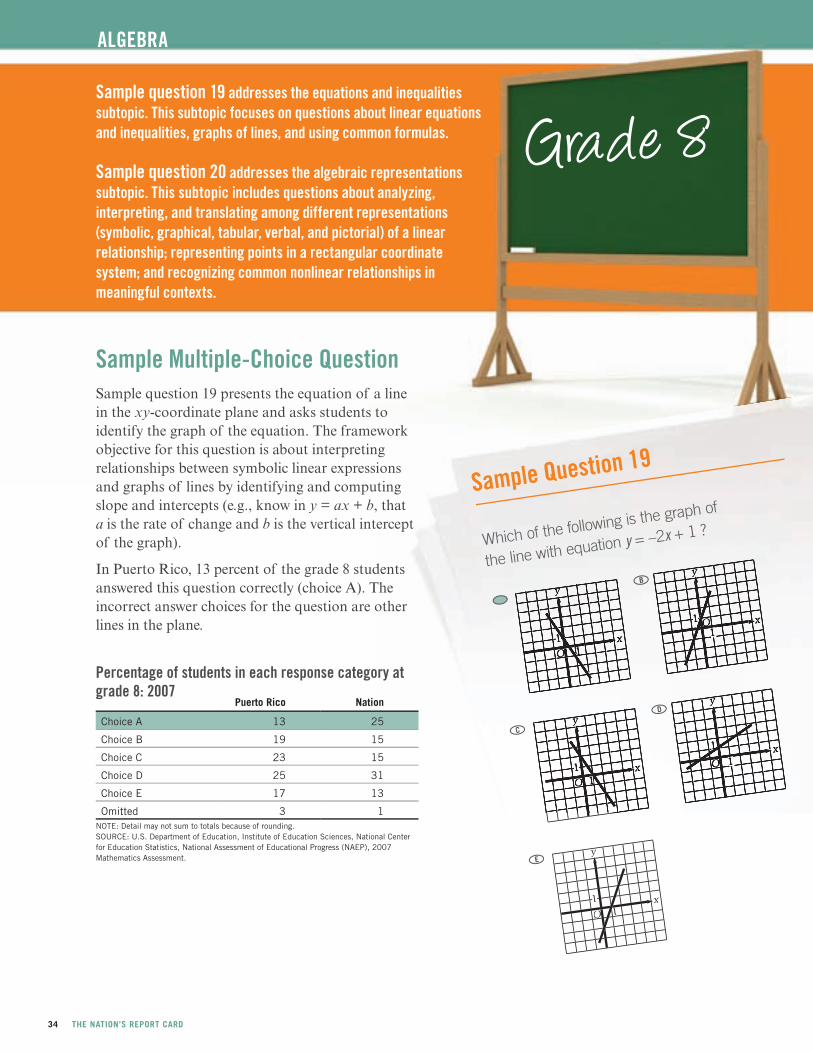
Sample question 19 addresses the equations and inequalities subtopic. This subtopic focuses on questions about linear equations and inequalities, graphs of lines, and using common formulas. Sample question 20 addresses the algebraic representations subtopic. This subtopic includes questions about analyzing, interpreting, and translating among different representations (symbolic, graphical, tabular, verbal, and pictorial) of a linear relationship; representing points in a rectangular coordinate system; and recognizing common nonlinear relationships in meaningful contexts.
Grade 8
Sample Question 19
y
Ox
x
x
x
x
11
y
O1
y
O 111
y
O
1
1
y
O 11
1
Which of the following is the graph of
the line with equation y = –2x + 1 ?
Sample Multiple-Choice QuestionSample question 19 presents the equation of a line in the xy-coordinate plane and asks students to identify the graph of the equation. The framework objective for this question is about interpreting relationships between symbolic linear expressions and graphs of lines by identifying and computing slope and intercepts (e.g., know in y = ax + b, that a is the rate of change and b is the vertical intercept of the graph).
In Puerto Rico, 13 percent of the grade 8 students answered this question correctly (choice A). The incorrect answer choices for the question are other lines in the plane.
ALGEBRA
C
E
D
B
NOTE: Detail may not sum to totals because of rounding.SOURCE: U.S. Department of Education, Institute of Education Sciences, National Center for Education Statistics, National Assessment of Educational Progress (NAEP), 2007 Mathematics Assessment.
Percentage of students in each response category at grade 8: 2007
Puerto Rico Nation
Choice A 13 25
Choice B 19 15
Choice C 23 15
Choice D 25 31
Choice E 17 13
Omitted 3 1
34 THE NATION’S REPORT CARD

Sample question 20 asks students to identify whether given algebraic expressions are equivalent to the expression 2x for all values of x. This question was included in a section that allowed the use of a calculator. The framework objective measured in this question is to translate between different representations of linear expressions using symbols, graphs, tables, diagrams, or written descriptions.
In Puerto Rico, 8 percent of grade 8 students correctly identified whether or not all of the three expressions are equivalent to 2x. The percentage of students who correctly answered each part of the question is shown below. The correct answer for parts (a) and (b) of this question is “Yes,” and the correct answer for part (c) is “No.”
Part (a)
Correct 76 90
Incorrect 16 8
Omitted 8 2
Part (b)
Correct 24 40
Incorrect 57 54
Omitted 18 6
Part (c)
Correct 40 65
Incorrect 38 28
Omitted 21 6
Puerto Rico Nation
Sample Multiple-Choice Question
Sample Question 20
NOTE: Detail may not sum to totals because of rounding.
NOTE: Detail may not sum to totals because of rounding.SOURCE: U.S. Department of Education, Institute of Education Sciences, National Center for Education Statistics, National Assessment of Educational Progress (NAEP), 2007 Mathematics Assessment.
Percentage of students in each response category at grade 8: 2007
Puerto Rico Nation
Three correct 8 30
Two correct 34 38
One correct 48 28
None correct 7 2
Omitted 3 1
Consider each of the following
expressions. In each case, does the
expression equal 2x for all values of x ?
Fill in one oval to indicate YES or NO
for each expression.
Yes No
(a) 2 times x
(b) x plus x
(c) x times x
MATHEMATICS 2007 PERFORMANCE IN PUERTO RICO 35