data analysis megan mcguire study participants
TRANSCRIPT
Data Analysis
Megan McGuire
Study Participants
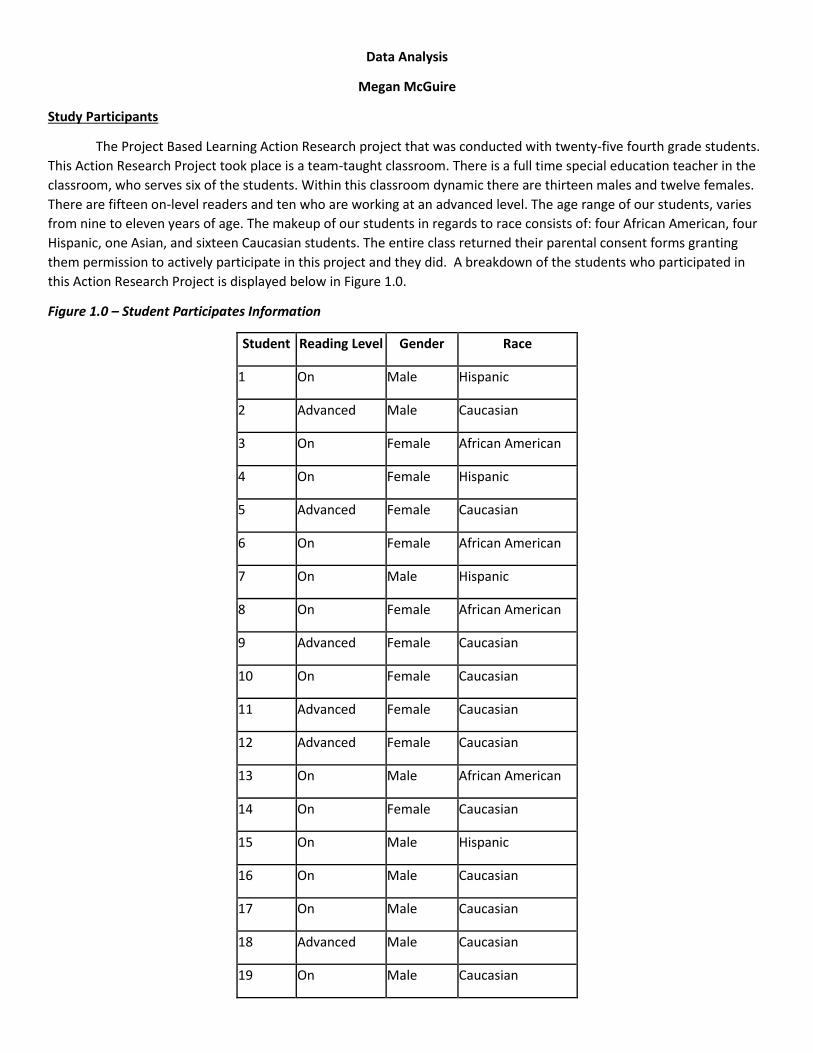
The Project Based Learning Action Research project that was conducted with twenty-five fourth grade students.
This Action Research Project took place is a team-taught classroom. There is a full time special education teacher in the
classroom, who serves six of the students. Within this classroom dynamic there are thirteen males and twelve females.
There are fifteen on-level readers and ten who are working at an advanced level. The age range of our students, varies
from nine to eleven years of age. The makeup of our students in regards to race consists of: four African American, four
Hispanic, one Asian, and sixteen Caucasian students. The entire class returned their parental consent forms granting
them permission to actively participate in this project and they did. A breakdown of the students who participated in
this Action Research Project is displayed below in Figure 1.0.
Figure 1.0 – Student Participates Information
Student Reading Level Gender Race
1 On Male Hispanic
2 Advanced Male Caucasian
3 On Female African American
4 On Female Hispanic
5 Advanced Female Caucasian
6 On Female African American
7 On Male Hispanic
8 On Female African American
9 Advanced Female Caucasian
10 On Female Caucasian
11 Advanced Female Caucasian
12 Advanced Female Caucasian
13 On Male African American
14 On Female Caucasian
15 On Male Hispanic
16 On Male Caucasian
17 On Male Caucasian
18 Advanced Male Caucasian
19 On Male Caucasian

20 On Male Caucasian
21 Advanced Male Caucasian
22 Advanced Male Asian
23 Advanced Male Caucasian
24 Advanced Female Caucasian
25 On Female Caucasian
Research Question
How does Project Based Learning, partnered with technology, impact a classroom environment and provide greater results, in the content area of social studies?
Duration of Project Based Learning Action Research Project
When this Action Based Research Project was designed, the students had twelve days of instructional time allotted to complete their project. However, as noted below in figure 1.1., unforeseen weather breaks, changed our initial plan. With this being said, students were allowed to use reading and social studies instructional time the week of February 3rd as well as work during lunch if desired. Many students took advantage of the lunch opportunity. Students were encouraged to aim for completion of their project by February 5th. However, they were given until February 10th, if they needed the weekend to finalize their finished product. All students completed their projects on time.
Figure 1.1- Calendar of Events Which Took Place
Quantitative Research
Specifically, the quasiexperimental design for the PBL format was initially intended for implementation.
Through this design, pretests were given to assess what students already know about the social studies
standard. From the original assessment that was gathered, students were given the opportunity to work in
groups in a PBL setting. This non-traditional classroom environment solicits a non-traditional design model. The
groups that were formed were: Writing, Act It Out, Art, or Technology.
January 6) Teacher Work Day
7) Winter Weather Day 8) Discuss project rubric and model
9) French and Indian War 10) British Imperial Policy, Stamp Act, - “No Taxation without Representation”
13) Sons of Liberty (Gallopade)
14) Boston Massacre/ Boston Tea Party
15) Battle of Lexington and Concord
16) Saratoga and Yorktown
17) Science Day – School Wide
20) President’s Day- No School
21) Field Trip 22) King George III, George Washington, Patrick Henry, Thomas Jefferson, John Adams, Benedict Arnold, and Ben Franklin Jigsaw Activity
23) Declaration of Independence
24) Life During The War American Revolution War Recap Activity
27) Project Based Learning Action Research Project
28) Project Based Learning Action Research Project
29) Snow Day 30) Snow Day 31) Snow Day
February 3) Project Based Learning Action Research Project
4) Project Based Learning Action Research Project
5) Project Based Learning Action Research Project
6) Presentations of PBL Action Research Projects
7) Presentations of PBL Action Research Projects
10) Presentations of PBL Action Research Projects
11) Snow Day 12) Snow Day 13) Snow Day 14) Mid-Winter Break

The second form of quantitative research is the follow up step to the quasiexperimental design, the pretest-
posttest control group design. This will allow for the data from the PBL design to have meaning and show if this
PBL approach is successful or not successful.
Below, you will see data from our Colonies Unit and our American Revolution Unit.
Colonies Unit Using Traditional Methods of Teaching
We completed our Colonies Unit in November, 2013. There is a pre-test and posttest chart, which includes the
amount of growth evident throughout this unit. Below the data, there is also a min, max, and median data table
to calculate the results. Note that this unit was conducted in a traditional classroom model. This data can be
found in Figure 1.2. o Figure 1.2 - Colonies Pretest-Posttest Assessment Data using traditional methods of teaching
o Figure 1.2 A - Min, Max, and Median from Colonies Unit Data
o Figure 1.2 B – Pretest Data – Colonies Unit
o Figure 1.2 C – Posttest Data – Colonies Unit
o Figure 1.2 D– Amount of Growth – Colonies Unit
o Figure 1.2 E– Data Percentages and Growth– Colonies Unit
Figure 1.2- Colonies Pretest-Posttest Assessment Data (using traditional methods of teaching)
Student Number Pretest Posttest Amount of Growth 1 20% 74% 54%
2 30% 97% 67%
3 30% 52% 22%
4 40% 74% 34%
5 60% 100% 40%
6 30% 60% 30%
7 10% 70% 60%
8 20% 42% 22%
9 80% 91% 11%
10 40% 91% 51%
11 40% 71% 31%
12 60% 89% 29%
13 50% 80% 30%
14 40% 48% 8%
15 20% 91% 71%
16 20% 70% 50%
17 30% 80% 50%
18 30% 91% 61%
19 30% 70% 40%
20 50% 91% 41%
21 30% 86% 56%
22 50% 100% 50%
23 50% 94% 44%
24 40% 94% 54%
25 10% 30% 20%
Figure 1.2 A – Min, Max, and Median from Colonies Unit Data
Pretest Posttest Growth
Min 10% 30% 8%
Max 80% 100% 71%

Median 36% 79% 41%
Figure 1.2 B – Pretest Data – Colonies Unit
Figure 1.2 C – Posttest Data – Colonies Unit
Figure 1.2 D– Amount of Growth – Colonies Unit
0%
20%
40%
60%
80%
100%
1 2 3 4 5 6 7 8 9 10 11 12 13 14 15 16 17 18 19 20 21 22 23 24 25
Pretest Data- Colonies Unit
0%
20%
40%
60%
80%
100%
120%
1 2 3 4 5 6 7 8 9 10 11 12 13 14 15 16 17 18 19 20 21 22 23 24 25
Posttest Data- Colonies Unit
0%
10%
20%
30%
40%
50%
60%
70%
80%
1 2 3 4 5 6 7 8 9 10 11 12 13 14 15 16 17 18 19 20 21 22 23 24 25
Amount of Growth- Colonies Unit

Figure 1.2 E– Data Percentages and Growth– Colonies Unit
Series 1: Pre-Assessment
Series 2: Post- Assessment
Series 3: Amount of Growth
American Revolution Unit Using Project Based Learning Method of Teaching
We completed our American Revolution Unit in January and February, 2014. A similar set of data with pretest-
posttest results are displayed including the amount of growth. Below the data, there is also a min, max, and
median data table to calculate the results. Note that this unit was conducted in a Project Based Learning model.
This data can be found in Figure 1.3.
o Figure 1.3 – American Revolution Pretest-Posttest Assessment Data(using Project Based Learning model)
o Figure 1.3 A - Min, Max, and Median from American Revolution Data
o Figure 1.3 B – Pretest Data – American Revolution Unit
o Figure 1.3 C – Posttest Data – American Revolution Unit
o Figure 1.3 D– Amount of Growth – American Revolution Colonies Unit
o Figure 1.3 E– Data Percentages and Growth– American Revolution Unit
Figure 1.3 – American Revolution Pretest-Posttest Assessment Data (using Project Based Learning model)
Student Number Pretest Posttest Amount of Growth 1 12% 82% 70%
2 18% 88% 70%
3 6% 71% 65%
4 24% 94% 70%
5 35% 100% 65%
6 6% 88% 82%
7 12% 53% 41%
8 0% 80% 80%
9 24% 100% 76%
10 24% 88% 64%
11 18% 82% 64%
12 18% 71% 53%
13 12% 82% 70%
14 12% 75% 63%
15 12% 82% 70%
16 18% 82% 64%
17 24% 71% 47%
18 12% 76% 64%
19 18% 93% 75%
0%
20%
40%
60%
80%
100%
120%
1 2 3 4 5 6 7 8 9 10 11 12 13 14 15 16 17 18 19 20 21 22 23 24 25
Data Percentages and Growth - Colonies Unit
Series1 Series2 Series3

20 12% 65% 53%
21 18% 94% 76%
22 12% 88% 76%
23 41% 100% 59%
24 18% 100% 82%
25 18% 82% 64%
Figure 1.3 A - Min, Max, and Median from American Revolution Data
Pretest Posttest Growth
Min 0% 53% 41%
Max 35% 100% 82%
Median 15% 82% 67%
Figure 1.3 B – Pretest Data – American Revolution Unit
Figure 1.3 C – Posttest Data – American Revolution Unit
Figure 1.3 D– Amount of Growth – American Revolution Colonies Unit
Figure 1.3 E– Data Percentages and Growth– American Revolution Unit
0%
10%
20%
30%
40%
50%
1 2 3 4 5 6 7 8 9 10 11 12 13 14 15 16 17 18 19 20 21 22 23 24 25
Pretest Data- American Revolution Unit
0%
20%
40%
60%
80%
100%
120%
1 2 3 4 5 6 7 8 9 10 11 12 13 14 15 16 17 18 19 20 21 22 23 24 25
Post-Assessment Data
0%
20%
40%
60%
80%
100%
1 2 3 4 5 6 7 8 9 10 11 12 13 14 15 16 17 18 19 20 21 22 23 24 25
Amount of Growth

Series 1: Pre-Assessment
Series 2: Post- Assessment
Series 3: Amount of Growth
Min, Max, and Median Comparisons
Figure 1.2A and Figure 1.3A shared below are a comparison between the pretest and posttest results of a unit
that was taught through the traditional approach (Colonies) and the Project Based Learning approach (American
Revolution).
It is apparent from the Colonies pretest that students had more schema before beginning the colonies unit.
However, a significantly less amount of overall growth was made between the pretest and posttest in
comparison to the American Revolution Data.
There was a nine percent difference in the amount of growth between the Colonies and American Revolution
unit. There was a three percent difference in overall test scores between the two units, showing that PBL was
more successful. The growth scores had a twenty-six percent increase of growth between the pretest and
posttest for both units. The American Revolution Data shows that students had substantially more growth
overall, their posttest scores were higher, and the student level of engagement reached an all-time high.
Engagement levels will be discussed in Figure 1.8-9. See Figure 1.4 below for the Min, Max, and Median
Comparisons.
Figure 1.4 - Min, Max, and Median Comparisons
Figure 1.2 A – Min, Max, and Median from Colonies Unit Data
Figure 1.3 A – Min, Max, and Median from American Revolution Data
Pretest Posttest Growth
Min 10% 30% 8%
Max 80% 100% 71%
Median 36% 79% 41%
Pretest Posttest Growth
Min 0% 53% 41%
Max 35% 100% 82%
Median 15% 82% 67%
Project Based Learning Project Final Product and Presentation
The initial rubrics that were prepared to use for this PBL experience, ended up not aligning to the standards as
needed. Therefore, the rubric below was created and used as it better identified if students were able to meet
the standard or not.
In Figure 1.5 you will see the “What Happens When We Fail to Compromise Project Rubric.” The question “What
happens when we fail to compromise?” was the guiding question throughout this unit. The first two rows in
relation to the events and battles of the American Revolution were averaged together to identify the students
overall project score. The remaining four rows were averaged together to calculate the student’s presentation
0%
20%
40%
60%
80%
100%
120%
1 2 3 4 5 6 7 8 9 10 11 12 13 14 15 16 17 18 19 20 21 22 23 24 25
Data Percentages and Growth
Series1 Series2 Series3

score. The presentation section of the rubric was aligned with the ELA presentation standards and taken for a
social studies grade.
Figure 1.6 shows the project and presentation scores compiled, as well as the group that the students work in.
Figure 1.5 - What Happens When We Fail to Compromise Project Rubric
What Happens When We Fail to Compromise Project Rubric
1 2 3 4 5
DOES NOT
MEET IN PROGRESS MEETS EXCEEDS EXCEEDS
The Events of the
American Revolution
I can explain 1 events that shaped the
America Revolution (including the French and Indian War, 1765 Stamp Act, the slogan “no taxation without representation,” the activities of the Sons
of Liberty, and the Boston Tea Party.)
4H4a
I can explain 2 events that shaped
the America Revolution (including
the French and Indian War, 1765 Stamp Act, the
slogan “no taxation without
representation,” the activities of the Sons
of Liberty, and the Boston Tea Party.)
4H4a
I can explain 3 events that shaped the
America Revolution (including the French and Indian War, 1765 Stamp Act, the slogan
“no taxation without representation,” the activities of the Sons
of Liberty, and the Boston Tea Party.)
4H4a
I can explain 4 events that shaped the
America Revolution (including the French and Indian War, 1765 Stamp Act, the slogan
“no taxation without representation,” the activities of the Sons
of Liberty, and the Boston Tea Party.)
4H4a
I can explain 5 events that shaped the America
Revolution (including the French and Indian War,
1765 Stamp Act, the slogan “no taxation without representation,” the
activities of the Sons of Liberty, and the Boston Tea
Party.) 4H4a
The Battles of the
American Revolution
I can explain how the Americans won the
war including at least 0 battles (the Battles
of Lexington and Concord, Saratoga,
and Yorktown).
I can explain how the Americans won the war including at least 1 battles (the
Battles of Lexington and Concord, Saratoga, and
Yorktown).
I can explain how the Americans won the
war including at least 2 battles (the Battles
of Lexington and Concord, Saratoga,
and Yorktown).
I can explain how the Americans won the
war including at least 3 battles (the Battles
of Lexington and Concord, Saratoga,
and Yorktown).
I can explain how the Americans won the war
including at least 4 battles (the Battles of Lexington and Concord, Saratoga,
Yorktown, and one I researched on my own).
4H4c
Leading a Discussion
I cannot ask the audience at least one question and cannot answer at least one question about my
topic. L1c
I can ask the audience at least one question and cannot answer a
question about my topic. L1c
I can ask the audience at least one question and answer at least one question about my topic. L1c
I can ask the audience at least one question and answer two questions about
my topic. L1c
I can ask the audience at least one question and answer three questions
about my topic. L1c
Presenting My
Knowledge
I cannot report on a topic with a few
correct and related facts. L4
I can report on a topic with a few
correct and related facts. L4
I can report on a topic with several correct and related facts. L4
I can report on a topic with many correct and
related facts. L4
I can report on a topic with many correct and related facts that fully support the
learning goal. L4
My Presentation
Skills
I can report on a topic using 1 or less of the following: clear voice,
loud voice, eye contact, no fidgeting,
speaking at a reasonable pace.
I can report on a topic using 2 of the
following: clear voice, loud voice, eye contact, no
fidgeting, speaking at a reasonable
pace.
I can report on a topic using 3 of the
following: clear voice, loud voice, eye
contact, no fidgeting, speaking at a
reasonable pace.
I can report on a topic using 4 of the
following: clear voice, loud voice, eye
contact, no fidgeting, speaking at a
reasonable pace.
I can report on a topic using 5 of the following: clear voice, loud voice, eye contact, no fidgeting,
speaking at a reasonable pace.
My Project Checklist
A teacher signed off on 3 or less of the project checklist
requirements or I lost my paper.
A teacher signed off on 4 of the project
checklist requirements.
A teacher signed off on 5 of the project
checklist requirements.
A teacher signed off on 6 of the project
checklist requirements.
A teacher signed off on 6 of the project checklist
requirements and made a comment about the quality
of my work.

Figure 1.6- Project and Presentation Score Accompanied By Group Assignment
Figure 1.7 - Min, Max, and Median from Project and Presentation Data
Project Presentation
Min 70% 83%
Max 100% 100%
Median 89% 85.5%
Qualitative Research
Reflective Journals
In Figure 1.8, there is a teacher reflective journal entry and several student journal entries per day.
Figure 1.8- Teacher and Student Reflective Journals
Teacher Journals Several Student Journal Excerpts
January 27th - Students are completely engaged in this
project. A majority of today’s time was
spent on planning. Students were asked
to not begin working on their actual
project yet, but simply to plan. They
made a list of supplies that they need
- I cannot wait to get started!
- I like this project the BEST!
- I didn’t know that there would be this many art
supplies available to us. I thought it would be
markers and crayons. WOW!
Student Number Project Presentation Group 1 80 88 Art
2 100 100 Technology
3 80 83 Art
4 94 98 Art
5 100 100 Technology
6 70 88 Art
7 65 83 Art
8 80 85 Art
9 85 95 Art
10 85 98 Art
11 80 98 Art
12 98 93 Technology
13 75 98 Act It Out
14 95 93 Act It Out
15 90 95 Technology
16 90 95 Writing- Changed To Art
17 80 98 Art
18 100 100 Technology
19 80 93 Art
20 75 88 Technology
21 90 98 Art
22 100 100 Technology
23 95 100 Technology
24 100 100 Technology
25 98 83 Art

for their projects to be successful.
Additionally, they were challenged to
come up with their own learning goal to
drive their project. Overall there is a
new level of excitement, it is very
inspiring. I am feeling hopeful for this
project and its outcome.
- It seems open ended. I wish there were more
descriptions of what the final product should
be. I can’t wait to start.
- I never knew that it took so many tries to come
up with a good learning goal.
January 28th - Students began working on their
projects today. The classroom has not
been this alive and a mess all year long.
They were asking if every lesson could
be like this from now on. Additionally,
we talked about how there may be
another snow break tomorrow. They
were saying “I am coming to school,
even if it is snowing, just to work on my
project.” Another student said “I don’t
want snow, I want to work on this
project at school.” I know it doesn’t
sound like normal nine, ten, and eleven
year old responses.
- It was fun to get on YouTube and other
educational sites and research.
- I still have a long way to go.
- I am sad that part of my slideshow was deleted.
- The supplies that Ms. McGuire and Mrs. W.
have are awesome!
- I hope that school is open tomorrow so that I
can design my website.
- This project is AWESOME!
- It felt like thirty minutes, not two hours.
February 3rd - Well, the snow did come and we missed
the rest of school last week. This means
that students are now working on their
project during reading and social studies
time each day. It is about two and a half
hours for the next three days.
Additionally, they are invited to work
during lunch if desired. Five students
choose that option today. There was a
sense of focus today in our classroom.
There was endless commotion and
productivity. This neat freak is
remembering the importance of letting
go of the steering wheel and letting my
students “drive” this project, as our
classroom is a HUGE MESS. I keep telling
myself, “learning is happening here,
learning is happening here.” I truly do
believe that.
- I feel so stressed! Boo snow break!
- I am nervous about presenting. Help Ms.
McGuire.
- I feel confident for what I am going to work on
tomorrow.
- I wish that we could have worked on it last
week.
- It is VERY messy in here!
- Modeling clay is sticky. It has a really cool
feeling though.
- I like my project, because I get to paint and it is
different than a worksheet.
- I feel like I am an American Revolution expert!
Ask me a question!
- I am so impressed with the projects that
everyone is creating.
February 4th - Again students have used the entire
time to work on their projects. The
connections that the students are
making to the events and battles of the
American Revolution definitely fall into
- I am really nervous that I am not going to finish
in time.
- I want to know if there is anything else that I
can do.

the higher order thinking realm. We
have expanded beyond the basic recall
of facts and are truly applying what we
know. Our students have truly matured
and can handle this PBL approach. Proud
teacher moments all around.
- I never expected the balloon to blow up in my
face, when I put too much air in it.
- I wish there was a quiz option on Weebly.
- I wish that I had 5-10 more minutes.
February 5th - Today, was the last day to work in class.
At the conclusion of today, students
have had over ten and a half hours to
work on their PBL final product. It
amazes me what happens when
student’s imaginations are allowed to
soar. The projects and connections that
they are coming up with are blowing me
away.
- I wonder what else I could have done.
- I wish that we could have a project like this
every day.
- I wish my Mom could see this. She would love
it!
- This project is so much better than reading
from the textbook and doing worksheets.
February 6th - The first day of presentations took place
today. We were missing ten of our
students for TAG. However, the rest of
us proceeded on with presentations. My
co-teacher and I modeled through the
first few presentations appropriate
questions to ask. Then students took
control. It was a little rough initially,
however they got the hang of it.
Additionally, students had to answer the
learning goal created by the presenter.
This learning goal aspect was what
drove the project creation and kept the
students focused and engaged
throughout the presentations.
- “Looking at Learning Goals!” activity was
completed by all students during presentations.
This was their reflective journal for
presentation days.
February 7th - Today was presentation day with the
whole class included. We rearranged the
classroom so there was a “U” around
the front of the room. The students
loved this and were begging to keep
their desks this way for the remainder of
the year. The presentations were very
enjoyable and showed that the students
truly had an understanding of the
standards. We readdressed appropriate
questioning for all. This was helpful. It is
so neat to watch what happens when
students are empowered in their
education.
- “Looking at Learning Goals!” activity was
completed by all students during presentations.
This was their reflective journal for
presentation days.
February 10th - The final day of this wonderful
experience has come. The final
- “Looking at Learning Goals!” activity was
completed by all students during presentations.

presentations took place today, and we
wrapped up the PBL experience.
Students shared their desire to do more
projects of the PBL model and how they
felt that they truly understood this unit
better than others. This was such a
comforting feeling knowing how far we
have watched our students grow over
the past few weeks. This experience is
one that our students and we will not
forget for years to come.
This was their reflective journal for
presentation days.
Engagement Checklist (Reversed)
Initially, the plan was to use an engagement checklist to monitor if students were truly engaged in their
education. However, I noticed on the first day that engagement in the project was not going to be an issue. The
students were begging for more time and when they were made aware that only five minutes remained for the
day, they were so upset. With this being said, a Reversed Engagement Checklist was used making a mark when
students were not engaged or off task. Below Figure 1.9 displays the Reversed Engagement Checklist.
Figure 1.9- Reversed Engagement Checklist
Student Jan. 27 Jan. 28 Feb.3 Feb.4 Feb. 5 Feb.6-
Presentations
Feb.7-
Presentations
Feb. 10-
Presentations
1
2
3
4
5
6
7
8
9
10
11
12
13
14
15

16
17
18
19
20
21
22
23
24
25
Informal Assessments Strategies
Daily at the end of class, an informal formative assessment was conducted to calculate the number of events and
battles that the students had completed for their project. Students used “Three Step Genie”, where they cross their
arms and place them on their desk, then close their eyes, and put their head down on top of their arms. This way no
one else should be able to see their answer other than the teacher. This allowed the teachers to gauge where the
students were with their project.
On January 28th, students were given a notecard and asked to answer the following questions.
o Number of events completed
o Number of battles completed
o Feelings
o Teacher Help
o Other Information Your Teachers Need to Know
On February 3rd, I conferenced with each student individually to see how I could help. For many students, they
simply needed more time, additional supplies, or additional coaching for the next step or their presentation.
These daily informal assessments along with the students projects and reflective journals, allowed us to know where
each student was on a daily basis. This help with allotting the appropriate amount of time for project completion,
especially after the snow break.
Observation of students while they are researching, working independently and together, and presenting
At the start of this Action Research Project, the students were made aware of the Talents Unlimited Model and additional ways that we would be looking into how they were behaving each day. Daily, the students were assessed on the following categories. A conclusion of their performance is listed below. The daily observation of students while they were researching, working independently and together, as well as presenting provided a holistic view what each student was capable of.
The students conferenced with teachers after the Action Research Project was completed, to share the
observations and areas that students should celebrate as well as improve in the future.
The data that was compiled is displayed in Figure 2.0 below.
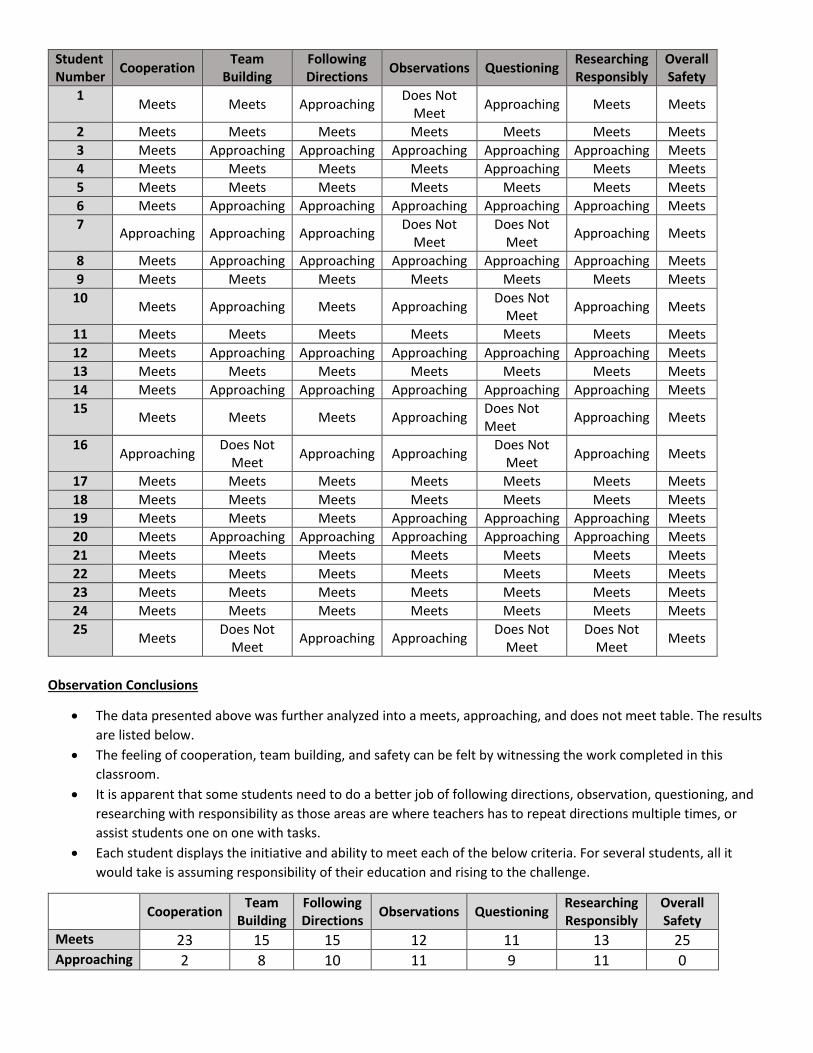
Figure 2.0- Observation of students while they are researching, working independently and together, and presenting
Observation Conclusions
The data presented above was further analyzed into a meets, approaching, and does not meet table. The results
are listed below.
The feeling of cooperation, team building, and safety can be felt by witnessing the work completed in this
classroom.
It is apparent that some students need to do a better job of following directions, observation, questioning, and
researching with responsibility as those areas are where teachers has to repeat directions multiple times, or
assist students one on one with tasks.
Each student displays the initiative and ability to meet each of the below criteria. For several students, all it
would take is assuming responsibility of their education and rising to the challenge.
Cooperation
Team Building
Following Directions
Observations Questioning Researching Responsibly
Overall Safety
Meets 23 15 15 12 11 13 25 Approaching 2 8 10 11 9 11 0
Student Number
Cooperation Team
Building Following Directions
Observations Questioning Researching Responsibly
Overall Safety
1 Meets Meets Approaching
Does Not Meet
Approaching Meets Meets
2 Meets Meets Meets Meets Meets Meets Meets
3 Meets Approaching Approaching Approaching Approaching Approaching Meets
4 Meets Meets Meets Meets Approaching Meets Meets
5 Meets Meets Meets Meets Meets Meets Meets
6 Meets Approaching Approaching Approaching Approaching Approaching Meets
7 Approaching Approaching Approaching
Does Not Meet
Does Not Meet
Approaching Meets
8 Meets Approaching Approaching Approaching Approaching Approaching Meets
9 Meets Meets Meets Meets Meets Meets Meets
10 Meets Approaching Meets Approaching
Does Not Meet
Approaching Meets
11 Meets Meets Meets Meets Meets Meets Meets
12 Meets Approaching Approaching Approaching Approaching Approaching Meets
13 Meets Meets Meets Meets Meets Meets Meets
14 Meets Approaching Approaching Approaching Approaching Approaching Meets
15 Meets Meets Meets Approaching
Does Not Meet
Approaching Meets
16 Approaching
Does Not Meet
Approaching Approaching Does Not
Meet Approaching Meets
17 Meets Meets Meets Meets Meets Meets Meets
18 Meets Meets Meets Meets Meets Meets Meets
19 Meets Meets Meets Approaching Approaching Approaching Meets
20 Meets Approaching Approaching Approaching Approaching Approaching Meets
21 Meets Meets Meets Meets Meets Meets Meets
22 Meets Meets Meets Meets Meets Meets Meets
23 Meets Meets Meets Meets Meets Meets Meets
24 Meets Meets Meets Meets Meets Meets Meets
25 Meets
Does Not Meet
Approaching Approaching Does Not
Meet Does Not
Meet Meets

Does Not Meet
0 2 0 2 5 1 0
Findings and Conclusions
This Action Research Project is focused on implementing Project Based Learning (PBL) in the social studies content area with emphasize on technology. From this study, the students were able to gain a new sense of incorporating projects and partnership in the classroom. This generation of learners does not settle to be seated and silent for seven hours a day. They must be engaged and active. Through PBL, students were able to apply what they already knew, while incorporating new knowledge along the way, to construct a final product that represented mastery of the standards being addressed. Student engagement and desire to learn was at an all-time high. PBL was able to educate the whole student and the students desired to learn and be engaged in this environment. This model of teaching incorporated multiple learning styles with a model of education that worked well for each student. By having technology integration in a PBL setting, students were more engaged and empowered to contribute.
The quantitative and qualitative data taken from this Action Research Project proves that Project Based Learning is a more successful model for education. Student engagement, performance, and pride was evident daily. There was a new level of maturity and dedicated interest that we had never seen before. This lead to higher levels of achievement as students were confident in the standard, their project, presentation, and knowledge. Project Based Learning allows the whole child to be educated and succeed at their own level. The students, teachers, and authentic audience are truly captivated desiring to learn and be more. This model of education, allows this generation of learners to experience much more than what a standard has to offer. Instead students prove that they are able to master the standard and life skills that they will need for years to come.