data and image models - uc...
TRANSCRIPT
1
Data and Image Models
Maneesh Agrawala
CS 294-10: Visualization Fall 2013
Last Time: The Purpose of Visualization
2
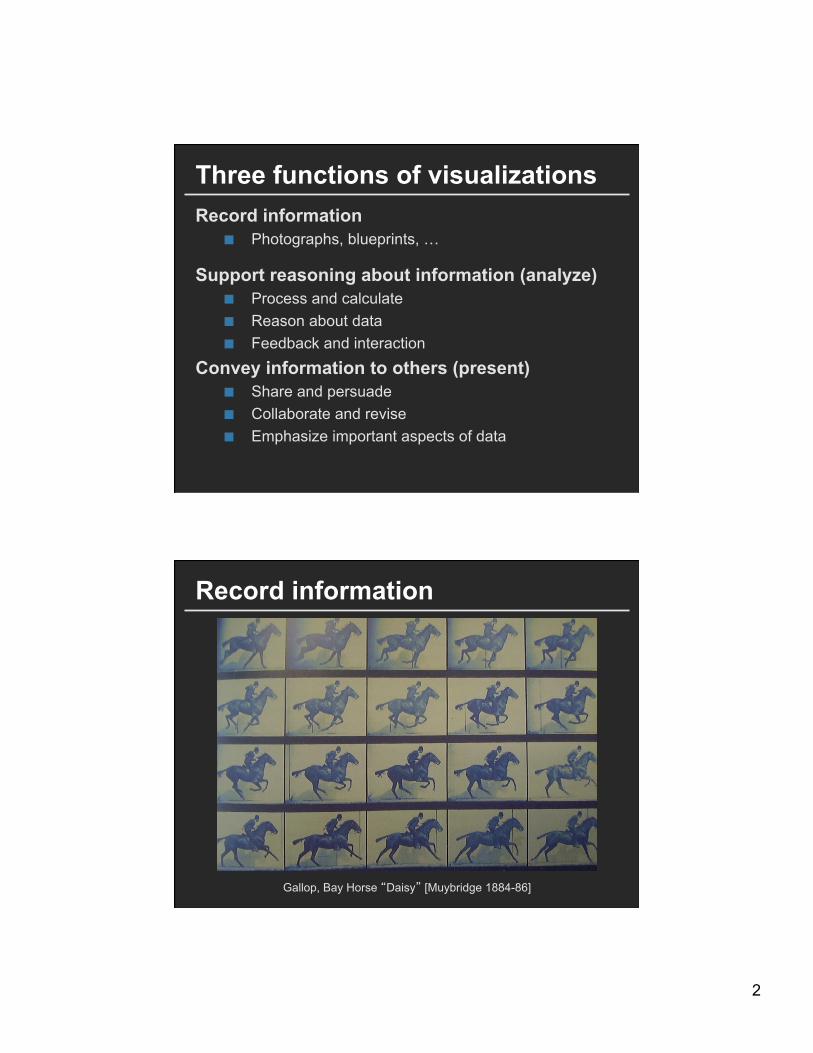
Three functions of visualizations Record information
Photographs, blueprints, …
Support reasoning about information (analyze) Process and calculate Reason about data Feedback and interaction
Convey information to others (present) Share and persuade Collaborate and revise Emphasize important aspects of data
Record information
Gallop, Bay Horse “Daisy” [Muybridge 1884-86]
3
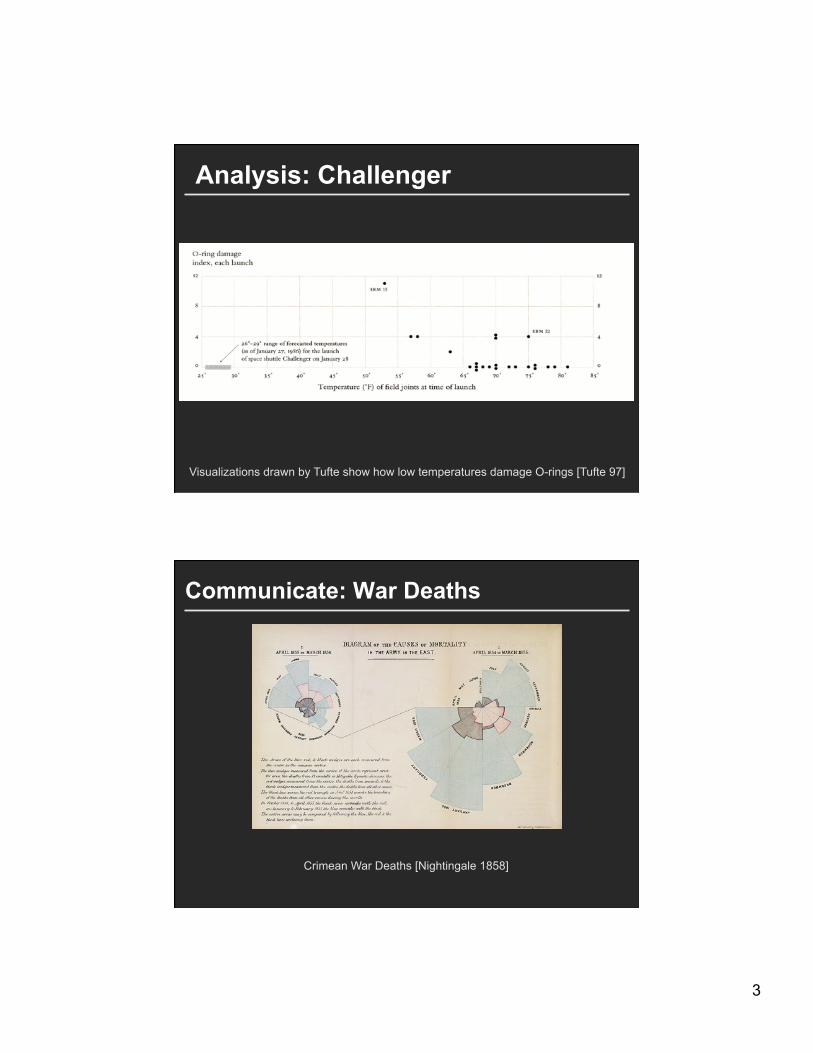
Analysis: Challenger
Visualizations drawn by Tufte show how low temperatures damage O-rings [Tufte 97]
Communicate: War Deaths
Crimean War Deaths [Nightingale 1858]
4
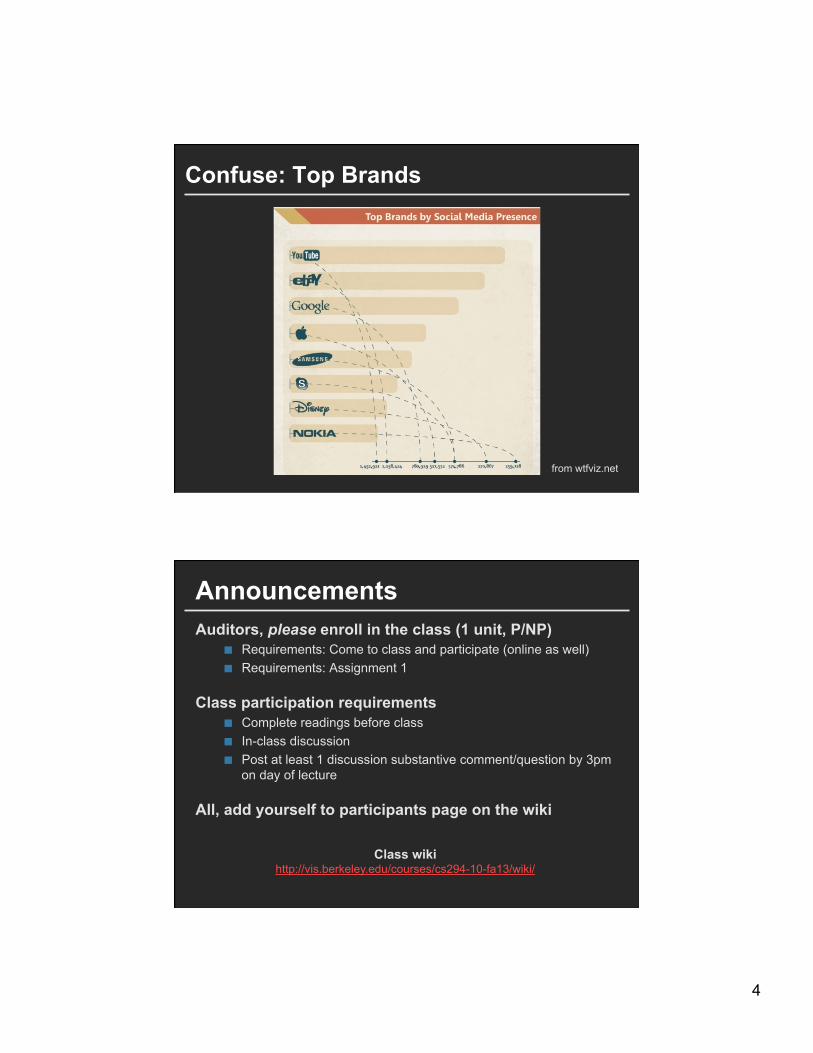
Confuse: Top Brands
from wtfviz.net
Announcements Auditors, please enroll in the class (1 unit, P/NP)
Requirements: Come to class and participate (online as well) Requirements: Assignment 1
Class participation requirements Complete readings before class In-class discussion Post at least 1 discussion substantive comment/question by 3pm
on day of lecture
All, add yourself to participants page on the wiki
Class wiki http://vis.berkeley.edu/courses/cs294-10-fa13/wiki/
5
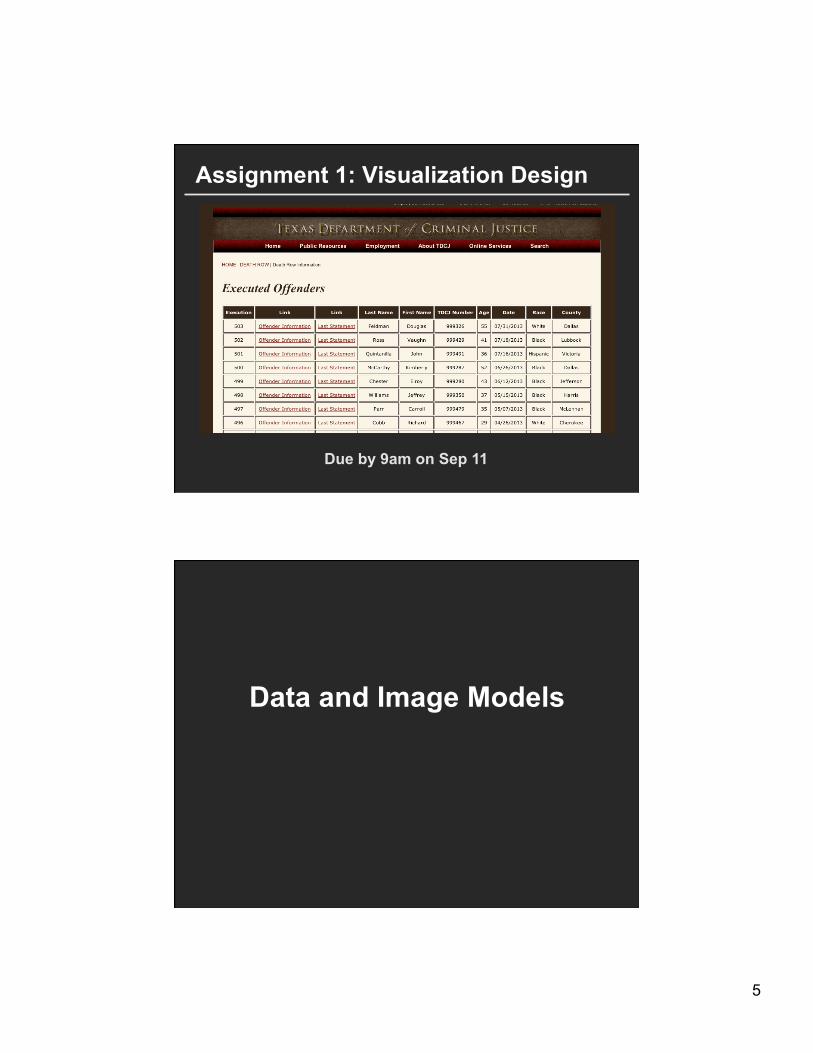
Assignment 1: Visualization Design
Due by 9am on Sep 11
Data and Image Models
6
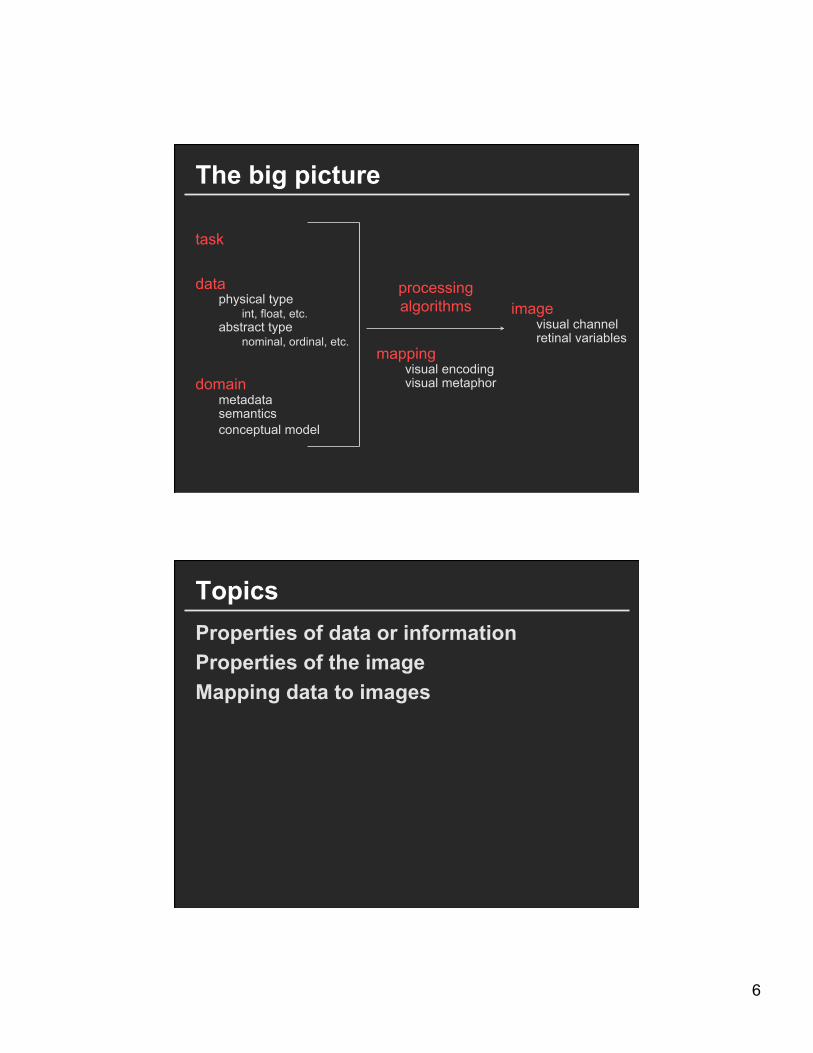
The big picture
task data
physical type int, float, etc. abstract type nominal, ordinal, etc.
domain
metadata semantics conceptual model
processing algorithms
mapping visual encoding visual metaphor
image visual channel retinal variables
Topics Properties of data or information Properties of the image Mapping data to images
7
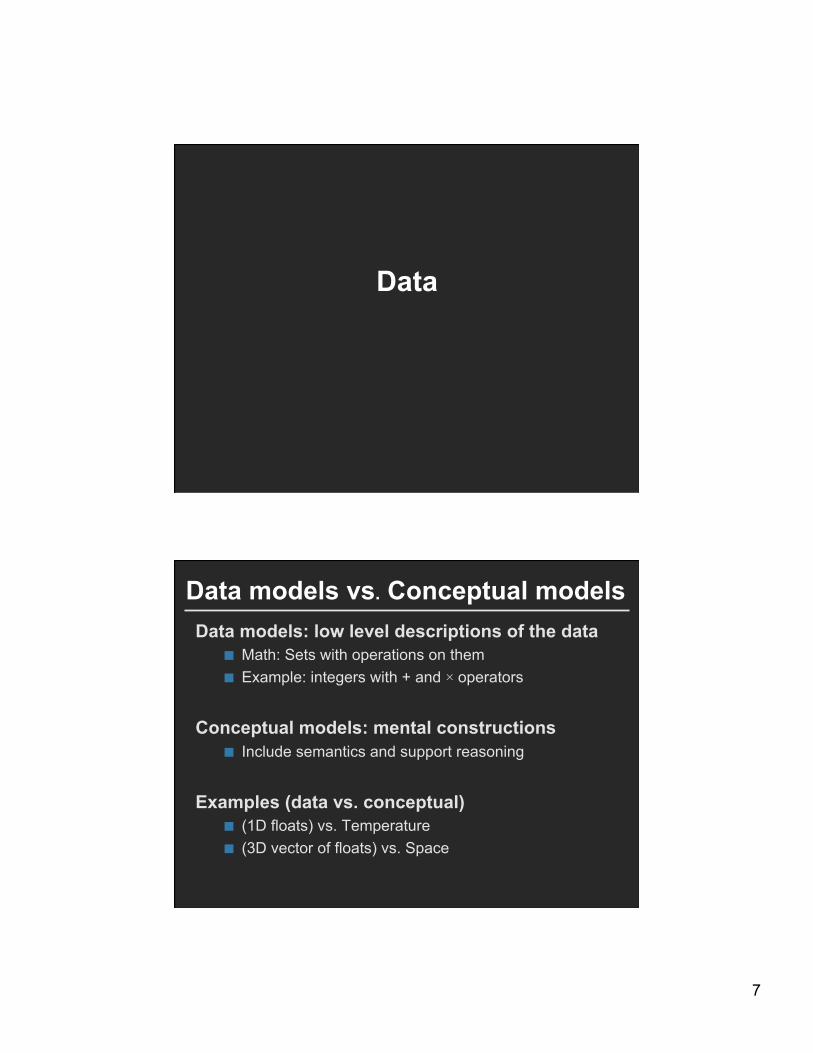
Data
Data models vs. Conceptual models Data models: low level descriptions of the data
Math: Sets with operations on them Example: integers with + and × operators
Conceptual models: mental constructions Include semantics and support reasoning
Examples (data vs. conceptual)
(1D floats) vs. Temperature (3D vector of floats) vs. Space
8
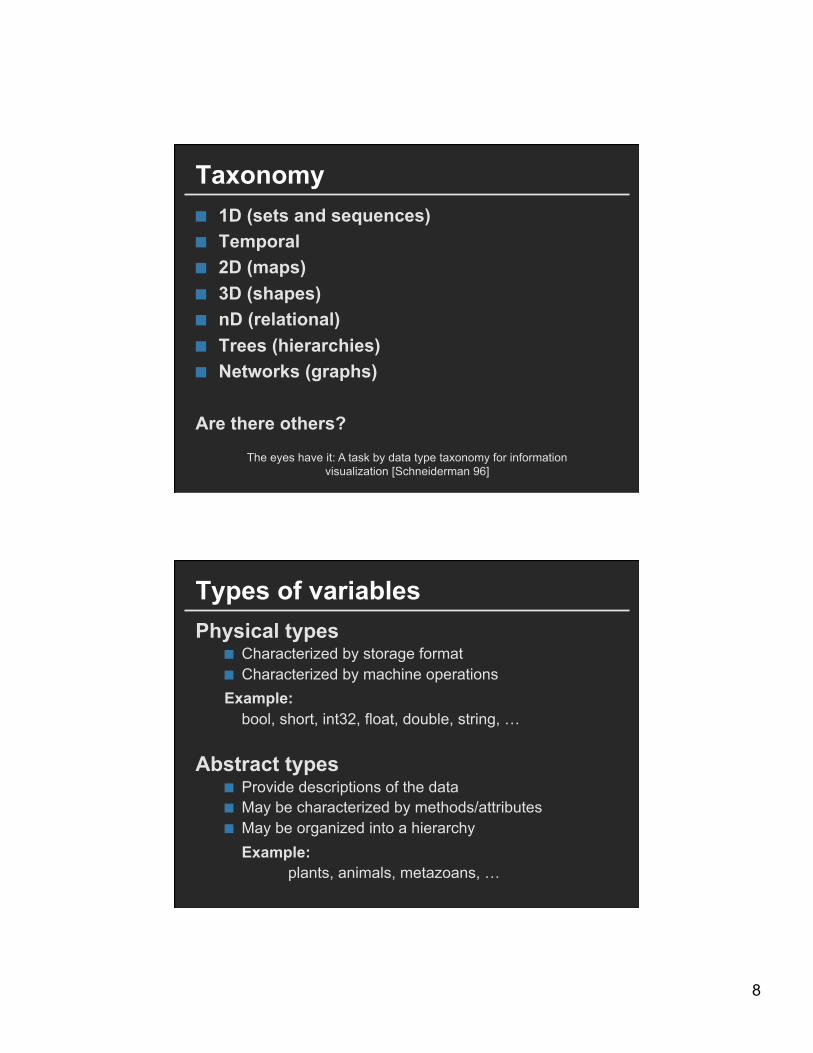
Taxonomy 1D (sets and sequences) Temporal 2D (maps) 3D (shapes) nD (relational) Trees (hierarchies) Networks (graphs)
Are there others?
The eyes have it: A task by data type taxonomy for information visualization [Schneiderman 96]
Types of variables Physical types
Characterized by storage format Characterized by machine operations Example:
bool, short, int32, float, double, string, …
Abstract types Provide descriptions of the data May be characterized by methods/attributes May be organized into a hierarchy
Example: plants, animals, metazoans, …
9
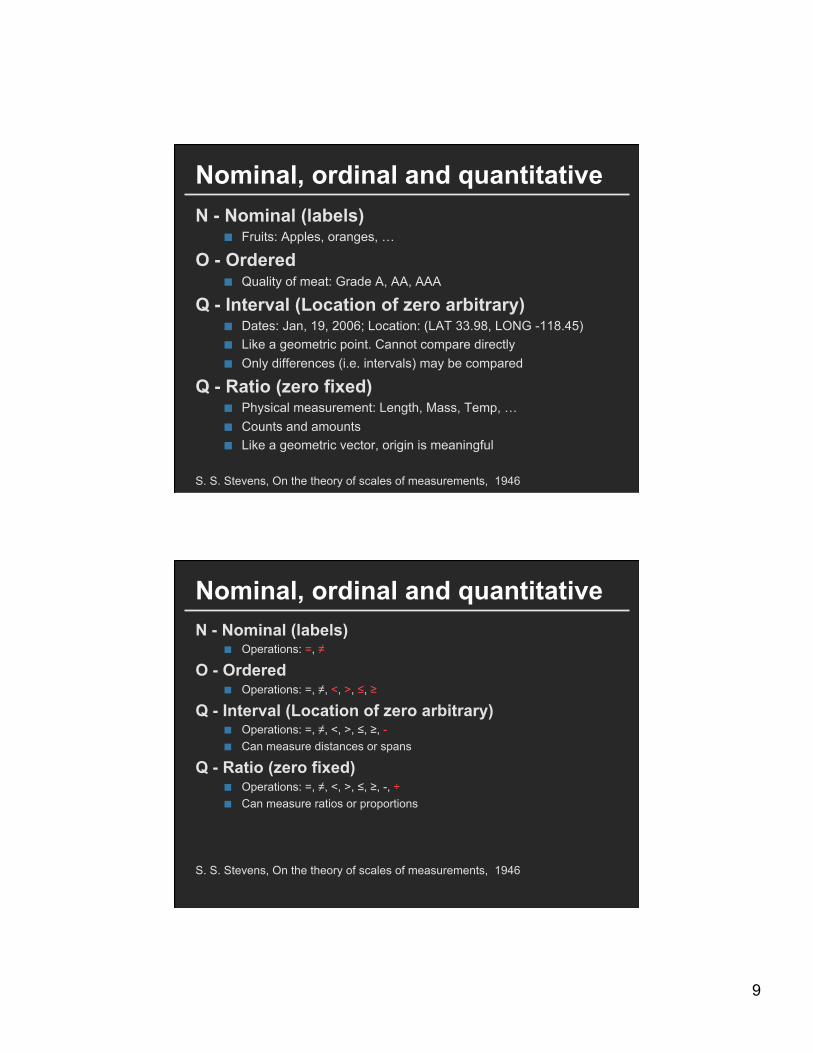
Nominal, ordinal and quantitative N - Nominal (labels)
Fruits: Apples, oranges, …
O - Ordered Quality of meat: Grade A, AA, AAA
Q - Interval (Location of zero arbitrary) Dates: Jan, 19, 2006; Location: (LAT 33.98, LONG -118.45) Like a geometric point. Cannot compare directly Only differences (i.e. intervals) may be compared
Q - Ratio (zero fixed) Physical measurement: Length, Mass, Temp, … Counts and amounts Like a geometric vector, origin is meaningful
S. S. Stevens, On the theory of scales of measurements, 1946
Nominal, ordinal and quantitative N - Nominal (labels)
Operations: =, ≠
O - Ordered Operations: =, ≠, <, >, ≤, ≥
Q - Interval (Location of zero arbitrary) Operations: =, ≠, <, >, ≤, ≥, - Can measure distances or spans
Q - Ratio (zero fixed) Operations: =, ≠, <, >, ≤, ≥, -, ÷ Can measure ratios or proportions
S. S. Stevens, On the theory of scales of measurements, 1946
10
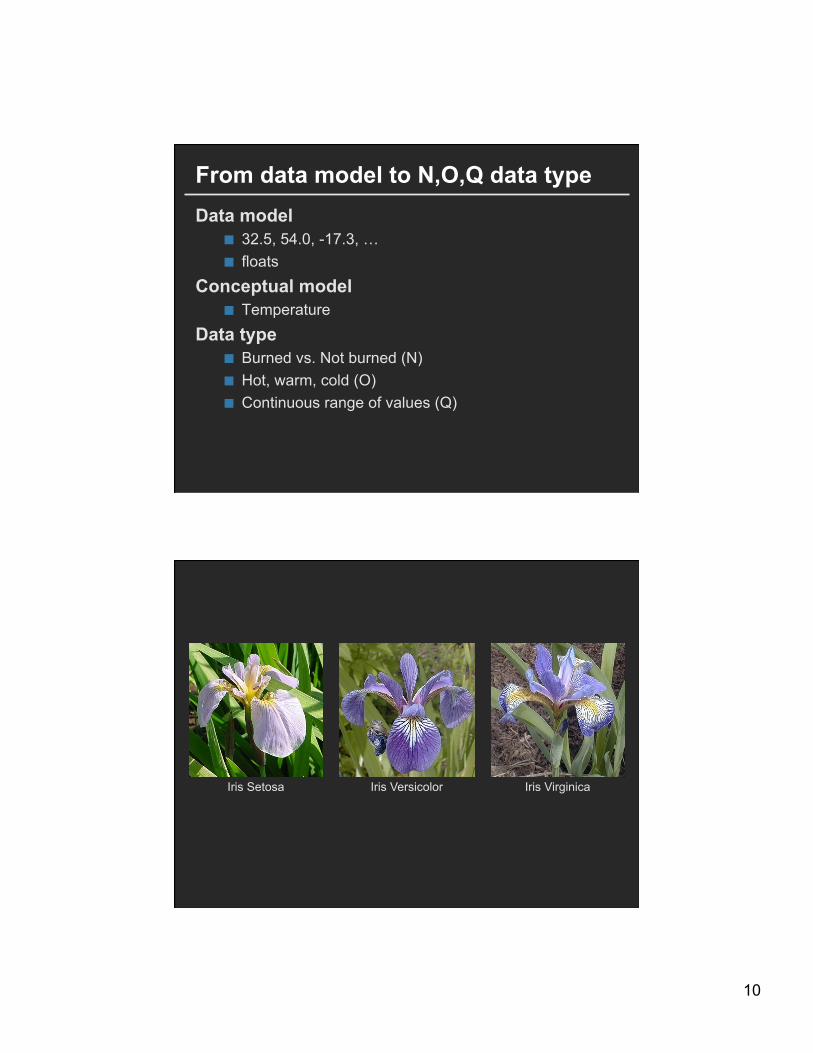
From data model to N,O,Q data type Data model
32.5, 54.0, -17.3, … floats
Conceptual model Temperature
Data type Burned vs. Not burned (N) Hot, warm, cold (O) Continuous range of values (Q)
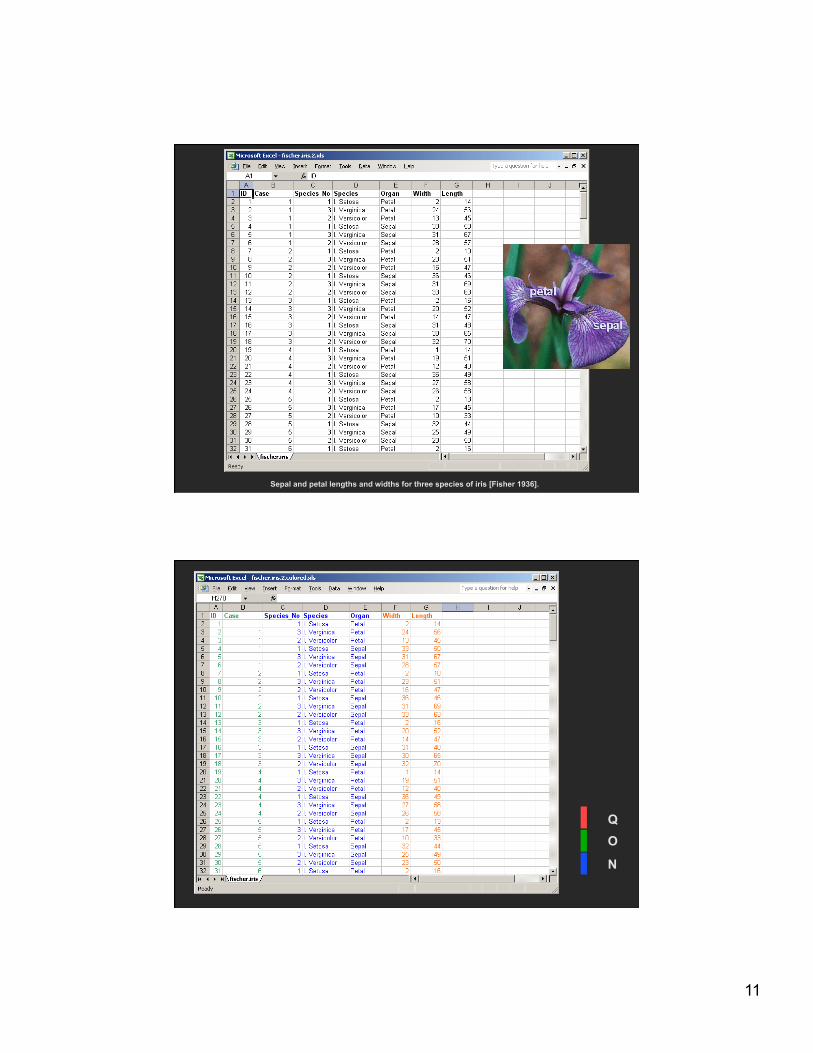
Iris Setosa Iris Versicolor Iris Virginica
11
Sepal and petal lengths and widths for three species of iris [Fisher 1936].
Q O
N

12
Relational data model Represent data as a table (relation) Each row (tuple) represents a single record Each record is a fixed-length tuple
Each column (attribute) represents a single variable Each attribute has a name and a data type
A table’s schema is the set of names and data types
A database is a collection of tables (relations)
Relational algebra [Codd]
Data transformations (SQL) Selection (WHERE) – restrict values Projection (SELECT) – choose subset of attributes Sorting (ORDER BY) Aggregation (GROUP BY, SUM, MIN, …) Set operations (UNION, …) Combine (INNNER JOIN, OUTER JOIN, …)
13
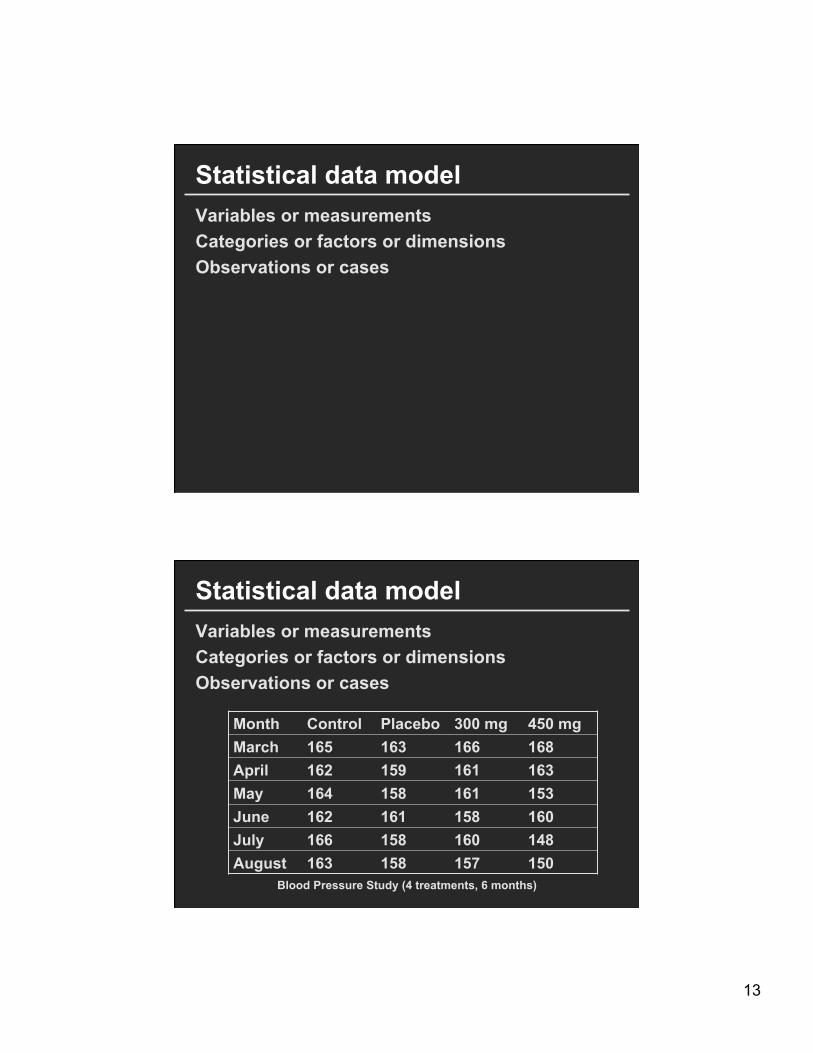
Statistical data model Variables or measurements Categories or factors or dimensions Observations or cases
Statistical data model Variables or measurements Categories or factors or dimensions Observations or cases Month Control Placebo 300 mg 450 mg
March 165 163 166 168 April 162 159 161 163 May 164 158 161 153 June 162 161 158 160 July 166 158 160 148 August 163 158 157 150
Blood Pressure Study (4 treatments, 6 months)
14
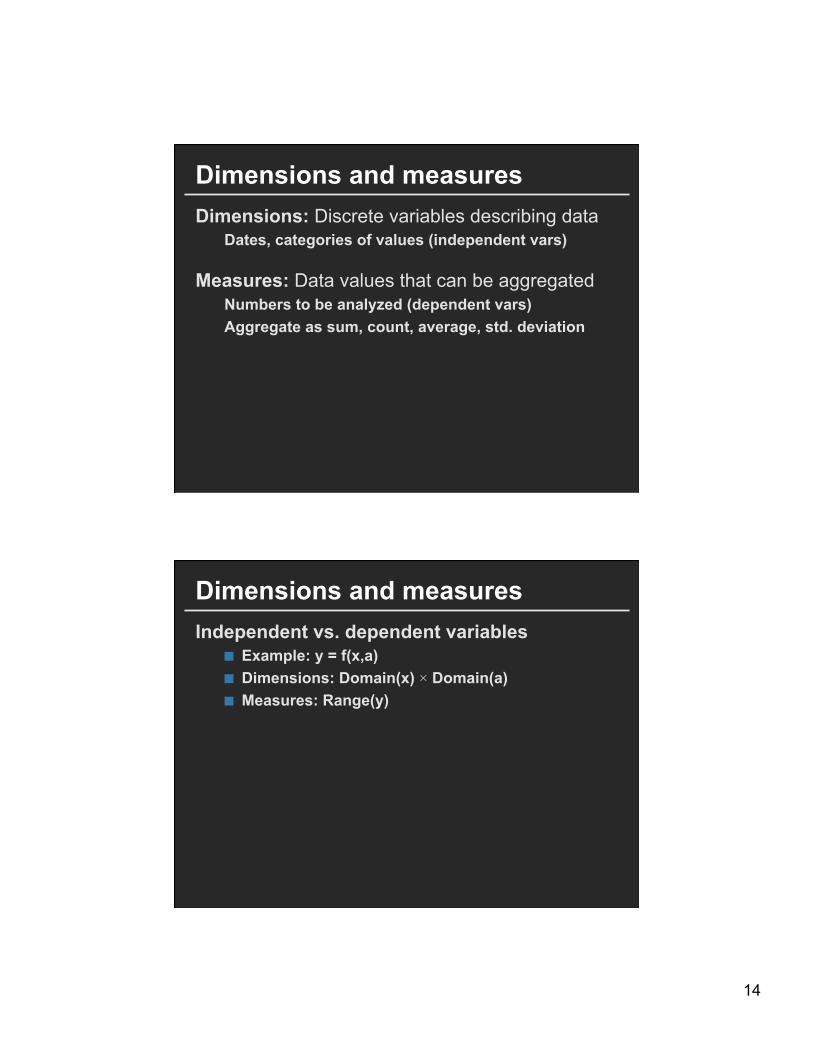
Dimensions and measures Dimensions: Discrete variables describing data
Dates, categories of values (independent vars)
Measures: Data values that can be aggregated Numbers to be analyzed (dependent vars) Aggregate as sum, count, average, std. deviation
Dimensions and measures Independent vs. dependent variables
Example: y = f(x,a) Dimensions: Domain(x) × Domain(a) Measures: Range(y)
15
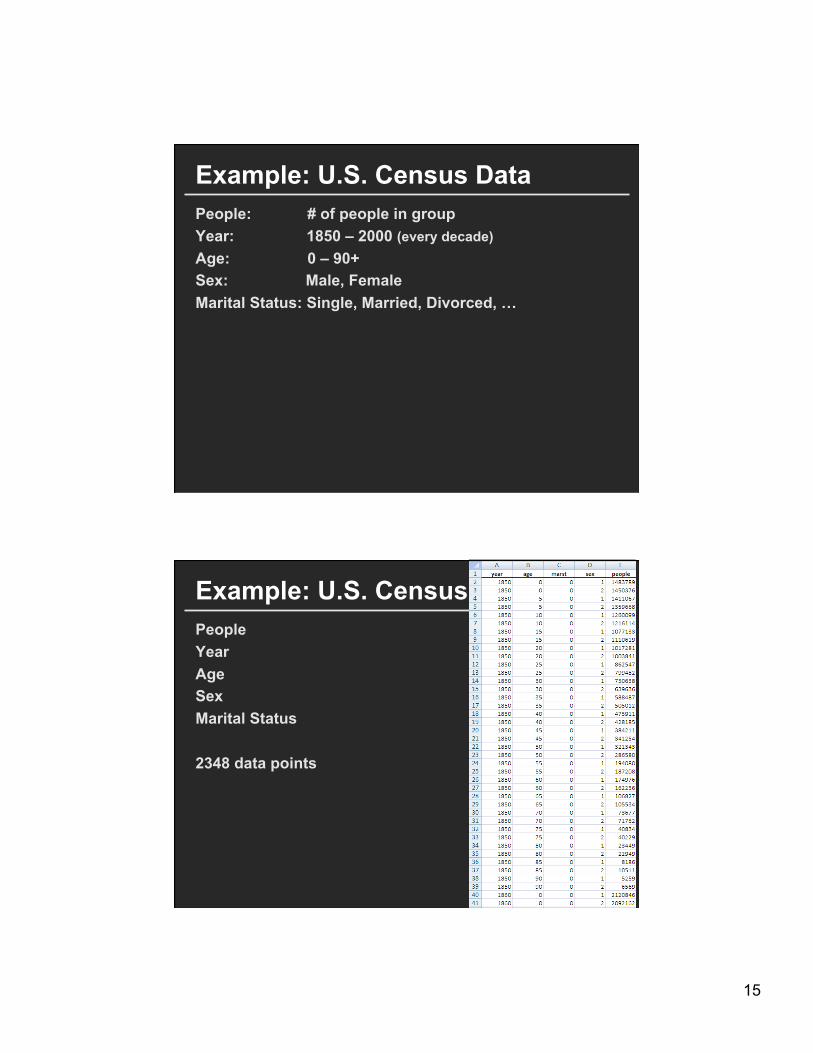
Example: U.S. Census Data People: # of people in group Year: 1850 – 2000 (every decade) Age: 0 – 90+ Sex: Male, Female Marital Status: Single, Married, Divorced, …
Example: U.S. Census People Year Age Sex Marital Status 2348 data points
16
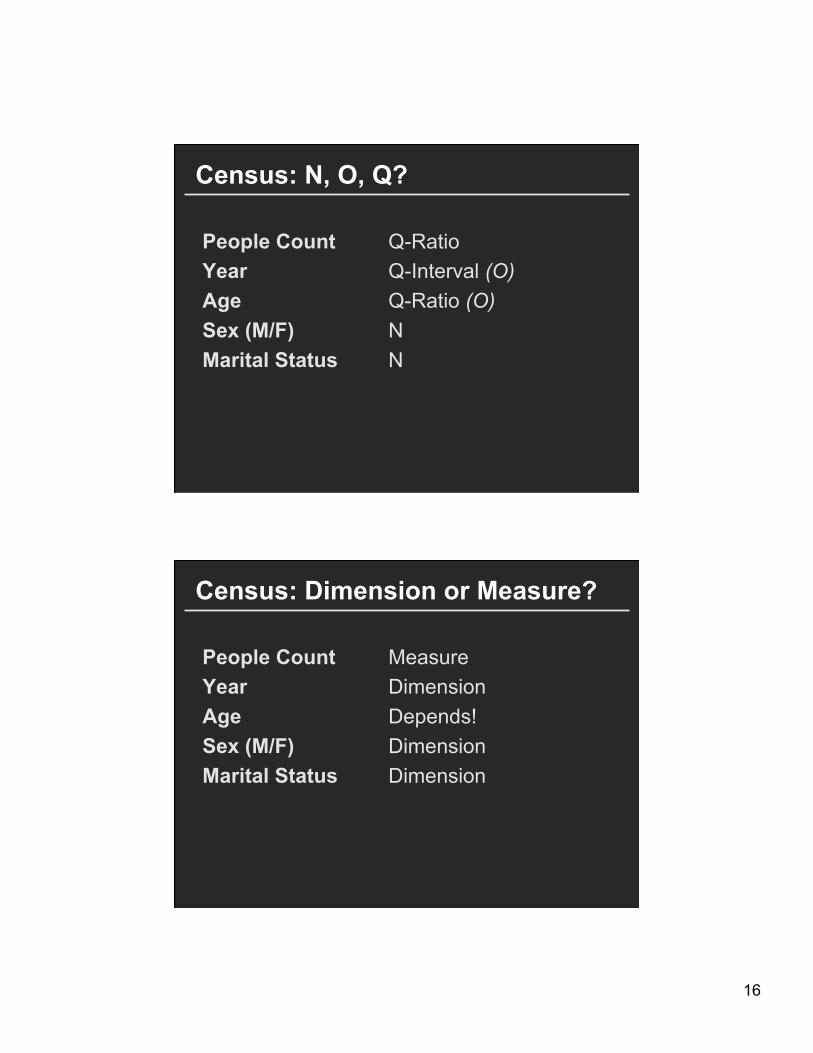
Census: N, O, Q?
People Count Year Age Sex (M/F) Marital Status
Q-Ratio Q-Interval (O) Q-Ratio (O) N N
Census: Dimension or Measure?
People Count Year Age Sex (M/F) Marital Status
Measure Dimension Depends! Dimension Dimension
17
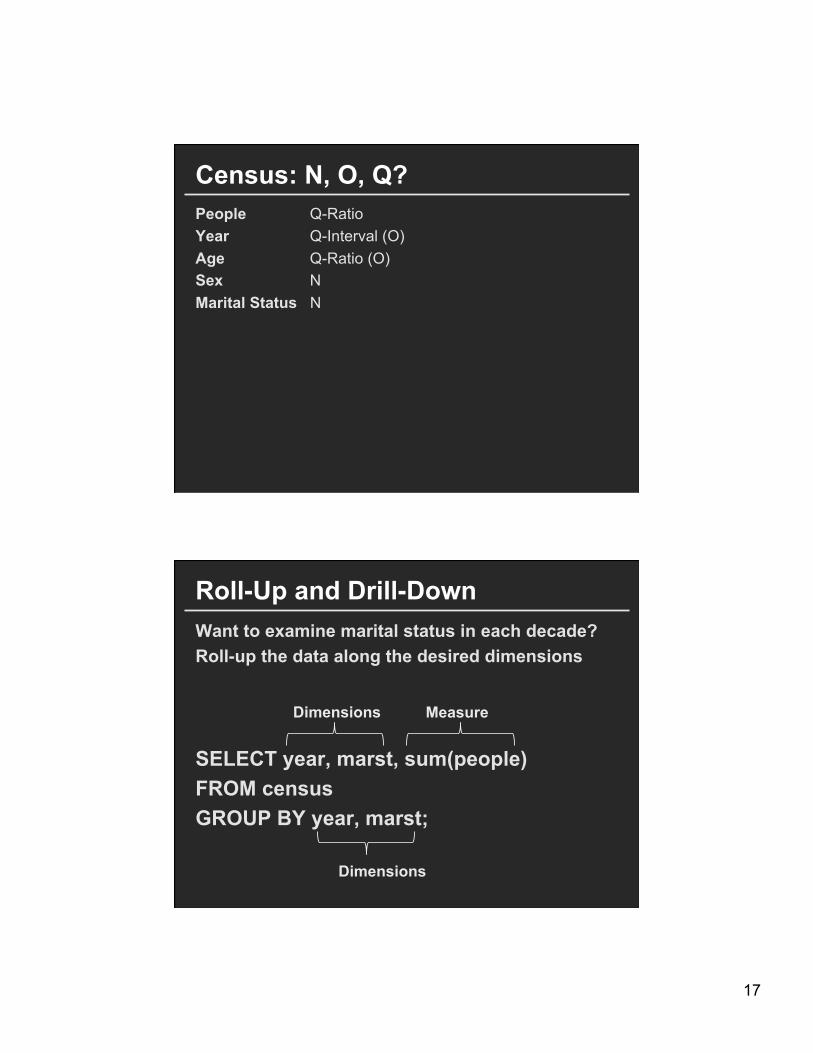
Census: N, O, Q? People Q-Ratio Year Q-Interval (O) Age Q-Ratio (O) Sex N Marital Status N
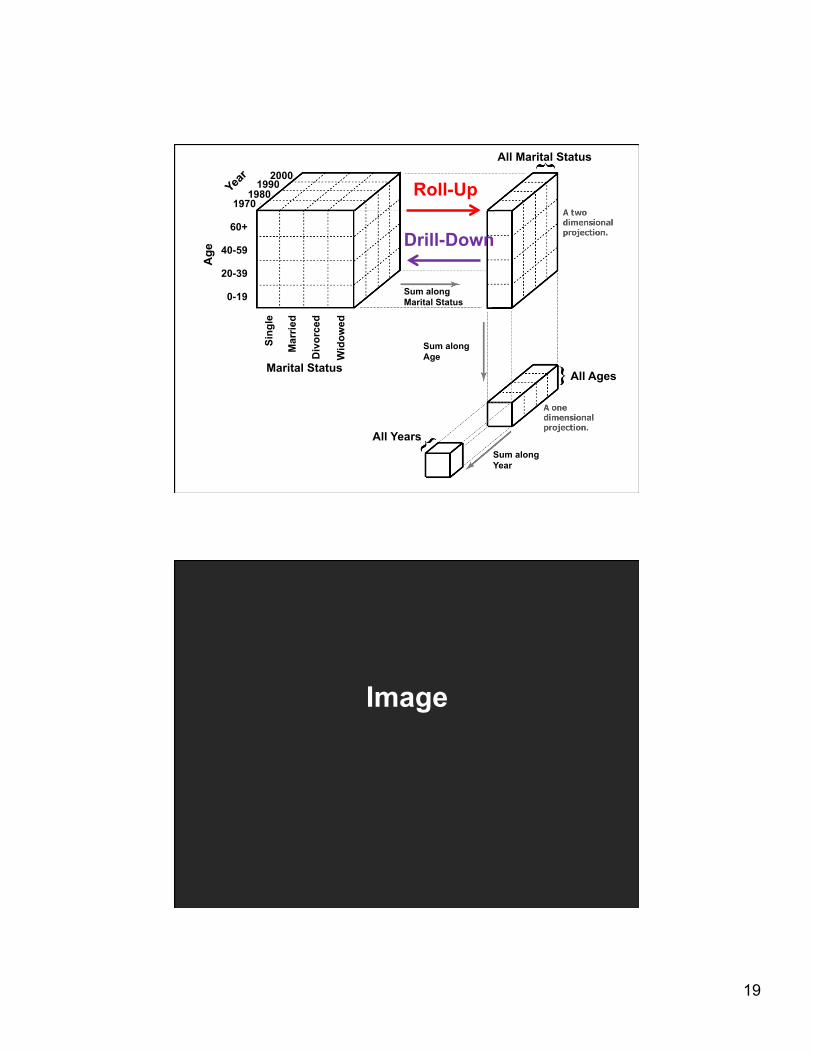
Roll-Up and Drill-Down Want to examine marital status in each decade? Roll-up the data along the desired dimensions
SELECT year, marst, sum(people) FROM census GROUP BY year, marst;
Dimensions Measure
Dimensions
18
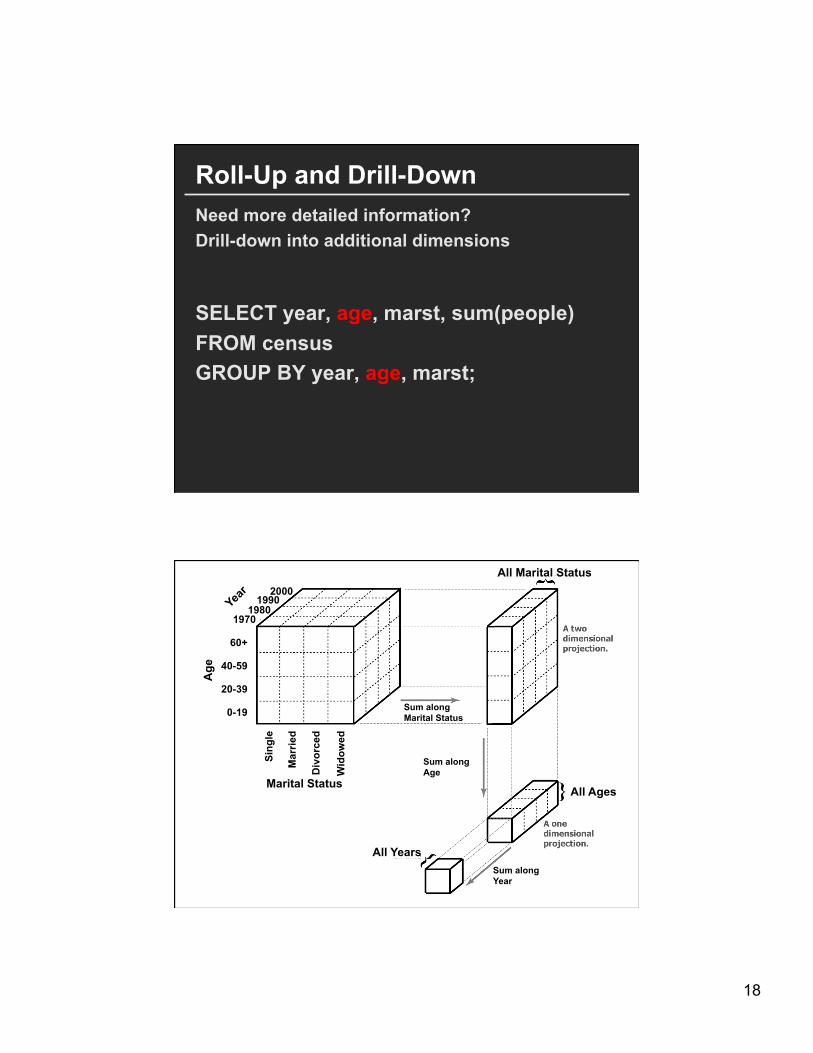
Roll-Up and Drill-Down Need more detailed information? Drill-down into additional dimensions
SELECT year, age, marst, sum(people) FROM census GROUP BY year, age, marst;
Age
Marital Status
Sing
le
Mar
ried
Div
orce
d
Wid
owed
1970 1980
1990 2000
Year
0-19
20-39
40-59
60+
All Marital Status
All Ages
All Years
Sum along Marital Status
Sum along Age
Sum along Year
19
Age
Marital Status
Sing
le
Mar
ried
Div
orce
d
Wid
owed
1970 1980
1990 2000
Year
0-19
20-39
40-59
60+
All Marital Status
All Ages
All Years
Sum along Marital Status
Sum along Age
Sum along Year
Roll-Up
Drill-Down
Image
20
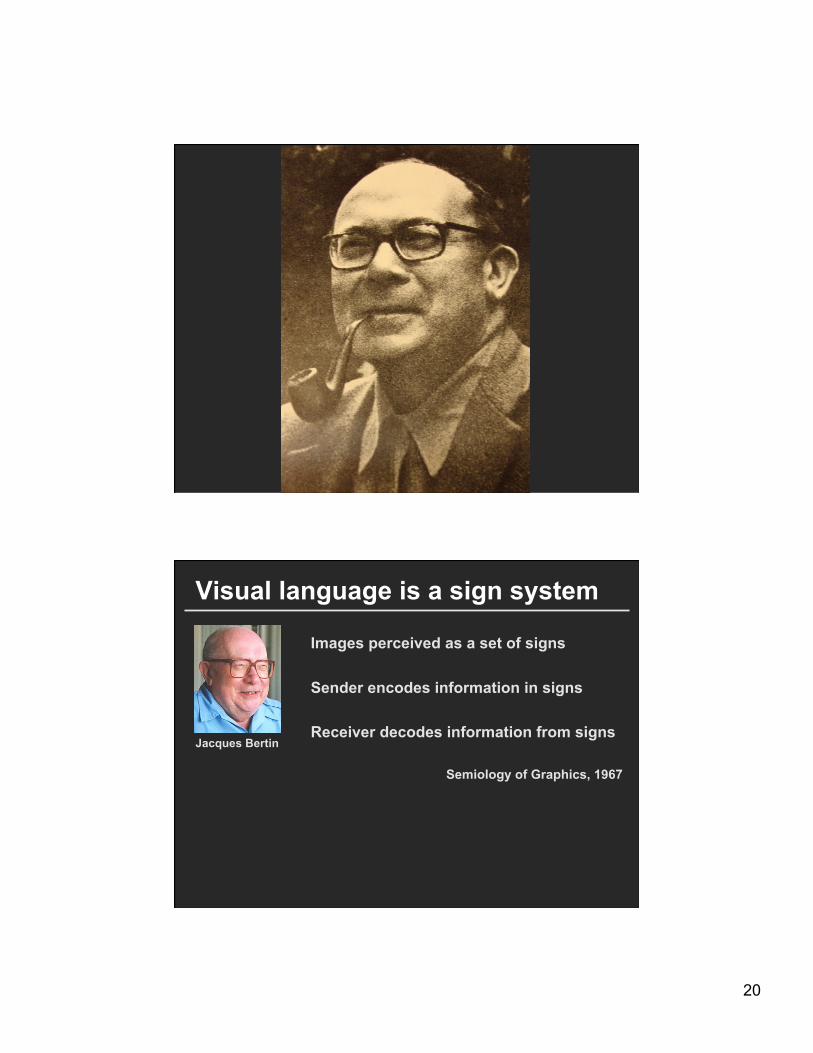
Visual language is a sign system
Images perceived as a set of signs Sender encodes information in signs
Receiver decodes information from signs
Semiology of Graphics, 1967
Jacques Bertin
21
Information in position 1. A, B, C are distinguishable 2. B is between A and C. 3. BC is twice as long as AB. ∴ Encode quantitative variables A
B
C
"Resemblance, order and proportional are the three signfields in graphics.” - Bertin
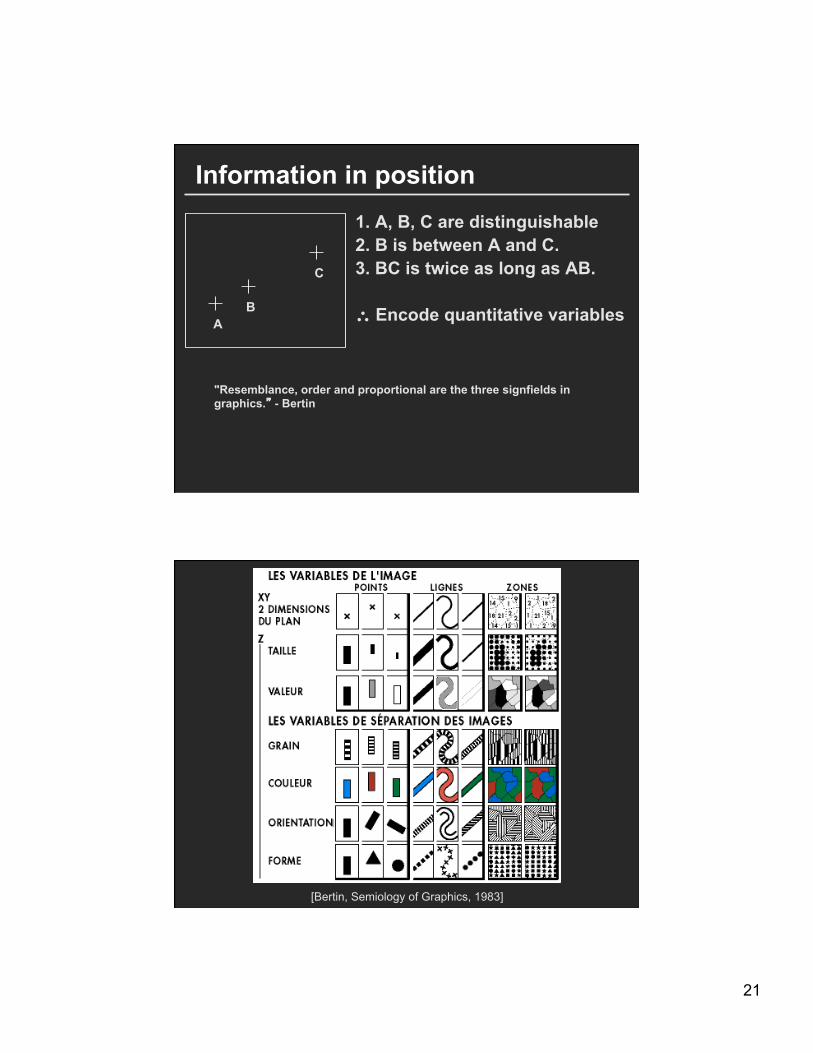
[Bertin, Semiology of Graphics, 1983]
22
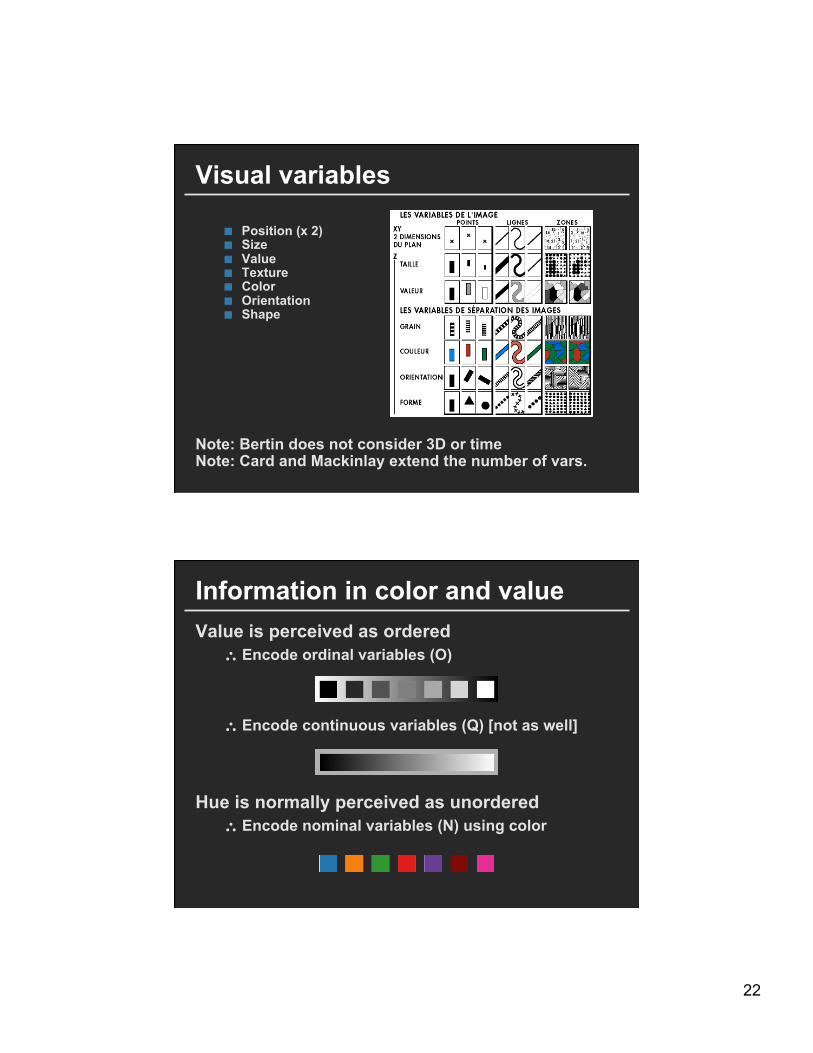
Position (x 2) Size Value Texture Color Orientation Shape
Note: Bertin does not consider 3D or time Note: Card and Mackinlay extend the number of vars.
Visual variables
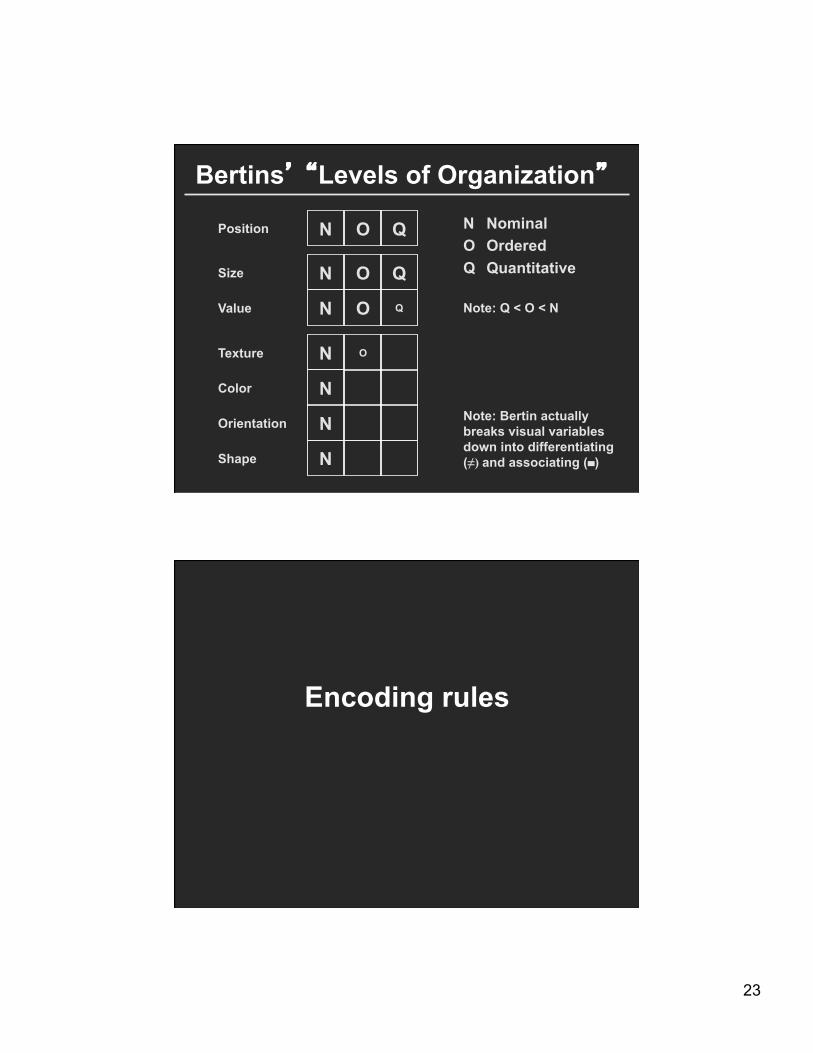
Information in color and value Value is perceived as ordered
∴ Encode ordinal variables (O)
∴ Encode continuous variables (Q) [not as well]
Hue is normally perceived as unordered
∴ Encode nominal variables (N) using color
23
Bertins’ “Levels of Organization” N Nominal O Ordered Q Quantitative
N O Q
N O Q
N O Q
N O
N
N
N
Position
Size
Value
Texture
Color
Orientation
Shape
Note: Bertin actually breaks visual variables down into differentiating (≠) and associating (≡)
Note: Q < O < N
Encoding rules
24
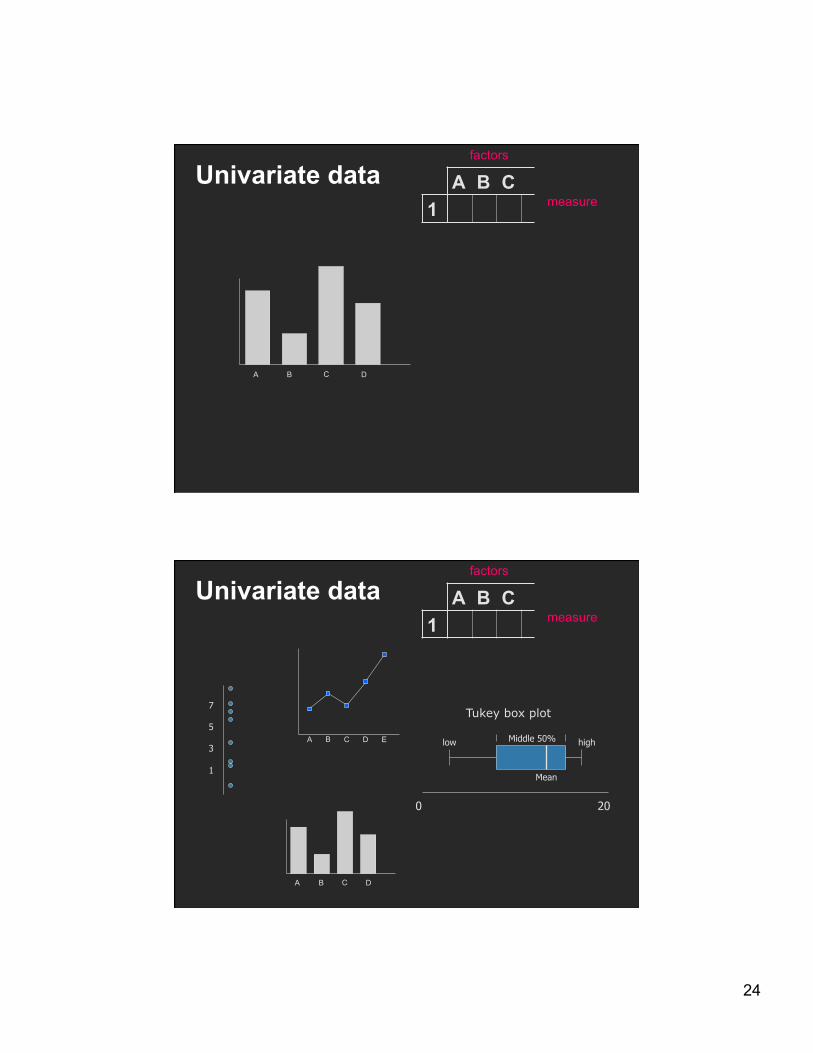
Univariate data A B C 1
factors
measure
A B C D
Univariate data
7 5 3 1
0 20
Mean
low high Middle 50%
Tukey box plot
A B C 1
factors
measure
A B C D
A B C D E

25
Bivariate data
Scatter plot is common
A B C 1 2
A
B
C
D
E
F
Trivariate data
3D scatter plot is possible
A B C 1 2 3
A
B
C
D
E
F
A
B
C
D
E
F
G
26
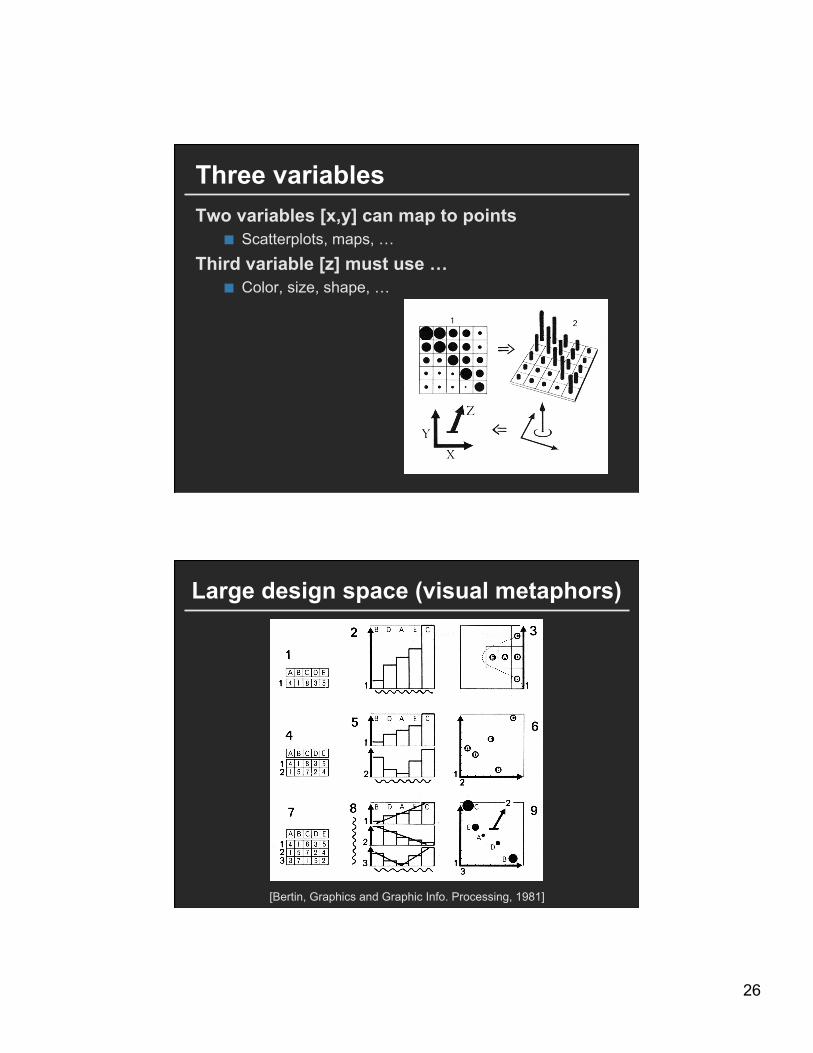
Three variables Two variables [x,y] can map to points
Scatterplots, maps, … Third variable [z] must use …
Color, size, shape, …
Large design space (visual metaphors)
[Bertin, Graphics and Graphic Info. Processing, 1981]
27
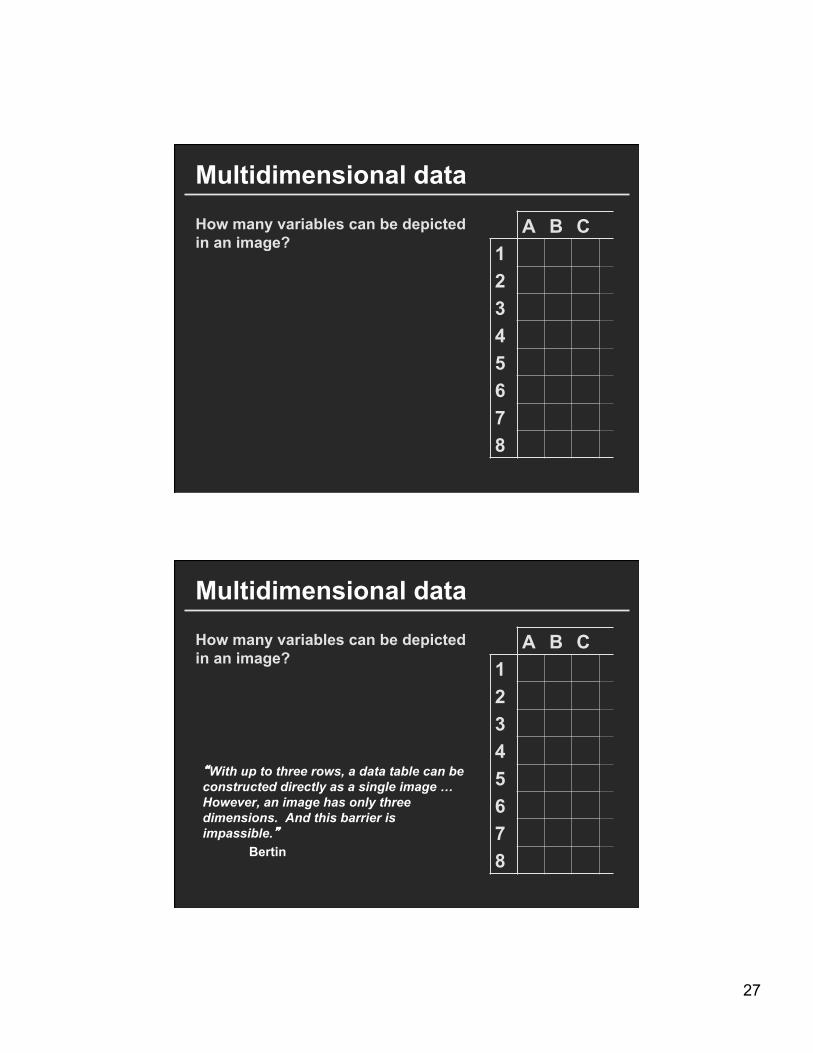
Multidimensional data
A B C 1 2 3 4 5 6 7 8
How many variables can be depicted in an image?
Multidimensional data
“With up to three rows, a data table can be constructed directly as a single image … However, an image has only three dimensions. And this barrier is impassible.”
Bertin
A B C 1 2 3 4 5 6 7 8
How many variables can be depicted in an image?
28
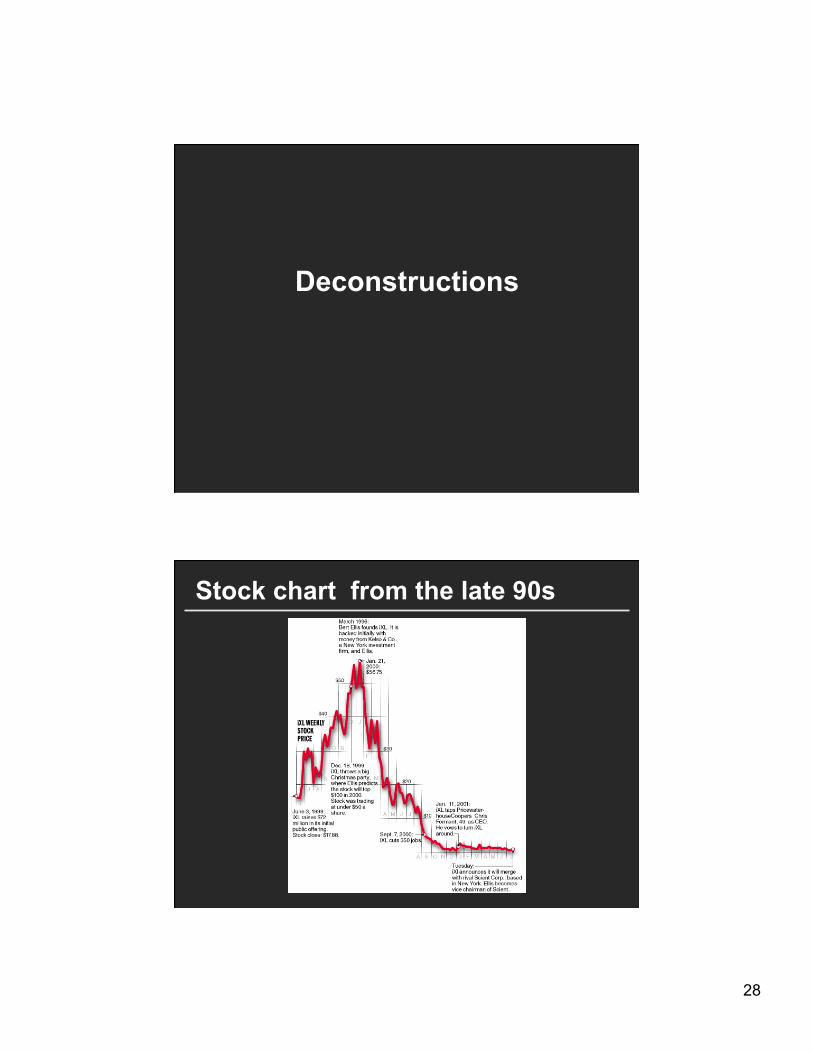
Deconstructions
Stock chart from the late 90s
29
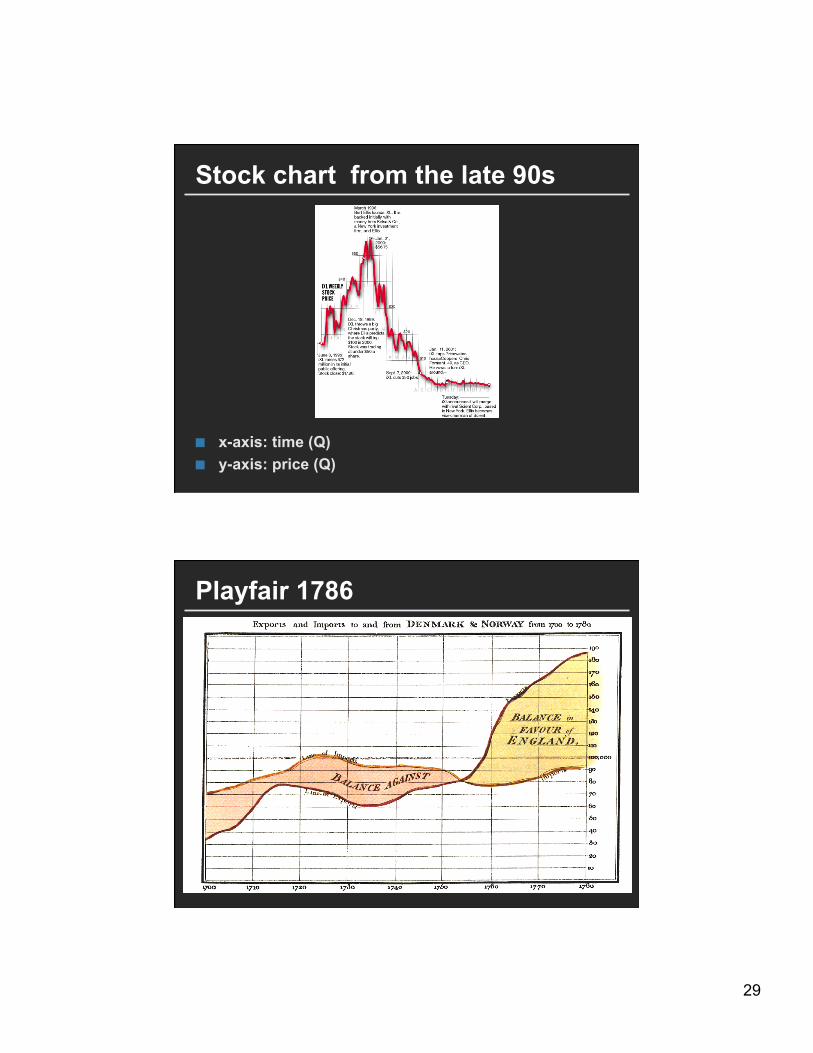
Stock chart from the late 90s
x-axis: time (Q) y-axis: price (Q)
Playfair 1786
30
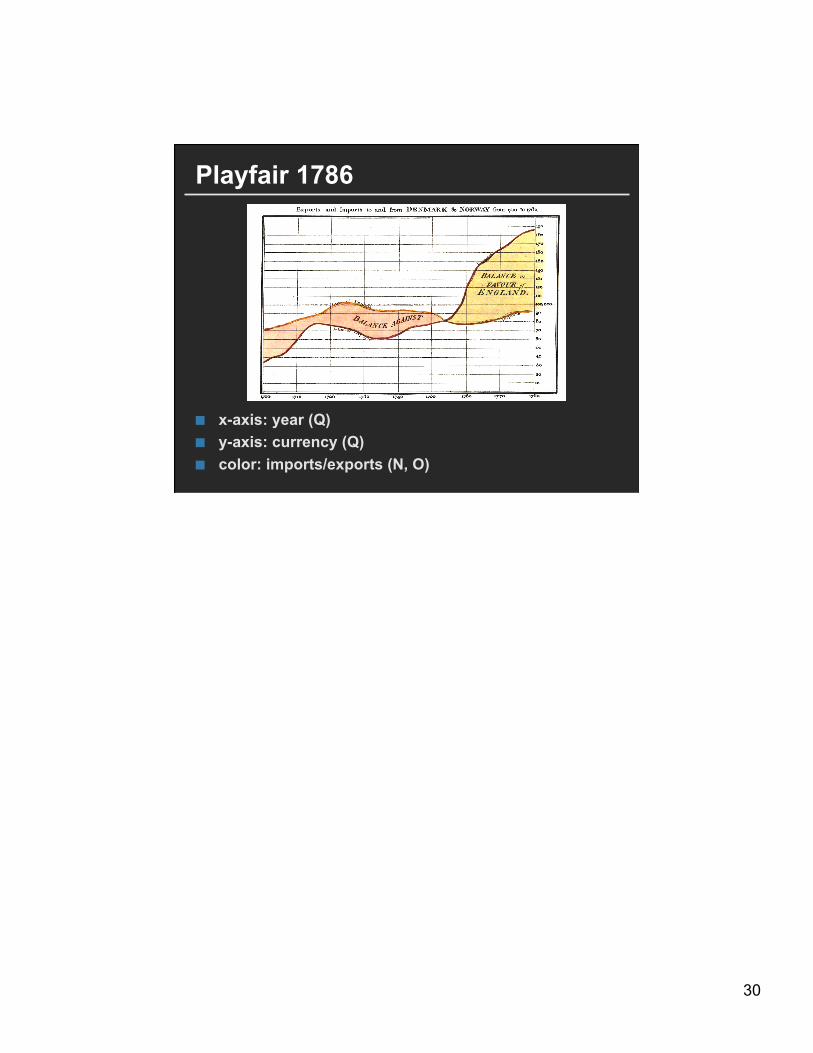
Playfair 1786
x-axis: year (Q) y-axis: currency (Q) color: imports/exports (N, O)