data handbook chapter 4 & 5. data a series of readings that represents a natural population...
TRANSCRIPT
DataData
Handbook Chapter 4 & 5Handbook Chapter 4 & 5
DataData
A series of readings that represents a A series of readings that represents a natural population parameter natural population parameter
It provides information about the It provides information about the population itselfpopulation itself
Organizing DataOrganizing Data
Important prelude to describing and Important prelude to describing and interpreting datainterpreting data
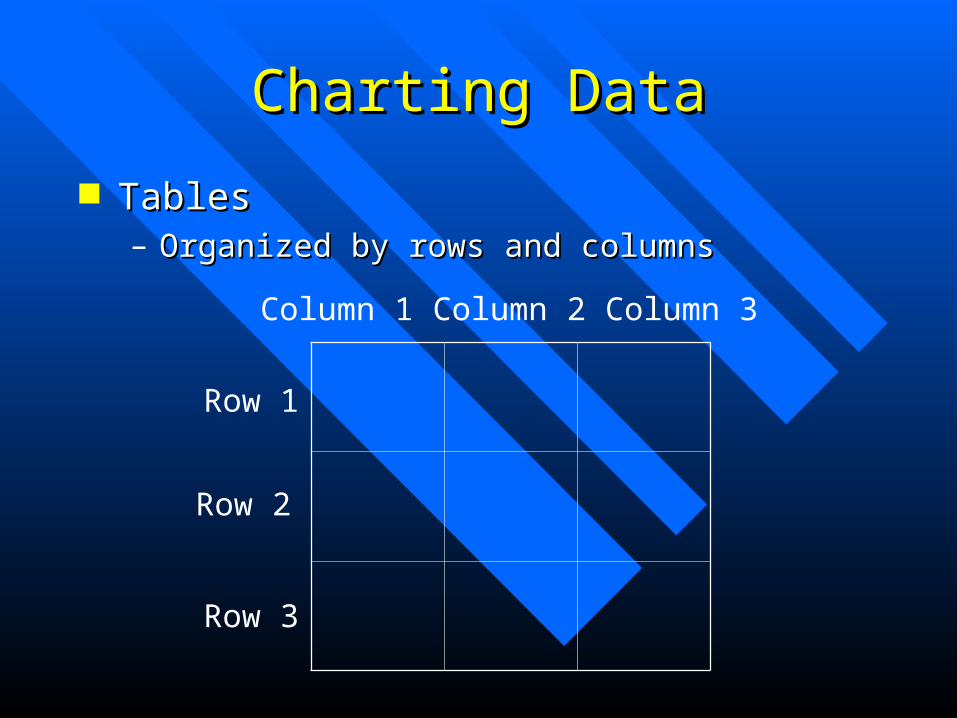
Charting DataCharting Data
TablesTables– Organized by rows and columnsOrganized by rows and columns
Column 1 Column 2 Column 3
Row 1
Row 2
Row 3
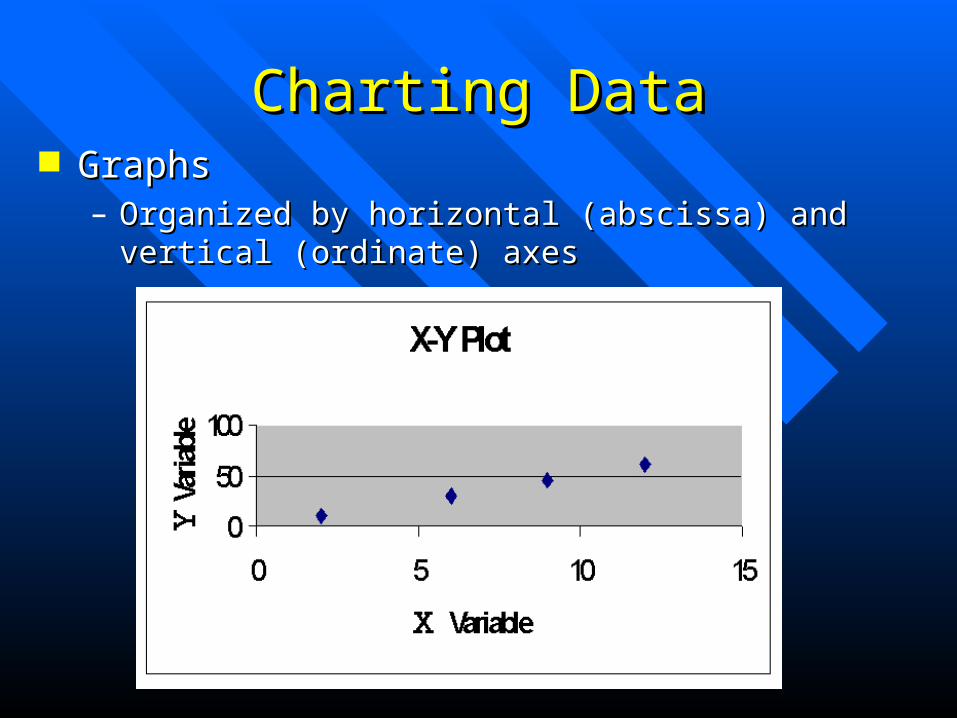
Charting DataCharting Data GraphsGraphs
– Organized by horizontal (abscissa) and vertical Organized by horizontal (abscissa) and vertical (ordinate) axes (ordinate) axes

Charting DataCharting Data GraphsGraphs
– Proper legendProper legend– Properly labeled axesProperly labeled axes
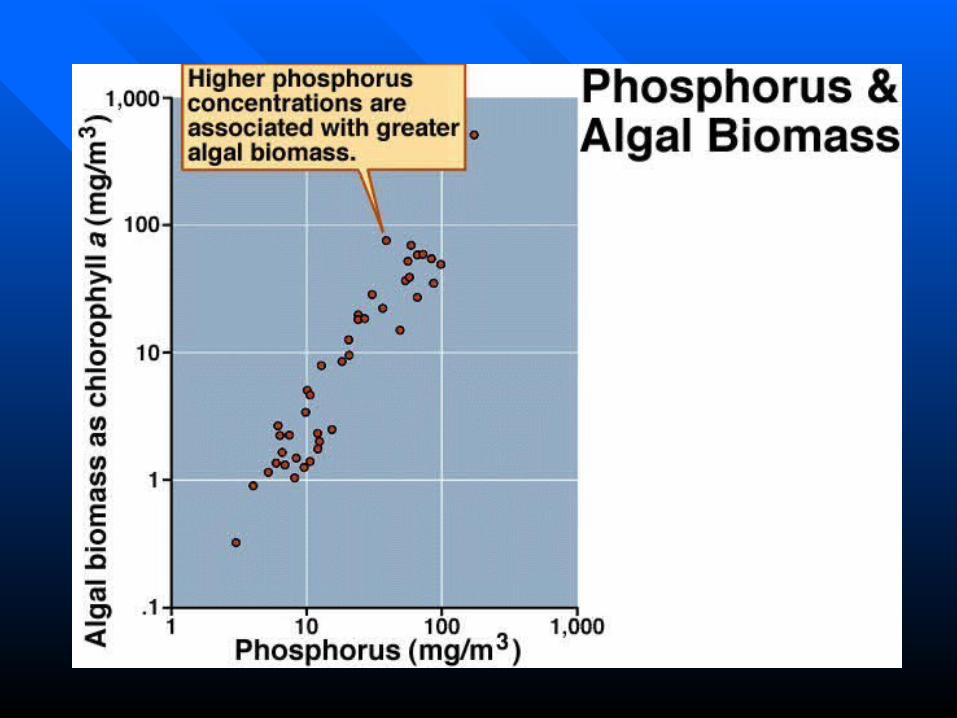

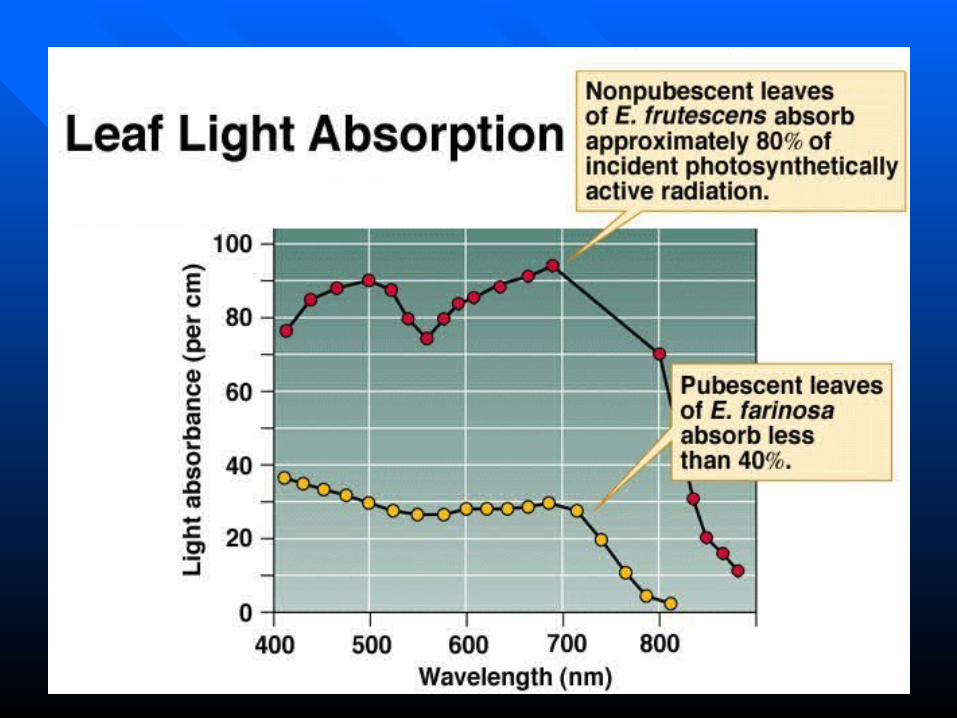
GraphsGraphs Multiple graphs used for comparing data should Multiple graphs used for comparing data should
map the same variables on the ordinate and map the same variables on the ordinate and abscissa and use the same scale for each graph.abscissa and use the same scale for each graph.
Describing dataDescribing data
Descriptions of data indirectly describes Descriptions of data indirectly describes actual population parametersactual population parameters
Describing the data distribution is a first Describing the data distribution is a first step in this process step in this process
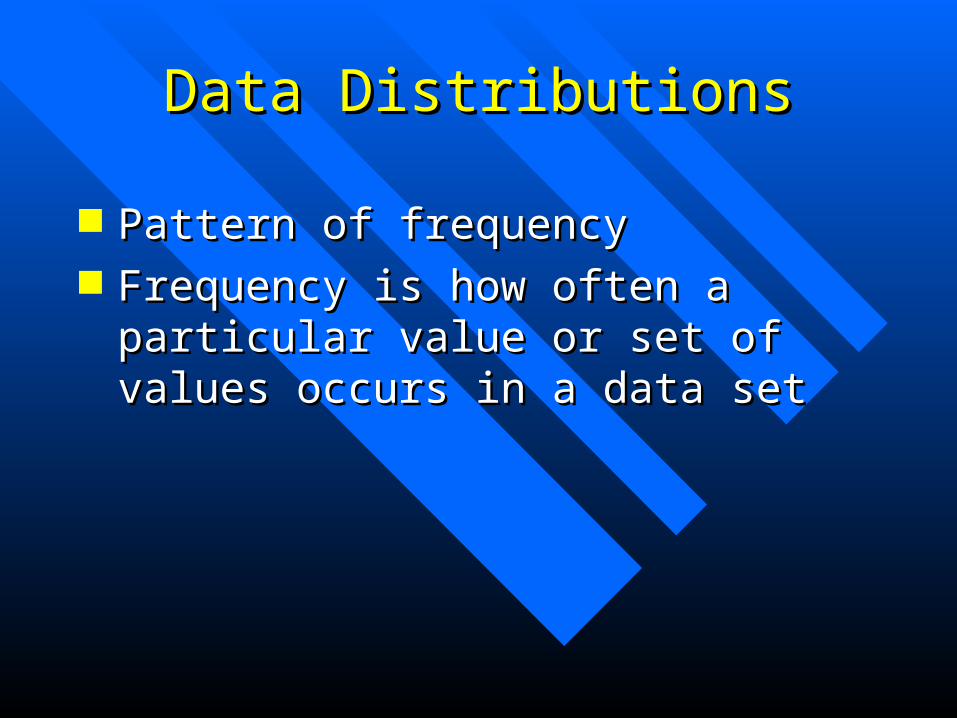
Data DistributionsData Distributions
Pattern of frequencyPattern of frequency Frequency is how often a particular Frequency is how often a particular
value or set of values occurs in a data value or set of values occurs in a data setset
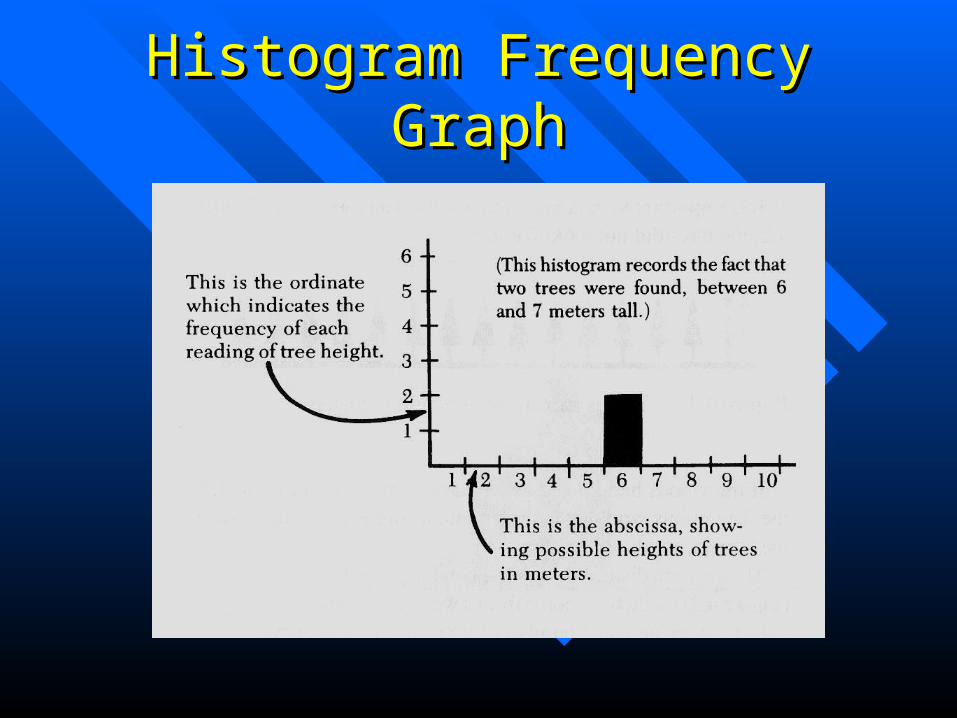
Histogram Frequency GraphHistogram Frequency Graph
Types of distributionsTypes of distributions
UniformUniform UnimodalUnimodal BimodalBimodal NormalNormal SkewedSkewed
UniformUniform
The distribution has an equal frequency The distribution has an equal frequency (number of occurrences) of each value (number of occurrences) of each value or category of values or category of values

Uniform Distribution of Tree Uniform Distribution of Tree HeightsHeights
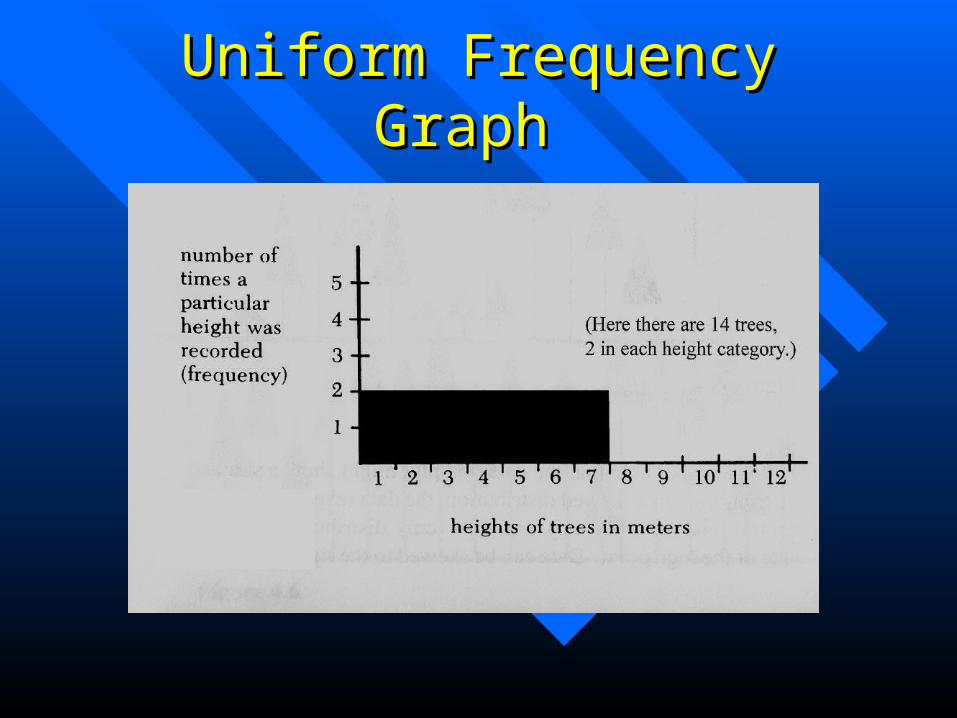
Uniform Frequency Graph Uniform Frequency Graph
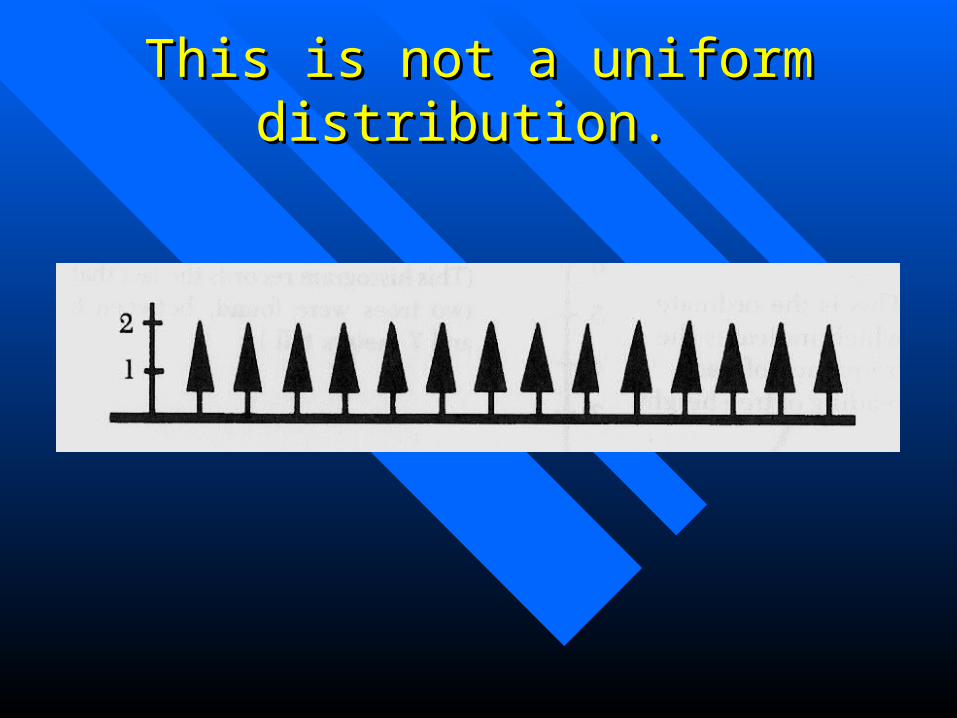
This is not a uniform distribution. This is not a uniform distribution.

UnimodalUnimodal
The distribution has an unequal The distribution has an unequal frequency (number of occurances) of frequency (number of occurances) of each value or category of valueseach value or category of values
The distribution has distinct central The distribution has distinct central values that have a greater frequency values that have a greater frequency than the othersthan the others
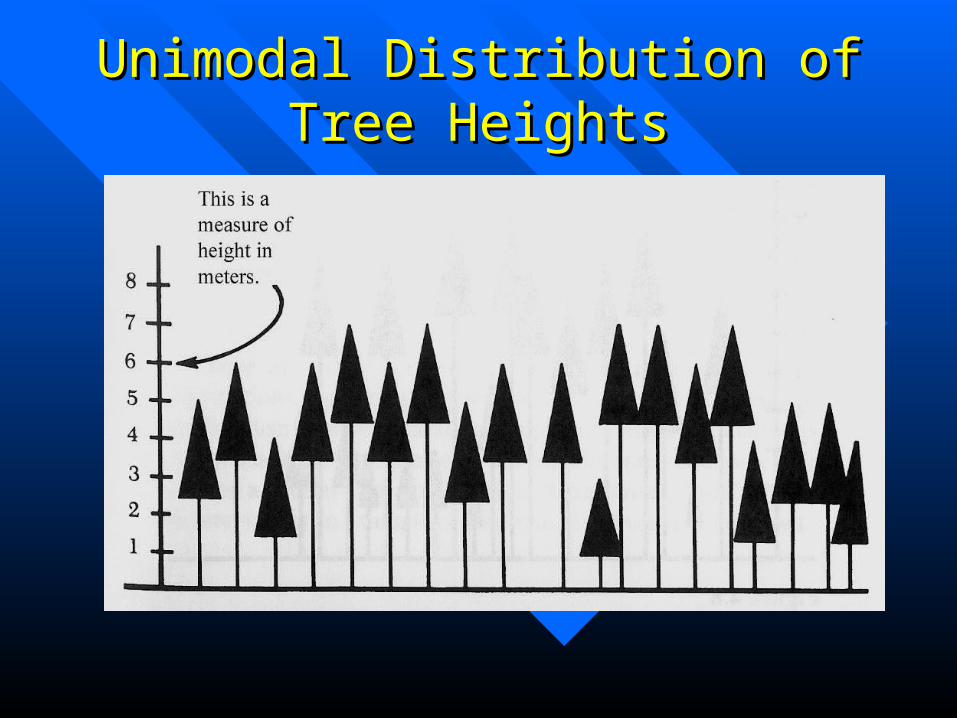
Unimodal Distribution of Tree Unimodal Distribution of Tree HeightsHeights
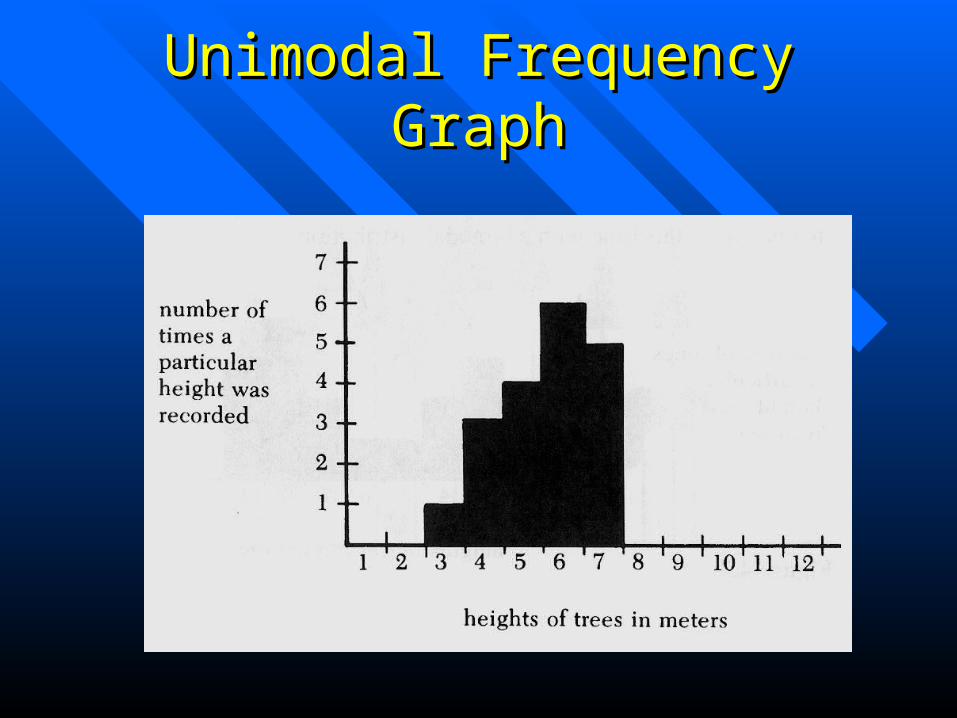
Unimodal Frequency GraphUnimodal Frequency Graph
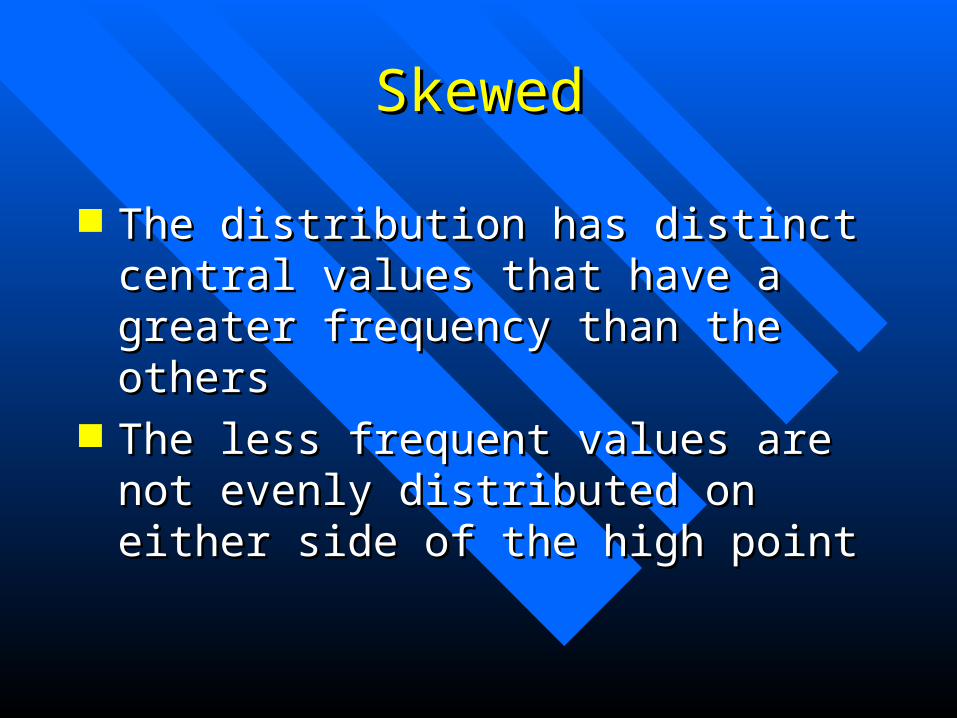
SkewedSkewed
The distribution has distinct central The distribution has distinct central values that have a greater frequency values that have a greater frequency than the othersthan the others
The less frequent values are not evenly The less frequent values are not evenly distributed on either side of the high distributed on either side of the high pointpoint

Skewed Distribution of Tree Skewed Distribution of Tree HeightsHeights
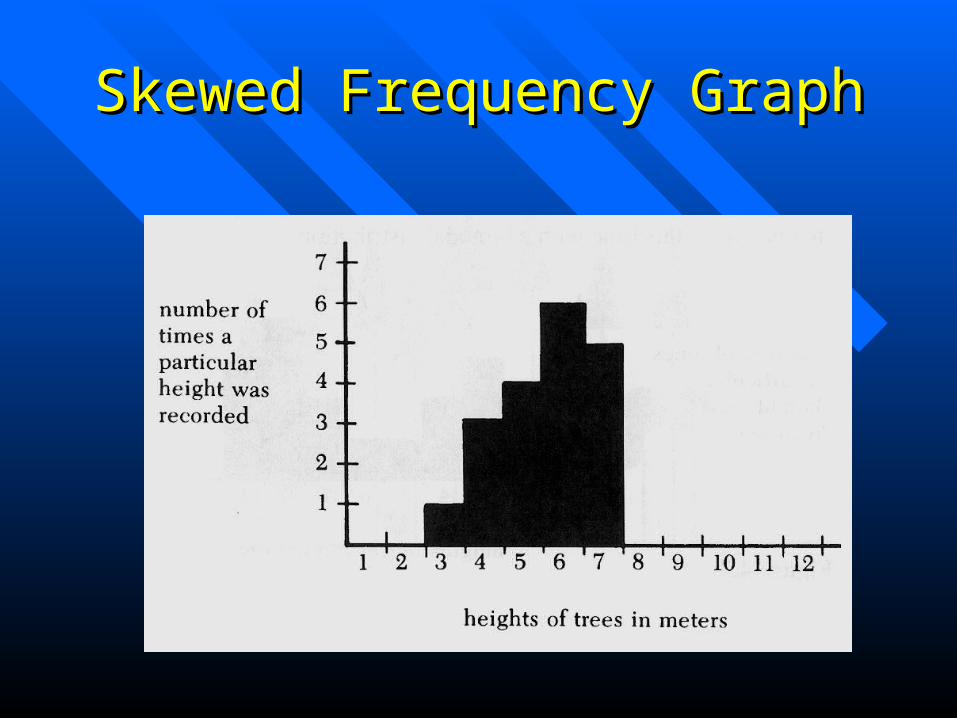
Skewed Frequency GraphSkewed Frequency Graph
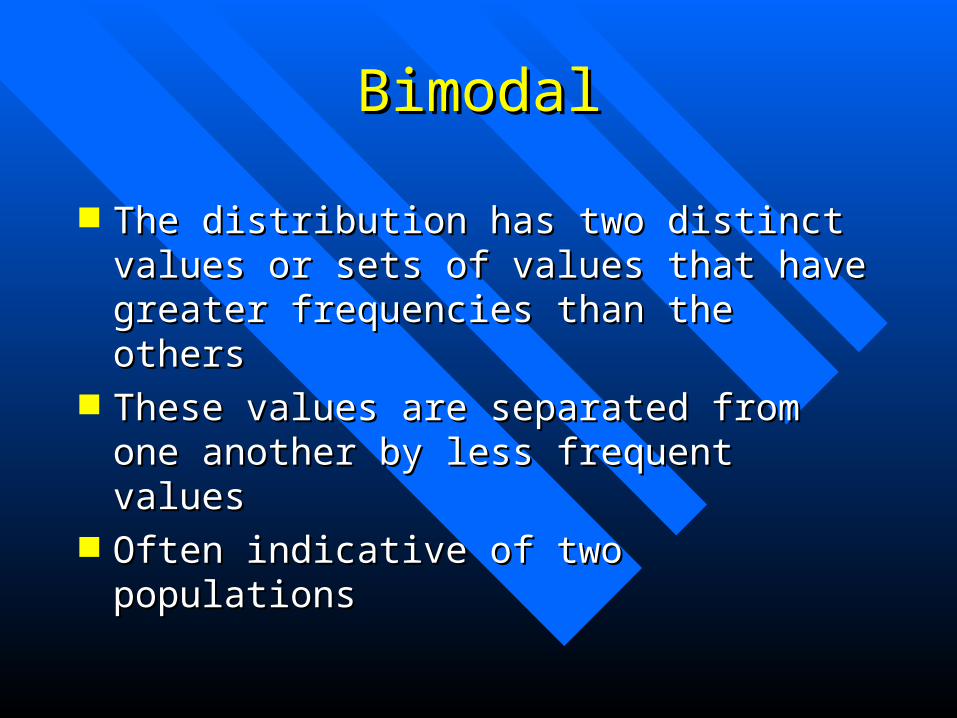
BimodalBimodal
The distribution has two distinct values The distribution has two distinct values or sets of values that have greater or sets of values that have greater frequencies than the others frequencies than the others
These values are separated from one These values are separated from one another by less frequent valuesanother by less frequent values
Often indicative of two populationsOften indicative of two populations
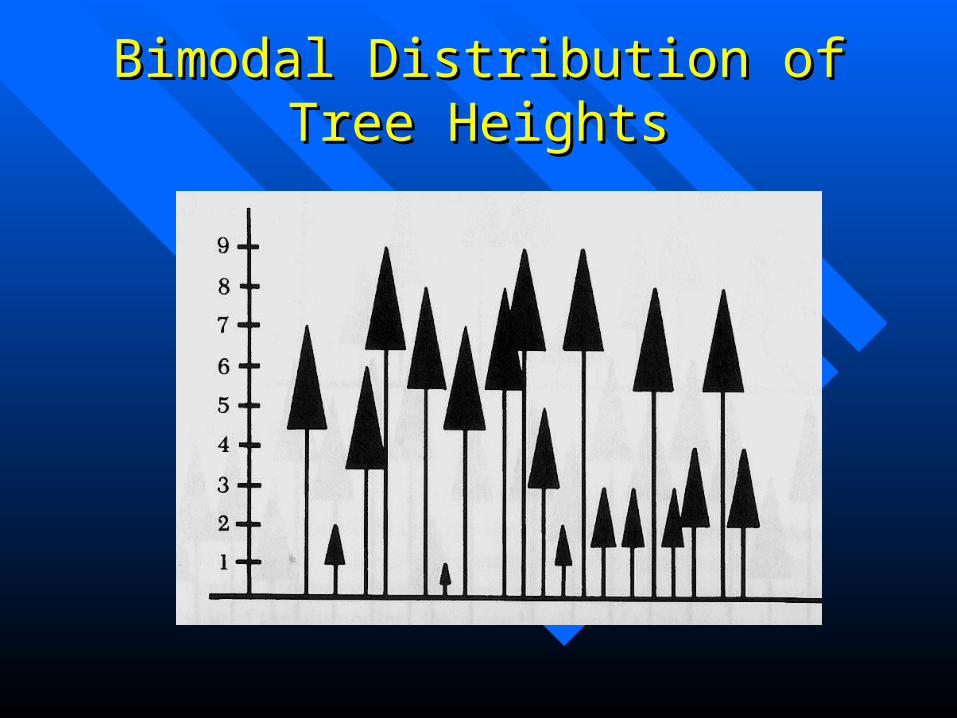
Bimodal Distribution of Tree Bimodal Distribution of Tree HeightsHeights

Bimodal Frequency GraphBimodal Frequency Graph
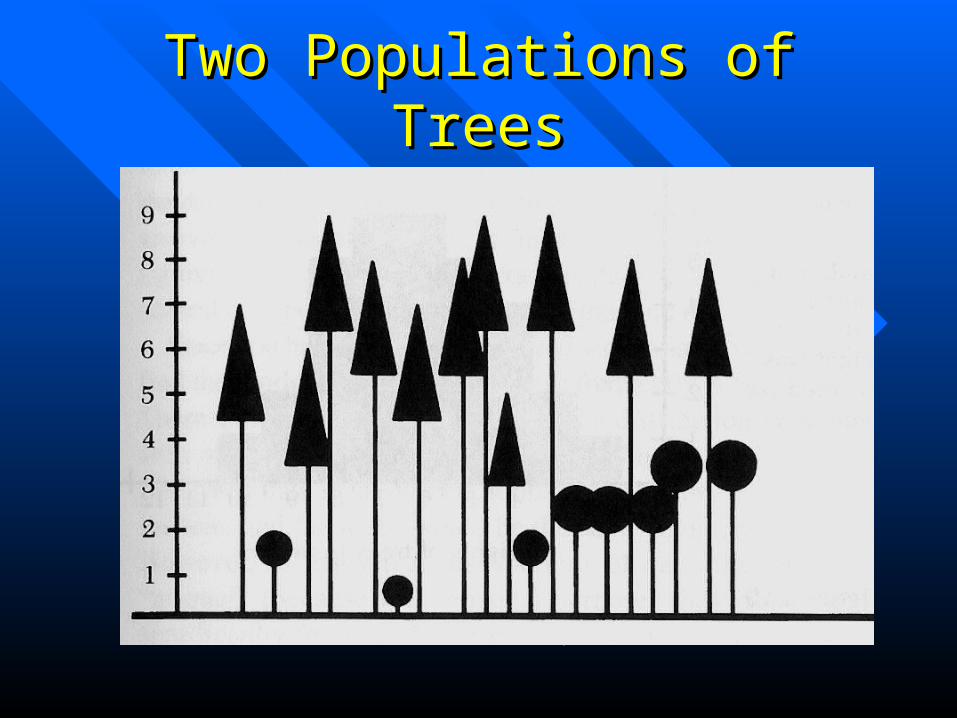
Two Populations of TreesTwo Populations of Trees
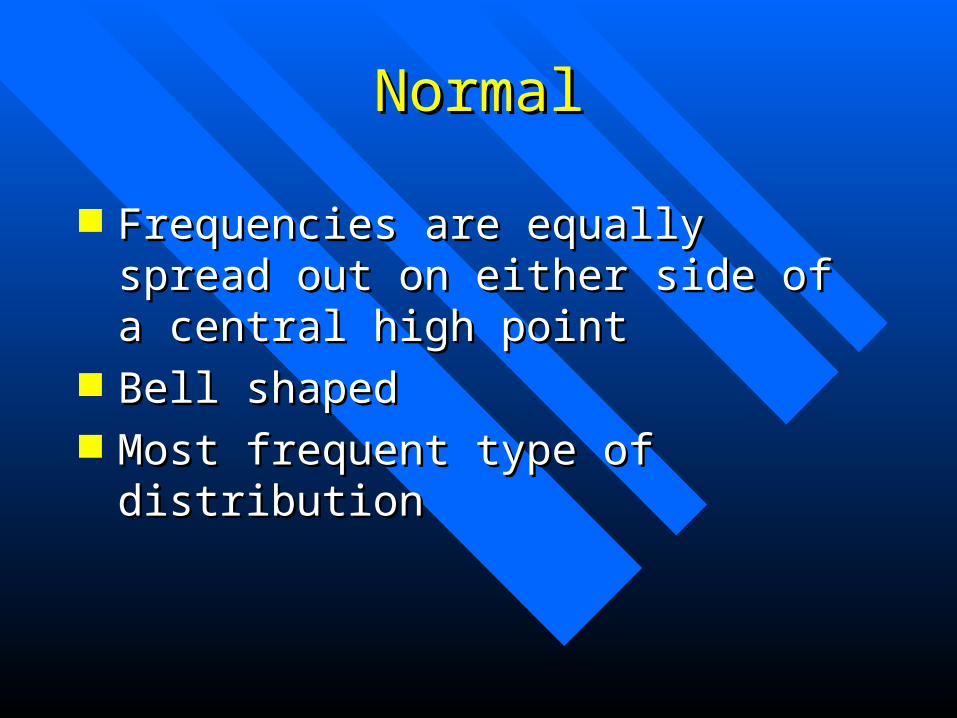
NormalNormal
Frequencies are equally spread out on Frequencies are equally spread out on either side of a central high pointeither side of a central high point
Bell shapedBell shaped Most frequent type of distributionMost frequent type of distribution
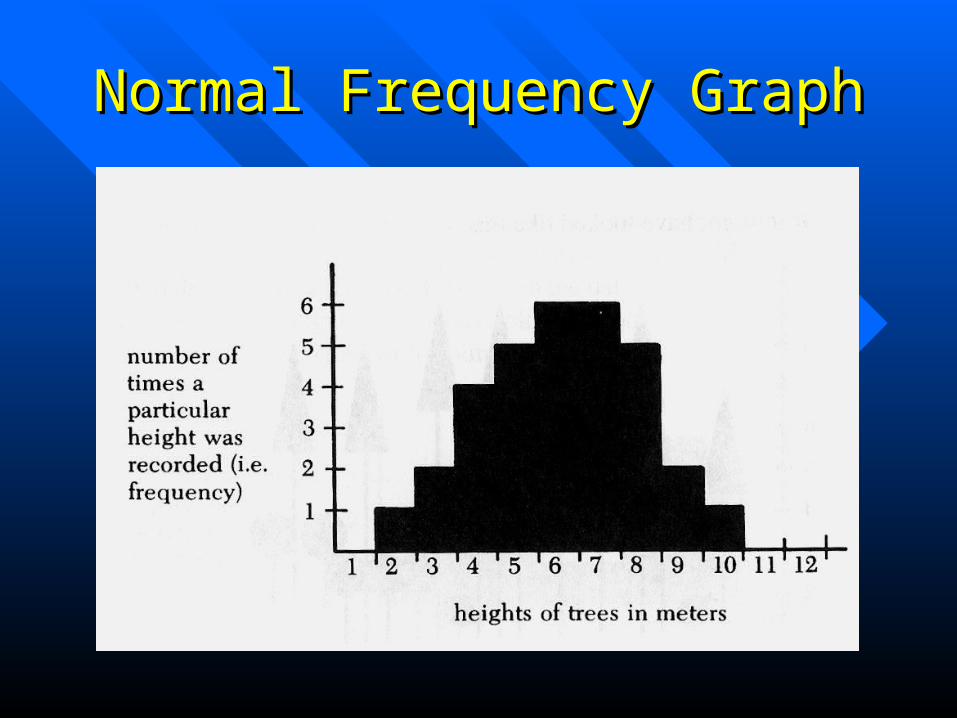
Normal Frequency GraphNormal Frequency Graph
Interpreting DataInterpreting Data
Descriptive statistics are used to Descriptive statistics are used to summarize datasummarize data
Several descriptive statistics are used Several descriptive statistics are used to describe two important aspects of to describe two important aspects of data distributions:data distributions:– Central TendencyCentral Tendency– DispersionDispersion
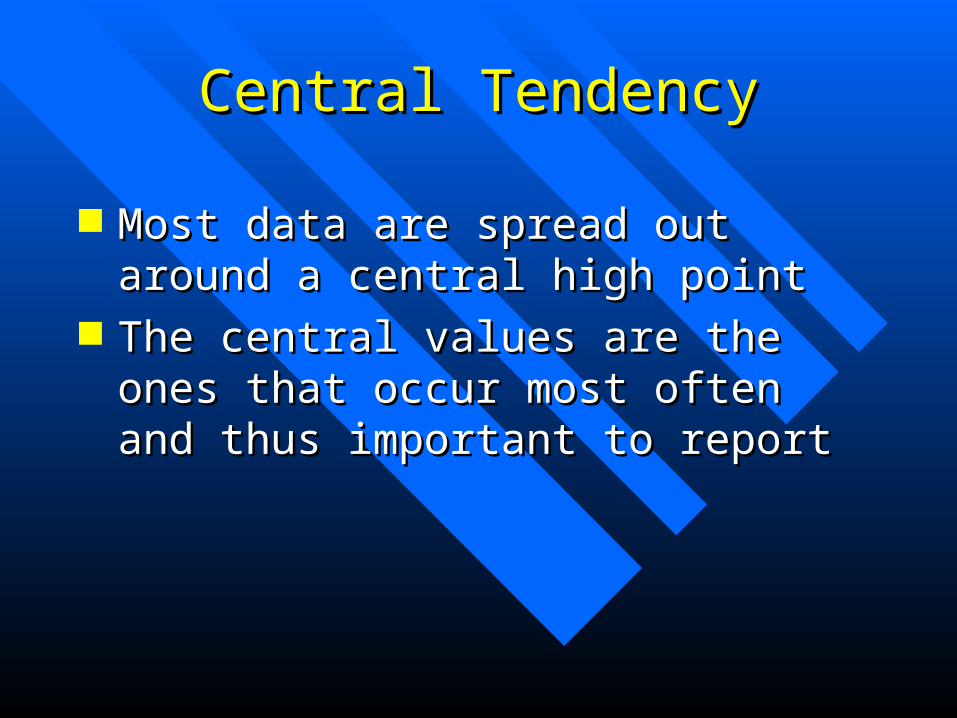
Central TendencyCentral Tendency
Most data are spread out around a Most data are spread out around a central high pointcentral high point
The central values are the ones that The central values are the ones that occur most often and thus important to occur most often and thus important to reportreport
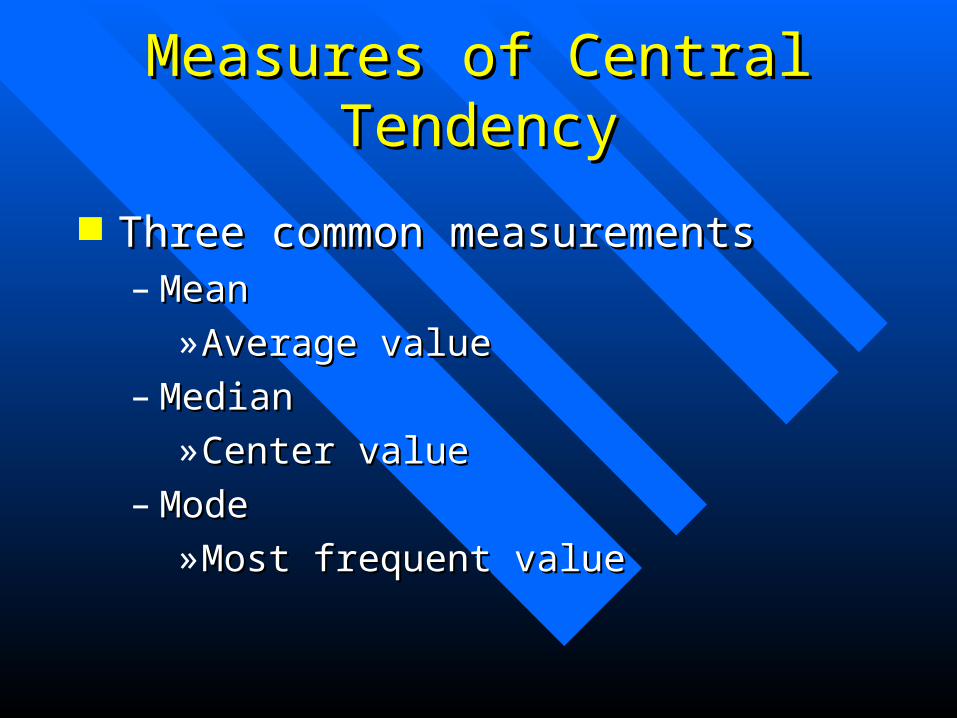
Measures of Central Measures of Central TendencyTendency
Three common measurements Three common measurements – MeanMean
»Average valueAverage value– MedianMedian
»Center valueCenter value– ModeMode
»Most frequent valueMost frequent value

MeanMean
““Typical Value”Typical Value”
NN
Mean = Mean = XXii
i=1i=1
NN
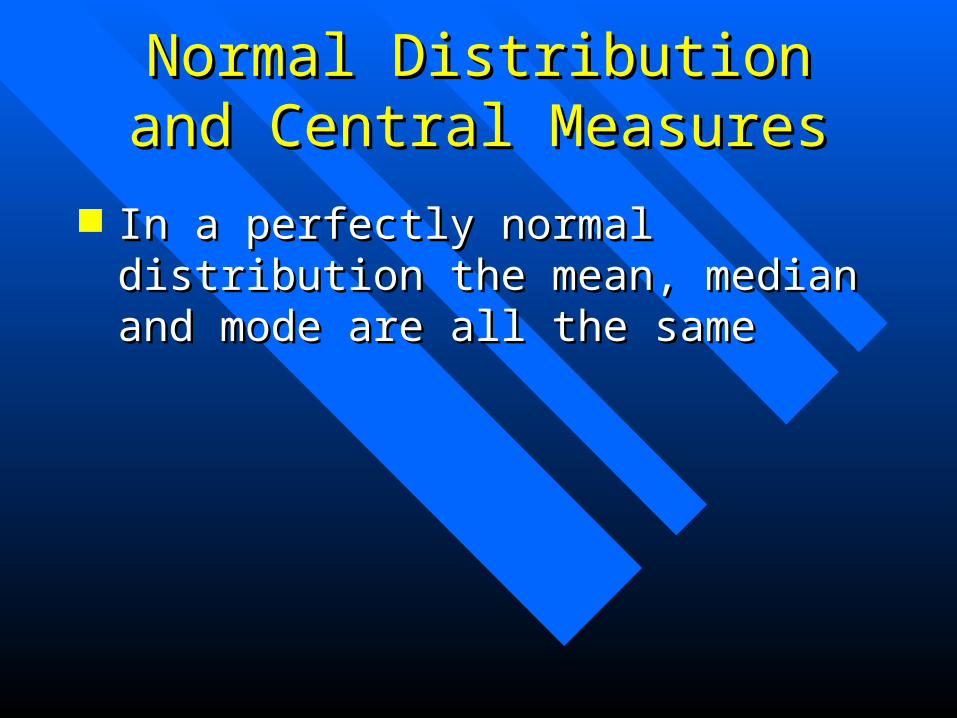
Normal Distribution and Normal Distribution and Central MeasuresCentral Measures
In a perfectly normal distribution the In a perfectly normal distribution the mean, median and mode are all the mean, median and mode are all the samesame

Perfectly Normal DistributionPerfectly Normal Distribution
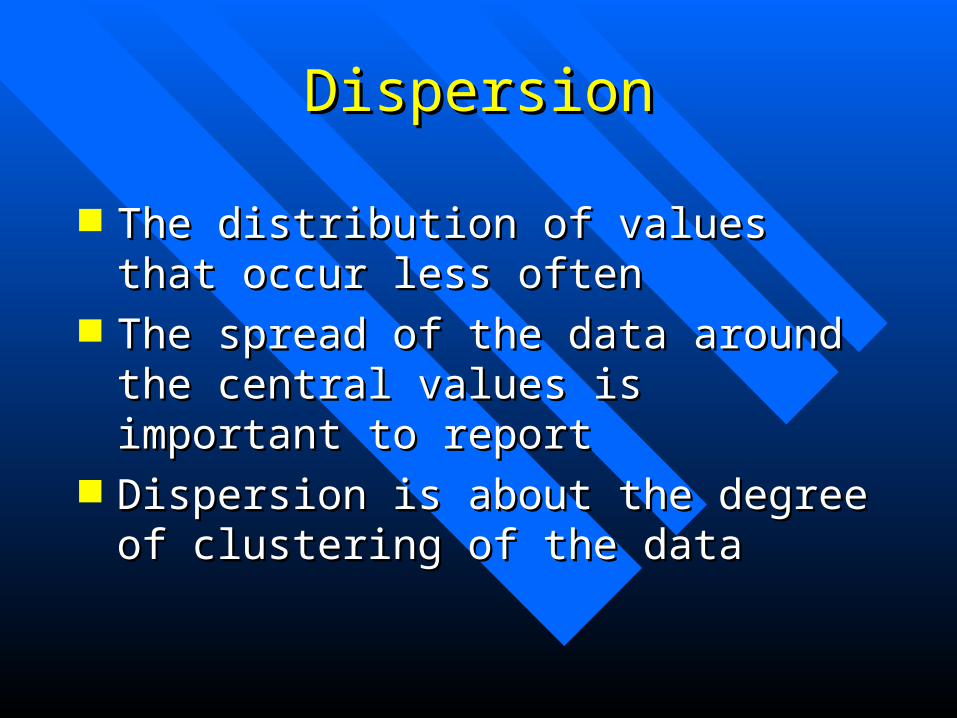
DispersionDispersion
The distribution of values that occur The distribution of values that occur less often less often
The spread of the data around the The spread of the data around the central values is important to reportcentral values is important to report
Dispersion is about the degree of Dispersion is about the degree of clustering of the dataclustering of the data
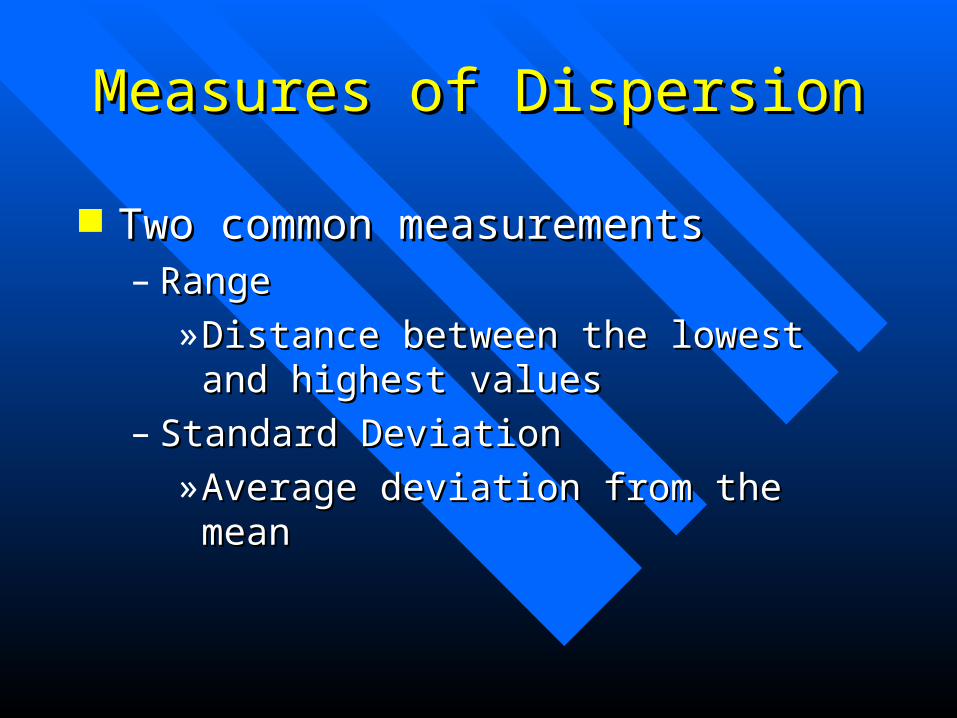
Measures of DispersionMeasures of Dispersion
Two common measurementsTwo common measurements– RangeRange
»Distance between the lowest and Distance between the lowest and highest valueshighest values
– Standard DeviationStandard Deviation»Average deviation from the meanAverage deviation from the mean
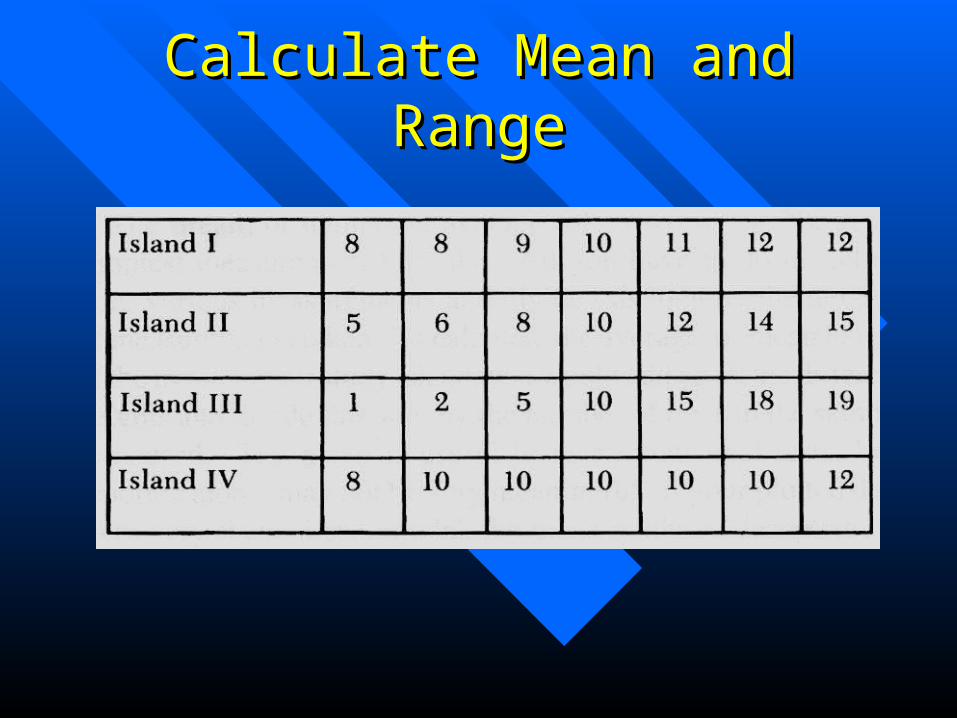
Calculate Mean and RangeCalculate Mean and Range
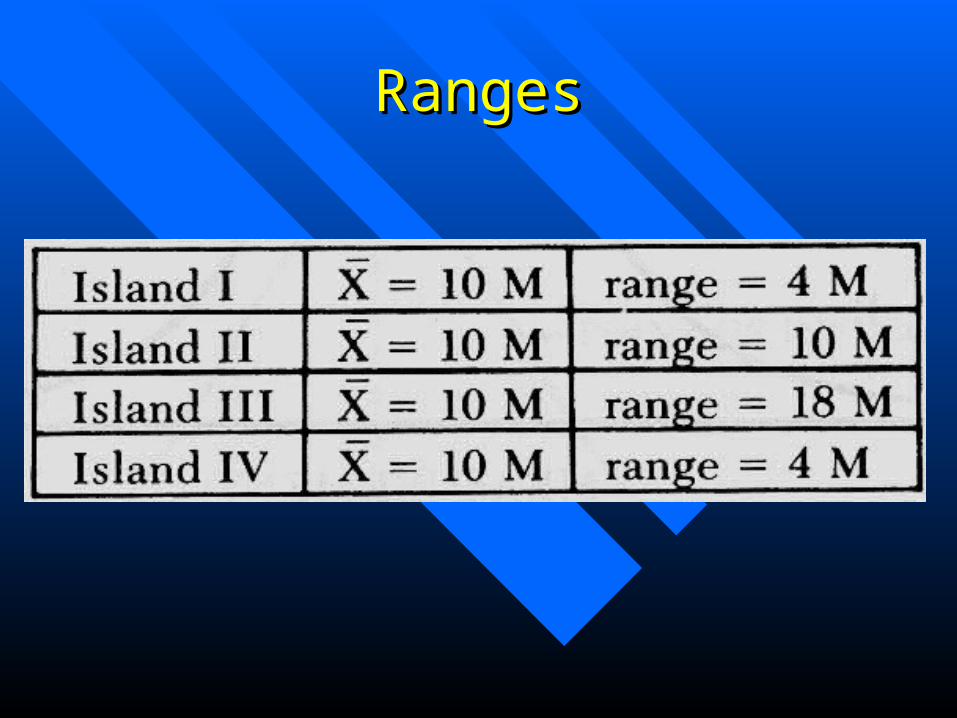
RangesRanges

Calculating Standard DeviationCalculating Standard Deviation

Normal Distribution and Normal Distribution and DispersionDispersion
68.26% of values fall within one 68.26% of values fall within one standard deviation on either side of the standard deviation on either side of the meanmean
95.44% of values fall within two 95.44% of values fall within two standard deviations on either side of the standard deviations on either side of the meanmean
99.74% of values fall within three 99.74% of values fall within three standard deviations on either side of the standard deviations on either side of the meanmean
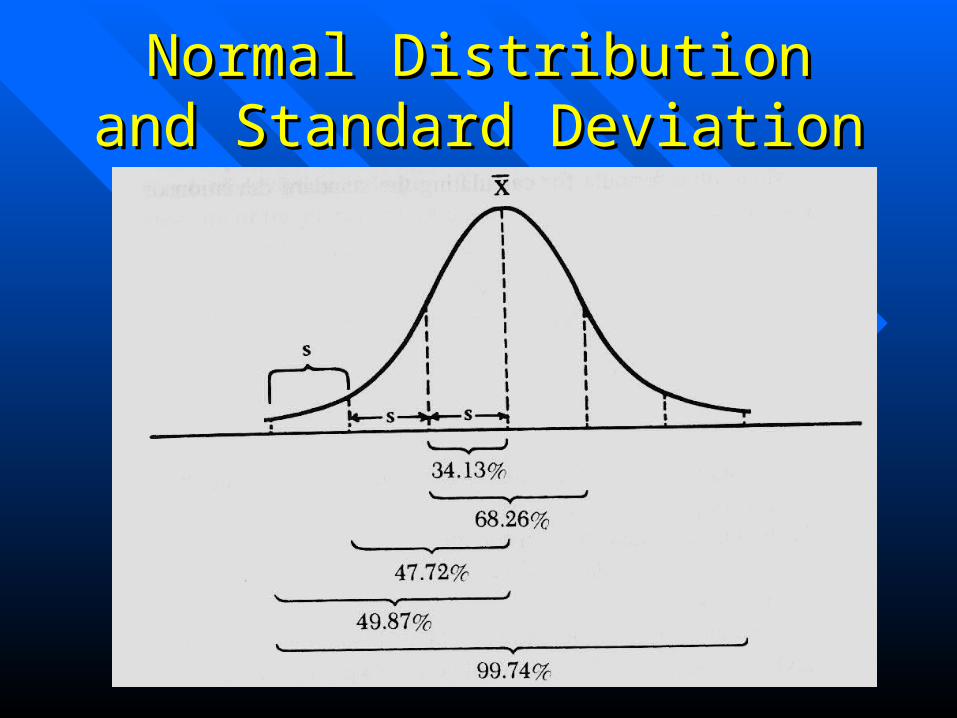
Normal Distribution and Normal Distribution and Standard DeviationStandard Deviation
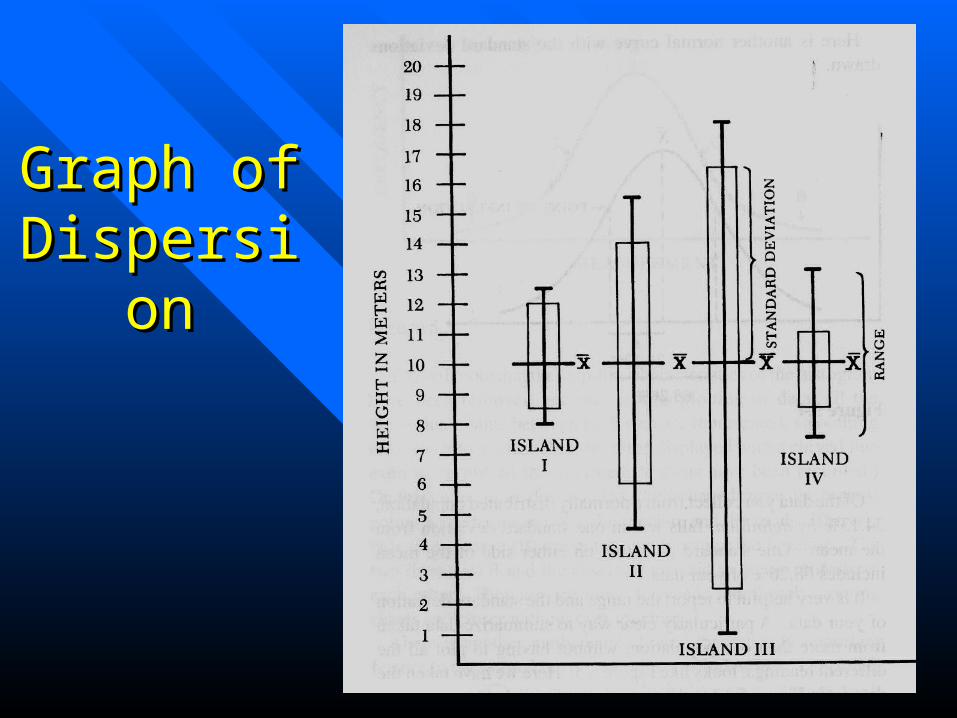
Graph of Graph of DispersionDispersion

Accuracy & PrecisionAccuracy & Precision
AccuracyAccuracy

ErrorError
Error = Accuracy of a particular data point Error = Accuracy of a particular data point relative to an accepted valuerelative to an accepted value
Absolute Error = Absolute Error = II Accepted – Data Accepted – Data II
Percent Error = Percent Error = II Accepted – Data Accepted – Data II x 100x 100
AcceptedAccepted
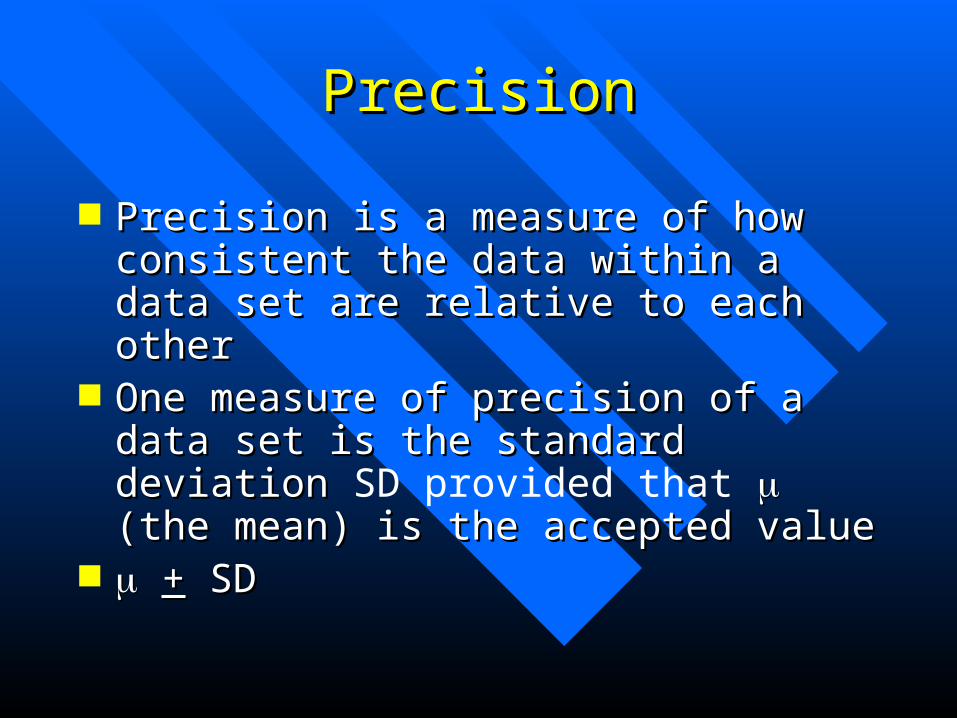
PrecisionPrecision
Precision is a measure of how Precision is a measure of how consistent the data within a data set are consistent the data within a data set are relative to each otherrelative to each other
One measure of precision of a data set One measure of precision of a data set is the standard deviation is the standard deviation SD provided that (the mean) is the accepted value (the mean) is the accepted value
++ SD SD

Calculation of SD of a Data Set Calculation of SD of a Data Set
NN
SD = SD = ––XXii
i=1i=1
N-1N-1