data input and transformation
TRANSCRIPT

APPLICATION OF REMOTE SENSING AND
GEOGRAPHICAL INFORMATION SYSTEM IN
CIVIL ENGINEERING
Date:
INSTRUCTORS
DR. MOHSIN SIDDIQUE
ASSIST. PROFESSOR
DEPARTMENT OF CIVIL ENGINEERING
Lecture
No
Description Seminar
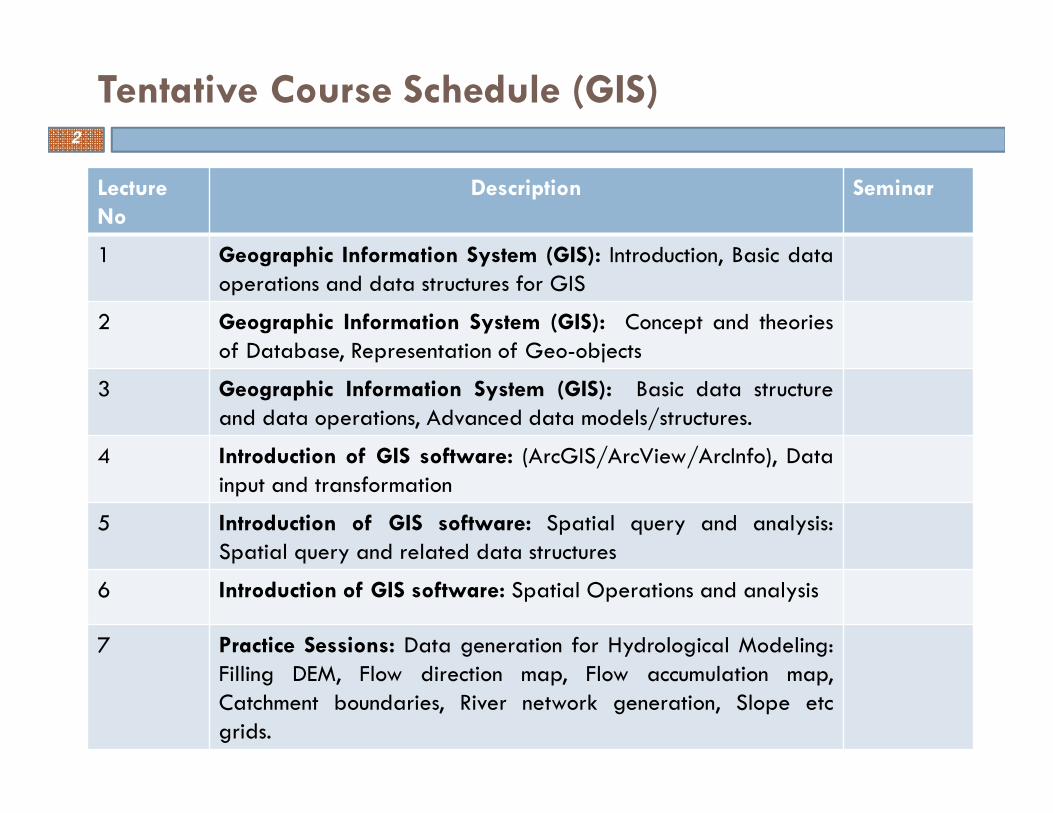
1 Geographic Information System (GIS): Introduction, Basic dataoperations and data structures for GIS
2 Geographic Information System (GIS): Concept and theoriesof Database, Representation of Geo-objects
3 Geographic Information System (GIS): Basic data structureand data operations, Advanced data models/structures.
4 Introduction of GIS software: (ArcGIS/ArcView/ArcInfo), Datainput and transformation
5 Introduction of GIS software: Spatial query and analysis:Spatial query and related data structures
6 Introduction of GIS software: Spatial Operations and analysis
7 Practice Sessions: Data generation for Hydrological Modeling:Filling DEM, Flow direction map, Flow accumulation map,Catchment boundaries, River network generation, Slope etcgrids.
Tentative Course Schedule (GIS)2
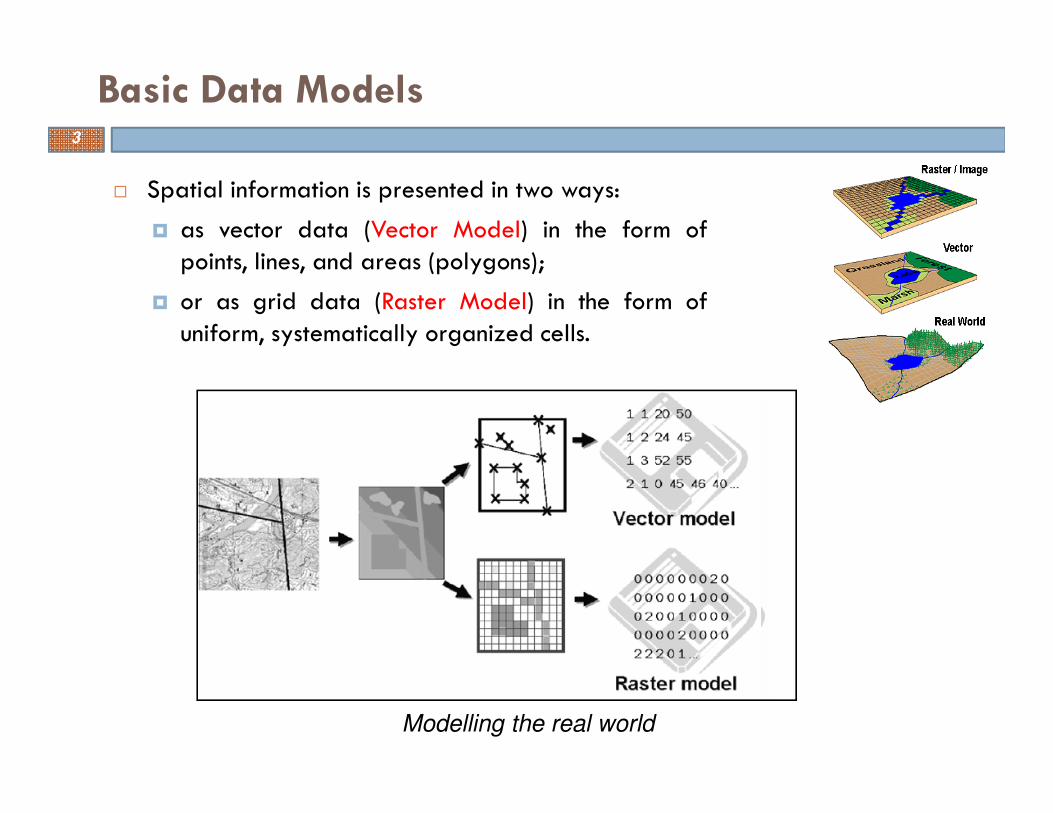
� Spatial information is presented in two ways:
� as vector data (Vector Model) in the form ofpoints, lines, and areas (polygons);
� or as grid data (Raster Model) in the form ofuniform, systematically organized cells.
Basic Data Models3
Modelling the real world

� The basis of the vector model is the assumption that the real world can bedivided into clearly defined elements where each element consists of anidentifiable object with its own geometry
� In principle, every point on a map and every point in the terrain it representsis uniquely located using two or three numbers in a coordinate system, such asin the northing, easting, and elevation Cartesian coordinate system
Vector Data model4
On maps, coordinate systems are
commonly displayed in grids with location
numbers along the map edges.
On the ground, coordinate systems are
imaginary, yet marked out by survey
control stations.
Data usually may be transformed from one
coordinate system to another
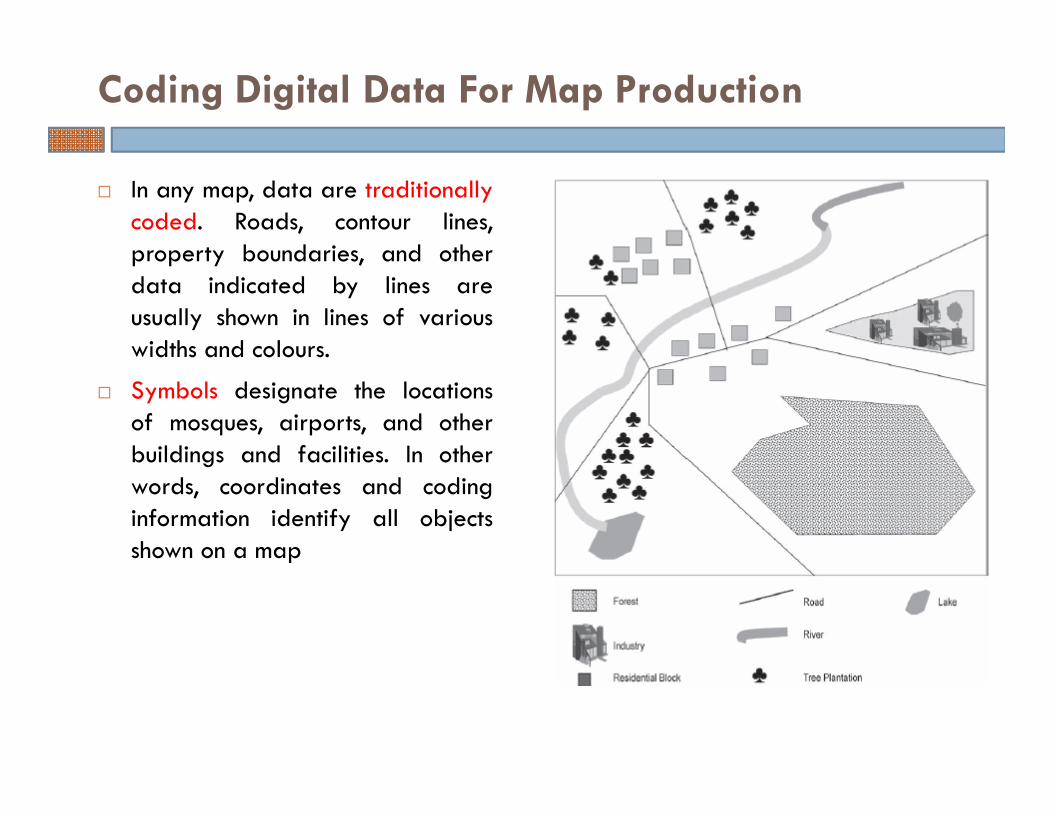
� In any map, data are traditionallycoded. Roads, contour lines,property boundaries, and otherdata indicated by lines areusually shown in lines of variouswidths and colours.
� Symbols designate the locationsof mosques, airports, and otherbuildings and facilities. In otherwords, coordinates and codinginformation identify all objectsshown on a map
Coding Digital Data For Map Production
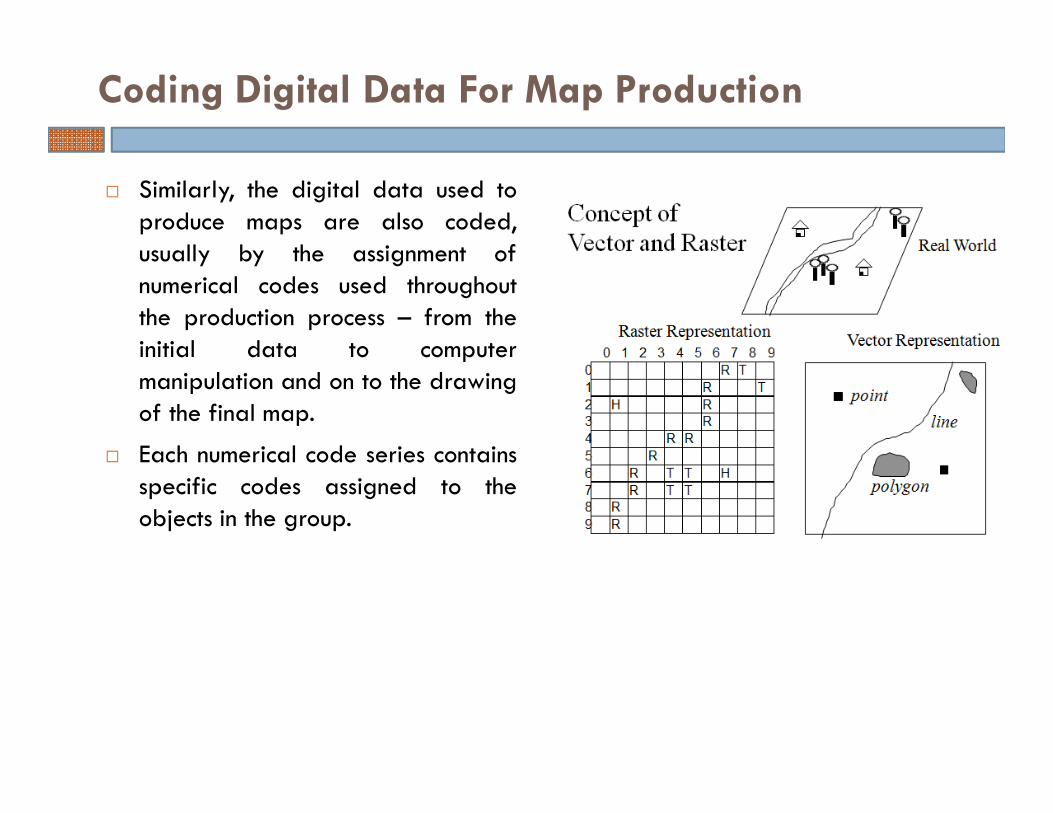
� Similarly, the digital data used toproduce maps are also coded,usually by the assignment ofnumerical codes used throughoutthe production process – from theinitial data to computermanipulation and on to the drawingof the final map.
� Each numerical code series containsspecific codes assigned to theobjects in the group.
Coding Digital Data For Map Production

� In thematic coding, data are divided into single-topic groups, such as allproperty boundaries. Information on symbol types, line widths, colours, and soon, may be appended to each thematic code, and various combinations ofthemes may be drawn.
� Data may be presented jointly in this way only if all objects are registered,using a common coordinate system.
Coding Digital Data For Map Production
Theme codes in the digital map data can be send to separate data
into thematic layers

� Point objects may easily be realized in a database because a given numberof attributes and coordinates is associated with each point
� Line and polygon objects are more difficult to realize in a database becauseof the variation in the number of points composing them
� Object spatial information and object attributes are often stored in differentdatabases to ease the manipulation of lines and areas, but in some systemsthey are stored together
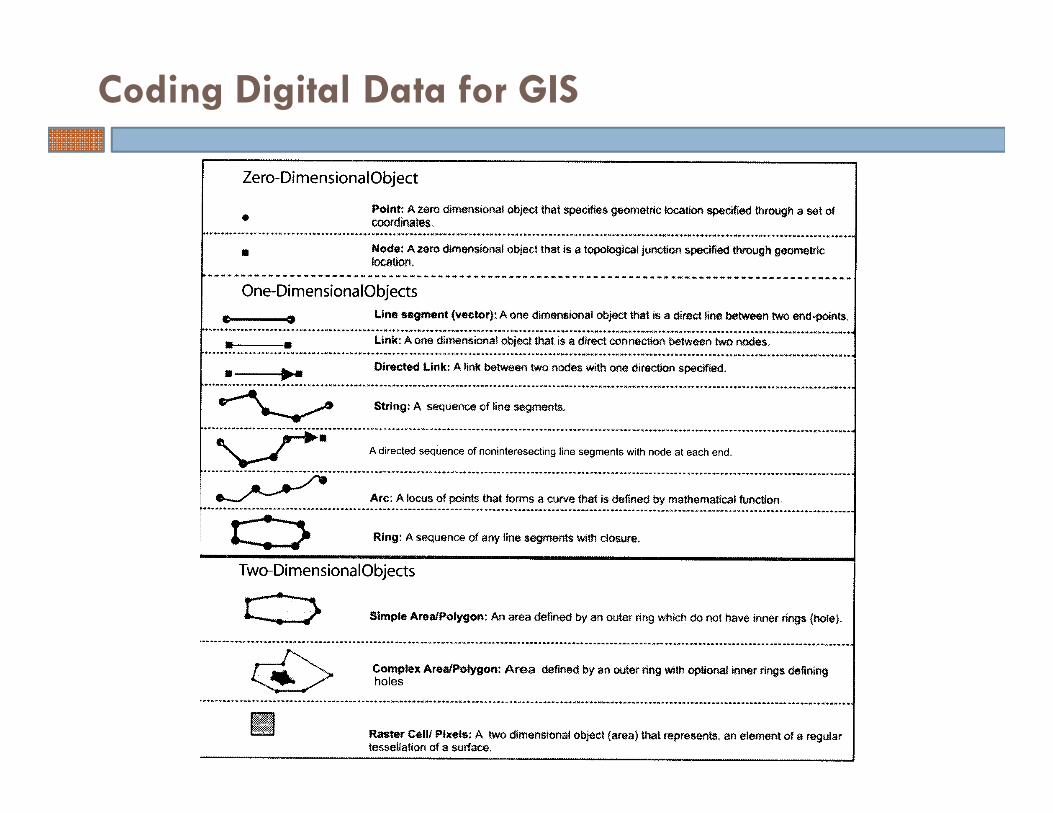
Coding Digital Data for GIS
Each object is assigned attributes and coordinates. The number of coordinates
for lines and polygons depends on the length or circumference of the object
Coding Digital Data for GIS

Coding Digital Data for GIS
Representation of geographic details,
point, line and area features

� Points and Lines
� The location information from these features is stored using location coordinates
Storing Vector Data
The vector data model is based around the storage of coordinate pairs
UTM (Universal Transverse Mercator) system gives a standard way of representing
positions for any feature

� Area boundary
� One way to store this area is by storingthe line which defines its boundary, asshown in Figure
� Other is using attributes as beingassociated with the interior of an arearather than its boundary. e.g., centroid ofarea
� It helps to add a label to the boundaryof an area
� The centroid is commonly used to give aposition for labels when drawing maps
� of area features and for this reasoncentroids are normally positioned near thecentre of the area
Storing Vector Data
Storage of area feature.

Storing Vector Data
Drawing instructions are designated in look-up tables. Thematic
code values or attribute values are input values in the tables, while
output values can be symbol types, colours, line thickness etc

� Spaghetti data is a term used to describe digital map data with crossing lines,loose ends, double digitization of common boundaries between adjacentpolygons, etc. These data lie in a pile, just like spaghetti.
� Spaghetti data are a collection of points and line segments with no realconnection and several line segments are found at odd places in the data file.
Spaghetti Model
There are no specific points thatdesignate where lines might cross, nor arethere any details of logical relationshipsbetween objectsPolygons are represented by theircircumscribing boundaries, as a string ofcoordinates so that common boundariesbetween adjacent polygons areregistered twiceThe lines of data are unlinked and together are a confusion of crossings
Drawback of this model is that both data storage and data searches are sequential. Hence
search times are often unduly long for such routine operations as finding commonality
between two polygons

15
Common Vector Data Structures
� Whole Polygon Structure
� Dual Independent Map Encoding
� Arc-Node Structure
� Relational Structure
� Digital Line Graph
To
po
log
y M
od
el

� Each layer in the database is dissolved in number of polygons
� Each polygon is encoded as sequence of locations (points) that define theboundaries of each closed area.
� Each polygon is stored as a separate entity
� No explicit mean to define neighborhood
� Attributes of each polygon can be stored with the list of the coordinates usingTOPOLOGY Model.
� Several points that are shared by the polygons are repeated, as suchenhancing the redundancy in data storage
Whole Polygon Structure (Storing Area Boundaries)

� Topology deals with geometric properties which remain invariable undercertain transformations, such as stretching or bending.
� The topology model is one in which the connections and relationships betweenobjects are described independent of their coordinates; their topologyremains fixed as geometry is stretched and bent.
� Hence, the topology model overcomes the major weakness of the spaghettimodel, which lacks the relationships requisite to many GIS manipulations andpresentations.
� Topological information permits automatic verification of data consistency to detect such errors as the incomplete closing of polygons during the encoding process
Topology Model – Connections and Relationships between Object

� Unique identities are assigned to alllinks, nodes, and polygons, and attributedata describing connections areassociated with all identities. Topologycan therefore be described in threetables
� i. The polygon topology table lists thelinks comprising all polygons, each ofwhich is identified by a number.
� ii. The node topology table lists the linksthat meet at each node.
� iii. The link topology table lists thenodes on which each link terminates andthe polygons on the right and left ofeach link, with right and left defined inthe direction from a designated startnode to a finish node. The systemcreates these tables automatically.
Topology Model

� i. The computational time required to identify all nodes may be relativelylong.
� ii. Uncertainties and errors may easily arise in connection with the closing ofpolygons and formation of nodes in complex networks (such as in roadinterchanges). Operators must solve such problems.
� iii. When new data are entered and existing data updated, new nodes mustbe computed and the topology tables brought up to date.
� iv. Topological data may require a longer plotting time than spaghetti databecause of the separation of lines into nodes and links.
� However, the overall advantages of the topology model over the spaghettimodel make it the prime choice in most GISs
� Today, efficient software and faster computers enable topology to beestablished on-the-fly; thus the disadvantages of topological data ascompared to spaghetti data have become less important
Drawbacks of Topology Model
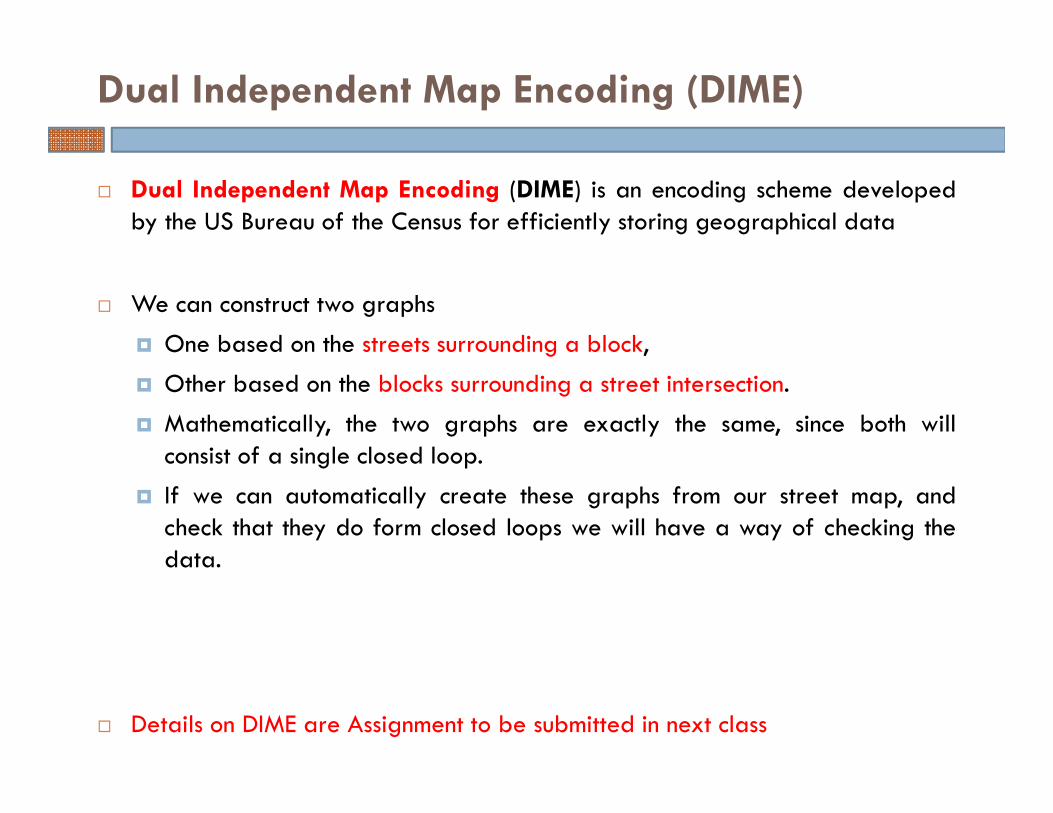
� Dual Independent Map Encoding (DIME) is an encoding scheme developedby the US Bureau of the Census for efficiently storing geographical data
� We can construct two graphs
� One based on the streets surrounding a block,
� Other based on the blocks surrounding a street intersection.
� Mathematically, the two graphs are exactly the same, since both willconsist of a single closed loop.
� If we can automatically create these graphs from our street map, andcheck that they do form closed loops we will have a way of checking thedata.
� Details on DIME are Assignment to be submitted in next class
Dual Independent Map Encoding (DIME)
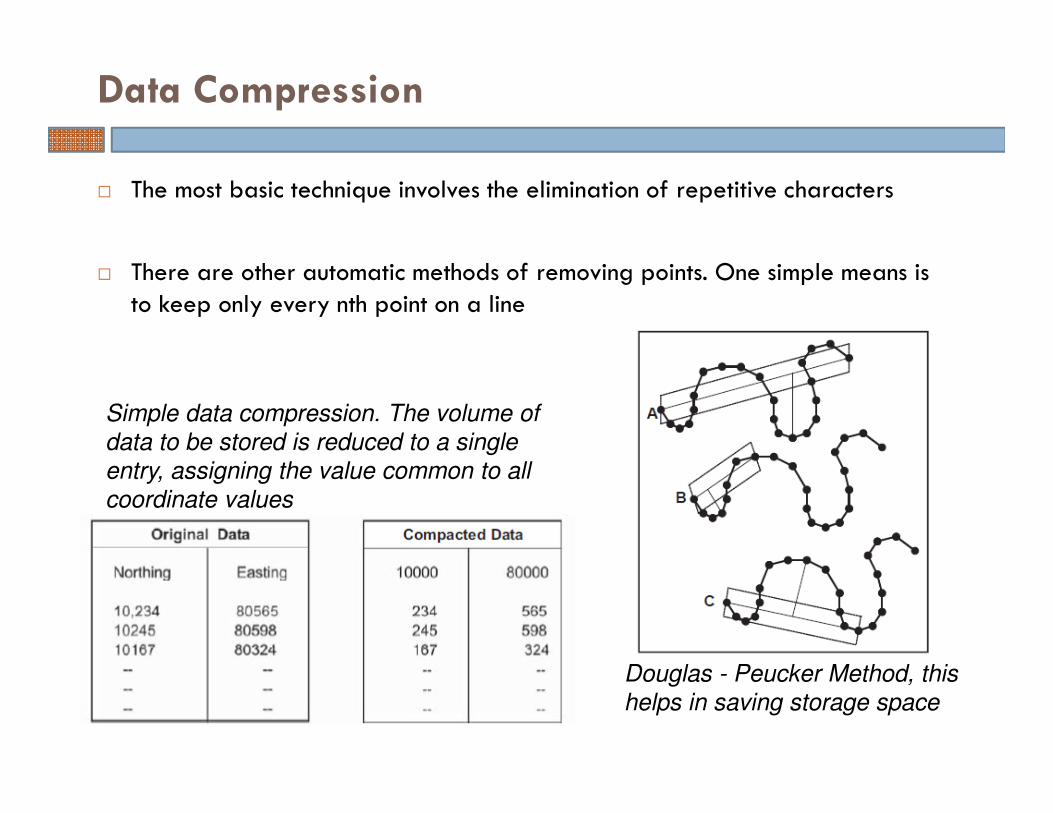
Data Compression
Simple data compression. The volume of
data to be stored is reduced to a single
entry, assigning the value common to all
coordinate values
Douglas - Peucker Method, this
helps in saving storage space
� The most basic technique involves the elimination of repetitive characters
� There are other automatic methods of removing points. One simple means is to keep only every nth point on a line

� The raster model (also termed as grid model)represents reality throughselected surfaces arranged in a regular pattern
� Reality is thus generalized in terms of uniform, regular cells, which are usuallyrectangular or square but may be triangular or hexagonal
Raster Data Model22
The cells of a model are given in asequence determined by a hierarchy ofrows and columns in a matrix, withnumbering usually starting from theupper left comerThe geometric location of a cell, andhence of the object it represents, isstated in terms of its row and columnnumbers.This identification corresponds to thedirectional coordinates of the vectormodel.

Raster Data Structures: Tesselations
� Square grid: equal length sides
� conceptually simplest
� cells can be recursively divided into cells of same shape
� 4-connected neighborhood (above, below, left, right) (rook’s case)
� all neighboring cells are equidistant
� 8-connected neighborhood (also include diagonals) (queen’s case)
� all neighboring cells notequidistant
� center of cells on diagonal is 1.41 units away (square root of 2)
� rectangular
� commonly occurs for lat/long when projected
� data collected at 1degree by 1 degree will be varying sized rectangles
� triangular (3-sided) and hexagonal (6-sided)
� all adjacent cells and points are equidistant
� triangulated irregular network
(tin):
� vector model used to represent continuous surfaces (elevation)
� more later under vector

� Using a raster GIS we could store a set of spatial data in the form of a gridof pixels. Each pixel will hold a value which relates to some feature ofinterest at that point in space.
� These values are normally one of three possible types.
� I. Binary – A value which indicates the presence or absence of a feature ofinterest. For example, in a layer representing roads, we might use 1 forpixels which contained part of road, and 0 for pixels which did not.
� II. Enumeration – A value from some classification. For example, a layerrepresenting soils might contain codes representing the different soil types–1for alluvial, 2 for red soil etc.
� III. Numerical – An integer or floating point number recording the value of ageographical phenomenon. In the soil example, we might have measurementsof soil moisture content.
Storing Raster Data Structures

Storing Raster Data Structures
Only one attribute value is assigned to each cell. Objects that have several attributes are therefore represented with a number of raster layers, one for each attribute.

� The raster data model has the great virtue of simplicity but it can produce very large files. The precision with which, 1 raster layer can represent spatial data is related to the size of the pixel – we cannot represent anything which is smaller than a pixel
� The simplest method of storing a raster layer in the memory of the computer is using a data structure called an array.
� All programming languages have a structure called an array, which can be used to store and access lists of items
Raster Data Structure: The Array
An example of simple raster array

� Even with modern computers with enormous amounts of disk space andmemory, it still makes sense to reduce data sizes for a number of reasons.
� First, the transfer of data from disk to memory is considerably slower than thespeed with which the same information can be processed once it is held inmemory – therefore smaller files means quicker execution times.
� Second, the smaller the file size, the more images can be held in memory atone time.
� Data Compression Techniques� Run Length Encoding
� Chain Encoding
� Black Code
� Regional Quad Tree
Compression of Raster Data
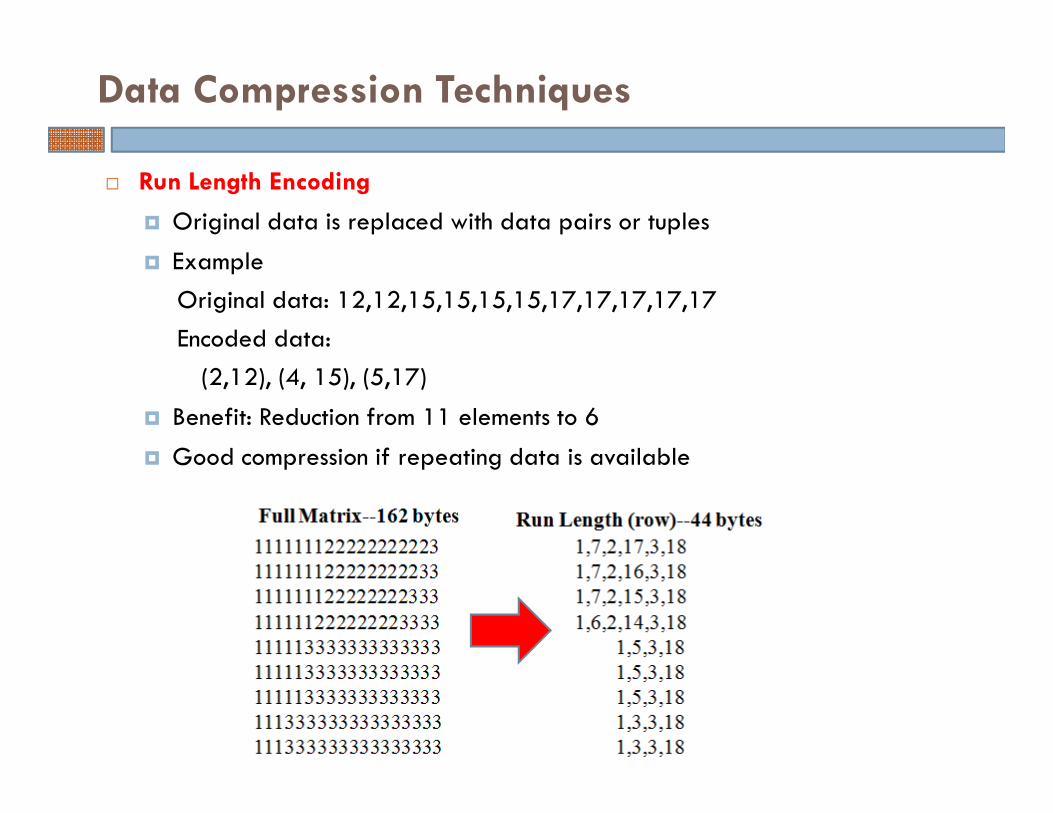
Data Compression Techniques
� Run Length Encoding
� Original data is replaced with data pairs or tuples
� Example
Original data: 12,12,15,15,15,15,17,17,17,17,17
Encoded data:
(2,12), (4, 15), (5,17)
� Benefit: Reduction from 11 elements to 6
� Good compression if repeating data is available
Data Compression Techniques
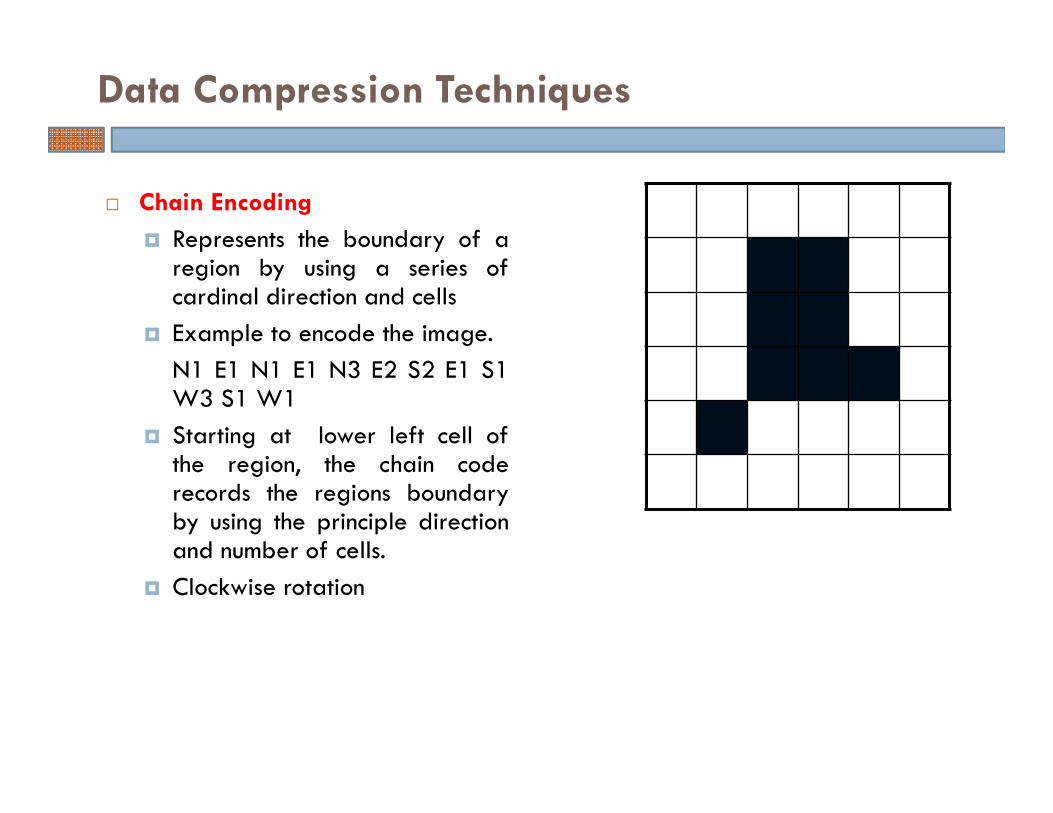
� Chain Encoding
� Represents the boundary of aregion by using a series ofcardinal direction and cells
� Example to encode the image.
N1 E1 N1 E1 N3 E2 S2 E1 S1W3 S1 W1
� Starting at lower left cell ofthe region, the chain coderecords the regions boundaryby using the principle directionand number of cells.
� Clockwise rotation

Data Compression Techniques
� Block Code� Represents the boundary of a region by using square blocks
Example to encode the image.
One four square (1,2)
Four One square (3,2;3,3; 3,4; 4,1)
� Specify how many square blocks are there
� And specify the upper left corner of each square block
(0,0)
(6,0)
(0,6)
(6,6)
Data Compression Techniques
31
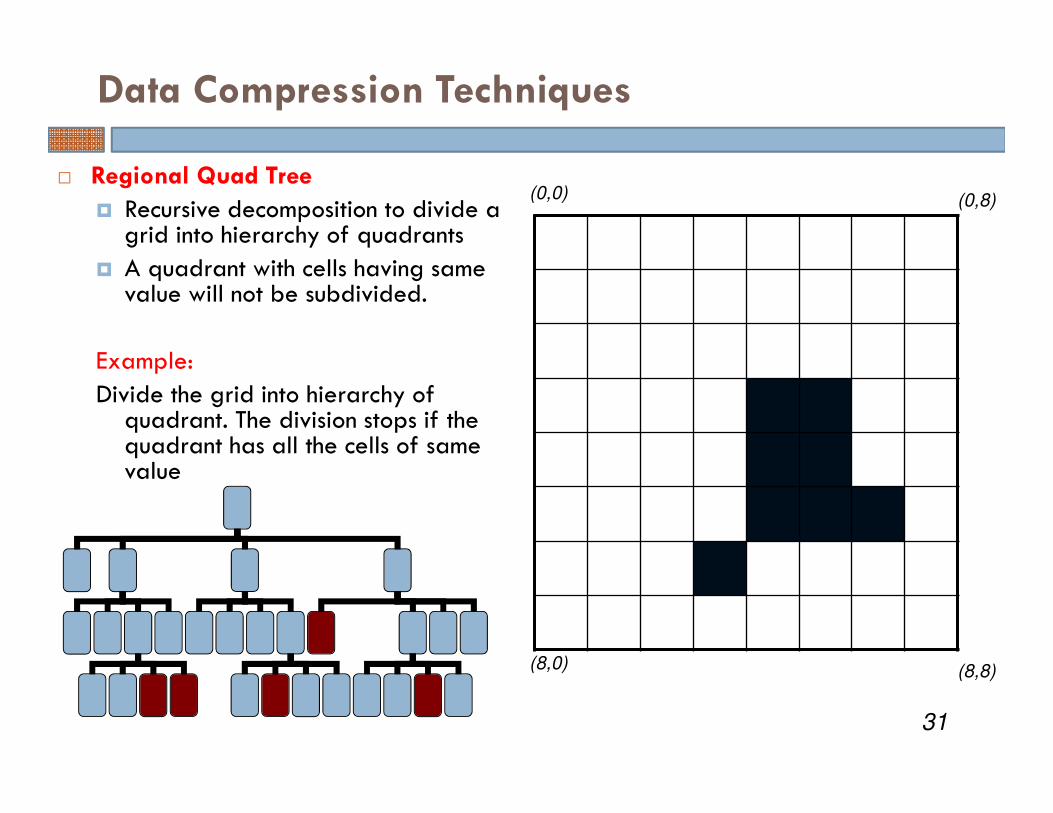
� Regional Quad Tree
� Recursive decomposition to divide a grid into hierarchy of quadrants
� A quadrant with cells having same value will not be subdivided.
Example:
Divide the grid into hierarchy of quadrant. The division stops if the quadrant has all the cells of same value
(0,0)
(8,0)
(0,8)
(8,8)

32
� Grass and IDRISI use Run Length Encoding (RLE)
� SPANS uses a Quad Tree Structure
� ARC/Info grids uses a Hierarchical Tile Block Cell Data Structure
� Each grid is divided into a number of tiles
� Tiles are divided into series of rectangular blocks
� Blocks are divided into cells if required.
Data Compression Techniques
33
Other Techniques of Compression
� Tagged Image File Format (Tiff), (Graphics Interchange Format ) GIF can compress data without loosing info
� Joint Photographic Experts Group (JPEG) however can compress more but loose some info
� MrSid (Multi-resolution Seamless Image) is a techniques which stores image at different resolution within image. Encoding of high detail parts of the image are done with high resolution and other at low resolution.
� Good compression w/o loosing info
Assignment: One page about types of Image file formatsYou may use Wikipedia as reference
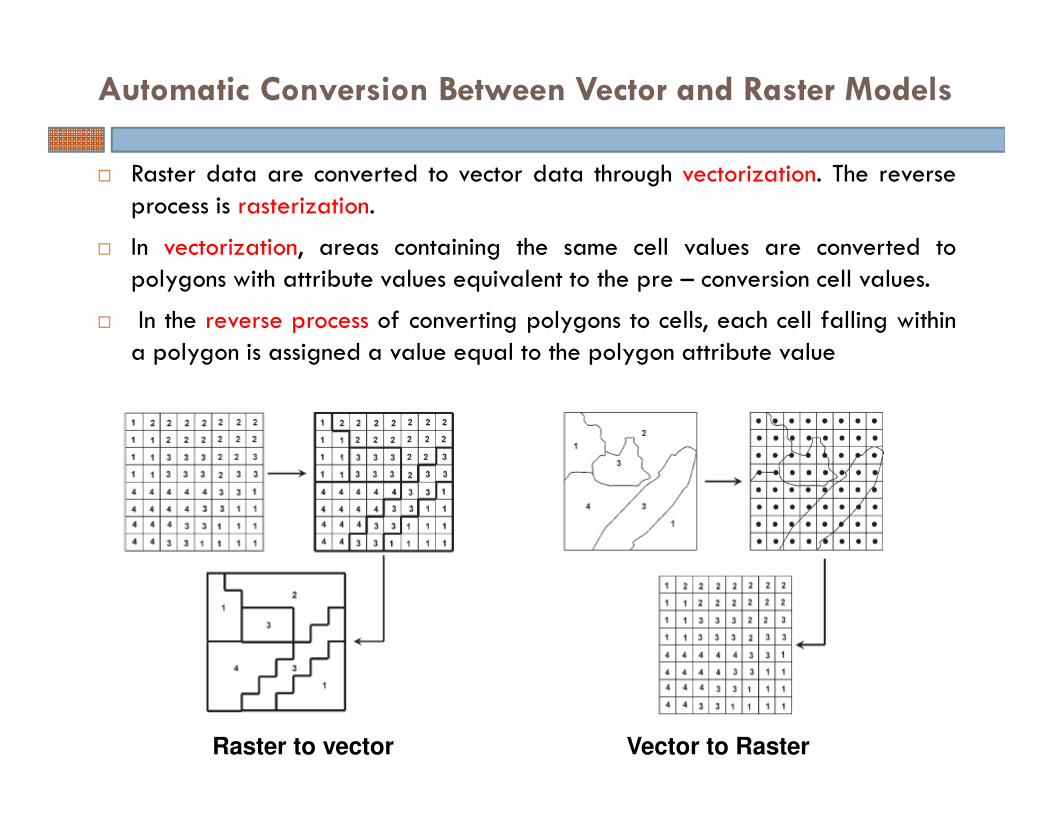
� Raster data are converted to vector data through vectorization. The reverseprocess is rasterization.
� In vectorization, areas containing the same cell values are converted topolygons with attribute values equivalent to the pre – conversion cell values.
� In the reverse process of converting polygons to cells, each cell falling withina polygon is assigned a value equal to the polygon attribute value
Automatic Conversion Between Vector and Raster Models
Raster to vector Vector to Raster

Advance Data Models/Structure

� The models (basic data models) discussed in the previous slide/lecture describe limited parts of two-dimensional real world
� Several other data models used in GIS can extend the real world to include the terrain surface, the time factor, and movable objects
� The digital representation of a terrain surface is called a digital elevation model (DEM)
� DEMs may be subdivided into:
� Digital surface models (DSM) that contain elevation information about allfeatures in the landscape, such as vegetation, buildings, and otherstructures;
� Digital terrain models (DTM) that contain elevation information about thebare-Earth surface without the influence of vegetation or man-madestructures.
Surface Representation

Digital Elevation Models37

� DTMs comprise various arrangements of individual points in x , y & zcoordinates
� the term 2.5 – dimensional is often used to describe the DTM dimension inwhich height (Z-coordinate is specified as attribute) and handle only one zvalue for each point
� In 3-dimensional elevation model, elevation is an integral part of position (x,y, z) and the model can handle several z values for the same x, y pair
� Thus 3D DEM can handle different geological layers, roof heights on buildings,roads that cross each other, together with the terrain surface.
Digital Elevation Models

� The z value of a new point is calculated by interpolation from the z value to the closest existing points.
� If the points are stored in an unstructured way, all registered points will have to be searched to be able to calculate the z values to a new point. This can be very time consuming even for a powerful computer.
� It is therefore usual to use data structures which also describe the contiguity between the points. This is achieved by using data structures based on
� single points in a raster (grid) or
� triangles covering a surface (e.g., TIN)
Digital Elevation Models

� A systematic grid, or raster, of spot heights at fixed mutual spaces is often used to describe terrain
Grid Model
Elevation data are acquired through (A) Mass points (lattices) (B) Contour lines (C)
GRIDs (interpolated from points or lines; or created currently from digital imagery)
� Elevation is assumed constant within each cell of the grid, so small cells detailterrain more accurately than large cells.
� The size of cells is constant in a model, so areas with a greater variation ofterrain may be described less accurately than those with less variation
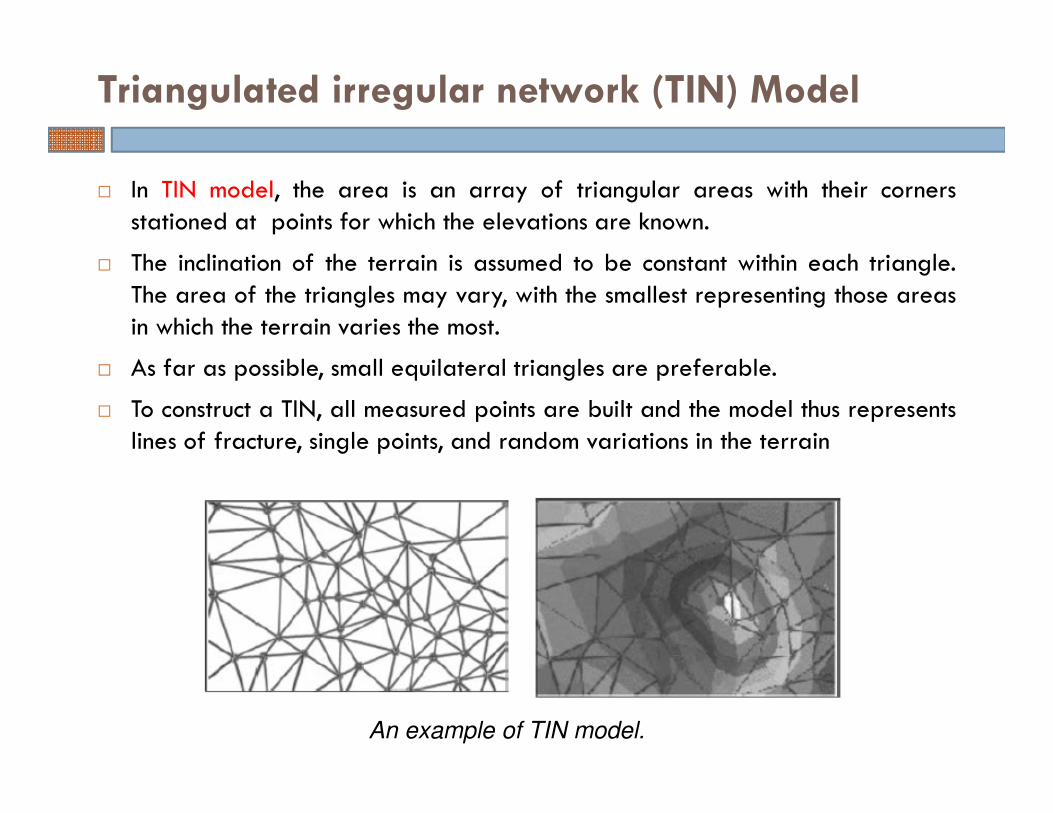
� In TIN model, the area is an array of triangular areas with their cornersstationed at points for which the elevations are known.
� The inclination of the terrain is assumed to be constant within each triangle.The area of the triangles may vary, with the smallest representing those areasin which the terrain varies the most.
� As far as possible, small equilateral triangles are preferable.
� To construct a TIN, all measured points are built and the model thus representslines of fracture, single points, and random variations in the terrain
Triangulated irregular network (TIN) Model
An example of TIN model.
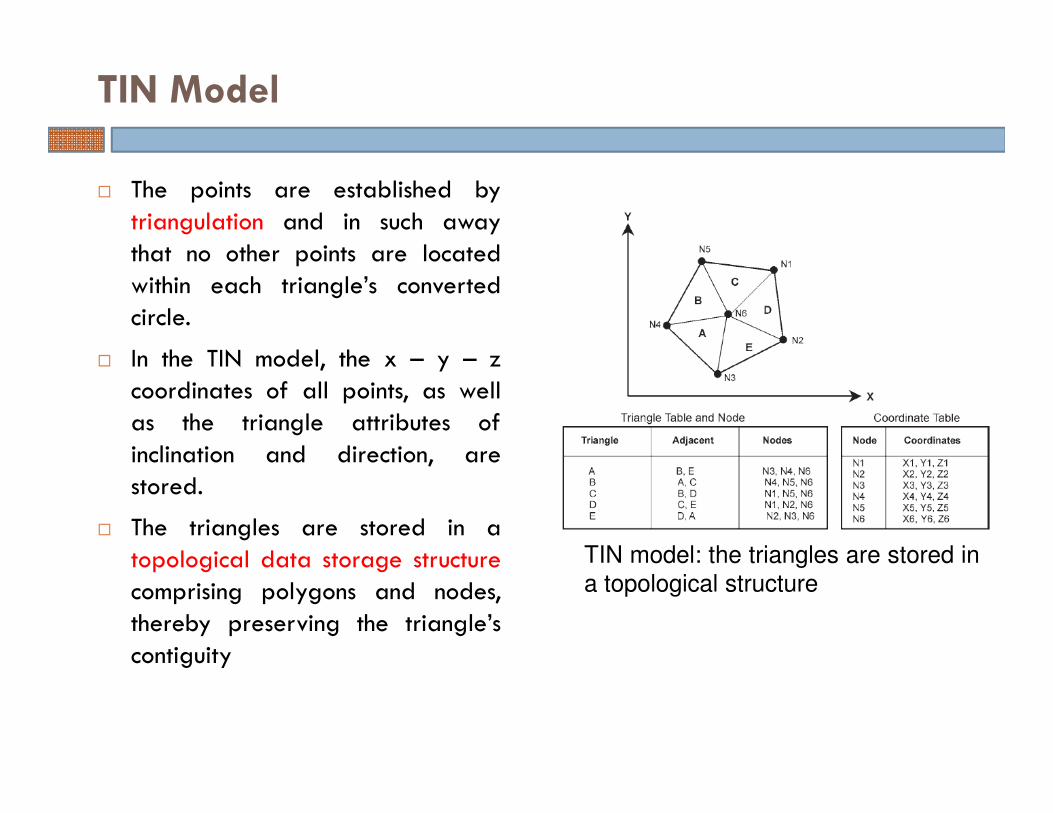
� The points are established bytriangulation and in such awaythat no other points are locatedwithin each triangle’s convertedcircle.
� In the TIN model, the x – y – zcoordinates of all points, as wellas the triangle attributes ofinclination and direction, arestored.
� The triangles are stored in atopological data storage structurecomprising polygons and nodes,thereby preserving the triangle’scontiguity
TIN Model
TIN model: the triangles are stored in
a topological structure
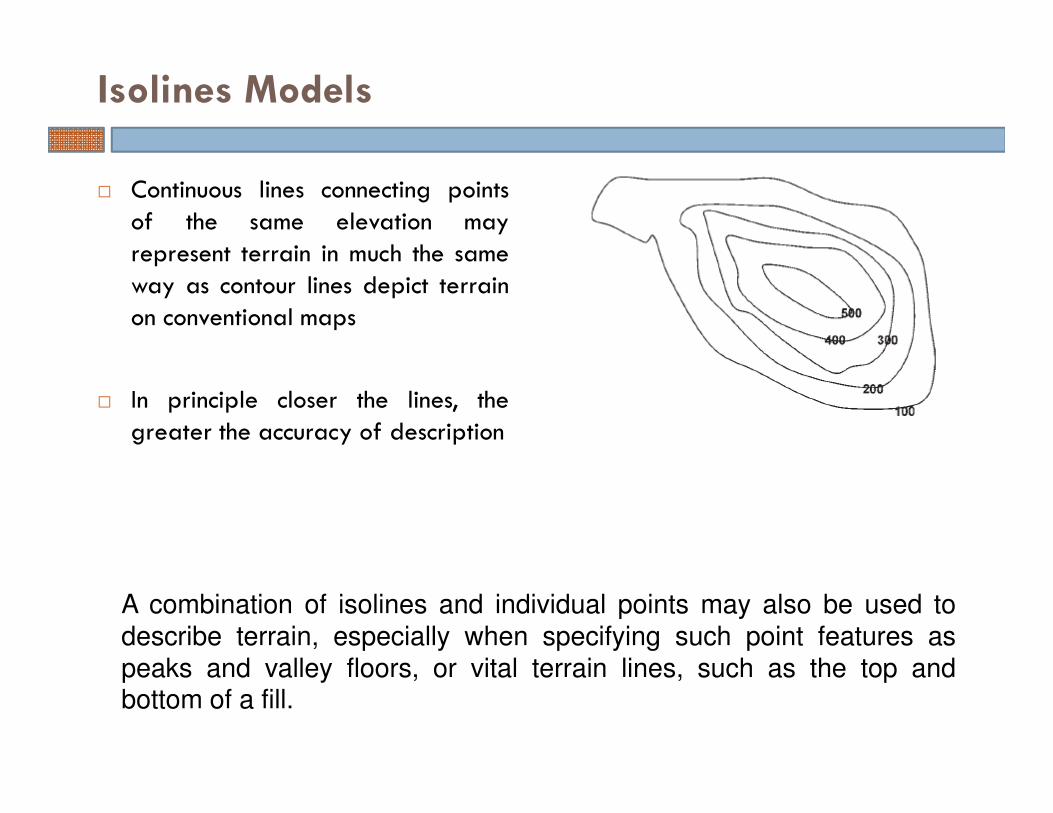
� Continuous lines connecting pointsof the same elevation mayrepresent terrain in much the sameway as contour lines depict terrainon conventional maps
� In principle closer the lines, thegreater the accuracy of description
Isolines Models
A combination of isolines and individual points may also be used todescribe terrain, especially when specifying such point features aspeaks and valley floors, or vital terrain lines, such as the top andbottom of a fill.
� In the real world, time is a factor that concerns us deeply
� In practice, it is difficult to create a data model that is capable ofincorporating all imaginable changes
� The time factor is relatively often neglected in GIS probably because we are more concerned with documenting our current situation than we are with historical changes
� However, If the time factor is not incorporated in the data model for GIS, we run the risk of losing important historical data.
Representation of Time

� The most usual way of handling the time factor in GIS is to look on time as anattribute to the objects in the same way as for other attributes
� This view corresponds with the usual way of presenting geographical data(i.e., as two-dimensional time overlays) and can thus be realized for bothvector and raster data.
� However, this simple approach will not necessarily create a logical connectionbetween the various time layers
� Possible practical solutions will therefore be:
� 1. The attributes of the objects will be changed.
� 2. The geometry of objects is changed.
Representation of Time

Comments….
Questions….
Suggestions….
46
I am greatly thankful to all the information sources(regarding remote sensing and GIS) on internet that Iaccessed and utilized for the preparation of presentlecture.
Thank you !