data on utah’s new nonprofit normal fraser nelson & nancy winemiller basinger, ph.d
Post on 20-Dec-2015
214 views
TRANSCRIPT
Data on Utah’s New Nonprofit NormalFraser Nelson & Nancy Winemiller Basinger, Ph.D.
The Community The Community Foundation of Utah is Foundation of Utah is working with working with entrepreneurs to meet entrepreneurs to meet their charitable their charitable inclinationsinclinations
eet rht ow
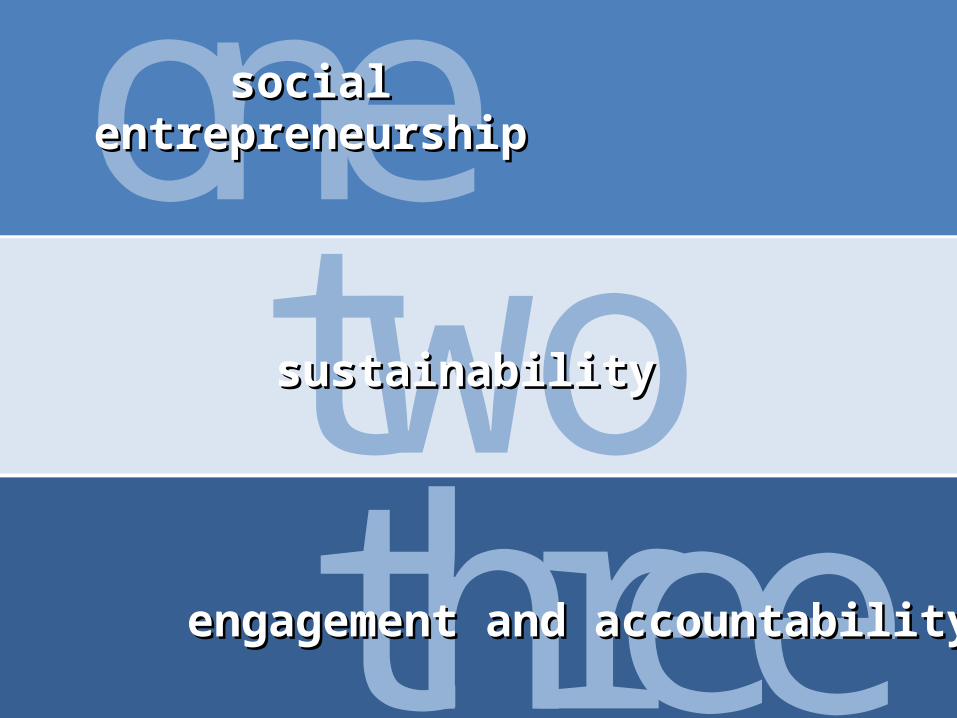
o ensocial social entrepreneurshipentrepreneurship
sustainability sustainability
engagement and accountabilityengagement and accountability
For the past year, with For the past year, with the support of Wells the support of Wells Fargo, we have been Fargo, we have been measuring the impact measuring the impact of the recession on of the recession on Utah’s nonprofit sectorUtah’s nonprofit sector

eet rht ow
o enNeeds and Needs and services services
Giving and Giving and revenuesrevenues
Planning for the futurePlanning for the future

Current Scope of the NP Sector
• 947,274 501(c)(3) public charities in the U.S. – a 60% increase!
• 8.11% of wages and salaries paid in the U.S.
• Total Revenues = $1.4 trillion• 22% of these came from contributions and
grants• 67% came from program service revenues
• Total Expenses = $1.3 trillion
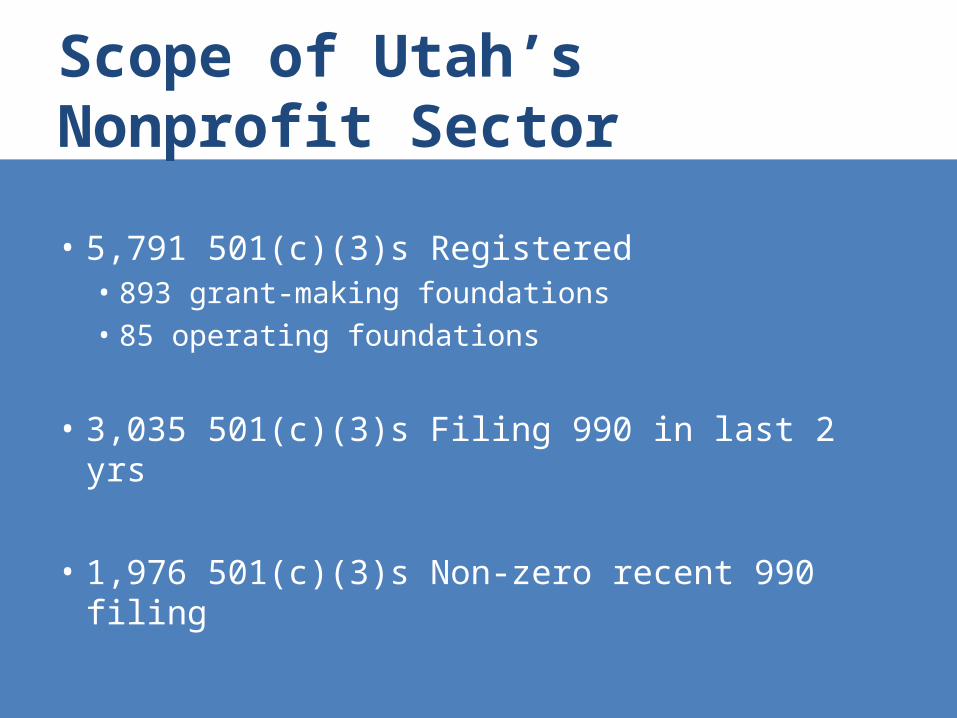
Scope of Utah’s Nonprofit Sector
• 5,791 501(c)(3)s Registered• 893 grant-making foundations• 85 operating foundations
• 3,035 501(c)(3)s Filing 990 in last 2 yrs
• 1,976 501(c)(3)s Non-zero recent 990 filing
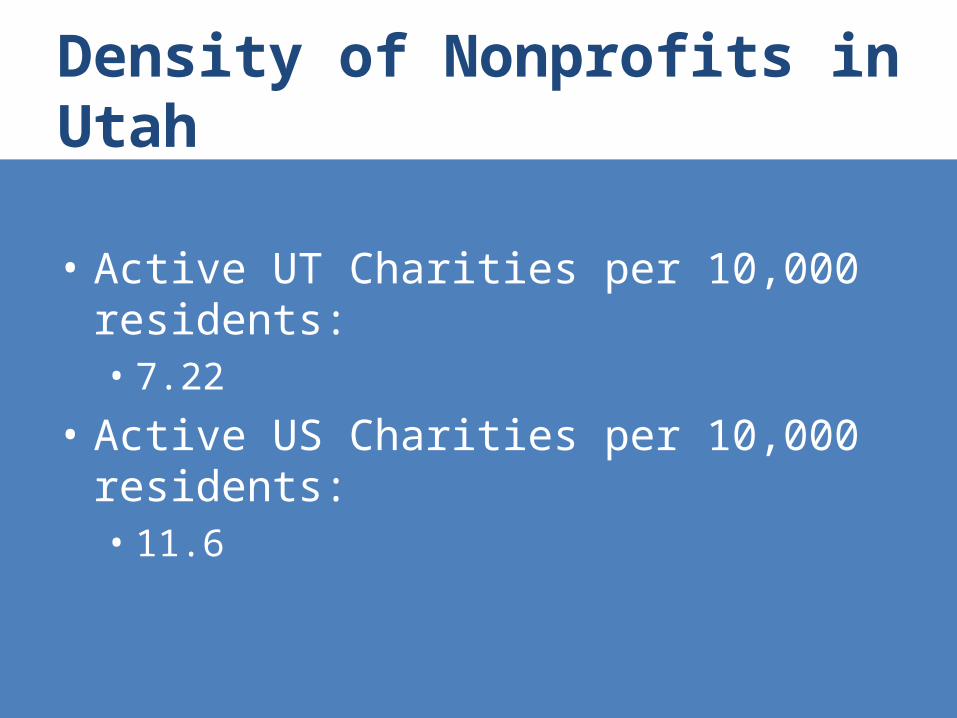
Density of Nonprofits in Utah
• Active UT Charities per 10,000 residents: • 7.22
• Active US Charities per 10,000 residents:• 11.6

Areas of Service – UT Nonprofits
UTAH % Charity Filers NATIONAL % Charity Filers
Arts & Humanities 12.7 12.46
Education 31.3 18.84
Environment & Animals 6.3% 4.93
Health Care 8.9% 10.64
Human Services 25% 32.35
International 2.7% 1.88
Public, Societal Benefit 10.9 12.39
Religion 2.2 6.3
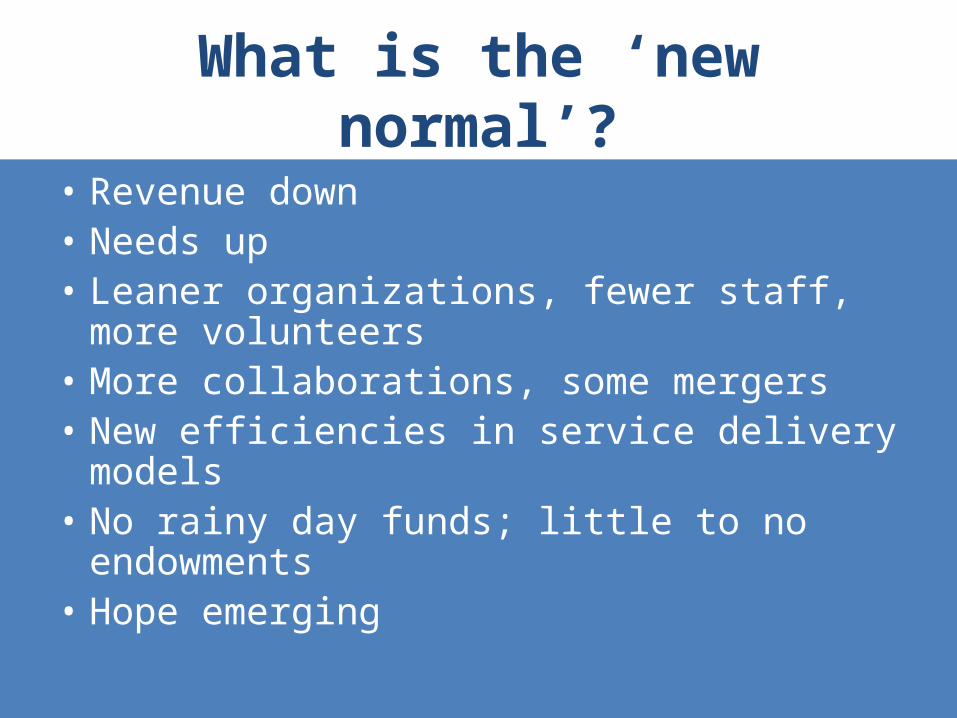
What is the ‘new normal’?
• Revenue down • Needs up• Leaner organizations, fewer staff, more
volunteers• More collaborations, some mergers• New efficiencies in service delivery
models• No rainy day funds; little to no
endowments• Hope emerging
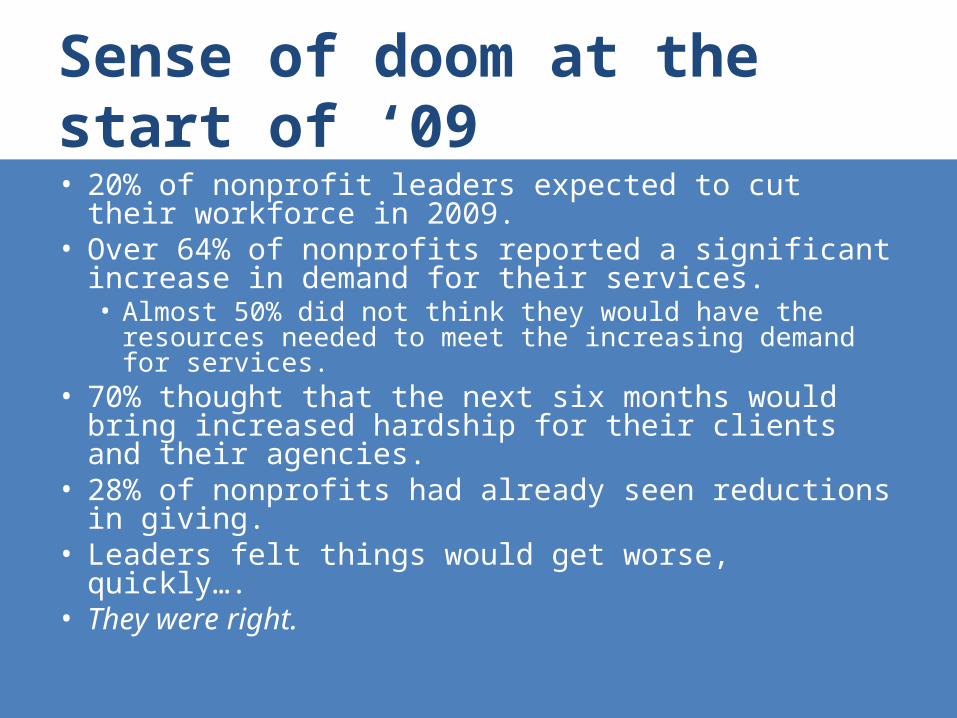
Sense of doom at the start of ‘09• 20% of nonprofit leaders expected to cut their
workforce in 2009.• Over 64% of nonprofits reported a significant
increase in demand for their services.• Almost 50% did not think they would have the
resources needed to meet the increasing demand for services.
• 70% thought that the next six months would bring increased hardship for their clients and their agencies.
• 28% of nonprofits had already seen reductions in giving.
• Leaders felt things would get worse, quickly….• They were right.

… and by July 2009
National data bad• 44% saw decrease in
corporate giving • 42% saw decrease in
foundation giving – “Impact of the 2007-
2008 Economic Recession on Nonprofit Organizations” Bridgespan, Listening Post study (ongoing)
Utah worse• 55% saw decrease in
corporate giving • 44% saw decrease in
foundation giving • One bright spot -
Utah’s individual giving, which is the highest in the country

Charitable Contributions in UT• Average Adjusted Gross Income per
Individual Income Tax Return in UT: $53,555 (20th)
• Average Charitable Contribution per return:• $2,609 (1st)
• Average Charitable Contribution per return as a % of AGI: • 4.9% (1st) • National Avg= 2.2%
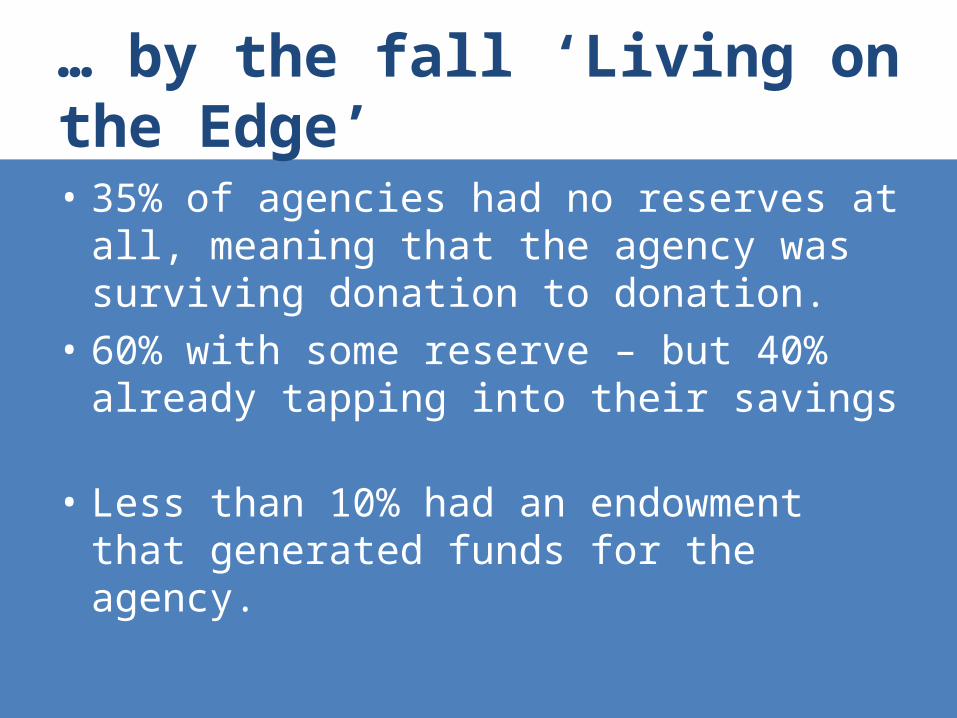
… by the fall ‘Living on the Edge’• 35% of agencies had no reserves at
all, meaning that the agency was surviving donation to donation.
• 60% with some reserve – but 40% already tapping into their savings
• Less than 10% had an endowment that generated funds for the agency.

More Need = More NP Demand!• In Utah, 45% of nonprofits reported
at least a 10% increase in demand for services in late 2009.– 15% saw increases at or above 40%
• Nationally, 80% of nonprofits expect to face increased demand in 2010 but only 49% expect to be able to meet this demand.
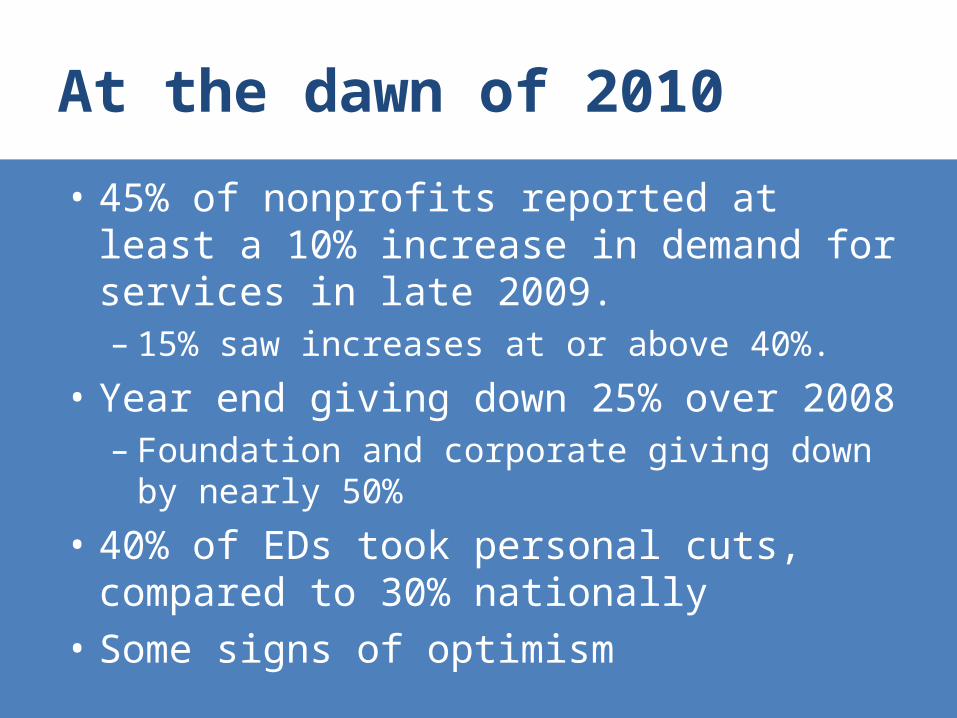
At the dawn of 2010
• 45% of nonprofits reported at least a 10% increase in demand for services in late 2009.– 15% saw increases at or above 40%.
• Year end giving down 25% over 2008– Foundation and corporate giving down by
nearly 50%
• 40% of EDs took personal cuts, compared to 30% nationally
• Some signs of optimism

Individual Donation Trends
• 35% realized a significant decrease in year-end giving • 28% of groups report a significant decrease in
contributions overall• 37% of this reduction was in small and mid-size
nonprofits.
• Overall, nearly 25% of reporting nonprofits saw a significant decreased in the NUMBER of donors to their organizations.
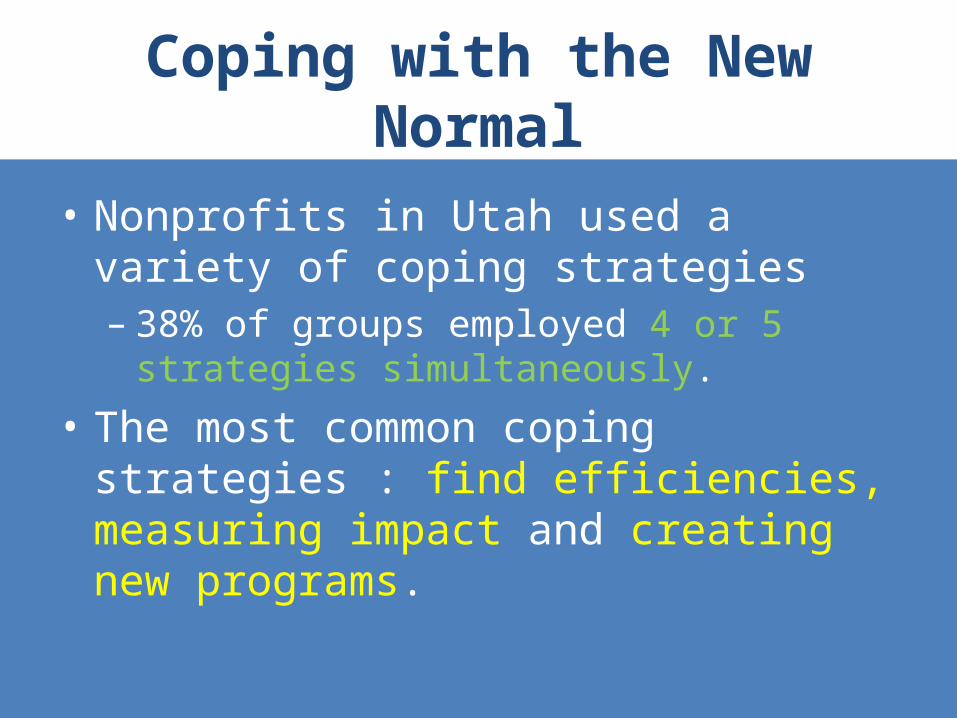
Coping with the New Normal
• Nonprofits in Utah used a variety of coping strategies – 38% of groups employed 4 or 5
strategies simultaneously.
• The most common coping strategies : find efficiencies, measuring impact and creating new programs.

Collaborations: National trends• 30% of Utah nonprofits looked for new
ways to collaborate in 2009.• Nationally, the leading foundations
believe one long-term impact of the recession will be “collaborations among creative groups to produce more effective programs.”
Foundations’ Year-end Outlook for Giving and the Sector. Lawrence. The Foundation Center , November
2009

Volunteerism: National trends• In 2009, 63.4 million people, or
26.8% of all Americans volunteered.– The median number of hours spent
volunteering was 52 for males and 50 for females.
– People age 65 and over spent a median of 90 hours volunteering during the year.

Utah ahead of these trend• 43.5% of Utahns volunteer (1st)– 62% volunteered with Religious
organizations– 28.8% volunteered with Health, Educational
or Human Service organizations.
• The median number of hours volunteered per resident is 80.1 hours.
• A total of 150.3 million hours of service were donated.
• $3.0 billion of service were contributed.

Reported collaborations
(n=154)

Types of collaboration

Benefits to the organization

Benefits to the community
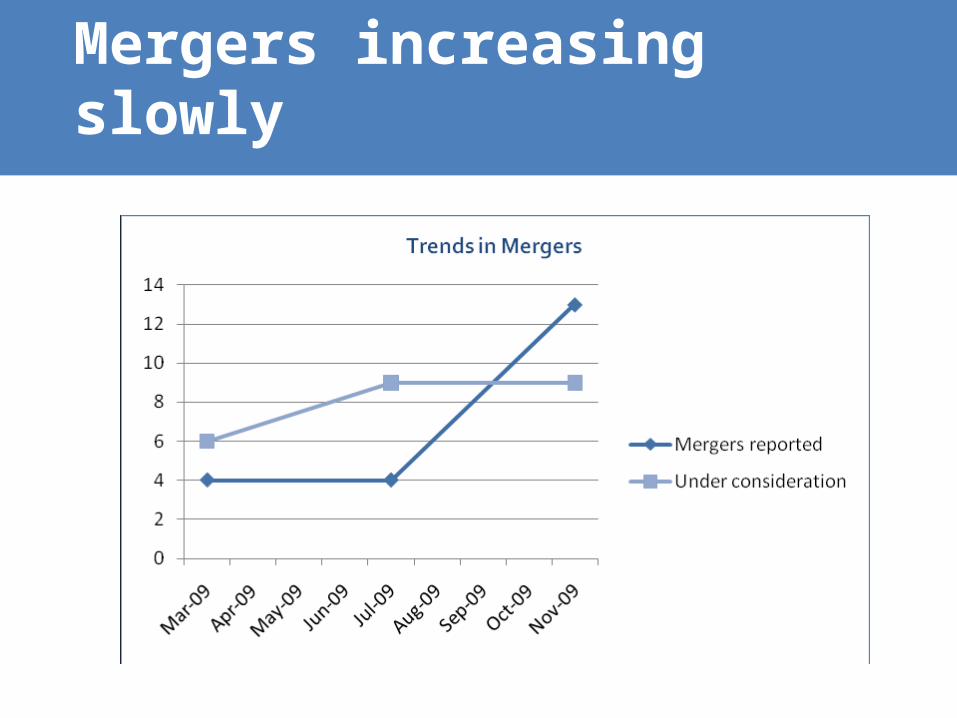
Mergers increasing slowly

I think if there's a great depression I think if there's a great depression there might be some hope. there might be some hope. Lawrence Ferlinghetti Lawrence Ferlinghetti

Predictions for the coming year

Annual Changes in NP Funding
Contrib-utionSource
2009 Significant Decrease
2010Significant Decrease
2009About the Same
2010About the Same
2009Significant Increase
2010 Significant Increase
Individuals 27.9% 29.1% 61.0% 52.8% 11.0% 18.1%
Corporate 47.9% 48.0% 45.1% 43.2% 7.0% 8.8%
Foundation 33.8% 45.8% 55.9% 47.5% 10.3% 6.7%


What do you care about?
• What are your funders asking for that you have trouble finding?
• What data do you need to plan effectively?
• What would you like us to address in our next studies?

For more information www.utahcf.org