data processing and analysis processing and analysis in support of development of water quality...
TRANSCRIPT

Data Processing and Analysisin Support of
Development of Water Quality Indicators
Doug MillerSMSP, CEOE at UD
For 04 December 2009CIB STAC Meeting
1
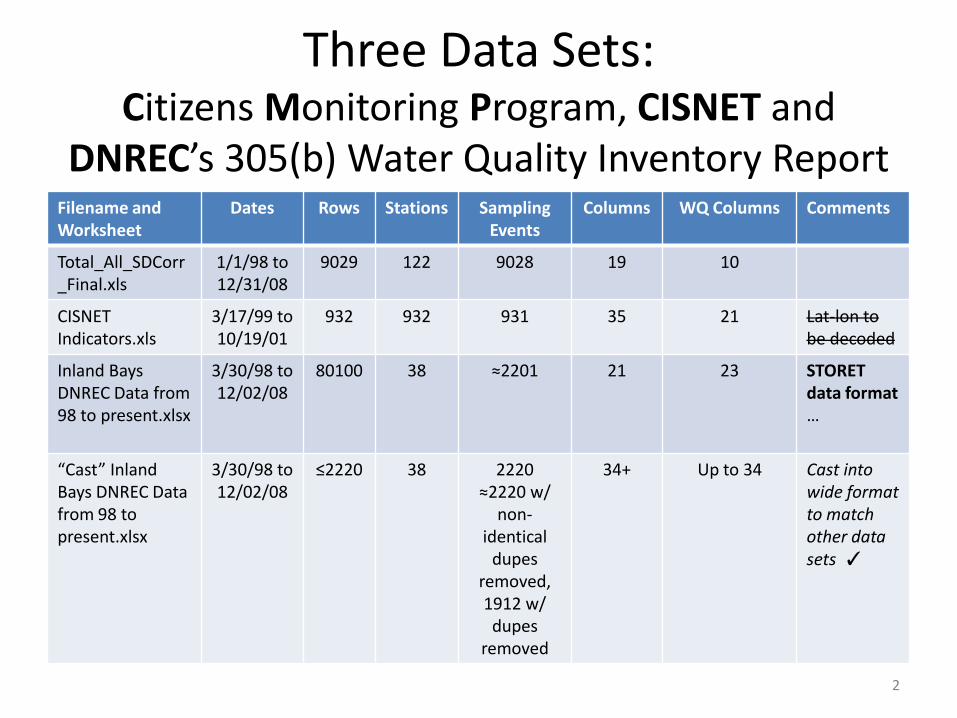
Three Data Sets:Citizens Monitoring Program, CISNET and
DNREC’s 305(b) Water Quality Inventory ReportFilename and Worksheet
Dates Rows Stations Sampling Events
Columns WQ Columns Comments
Total_All_SDCorr_Final.xls
1/1/98 to 12/31/08
9029 122 9028 19 10
CISNET Indicators.xls
3/17/99 to 10/19/01
932 932 931 35 21 Lat-lon to be decoded
Inland Bays DNREC Data from 98 to present.xlsx
3/30/98 to 12/02/08
80100 38 ≈2201 21 23 STORET data format …
“Cast” Inland Bays DNREC Data from 98 to present.xlsx
3/30/98 to 12/02/08
≤2220 38 2220≈2220 w/
non-identical
dupes removed,1912 w/
dupes removed
34+ Up to 34 Cast into wide format to match other data sets ✓
2
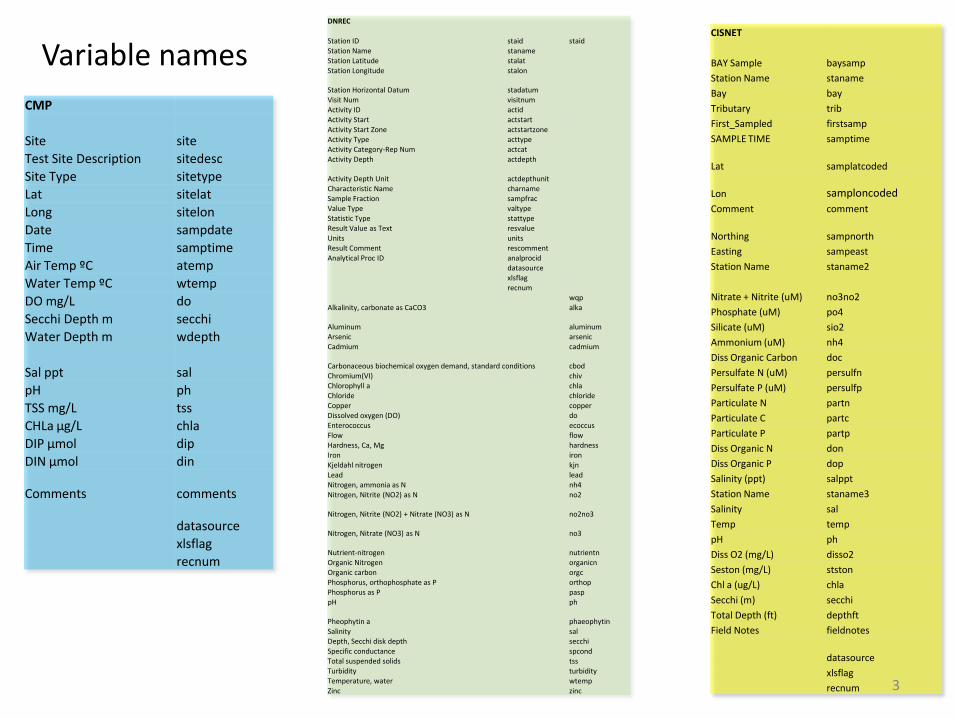
Variable names
CMP
Site site
Test Site Description sitedesc
Site Type sitetype
Lat sitelat
Long sitelon
Date sampdate
Time samptime
Air Temp ºC atemp
Water Temp ºC wtemp
DO mg/L do
Secchi Depth m secchi
Water Depth m wdepth
Sal ppt sal
pH ph
TSS mg/L tss
CHLa µg/L chla
DIP µmol dip
DIN µmol din
Comments comments
datasource
xlsflag
recnum
CISNET
BAY Sample baysamp
Station Name staname
Bay bay
Tributary trib
First_Sampled firstsamp
SAMPLE TIME samptime
Lat samplatcoded
Lon samploncoded
Comment comment
Northing sampnorth
Easting sampeast
Station Name staname2
Nitrate + Nitrite (uM) no3no2
Phosphate (uM) po4
Silicate (uM) sio2
Ammonium (uM) nh4
Diss Organic Carbon doc
Persulfate N (uM) persulfn
Persulfate P (uM) persulfp
Particulate N partn
Particulate C partc
Particulate P partp
Diss Organic N don
Diss Organic P dop
Salinity (ppt) salppt
Station Name staname3
Salinity sal
Temp temp
pH ph
Diss O2 (mg/L) disso2
Seston (mg/L) stston
Chl a (ug/L) chla
Secchi (m) secchi
Total Depth (ft) depthft
Field Notes fieldnotes
datasource
xlsflag
recnum
DNREC
Station ID staid staidStation Name stanameStation Latitude stalatStation Longitude stalon
Station Horizontal Datum stadatumVisit Num visitnumActivity ID actidActivity Start actstartActivity Start Zone actstartzoneActivity Type acttypeActivity Category-Rep Num actcatActivity Depth actdepth
Activity Depth Unit actdepthunitCharacteristic Name charnameSample Fraction sampfracValue Type valtypeStatistic Type stattypeResult Value as Text resvalueUnits unitsResult Comment rescommentAnalytical Proc ID analprocid
datasourcexlsflagrecnum
wqpAlkalinity, carbonate as CaCO3 alka
Aluminum aluminumArsenic arsenicCadmium cadmium
Carbonaceous biochemical oxygen demand, standard conditions cbodChromium(VI) chivChlorophyll a chlaChloride chlorideCopper copperDissolved oxygen (DO) doEnterococcus ecoccusFlow flowHardness, Ca, Mg hardnessIron ironKjeldahl nitrogen kjnLead leadNitrogen, ammonia as N nh4Nitrogen, Nitrite (NO2) as N no2
Nitrogen, Nitrite (NO2) + Nitrate (NO3) as N no2no3
Nitrogen, Nitrate (NO3) as N no3
Nutrient-nitrogen nutrientnOrganic Nitrogen organicnOrganic carbon orgcPhosphorus, orthophosphate as P orthopPhosphorus as P pasppH ph
Pheophytin a phaeophytinSalinity salDepth, Secchi disk depth secchiSpecific conductance spcondTotal suspended solids tssTurbidity turbidityTemperature, water wtempZinc zinc 3

GE and ArcGIS for Spatial Display
Sampling in Time …4

5

Sampling Stations
-75.18 -75.16 -75.14 -75.12 -75.1 -75.08
38.6
38.62
38.64
38.66
38.68
38.7
38.72
305011
305081
306071
306091
306111
306121
306131
306161 306181
306191
306321
306331
306341
308031
308051
308071
308091
308291
308301
308341
308361
308371
308461
309021
309041
310011
310031
310071
310101
310121
312011
312041
402011
402031
402041
402051
AC2S
BA01
BA02
IR02 IR03 IR04
IR07 IR07B
IR10
IR11
IR12
IR19
IR20
IR21
IR22
IR23 IR23A
IR29 IR31
IR32
IR35
IR36 IR36B
IR37
IR38
IR39
IR41B
IR42B
IR43B
IR46B
IR47B
IR48B
IR49B
IR50
IR59
IR5S
IR60A
IR62 IR64
IR65
IR67B IR68B
IR69B
IR70B
IR71
IR72B
LA03
LA08
LA09
LA091
LA10
LA15B LA20
LA21
LA22B
LA30
LA31
LA33 LA33B
LA34
LA35B
LA36
LA42B
LA43 La44 LA44 La45 LA45
ML
RB01 RB01A
RB04
RB05
RB06
RB06A
RB07
RB09
RB16
RB34
RB35
RB38
RB40
RB41 RB42 RB42A RB43
RB44
RB45
RB46 RB46B
RB47 RB47B
RB55
RB58
RB60
RB64 RB65B
RB67B
RB68B
RB69 RB70 RB71
RB72B
RB73B
RL01 RL02
RLC1W
RLC2S
SB01 SB01F
SB02
SB04
SB07
SB09
SB10B SB10E SB10W
SB12
SB14E SB14W
-75.3 -75.25 -75.2 -75.15 -75.1 -75.05 -7538.45
38.5
38.55
38.6
38.65
38.7
38.75
6
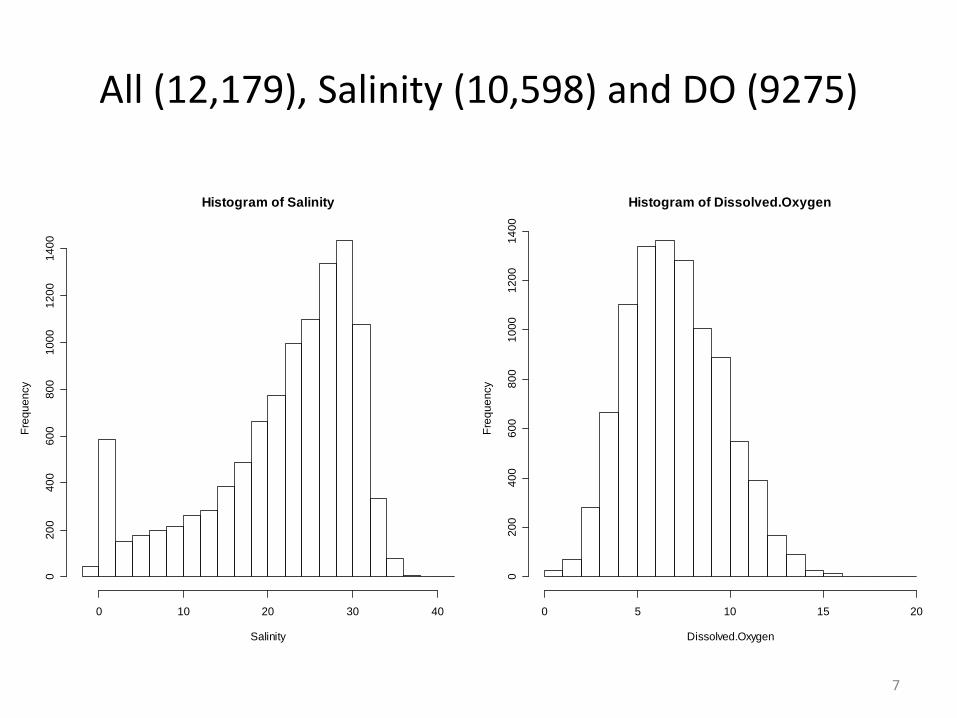
All (12,179), Salinity (10,598) and DO (9275)
Histogram of Salinity
Salinity
Fre
qu
en
cy
0 10 20 30 40
02
00
40
06
00
80
01
00
01
20
01
40
0
Histogram of Dissolved.Oxygen
Dissolved.Oxygen
Fre
qu
en
cy
0 5 10 15 20
02
00
40
06
00
80
01
00
01
20
01
40
0
7

30
8

Fresh, Oligo-, Meso- and Polyhaline Station Means
9
0 5 10 15 20 25 30 350
5
10
15
20
25
30
35
40Fresh Water, Oligo-, Meso, Polyhaline Station Means
Salinity
Fre
quency
-75.3 -75.25 -75.2 -75.15 -75.1 -75.05 -7538.45
38.5
38.55
38.6
38.65
38.7
38.75Fresh Water, Oligo-, Meso, Polyhaline Station Means

DO Station Means
10
-75.3 -75.25 -75.2 -75.15 -75.1 -75.05 -7538.45
38.5
38.55
38.6
38.65
38.7
38.75Dissolved Oxygen Station Means
0 2 4 6 8 10 12 140
5
10
15
20
25
30
35
40Disolved Oxygen Station Means
Dissolved Oxygen
Fre
quency

DO < 5: 113 stations, 2009 observationsDO < 2: 31 stations, 86 observations
-75.3 -75.25 -75.2 -75.15 -75.1 -75.05 -7538.45
38.5
38.55
38.6
38.65
38.7
38.75
-75.3 -75.25 -75.2 -75.15 -75.1 -75.05 -7538.45
38.5
38.55
38.6
38.65
38.7
38.75
IR10 IR10 IR11 IR11 IR11 IR21
IR29 IR29 IR29 IR29 IR29 IR29 IR32 IR32 IR32
IR38
IR59 IR59 IR60A IR62 IR62 IR62 IR62 IR62 IR62 IR62 IR62 IR62 IR64 IR64 IR64 IR64
IR65
IR72B
LA09 LA09 LA09 LA09 LA09 LA09
LA10 LA10
LA21 LA21 LA21 LA21 LA21 LA21 LA21
LA31
RB01 RB01A RB01A RB01A
RB06
RB40
RB43 RB43
RB45
RB46 RB58 RB58 RB58 RB58 RB64 RB64 RB69
SB04 SB04 SB04 SB04 SB07
SB09 SB09 SB09
SB10E SB10E SB10E SB10E SB10E SB10E SB10E SB10E SB10E SB10W SB10W SB10W SB10W SB10W SB10W SB10W
CL-00-01
306331
308281
310121
11

CMP+DNREC Metadata (n=11248)Water Body Stations S Observations DO Observations
Rehoboth Bay 40 3021 2522
Indian River Bay 50 2886 2445
Little AssawomanBay
29 1613 1493
RB shore/openwater
15 734 704
Love Creek 3 467 317
Herring 1 308 268
Guinea 4 877 685
IRB shore/openwater
30 1979 1845
White 6 543 337
Pepper 4 52 64
LA shore/openwater
9 469 408
*Including 931 CISNET “stations,” n = 12179 12

Love, Herring & White Creeks
-75.12 -75.11 -75.1 -75.09 -75.08 -75.07 -75.06
38.55
38.56
38.57
38.58
38.59
38.6
312011
IR29 IR31
IR32
IR59
IR60A
-75.22 -75.2 -75.18 -75.16 -75.14 -75.12
38.63
38.64
38.65
38.66
38.67
38.68
38.69
38.7
38.71
38.72308291
308051
308031
RB34 RLC2S
RB04
RB05
RB06
RB06A
RB40 RB55
13
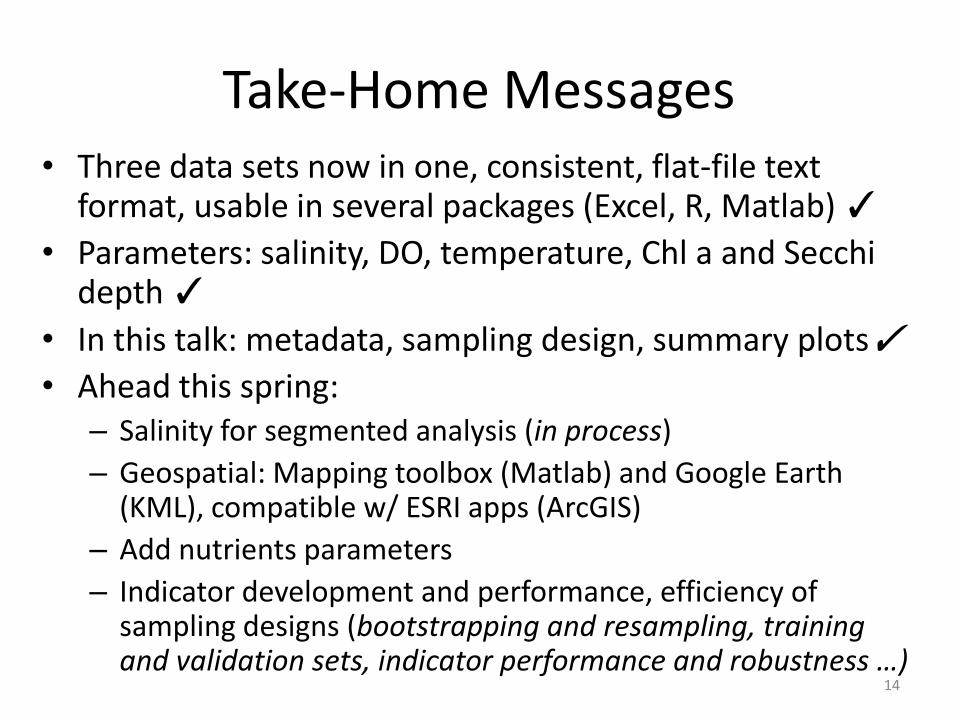
Take-Home Messages• Three data sets now in one, consistent, flat-file text
format, usable in several packages (Excel, R, Matlab) ✓
• Parameters: salinity, DO, temperature, Chl a and Secchidepth ✓
• In this talk: metadata, sampling design, summary plots✓• Ahead this spring:
– Salinity for segmented analysis (in process)
– Geospatial: Mapping toolbox (Matlab) and Google Earth (KML), compatible w/ ESRI apps (ArcGIS)
– Add nutrients parameters
– Indicator development and performance, efficiency of sampling designs (bootstrapping and resampling, training and validation sets, indicator performance and robustness …)
14