“the spatial distribution of human capital: can it...
TRANSCRIPT

Institut de Recerca en Economia Aplicada Regional i Pública Document de Treball 2011/02 38 pàg Research Institute of Applied Economics Working Paper 2011/02 38 pag.
“The Spatial Distribution of Human Capital: Can It Really Be Explained by Regional Differences in Market
Access?”
Burhan Can Karahasan and Enrique López-Bazo

The Spatial Distribution of Human Capital: Can It Really Be Explained by Regional Differences in Market Access?
Burhan Can Karahasan∗
Enrique López-Bazo†
* Istanbul Bilgi University, Kazim Karabekir Avenue 2/13 Eyup, Istanbul, Turkey. email: [email protected]
† European Commission, Joint Research Centre (JRC), Institute for Prospective Technological Studies (IPTS). C/ Inca Garcilaso 3, E–41092, Seville, Spain & AQR–IREA, University of Barcelona, Avda. Diagonal 690, E–08028, Barcelona, Spain email: [email protected]
Abstract: This paper tests the robustness of estimates of market access impact on regional variability in human capital, as previously derived in the NEG literature. Our hypothesis is that these estimates of the coefficient of market access, in fact, capture the effects of regional differences in the industrial mix and the spatial dependence in the distribution of human capital. Results for the Spanish provinces indicate that the estimated impact of market access vanishes and becomes non-significant once these two elements are included in the empirical analysis.
Keywords: human capital, geography, market access, spatial dependence
JEL Codes: C21, I21, R12,
____________________ Acknowledgments: BC-K acknowledges the scientific research support from the Scientific and Technological Research Council of Turkey (TUBITAK), grant code BIDEB-2214. EL-B acknowledges financial support from the Spanish Ministry of Science and Technology, National Program of R&D, ECO2008-05314/ECON. The views expressed here are purely those of the authors and may not in any circumstances be regarded as stating an official position of the European Commission.

� 1�
1. Introduction Contributions to the literature in recent decades have shown regional disparities to be
associated with differences in the endowment of the socio-economic characteristics of
each region. Among these, human capital, and in particular the educational attainment
of the population, has been reported as being a key factor in accounting for differences
in regional economic growth. Thus, endogenous growth models highlight the fact that it
is human capital that stimulates the diffusion of knowledge and technological
development, while Lucas (1988) and Romer (1990) stress the importance of human
capital for explaining why some economies are more developed than others. Likewise,
Barro and Sala-i-Martin (2004) also consider human capital an important factor for
explaining economic convergence across countries and across regions.
From a complementary perspective, New Economic Geography (NEG) identifies a
connection between the human capital endowment of an economy and the spatial
distribution of economic activity. Initially, Krugman’s (1991) two-sector model and
Fujita et al’s. (1999) augmented model focused solely on the location of production and,
hence, on the distribution of economic growth among localities. From such models, a
relationship between the spatial concentration of economic activity and factor prices can
be derived. Specifically, wages are associated with market access - the distance-
weighted sum of the purchasing power of the system of economies. The model predicts
that by locating in high market access areas, firms will be able to pay higher wages to
their workers, as such a location means lower transport costs and entails the cost savings
of large-scale production. Existing empirical evidence supports the prediction of this
theoretical model, given the confirmation of a strong and significant impact of market
access on wages, proxied by per capita income, both for samples of countries and
regions (e.g. Redding and Venables, 2004; Breinlich, 2006).
However, these seminal papers did not examine in detail the endogenous accumulation
of factors of production. Thus, while these early contributions to NEG analyzed the
spatial distribution of economic activity, they did so without paying any great attention
to the impact of agglomeration on the accumulation of the supposed determinants of
economic growth. Only recently has the accumulation of human capital been
endogenized within the framework of an NEG model (Redding and Schott, 2003).

� 2�
Assuming that human capital endowments will be larger in areas offering higher returns
on this factor, the model predicts greater endowments in economies with better access
to markets and suppliers. This prediction holds because the relative wages of skilled
labor, and hence the economic incentive to invest in human capital, increase with
market and supply access.
Adopting a similar empirical strategy to that used in studies seeking to verify the
relationship between wages and market access, Redding and Schott (2003) provided
evidence of the positive impact of market access on human capital for a sample of
countries. Similarly, López-Rodríguez et al. (2007) tested this hypothesis for a sample
of EU regions and reported a positive and significant correlation between market access
and measures of educational attainment. However, in both exercises the empirical
specification did not control for factors that are equally likely to impact on the spatial
distribution of human capital. López-Rodríguez (2007) did, however, test the robustness
of the estimated impact of market access for the EU regions. He reported that the
estimate decreased markedly (to less than a third, from around 0.9 to 0.3), but remained
significant when additional control variables (i.e. employment in high-tech sectors,
labor productivity, number of patents, and a dummy variable accounting for
peripherality) where included. Redding and Schott (2003) also included indicators
thought to be important in cross country studies of development (i.e. the risk of
expropriation by the government, the percent of countries’ land that is tropical, and
dummies for socialist rule and external wars) in their regression. In this case, the
estimate of the impact of market access fell by half (from around 0.6 to 0.3), being
significant only at the 5% level.
In this paper, we seek to contribute to the testing of the robustness of the market access–
human capital relationship in a regional setting. It is our belief that the estimate of the
coefficient of the market access measure in fact captures the effects of regional
differences in the industrial mix and of the spatial dependence in the distribution of
human capital. Our hypothesis is that the omission of such factors in previous studies
has biased estimates of the market access coefficient. Specifically, this holds true if, as
expected, the sectoral composition of each region is correlated to the measure of market
access, and if this measure captures at least part of the spatial dependence that seems
likely to characterize the regional distribution of human capital. Niebuhr (2006) and

� 3�
Kosfeld and Eckey (2008) raised similar concerns in the relationship between wages
and market access. Indeed, Niebuhr (2006) showed that controlling for additional
conditioning variables reduces the power of market access to account for regional
wages.
We test our hypothesis by drawing on data for the Spanish provinces. In section 2, we
study the dispersion of human capital among the provinces of Spain, using two proxies
of human capital endowment: the average number of years of schooling and the per
capita value of human capital. In both cases, the spatial descriptive analyses confirm
sizeable regional disparities and a marked spatial dependence in the distribution of
human capital. Next, we estimate the coefficient of a simple specification, which reveals
the positive and significant effect of market access on both measures of human capital.
The theoretical arguments of NEG supporting these empirical results are outlined in
section 3, while in section 4 we discuss the effect of failing to control for regional
differences in sectoral composition, and for spatial dependence. Building on these
arguments, the original NEG specification can be augmented, and the estimation
obtained with these alternative specifications can be compared with those originally
obtained from the baseline model. Finally, section 5 concludes.
2. Spain’s Geography of Human Capital
2.1 Preliminary Evidence
Spain’s is one of the success stories of the Euro Area in terms of the evolution recorded
in its regional inequalities. However, disparities in key macroeconomic indicators
between regions remain sizeable (see, for example, Cuadrado et al., 1999; De la Fuente,
2002). Drawing on arguments from New Economic Geography (NEG), recent
contributions have analyzed the connection between the spatial distribution of economic
activity and regional disparities in certain variables of interest. In the case of Spain,
López-Rodriguez et al. (2008) reported evidence of the impact of geography on regional
wages. These findings confirm that geography, measured by the market access of
provinces, has a positive impact on the dispersion of regional wages. Similarly, López-
Rodriguez et al. (2007) concluded that market access also shapes the distribution of

� 4�
human capital (in this case for the set of EU regions). These respective findings suggest
the need for a more rigorous analysis of the relationship between market access and
Spain’s endowment of human capital, particularly as human capital has been shown to
be a key factor in this and other countries’ regional growth (see, for example,
Rodríguez-Pose and Vilalta-Bufí, 2005; Di Liberto, 2008; López-Bazo and Moreno,
2008; Bronzini and Piselli, 2009). Therefore, an enhanced understanding of the
determinants of the spatial distribution of human capital should shed light on the origin
of regional inequalities in productivity, per capita income and, hence, long-term
welfare.
Despite the constant improvement in the level of schooling in recent decades, the
Spanish provinces still show marked differences in their endowment of human capital.
The evidence presented herein was obtained from data for Spain’s 47 continental
provinces1 and for two indicators of human capital, in the years 1995 and 2007. The
first indicator is a traditional measure of human capital: the average number of years of
schooling of the working population in each province. However, as this measure has
been subject to certain criticism, results were also obtained for a second measure of
human capital: the per capita value of human capital, which shows the productivity
level of a skilled worker compared to that of an unskilled one (Mulligan and Sala-i-
Martín, 2000). In both cases, the data were drawn from the IVIE-Bancaja Human
Capital Dataset for Spain (see Serrano and Soler, 2008, for a description of the
methodology used in constructing the dataset).2
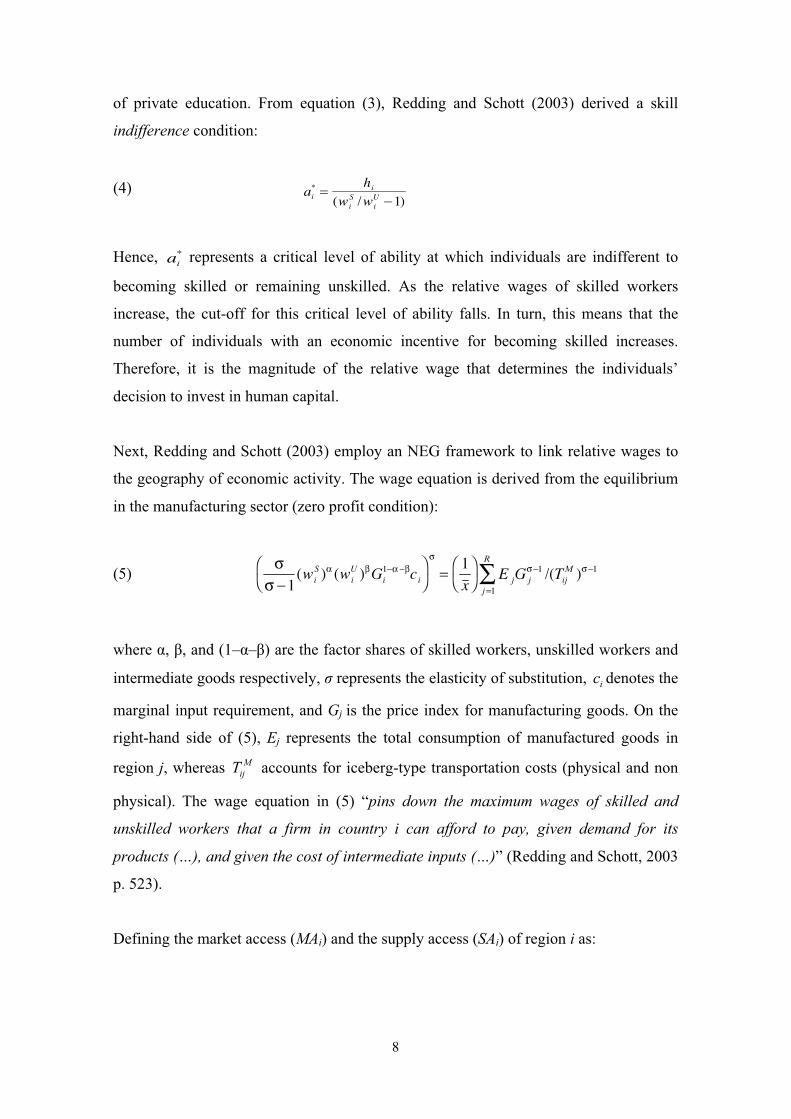
The spatial distribution of these two measures for 1995 and 2007 is shown in Figure 1.
The maps confirm the existence of marked differences in human capital endowment
across the Spanish provinces and their persistence over time, despite the overall increase
in endowment in all provinces. However, of greatest interest to us here is the
geographical distribution of human capital with, broadly speaking, higher levels in the
north and lower levels in the south. Here again this pattern seems to persist despite the
general increase in the level of schooling between 1995 and 2007.
As outlined above, NEG predicts that the spatial distribution of human capital in the
Spanish provinces is largely attributable to the geographic location of each province.
Geography, location or, in other words, relative remoteness can be proxied by the

� 5�
market access measure suggested initially by Harris (1954). As discussed in this seminal
contribution and later revisited by influential NEG models, market access can be
proxied by the distance-weighted sum of the purchasing power of the economies.
Therefore, the market access of a province in Spain will be positively associated with
the purchasing power of the remaining provinces, but negatively related with the
distance between them:
(1)
where Yj is the gross value added (GVA) in province j, and Dij is the distance between
each pair of provinces i and j. The internal distance of each province is calculated in line
with Head and Mayer (2006), that is . Figure 2 shows the values of
the market access measure for the Spanish provinces for 1995 and 2007 and it is evident
that the provinces differ as regards their market access. As expected, the dispersion is
persistent and no significant changes are recorded in the time period under
consideration.
The relationship between the respective distributions of human capital and market
access (Figures 1 and 2) reveals a connection between the two magnitudes, albeit that it
is far from perfect. Generally, provinces with large endowments of human capital do not
lie in the economic periphery, which tends to be occupied by those with the smallest
endowments. However, a number of provinces contradict this general trend as is
confirmed by Figure 3. In all cases (for both years and time periods) there exists a
positive relationship between human capital and market access, but the amount of
dispersion in the relationship is far from negligible. Note, for example, that there are
provinces with similar, low market access values that have quite different endowments
of human capital. In addition, the distribution of both magnitudes seems likely to be
characterized by spatial dependence, a factor that must also be considered when
formally analyzing the impact of market access on the endowment of human capital.

� 6�
2.2 Estimation of the baseline model
The initial step in our study of the robustness of the estimated impact of market access
on the spatial distribution of human capital involves estimating a simple specification
for use as a benchmark:
(2)
where HK denotes the column vector with the values for the human capital measure in
the economies under analysis, and ε is supposedly (at least so far) a well behaved error
term. β is the parameter that captures the impact of market access on human capital.
The OLS estimates of the parameters in (2) for the two alternative measures of human
capital and for the two years under analysis are shown in Table 1.3 The results are
obviously in agreement with the depiction in Figure 3, thereby confirming the existence
of a positive correlation between the two variables: Spanish provinces with greater
market access are endowed with higher levels of human capital. In other words,
remoteness acts as an incentive to accumulate human capital. The impact of market
access, however, declined over the period analyzed, as shown by the lower coefficient
estimate in 2007 for both measures of human capital.
Table 1 additionally includes the results for further diagnostic tests. Thus, the Breusch-
Pagan test indicates that there are no symptoms of heteroskedasticity in any of the
estimated baseline models, while the battery of spatial dependence tests indicates that
the baseline human capital-market access model is likely to be (spatially) misspecified.
The results of these spatial dependence tests are discussed in greater detail in section 4,
as they lend support to our claim for the estimation of a spatial specification of the
human capital-market access model. However, first, we frame the results of the baseline
specification within an NEG model that is extended to account for the endogenous
accumulation of human capital in each region.

� 7�
3. The NEG Explanation: Human Capital and Geography
Not only are the findings reported in section 2 intuitively reasonable, but the NEG
framework allows for the relatively straightforward, theoretical derivation of the link
between human capital and remoteness. Krugman (1991) and Fujita et al’s. (1999)
models did not include the accumulation of human capital. It was in Redding and Schott
(2003) that an endogenous mechanism for the accumulation of human capital was first
considered and which in conjunction with standard NEG arguments gave rise to a
reduced form linking the skill wage premium in every economy to its market and supply
access.4
Next, we briefly outline the main elements making up the model in Redding and Schott
(2003) stressing the derivations that support the empirical specification in (2).5 The
economy is composed of i∈{1,…,R} regions. There are Li consumers in each region,
each having one unit of labor. This unit of labor is initially unskilled and individuals
choose endogenously whether or not to invest in becoming skilled. Consumer
preferences are identical and homothetic, and are defined over consumption of
agricultural and manufacturing goods. The agricultural sector produces under constant
returns to scale, whereas manufacturing industry operates with increasing returns to
scale.
The critical part of the model is constructed over the individuals’ human capital
investment choice, which is formulated as:
(3)
where and represents the wage level of skilled and unskilled workers
respectively. The gap in the left-hand side of (3) is the wage premium, which should be
higher than the cost of education defined in the right-hand side so that individuals have
incentives to invest in education. The cost of education comprises two components:
represents individuals’ ability to become skilled, which lowers the cost of
education, and , which accounts for the institutional environment and the public
provision of education defined as an inverse measure, i.e., increasing raises the cost
� 8�
of private education. From equation (3), Redding and Schott (2003) derived a skill
indifference condition:
(4)
Hence, represents a critical level of ability at which individuals are indifferent to
becoming skilled or remaining unskilled. As the relative wages of skilled workers
increase, the cut-off for this critical level of ability falls. In turn, this means that the
number of individuals with an economic incentive for becoming skilled increases.
Therefore, it is the magnitude of the relative wage that determines the individuals’
decision to invest in human capital.
Next, Redding and Schott (2003) employ an NEG framework to link relative wages to
the geography of economic activity. The wage equation is derived from the equilibrium
in the manufacturing sector (zero profit condition):
(5)
where α, β, and (1–α–β) are the factor shares of skilled workers, unskilled workers and
intermediate goods respectively, σ represents the elasticity of substitution, denotes the
marginal input requirement, and Gj is the price index for manufacturing goods. On the
right-hand side of (5),�Ej represents the total consumption of manufactured goods in
region j, whereas accounts for iceberg-type transportation costs (physical and non
physical).� The wage equation in (5) “pins down the maximum wages of skilled and
unskilled workers that a firm in country i can afford to pay, given demand for its
products (…), and given the cost of intermediate inputs (…)” (Redding and Schott, 2003
p. 523).
Defining the market access (MAi) and the supply access (SAi) of region i as:

� 9�
the wage equation can be written as:
(6)
where ξ absorbs the earlier constant terms. Therefore, the wage equation can be
expressed as a function of market and supply access. Manufacturing firms in regions
with easy access to the market and to suppliers can therefore increase the maximum
wages that they can afford to pay.
Combining the zero profit conditions of the constant returns to scale sector (agriculture)
and of manufacturing6 with the skill indifference condition in (4), Redding and Schott
are able to characterize the equilibrium relationship between geographical location and
endogenous human capital investments. Taking logarithms and totally differentiating
each profit condition results in:
(7)
(8)
From these expressions it can be deduced that if a region becomes remote (in the sense
that market and supplier access fall) and assuming that manufacturing production is
skill intensive, then the new equilibrium will be characterized by a lower relative wage
of skilled workers.7 Returning to the critical level of ability, this decline in the relative
wages of skilled workers means a lower incentive to invest in human capital.
Accordingly, the number of skilled workers can also be expected to fall in that region.
This is the argument underpinning the connection between the spatial distribution of
human capital and market access in equation (2), as the relative wages of skilled

� 10
workers are predicted to be lower in the remote regions and, hence, the critical level of
ability ( ) to be higher, which means a lower incentive to accumulate human capital.
4. Missing Links: Sectoral Composition and Spatial Dependence
Redding and Schott’s (2003) NEG model (as outlined above) provides a theoretical
justification for the empirical evidence reported in section 2 whereby the human capital
endowment is higher in Spain’s economic core and less abundant in the peripheral
areas. However, the baseline model in (2) does not account for other potential
determinants of the process of accumulation of human capital at the regional level.
Indeed, the theoretical model includes other mechanisms that impact on the critical level
of ability. In addition to the impact of MA and SA, the supply of skilled workers
monotonically decreases in the level of productivity in the constant returns to scale
sector, in the cost of the manufacturing production parameter (ci), and in the cost of
education (hi). By contrast, technology transfers to a less developed region i reduce their
ci, thereby raising the maximum wage that its manufacturing firms can afford to pay to
skilled and unskilled workers given the current market and supply access. Since
manufacturing is skill intensive, this leads to an increase in the relative wages of skilled
workers, and hence a higher endowment of human capital.8 For this reason, empirical
specifications such as the one included in equation (2), which has no variables proxying
for these other factors, are likely to produce biased estimates of the impact of MA (and
SA) on human capital.
This concern has been pointed out in the recent empirical literature investigating the
impact of market access on the dispersion of regional wages. For instance, Breinlich
(2006) controls for the direct distance between the capital of each region and
Luxemburg (considered the economic centre of Europe) and for human and physical
capital stocks in his study of the relationship between regional wages and market
access. Similarly Niebuhr (2006) and Kosfeld and Eckey (2008) recognize that the
impact of market access on wage dispersion can be influenced by the sectoral
composition of the labor force and also by spatial dependence.

� 11
However, despite the arguments derived from the theoretical model, and the evidence
obtained from studies that focus their attention on wages and market access, López-
Rodríguez et al. (2007) only control for the direct distance between each region and
Luxemburg in their analysis of the link between human capital and market access across
the EU regions. Interestingly, in a closely related paper, López-Rodríguez (2007)
showed that the estimate of the impact of market access remains significant (albeit
decreasing) when other variables are included in the model. In marked contrast, in the
rest of this section we show how by controlling simply for the industrial mix (as a rough
proxy for the factors described above) and for spatial dependence (which is also likely
to account for the impact of some of these factors) in the baseline human capital
equation, this modifies the conclusion regarding the impact of market access on the
regional distribution of human capital.
4.1. Sectoral composition
Different economic activities require workers with different levels of education.
Accordingly, it is our hypothesis that the industrial mix conditions the regional
distribution of human capital, as some sectors are skill intensive while others employ
low skilled workers. In the case of the Spanish provinces, there are major disparities in
the share each sector has in the economy. Therefore, we expect provinces specialized in
a particular industry or industries to present higher endowments of human capital. This
is confirmed by Figure 4, which maps the spatial distribution of the employment share
in the manufacturing and services sectors.9 The picture described by the maps is well
known: the manufacturing sector is most important in the northeast of the country
(along the Mediterranean coast and the Ebro Valley), and in some central provinces.
Meanwhile, the services sector is most important in the southwest (because of greater
employment in the public sector), in Madrid, and in some other provinces such as
Barcelona and Valencia (reflecting high rates of employment in market services).
Thus, Figures 1 and 4 show that the spatial patterns of human capital and manufacturing
employment are quite similar. In the case of the services sector, a connection can also
be observed with the endowment of human capital, although in this case we should take
into account the aforementioned intensity of employment in the public sector in the

� 12
southwest provinces, and also the proliferation of some low value-added services linked
to tourism in these provinces.
4.2. Spatial dependence
Our second concern is related to the spatial dependence of human capital. An
exploratory spatial data analysis (ESDA) reveals that the two human capital indicators
are characterized by significant spatial dependence. Global spatial autocorrelation was
tested by means of Moran’s I statistic (see, for instance, Anselin, 1993):
(9)
where n represents the number of provinces, z is the standardised value of the variable
under analysis, s is the summation of all the elements in the weight matrix, and wi,j is
the generic element of W, a spatial weight matrix defined as:
(10) where
Two matrices of spatial weights were used in conducting the ESDA. First, a contiguity
weight matrix, where wij=1 if provinces i and j are neighbors, and wij=0 otherwise. Next,
an inverse distance weight matrix in which the elements are defined by:
(11)
The first four rows of Table 2 show Moran’s I test results for each indicator of human
capital in the two years under analysis and for the application of the two weight
matrices. In each case, the null hypothesis of absence of spatial dependence in the
human capital variables was strongly rejected. A more detailed analysis, involving the
computation of measures of local spatial dependence, revealed a clear north-south

� 13
divide, with hotspots of human capital endowment in the north, and groups of provinces
with much lower endowments in the south (see, the Moran scatterplot in Figure 5).
A similar analysis conducted for the market access variable also reveals a far from
random spatial distribution. As shown in the last two rows of Table 2, Moran’s I test
clearly rejects the null hypothesis of absence of spatial dependence in both years and for
the two weight matrices. However, the contribution of each area to the global spatial
dependence differs from that observed for the human capital indicators. The values of
the local Moran’s I statistic in Figure 6 reveal that in this instance there is no clear
north-south divide. Rather, there would seem to be a roughly east-west divide, which
does not, however, match the structure of dependence observed for the human capital
measures. Thus, we cannot expect market access to account for the pattern of spatial
dependence detected in the human capital indicators in a regression such as that
employed in our baseline specification. On the contrary, spatial autocorrelation is likely
to be present in the residuals of the OLS estimation of equation (2). This is confirmed
by the results Moran’s I and the battery of Lagrange Multiplier (LM) tests of spatial
dependence reported in Table 1. In all instances, the test points to the presence of
significant residual spatial dependence, which means that the results based on the OLS
estimator provide an inefficient and even biased estimation of the coefficient that
summarizes the relationship between human capital and market access.
4.3. Extended empirical specification
Considering the descriptive evidence provided up to this point, and the role played by
the other elements in the theoretical model described in section 2, it is our belief that the
empirical specification used for testing the connection between human capital
endowments and market access ought to account for regional differences in the
industrial mix and for spatial dependence. In the rest of this section, we show the effect
of ignoring both phenomena in the case of the Spanish provinces.
Initially, the baseline specification was augmented to control for the sectoral
composition of each region:
(12)

� 14
where SE is a matrix whose columns correspond to the employment in each sector as a
share of total employment, excluding that of agriculture so as to avoid collinearity. φ is
the corresponding vector of parameters associated with the effect of sectoral
composition.
Next, in order to control for spatial dependence, two specifications were considered: the
spatial autoregressive model (SAR):
(13)
and the spatial error model (SEM):10
(14)
where ρ and λ are the spatial coefficients, and υ a well-behaved error term.
The results of the estimation of the parameters in (12) are reported in Table 3, while
those for the spatial models in (13) and (14) are shown in Table 4.11 As for the impact of
the inclusion of variables conditioning for the industrial mix, the results in Table 3 are
quite clear. The magnitude of the coefficient associated with market access decreases
for the two indicators of human capital and for the two years under analysis. In fact, the
non-significance of the effect of market access on human capital endowment cannot be
rejected at the usual significance level in 2007, while in 1995 it is only significant at the
5% (for the per capita value of human capital) and 10% (for the average number of
years of schooling) levels. This finding confirms our concerns about the importance of
including a proxy for regional differences in sectoral composition.
Nonetheless, Moran’s I test and the LM tests of the models estimated, including the
controls for sectoral composition, still reject their null hypotheses of no spatial
dependence. In other words, the addition of sectoral composition does not account (at
least fully) for the spatial autocorrelation in the human capital distribution in the
Spanish provinces. Therefore, the estimation of a spatial specification (the SAR and/or
the SEM models) is required to guarantee a robust inference of the imapct of market

� 15
access. Table 4 summarizes the estimation results of the two alternative spatial models,
showing that the spatial parameter is strongly significant in all cases, and large in
magnitude. We also tested for the joint significance of the coefficients associated with
the variables proxying for sectoral composition and for spatial effects. The results of the
likelihood ratio tests are shown in Table 5. In building these tests, the logarithm of the
likelihood (lnL) for the appropriate specifications in each case (from Tables 1, 3, and 4)
was used. It was observed that the null hypothesis of no joint significance is strongly
rejected in all cases, confirming that both the sectoral variables and the spatial effects
are significant when explaining the variability in the regional distribution of human
capital endowment.
In addition, the results of the LM tests of residual (the SAR model) and substantive (the
SEM) spatial dependence indicate that these models no longer exhibit significant spatial
autocorrelation (the null is only marginally rejected for the SAR in the per capita value
of human capital in 1995, and for the average number of years of schooling in 2007). As
for the effect of market access, the results strongly support our hypothesis as the change
in its size and significance is even more intense when it is estimated considering spatial
dependence, either by means of the SAR or the SEM specifications. In fact, these results
suggest an almost negligible role of market access in explaining regional differences in
human capital endowment, once sectoral composition and spatial dependence are
accounted for.
It might be argued, however, that market access is likely to be correlated with the
proxies for industrial mix, and also with the spatial lags in equations (13) and (14). As a
result, it might be that a high degree of collinearity results in the non-significance of the
coefficient of our variable of interest. In other words, part of the explanation of market
access could be absorbed by the additional control variables in our study. Recognizing
this possibility, we should stress that the argument could just as easily be reversed,
thereby supporting our hypothesis that the favorable result reported in support of the
NEG arguments in López-Rodríguez et al. (2007) might (at least partly) be due to their
omission of a proxy both for sectoral composition and for spatial effects. In an effort to
shed more light on this question, we compared the values for the Akaike and the
Schwartz Information Criteria (AIC and SIC respectively) as statistical measures that
can help in selecting the most appropriate specification. These two measures are

� 16
included in the bottom panel of Tables 1, 3, and 4. In each case, the values are lower for
the specifications including controls for sectoral composition and spatial effects, lending
support to our claim that any inference of the effect of market access on human capital
should be based on an expanded model including these two elements.
5. Conclusion
The hypothesis presented in this paper is that any inferences made regarding the impact
of market access on the regional distribution of human capital in earlier studies are
likely to be non-robust, because they are based on a somewhat simple specification that
fails to account for both regional differences in sectoral composition and the spatial
dependence in the distribution of human capital.
Our results for the Spanish provinces confirm that if we include the sectoral
composition of employment and control for spatial dependence, then the impact of
market access falls sharply, to the point that it actually disappears and becomes
statistically insignificant. Indeed, it can even be concluded that spatial effects and
differences in the demand for human capital across sectors play a much more prominent
role than the traditional measure used to proxy for market accessibility in each region.
In this regard, our conclusion is in line with that reported in Fingleton (2006 and 2011),
who claims that there are alternative (or at least complementary) plausible theories to
those defended by NEG for explaining local wage variations. This conclusion is also
consistent with the smaller role played by NEG elements at the regional level than at the
countrywide scale, as suggested by results reported in Brakman et al. (2009). Thus, it is
our belief that additional elements need to be combined with those in the NEG model so
that we might obtain empirical specifications that provide a robust inference of the real
impact of market access on regional differences in human capital endowments. In this
regard, the consideration of regional spillovers within the theoretical framework
outlined in section 3 and the derivation of its empirical counterpart are high on our
research agenda.
The use of a more direct test of the connection between regional differences in the
incentives to invest in human capital and market access, based on returns to education

� 17
rather than on endowment, is also required. This would appear to be a more appropriate
way of testing the implications of the wage equation in the NEG model (equation 6 in
section 3), where the estimated return on education in each region would capture the
skill wage premium.

� 18
References
Anselin L. (1993) Exploratory data analysis and geographic information systems, Research Paper # 9329, Regional Research Institute, West Virginia University.
Barro R. and Sala-i-Martin X. (2004) Economic Growth, The MIT Press, Cambridge, MA.
Brakman S., Garretsen H., and Van Marrewijk C. (2009) Economic geography within and between European Nations: the role of market potential and density across space and time, Journal of Regional Science 49: 777-800.
Breinlich H. (2006) The spatial income structure in the European Union – what role for economic geography?, Journal of Economic Geography 6: 593-617.
Bronzini R. and Piselli P. (2009) Determinants of long-run regional productivity with geographical spillovers: The role of R&D, human capital and public infrastructure, Regional Science and Urban Economics 39, 187-99.
Cuadrado J.R., Garcia-Greciano B. and Raymond J.L. (1999) Regional convergence in productivity and productive structure: The Spanish case, International Regional Science Review 22: 35-53.
De la Fuente A. (2002) On the sources of convergence: A close look at the Spanish regions, European Economic Review, 46: 569-99.
Di Liberto A. (2008) Education and Italian regional development, Economics of Education Review 27: 94-107.
Fingleton B. (2006) The new economic geography versus urban economics: an evaluation using local wage rates in Great Britain, Oxford Economic Papers 58: 501-30.
Fingleton B. (2011) The empirical performance of the NEG with reference to small areas, Journal of Economic Geography 11: 267-79.
Fingleton B. and López-Bazo E. (2006) Empirical growth models with spatial effects, Papers in Regional Science 85: 177-98.
Fujita M., Krugman P., Venables A.J. (1999) The Spatial Economy, The MIT Press, Cambridge, MA.
Harris C. (1954) The market as a factor in the localization of industry in the United States, Annals of the Association of American Geographers 64: 315-48.
Head K. and Mayer T. (2006) Regional wage and employment responses to market potential in the EU, Regional Science and Urban Economics 36: 573-94.
Krugman P. (1991) Increasing returns and economic geography, Journal of Political Economy 99: 483-499.
Kosfeld R. and Eckey H.F. (2008) Market access, regional price level and wage disparities: The German case, MAGKS Joint Discussion Paper Series in Economics #14-2008.
Lucas R.E. (1988) On the mechanics of economic development, Journal of Monetary Economics 22: 3-42.
López-Bazo E. and Moreno R. (2008) Does human capital stimulate investment in physical capital?: Evidence from a cost system framework, Economic Modelling 25: 1295-305.

� 19
López-Rodríguez J. (2007) Is market potential robust in explaining regional educational levels in Europe?, Applied Economics Letters 14: 489-92.
López-Rodríguez J., Faiña A. and López-Rodríguez J.L. (2007) Human capital accumulation and geography: Empirical evidence from the European Union, Regional Studies 41: 217-34.
López-Rodriguez J., Márquez M.A. and Faiña A. (2008) Economic geography and spatial wage structure in Spain, REAL Discussion Papers 08-T-4, Urbana, IL.
Mulligan C. and Sala-i-Martin X. (2000) Measuring aggregate human capital, Journal of Economic Growth 5: 215-52.
Niebuhr A. (2006) Market access and regional disparities, Annals of Regional Science 40: 313-34.
Redding S. and Schott P. (2003) Distance, skill deepening and development: Will peripheral countries ever get rich?, Journal of Development Economics 72: 515–541.
Redding S. and Venables A.J. (2004) Economic geography and international inequality, Journal of International Economics 62: 53–82.
Rodríguez-Pose A. and Vilalta-Bufí M. (2005) Education, migration, and job satisfaction: The regional returns of human capital in the EU, Journal of Economic Geography 5: 545-66.
Romer P. (1990) Endogenous technological change, Journal of Political Economy 98: 71-102.
Serrano L. and Soler A. (2008) Metodología para la estimación de las series de capital humano, 1964-2007, Instituto Valenciano de Investigaciones Económicas – Fundación Bancaja, Valencia, Spain.
�
�
�������������������������������������������������������������1 Given their characteristics, we chose not to include the three provinces of the Canary and Balearic
Islands and the two cities of North Africa (Ceuta and Melilla). This decision was related to the construction of the market access measure and not to those of human capital.�
2 Available at http://www.ivie.es/downloads/caphum/2007/metodologia.pdf�
3 A panel data set could be used for the variables under analysis; however, we preferred cross-sectional results to facilitate comparison with published results. On the other hand, similar qualitative results were obtained when estimating the relationship in equation (2) using data for a number of other years. These results are available from the authors upon request.�
4 The theoretical model in Redding and Schott (2003) includes both market and supply access, although their empirical application only considers the impact of market access, given that it is considerably more cumbersome to measure supply access, and because of the likelihood of a high correlation between both measures. The same approach is adopted elsewhere in the literature. �
5 See also Redding and Venables (2004) for full details of the model’s essential elements.�

� 20
�����������������������������������������������������������������������������������������������������������������������������������������������������������������������������������6 The zero profit condition for agriculture is given by , whereas that for
manufacturing is as shown in equation (5). �7 A fall in MA and in SA with the initial equilibrium market prices results in a decrease in the size of the
manufacturing sector and, thus, in an excess of skilled labour. Hence, the nominal skilled wage is lower and the nominal unskilled wage is higher in the new equilibrium.�
8 Given that technology transfers are closely connected to the institutional environment and the endowment of social capital, these two factors are also assumed to influence people’s willingness to invest in human capital (Redding and Venables, 2004). �
9 Employment data for each sector in each province are drawn from the National Regional Accounts produced by the Spanish National Institute for Statistics (INE).�
10 We chose to estimate�both spatial specifications rather than selecting just one of the two. In line with Fingleton and López-Bazo (2006), we believe that selecting the spatial specification based on the results of the LM and the robust LM tests of spatial dependence can produce misleading results for the selection of the appropriate specification including spatial effects. Moreover, modeling the source of the spatial dependence in the human capital-market access specification lies beyond the scope of this paper, and needs to be addressed separately.�
11 The results in this section were obtained using a weight matrix based on the inverse distance. Similar qualitative results (not reported here for reasons of space, but available from the authors upon request) were obtained when using the contiguity weight matrix.�

Table 1. Results of the estimation of the baseline model – Human capital and market access.
Per Capita Value of Human Capital
Average Years of Schooling
1995 2007 1995 2007 Market Access
0.091*** (0.027)
0.060*** (0.027)
0.102*** (0.026)
0.049*** (0.023)
Breusch Pagan Test 0.774 [0.38]
0.119 [0.73]
0.076 [0.78]
0.039 (0.843)
Residuals Moran´s I 0.233*** [0.00]
0.316*** [0.00]
0.205*** [0.00]
0.188*** [0.00]
LM-ERR 12.099*** [0.00]
22.129*** [0.00]
9.333*** [0.00]
7.856*** [0.00]
LM-LAG 12.543*** [0.00]
20.674*** [0.00]
12.236*** [0.00]
6.571** [0.01]
Robust LM-ERR 0.327 [0.56]
1.461 [0.23]
0.025 [0.87]
1.576 [0.21]
Robust LM-LAG 0.771 [0.380]
0.006 [0.938]
2.930** [0.08]
0.292 [0.59]
lnL 71.408 70.611 72.896 77.790 AIC -138.82 -137.22 -141.79 -151.58 SC -135.12 -133.52 -138.09 -147.88 Obs. 47 47 47 47 Notes: *, **, *** represent significance at 10%, 5% and 1% respectively.
Standard errors for coefficient estimates in ( ). P-values for the statistics in [ ].

Table 2. Results of the global spatial autocorrelation test (Moran’s I) for human
capital and market access.
Inverse Distance2
1st Order Contiguity
Per Capita Value of Human Capital, 1995 0.218*** (0.060)
0.418*** (0.094)
Per Capita Value of Human Capital, 2007 0.316*** (0.059)
0.401*** (0.096)
Average Years of Schooling, 1995 0.312*** (0.059)
0.431*** (0.094)
Average Years of Schooling, 2007 0.183*** (0.059)
0.229*** (0.094)
Market Access (GVA), 1995 0.299*** (0.059)
0.413*** (0.093)
Market Access (GVA), 2007 0.306*** (0.058)
0.422*** (0.093)
Notes: *, **, *** represent significance at 10%, 5% and 1% respectively. Standard errors in ( ).

Table 3. Results of the estimation of the model including controls for the sectoral composition
Per Capita Value of Human Capital
Average Years of Schooling
1995 2007 1995 2007
Market Access
0.074** (0.032)
0.031 (0.024)
0.045* (0.025)
0.012 (0.019)
Manufacturing Empl (%) 0.013 (0.025)
0.043 (0.026)
0.055*** (0.020)
0.081*** (0.021)
Service Empl (%) 0.172** (0.074)
0.210** (0.089)
0.268*** (0.059)
0.303*** (0.071)
Construction Empl (%) -0.034 (0.042)
-0.112** (0.046)
-0.042 (0.033)
-0.021 (0.036)
Energy Empl (%)
0.017 (0.010)
0.018 (0.011)
0.013 (0.008)
0.007 (0.008)
Breusch Pagan Test 3.675 [0.59]
12.194 [0.04]
6.137 [0.29]
3.215 [0.66]
Residuals Moran´s I 0.285*** [0.00]
0.318*** [0.00]
0.163*** [0.00]
0.215*** [0.00]
LM-ERR 18.171*** [0.00]
22.526*** [0.00]
5.931** [0.01]
10.330*** [0.00]
LM-LAG 16.901*** [0.00]
24.883*** [0.00]
10.700*** [0.00]
7.137*** [0.00]
Robust LM-ERR 1.953 [0.16]
1.207 [0.27]
0.008 [0.93]
3.214** [0.07]
Robust LM-LAG 0.683 [0.41]
3.564 [0.06]*
4.777** [0.03]
0.021 [0.88]
lnL 75.920 81.996 86.597 92.848 AIC -139.84 -151.99 -161.19 -173.69 SC -128.74 -140.89 -150.09 -162.59 Obs. 47 47 47 47
Notes: *, **, *** represent significance at 10%, 5% and 1% respectively. Standard errors for coefficient estimates in ( ). P-values for the statistics in [ ].

Tab
le 4
. Res
ults
of t
he e
stim
atio
n of
the
mod
el in
clud
ing
cont
rols
for
the
sect
oral
com
posi
tion
and
spat
ial d
epen
denc
e.
Pe
r C
apita
Val
ue
of H
uman
Cap
ital
Ave
rage
Yea
rs
of S
choo
ling
Per
Cap
ita V
alue
of
Hum
an C
apita
l A
vera
ge Y
ears
of
Sch
oolin
g
19
95
2007
19
95
2007
19
95
2007
19
95
2007
M
arke
t Acc
ess
0.
059*
* (0
.024
) 0.
028
(0.0
17)
0.03
3 (0
.020
) 0.
013
(0.0
16)
0.05
2**
(0.0
25)
0.02
3 (0
.020
) 0.
025
(0.0
22)
0.01
6 (0
.018
) M
anuf
actu
ring
Em
pl (%
) -0
.001
(0
.019
) 0.
028
(0.0
19)
0.03
2**
(0.0
17)
0.07
2***
(0
.018
) -0
.001
(0
.019
) 0.
033*
(0
.019
) 0.
024
(0.0
16)
0.07
5***
(0
.017
) Se
rvic
e E
mpl
(%)
0.18
4***
(0
.058
) 0.
258*
**
(0.0
64)
0.25
7***
(0
.050
) 0.
330*
**
(0.0
61)
0.27
6***
(0
.061
) 0.
327*
**
(0.0
61)
0.34
1***
(0
.053
) 0.
383*
**
(0.0
57)
Con
stru
ctio
n E
mpl
(%)
-0.0
36
(0.0
32)
-0.0
94**
* (0
.033
) -0
.044
(0
.027
) -0
.012
(0
.031
) -0
.018
(0
.029
) -0
.076
***
(0.0
27)
-0.0
33
(0.0
25)
-0.0
03
(0.0
26)
Ene
rgy
Em
pl (%
)
0.01
7**
(0.0
08)
0.01
6**
(0.0
08)
0.01
3**
(0.0
07)
0.00
7 (0
.007
) 0.
014*
(0
.007
) 0.
018*
* (0
.007
) 0.
009
(0.0
06)
0.00
8 (0
.006
) ρ
0.76
7***
(0
.127
) 0.
796*
**
(0.1
12)
0.62
5***
(0
.151
) 0.
536*
**
(0.1
82)
- -
- -
λ -
- -
- 0.
899*
**
(0.0
67)
0.92
6***
(0
.050
) 0.
883*
**
(0.0
76)
0.81
4***
(0
.114
) B
reus
ch P
agan
Tes
t 4.
184
[0.5
2]
7.15
1 [0
.21]
3.
259
[0.6
5]
1.97
5 [0
.85]
2.
906
[0.7
1]
7.20
4 [0
.21]
3.
351
[0.6
4]
3.68
7 [0
.60]
L
M R
esid
ual/L
ag S
patia
l Dep
3.
500*
[0
.06]
1.
214
[0.2
7]
0.39
0 [0
.53]
3.
065*
[0
.07]
0.
432
[0.5
1]
0.12
4 [0
.72]
0.
255
[0.6
1]
0.40
9 [0
.52]
ln
L
83.1
19
91.9
37
91.7
31
95.9
44
85.7
15
94.4
26
92.7
91
98.6
37
AIC
-1
52.2
3 -1
69.8
7 -1
69.4
6 -1
77.8
8 -1
59.4
3 -1
76.8
5 -1
73.5
8 -1
85.2
7 SC
-1
39.2
8 -1
56.9
2 -1
56.5
1 -1
64.9
3 -1
48.3
3 -1
65.7
5 -1
62.4
8 -1
74.1
7 O
bs.
47
47
47
47
47
47
47
47
Not
es: *
, **,
***
rep
rese
nt s
igni
fican
ce a
t 10
%, 5
% a
nd 1
% r
espe
ctiv
ely.
Sta
ndar
d er
rors
for
coe
ffici
ent
estim
ates
in
( ).
P-va
lues
for
the
st
atis
tics i
n [ ]

Table 5. Results of the tests for the joint significance of the sectoral and spatial coefficients.
Per Capita Value of Human Capital
Average Years of Schooling
1995 2007 1995 2007 Sectoral Composition 9.024*
[0.06] 22.770***
[0.00] 27.402***
[0.00] 30.116***
[0.00] Sectoral Comp & Spatial Eff–SAR
23.422*** [0.00]
42.652*** [0.00]
37.670*** [0.00]
36.308*** [0.00]
Spatial Effects–SAR 14.398*** [0.00]
19.882*** [0.00]
10.268*** [0.00]
6.192*** [0.00]
Sectoral Comp & Spatial Eff–ERR
28.614*** [0.00]
47.630*** [0.00]
39.790*** [0.00]
41.694*** [0.00]
Spatial Effects–EER 19.590*** [0.00]
24.860*** [0.00]
12.388*** [0.00]
11.578*** [0.00]
Notes: Values of the Likelihood Ratio test for the significance of the sectoral composition variables and/or the spatial effects. *, **, *** represent significance at 10%, 5% and 1% respectively. P-values for the statistics in [ ].
Figure 1. Spatial distribution of human capital in Spain.
Per capita value of human capital – 1995 Average years of schooling – 1995
Per capita value of human capital – 2007
Average years of schooling – 2007
Note: The per capita value of human capital is measure in number of equivalent unskilled workers. Source: IVIE

Figure 2. Spatial distribution of market access in Spain.
ln(Market access) - 1995 ln(Market access) - 2007
Source: INE and authors’ calculations.

Figure 3. Relationship between human capital and market access in the Spanish provinces.
Market access and pc value of human capital – 1995 Market access and average years of schooling – 1995
Market access and pc value of human capital – 2007
Market access and average years of schooling – 2007
��
Source: INE, IVIE, and authors’ calculations.

Figure 4. Spatial distribution of the sectoral composition in Spain (% over total employment).
Manufacturing employment – 1995 Service employment – 1995
Manufacturing employment – 2007
Service employment – 2007
Source: INE

Figure 5. Moran Scatterplot for human capital in Spain.
pc value of human capital – 1995 pc value of human capital – 2007
Average years of schooling – 1995
Average years of schooling – 2007

Figure 6. Moran Scatterplot for market access in Spain.
1995 2007
�

Institut de Recerca en Economia Aplicada Regional i Pública Document de Treball 2011/02 pàg. 33 Research Institute of Applied Economics Working Paper 2011/02 pag .33
Llista Document de Treball List Working Paper
WP 2011/02 “The Spatial Distribution of Human Capital: Can It Really Be Explained by Regional Differences in Market Access?” Karahasan, B.C. and López-Bazo, E
WP 2011/01 “I If you want me to stay, pay” . Claeys, P and Martire, F WP 2010/16 “Infrastructure and nation building: The regulation and financing of network transportation
infrastructures in Spain (1720-2010)”Bel,G WP 2010/15 “Fiscal policy and economic stability: does PIGS stand for Procyclicality In Government Spending?”
Maravalle, A ; Claeys, P. WP 2010/14 “Economic and social convergence in Colombia” Royuela, V; Adolfo García, G.WP 2010/13 “ Symmetric or asymmetric gasoline prices? A meta-analysis approach” Perdiguero, J.WP 2010/12 “ Ownership, Incentives and Hospitals” Fageda,X and Fiz, E.WP 2010/11 “Prediction of the economic cost of individual long-term care in the Spanish population” Bolancé, C
; Alemany, R ; and Guillén MWP 2010/10 “On the Dynamics of Exports and FDI: The Spanish Internationalization Process” Martínez-Martín
J.WP 2010/09 “Urban transport governance reform in Barcelona” Albalate, D ; Bel, G and Calzada, J.
WP 2010/08 “Cómo (no) adaptar una asignatura al EEES: Lecciones desde la experiencia comparada en España” Florido C. ; Jiménez JL. and Perdiguero J.
WP 2010/07 “Price rivalry in airline markets: A study of a successful strategy of a network carrier against a low-cost carrier” Fageda, X ; Jiménez J.L. ; Perdiguero , J.
WP 2010/06 “La reforma de la contratación en el mercado de trabajo: entre la flexibilidad y la seguridad” Royuela V. and Manuel Sanchis M.
WP 2010/05 “Discrete distributions when modeling the disability severity score of motor victims” Boucher, J and Santolino, M
WP 2010/04 “Does privatization spur regulation? Evidence from the regulatory reform of European airports . Bel, G. and Fageda, X.”
WP 2010/03 “High-Speed Rail: Lessons for Policy Makers from Experiences Abroad”. Albalate, D ; and Bel, G.”
WP 2010/02 “Speed limit laws in America: Economics, politics and geography”. Albalate, D ; and Bel, G.”
WP 2010/01 “Research Networks and Inventors’ Mobility as Drivers of Innovation: Evidence from Europe” Miguélez, E. ; Moreno, R. ”
WP 2009/26 ”Social Preferences and Transport Policy: The case of US speed limits” Albalate, D.
WP 2009/25 ”Human Capital Spillovers Productivity and Regional Convergence in Spain” , Ramos, R ; Artis, M. ; Suriñach, J.
WP 2009/24 “Human Capital and Regional Wage Gaps” ,López-Bazo,E. Motellón E.
WP 2009/23 “Is Private Production of Public Services Cheaper than Public Production? A meta-regression analysis of solid waste and water services” Bel, G.; Fageda, X.; Warner. M.E.
WP 2009/22 “Institutional Determinants of Military Spending” Bel, G., Elias-Moreno, F.
WP 2009/21 “Fiscal Regime Shifts in Portugal” Afonso, A., Claeys, P., Sousa, R.M.
WP 2009/20 “Health care utilization among immigrants and native-born populations in 11 European countries. Results from the Survey of Health, Ageing and Retirement in Europe” Solé-Auró, A., Guillén, M., Crimmins, E.M.
WP 2009/19 “La efectividad de las políticas activas de mercado de trabajo para luchar contra el paro. La experiencia de Cataluña” Ramos, R., Suriñach, J., Artís, M.
WP 2009/18 “Is the Wage Curve Formal or Informal? Evidence for Colombia” Ramos, R., Duque, J.C., Suriñach, J.

Institut de Recerca en Economia Aplicada Regional i Pública Document de Treball 2011/02 pàg. 34 Research Institute of Applied Economics Working Paper 2011/02 pag. 34
WP 2009/17 “General Equilibrium Long-Run Determinants for Spanish FDI: A Spatial Panel Data Approach” Martínez-Martín, J.
WP 2009/16 “Scientists on the move: tracing scientists’ mobility and its spatial distribution” Miguélez, E.; Moreno, R.; Suriñach, J.
WP 2009/15 “The First Privatization Policy in a Democracy: Selling State-Owned Enterprises in 1948-1950 Puerto Rico” Bel, G.
WP 2009/14 “Appropriate IPRs, Human Capital Composition and Economic Growth” Manca, F.
WP 2009/13 “Human Capital Composition and Economic Growth at a Regional Level” Manca, F.
WP 2009/12 “Technology Catching-up and the Role of Institutions” Manca, F.
WP 2009/11 “A missing spatial link in institutional quality” Claeys, P.; Manca, F.
WP 2009/10 “Tourism and Exports as a means of Growth” Cortés-Jiménez, I.; Pulina, M.; Riera i Prunera, C.; Artís, M.
WP 2009/09 “Evidence on the role of ownership structure on firms' innovative performance” Ortega-Argilés, R.; Moreno, R.
WP 2009/08 “¿Por qué se privatizan servicios en los municipios (pequeños)? Evidencia empírica sobre residuos sólidos y agua” Bel, G.; Fageda, X.; Mur, M.
WP 2009/07 “Empirical analysis of solid management waste costs: Some evidence from Galicia, Spain” Bel, G.; Fageda, X.
WP 2009/06 “Intercontinental fligths from European Airports: Towards hub concentration or not?” Bel, G.; Fageda, X.
WP 2009/05 “Factors explaining urban transport systems in large European cities: A cross-sectional approach” Albalate, D.; Bel, G.
WP 2009/04 “Regional economic growth and human capital: the role of overeducation” Ramos, R.; Suriñach, J.; Artís, M.
WP 2009/03 “Regional heterogeneity in wage distributions. Evidence from Spain” Motellón, E.; López-Bazo, E.; El-Attar, M.
WP 2009/02 “Modelling the disability severity score in motor insurance claims: an application to the Spanish case” Santolino, M.; Boucher, J.P.
WP 2009/01 “Quality in work and aggregate productivity” Royuela, V.; Suriñach, J.
WP 2008/16 “Intermunicipal cooperation and privatization of solid waste services among small municipalities in Spain” Bel, G.; Mur, M.
WP 2008/15 “Similar problems, different solutions: Comparing refuse collection in the Netherlands and Spain” Bel, G.; Dijkgraaf, E.; Fageda, X.; Gradus, R.
WP 2008/14 “Determinants of the decision to appeal against motor bodily injury settlements awarded by Spanish trial courts” Santolino, M
WP 2008/13 “Does social capital reinforce technological inputs in the creation of knowledge? Evidence from the Spanish regions” Miguélez, E.; Moreno, R.; Artís, M.
WP 2008/12 “Testing the FTPL across government tiers” Claeys, P.; Ramos, R.; Suriñach, J.
WP 2008/11 “Internet Banking in Europe: a comparative analysis” Arnaboldi, F.; Claeys, P.
WP 2008/10 “Fiscal policy and interest rates: the role of financial and economic integration” Claeys, P.; Moreno, R.; Suriñach, J.
WP 2008/09 “Health of Immigrants in European countries” Solé-Auró, A.; M.Crimmins, E.

Institut de Recerca en Economia Aplicada Regional i Pública Document de Treball 2011/02 pàg. 35 Research Institute of Applied Economics Working Paper 2011/02 pag. 35
WP 2008/08 “The Role of Firm Size in Training Provision Decisions: evidence from Spain” Castany, L.
WP 2008/07 “Forecasting the maximum compensation offer in the automobile BI claims negotiation process” Ayuso, M.; Santolino, M.
WP 2008/06 “Prediction of individual automobile RBNS claim reserves in the context of Solvency II” Ayuso, M.; Santolino, M.
WP 2008/05 “Panel Data Stochastic Convergence Analysis of the Mexican Regions” Carrion-i-Silvestre, J.L.; German-Soto, V.
WP 2008/04 “Local privatization, intermunicipal cooperation, transaction costs and political interests: Evidence from Spain” Bel, G.; Fageda, X.
WP 2008/03 “Choosing hybrid organizations for local services delivery: An empirical analysis of partial privatization” Bel, G.; Fageda, X.
WP 2008/02 “Motorways, tolls and road safety. Evidence from European Panel Data” Albalate, D.; Bel, G.
WP 2008/01 “Shaping urban traffic patterns through congestion charging: What factors drive success or failure?” Albalate, D.; Bel, G.
WP 2007/19 “La distribución regional de la temporalidad en España. Análisis de sus determinantes” Motellón, E.
WP 2007/18 “Regional returns to physical capital: are they conditioned by educational attainment?” López-Bazo, E.; Moreno, R.
WP 2007/17 “Does human capital stimulate investment in physical capital? evidence from a cost system framework” López-Bazo, E.; Moreno, R.
WP 2007/16 “Do innovation and human capital explain the productivity gap between small and large firms?” Castany, L.; López-Bazo, E.; Moreno, R.
WP 2007/15 “Estimating the effects of fiscal policy under the budget constraint” Claeys, P.
WP 2007/14 “Fiscal sustainability across government tiers: an assessment of soft budget constraints” Claeys, P.; Ramos, R.; Suriñach, J.
WP 2007/13 “The institutional vs. the academic definition of the quality of work life. What is the focus of the European Commission?” Royuela, V.; López-Tamayo, J.; Suriñach, J.
WP 2007/12 “Cambios en la distribución salarial en españa, 1995-2002. Efectos a través del tipo de contrato” Motellón, E.; López-Bazo, E.; El-Attar, M.
WP 2007/11 “EU-15 sovereign governments’ cost of borrowing after seven years of monetary union” Gómez-Puig, M..
WP 2007/10 “Another Look at the Null of Stationary Real Exchange Rates: Panel Data with Structural Breaks and Cross-section Dependence” Syed A. Basher; Carrion-i-Silvestre, J.L.
WP 2007/09 “Multicointegration, polynomial cointegration and I(2) cointegration with structural breaks. An application to the sustainability of the US external deficit” Berenguer-Rico, V.; Carrion-i-Silvestre, J.L.
WP 2007/08 “Has concentration evolved similarly in manufacturing and services? A sensitivity analysis” Ruiz-Valenzuela, J.; Moreno-Serrano, R.; Vaya-Valcarce, E.
WP 2007/07 “Defining housing market areas using commuting and migration algorithms. Catalonia (Spain) as an applied case study” Royuela, C.; Vargas, M.
WP 2007/06 “Regulating Concessions of Toll Motorways, An Empirical Study on Fixed vs. Variable Term Contracts” Albalate, D.; Bel, G.
WP 2007/05 “Decomposing differences in total factor productivity across firm size” Castany, L.; Lopez-Bazo, E.; Moreno, R.

Institut de Recerca en Economia Aplicada Regional i Pública Document de Treball 2011/02 pàg. 36 Research Institute of Applied Economics Working Paper 2011/02 pag. 36
WP 2007/04 “Privatization and Regulation of Toll Motorways in Europe” Albalate, D.; Bel, G.; Fageda, X.
WP 2007/03 “Is the influence of quality of life on urban growth non-stationary in space? A case study of Barcelona” Royuela, V.; Moreno, R.; Vayá, E.
WP 2007/02 “Sustainability of EU fiscal policies. A panel test” Claeys, P.
WP 2007/01 “Research networks and scientific production in Economics: The recent spanish experience” Duque, J.C.; Ramos, R.; Royuela, V.
WP 2006/10 “Term structure of interest rate. European financial integration” Fontanals-Albiol, H.; Ruiz-Dotras, E.; Bolancé-Losilla, C.
WP 2006/09 “Patrones de publicación internacional (ssci) de los autores afiliados a universidades españolas, en el ámbito económico-empresarial (1994-2004)” Suriñach, J.; Duque, J.C.; Royuela, V.
WP 2006/08 “Supervised regionalization methods: A survey” Duque, J.C.; Ramos, R.; Suriñach, J.
WP 2006/07 “Against the mainstream: nazi privatization in 1930s germany” Bel, G.
WP 2006/06 “Economía Urbana y Calidad de Vida. Una revisión del estado del conocimiento en España” Royuela, V.; Lambiri, D.; Biagi, B.
WP 2006/05 “Calculation of the variance in surveys of the economic climate” Alcañiz, M.; Costa, A.; Guillén, M.; Luna, C.; Rovira, C.
WP 2006/04 “Time-varying effects when analysing customer lifetime duration: application to the insurance market” Guillen, M.; Nielsen, J.P.; Scheike, T.; Perez-Marin, A.M.
WP 2006/03 “Lowering blood alcohol content levels to save lives the european experience” Albalate, D.
WP 2006/02 “An analysis of the determinants in economics and business publications by spanish universities between 1994 and 2004” Ramos, R.; Royuela, V.; Suriñach, J.
WP 2006/01 “Job losses, outsourcing and relocation: empirical evidence using microdata” Artís, M.; Ramos, R.; Suriñach, J.

Institut de Recerca en Economia Aplicada Regional i Pública Document de Treball 2011/02 pàg. 37 Research Institute of Applied Economics Working Paper 2011/02 pag. 37